supporting information - royal society of chemistry · supporting information 1. general procedure...
TRANSCRIPT
1
Supporting Information
1. General procedure for the conjugation of porphyrins to amino-functionalised
substrates. .................................................................................................................... 2
2. Spectra .......................................................................................................................... 4
3. Structures of the porphyrins and nanoconjugates..................................................... 16
4. Absorption and emission spectra of porphyrins and nanoconjugates ...................... 17
5. O2 calibrations in time-resolved domain .................................................................... 18
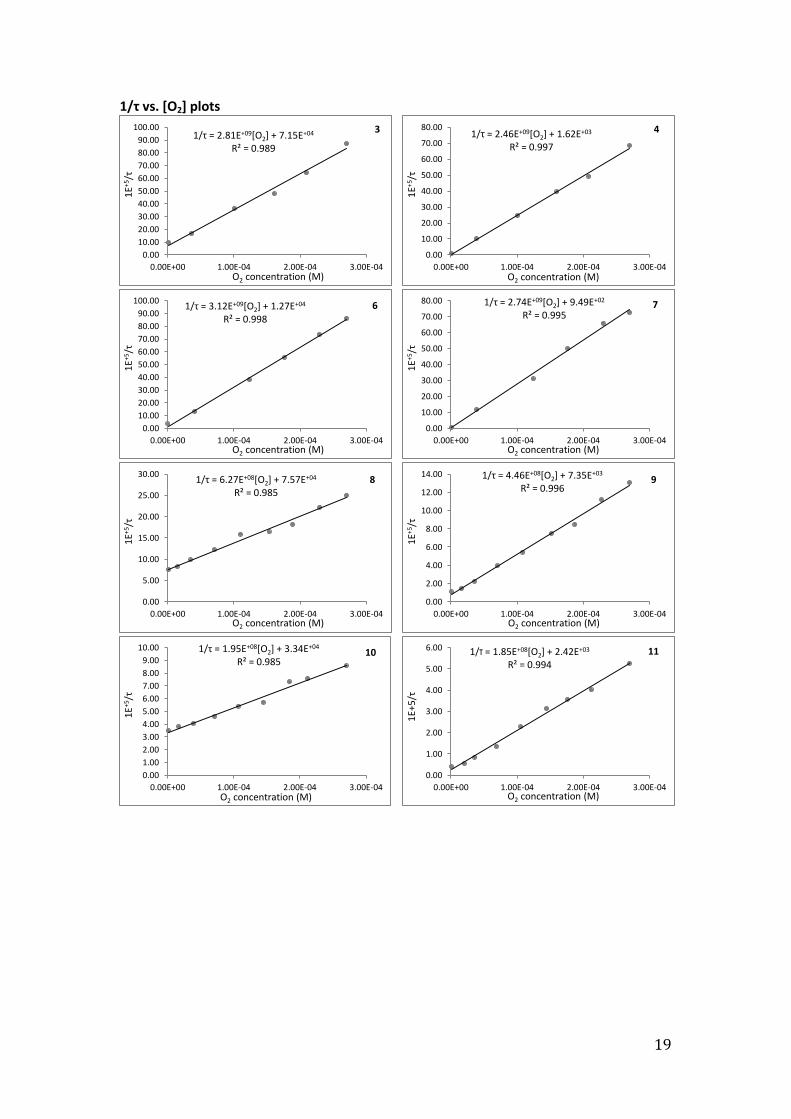
6. 1/τ vs. [O2] plots ......................................................................................................... 19
7. Lifetime and intensity Stern-Volmer plots ................................................................. 21
8. Spectrum of the diode lamp used for the photostability experiments...................... 22
Electronic Supplementary Material (ESI) for Photochemical & Photobiological Sciences.This journal is © The Royal Society of Chemistry and Owner Societies 2014
2
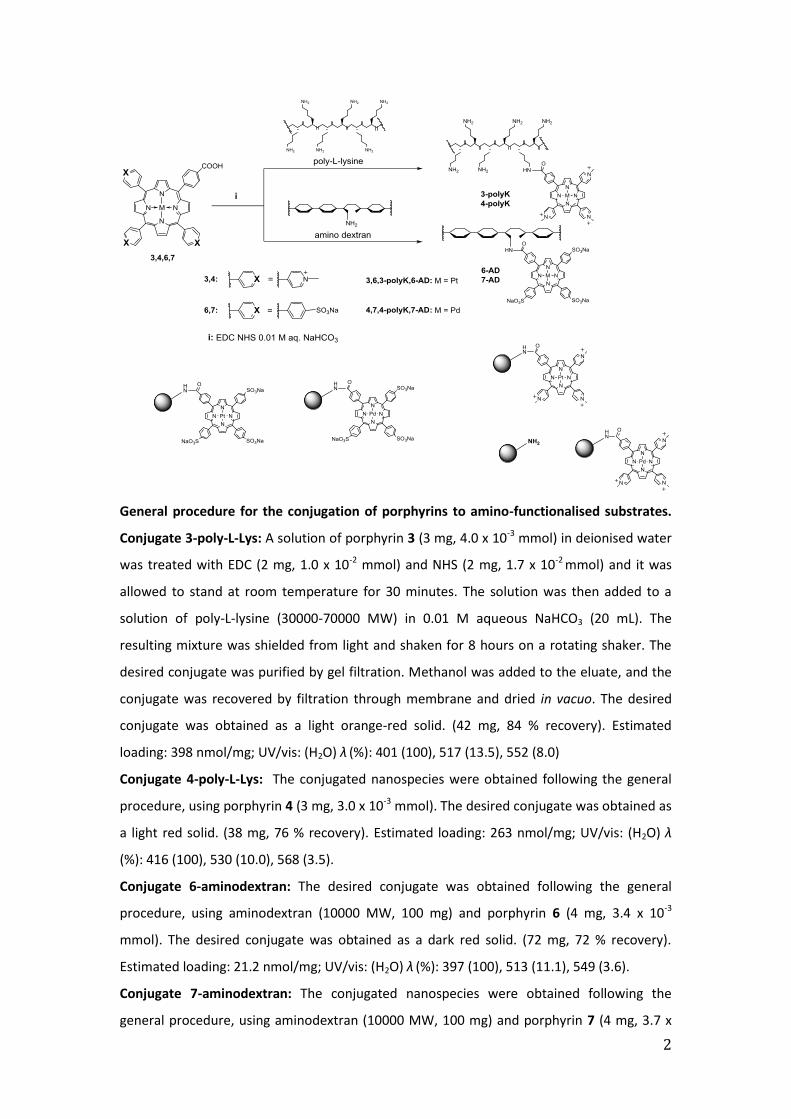
General procedure for the conjugation of porphyrins to amino-functionalised substrates.
Conjugate 3-poly-L-Lys: A solution of porphyrin 3 (3 mg, 4.0 x 10⁻³ mmol) in deionised water
was treated with EDC (2 mg, 1.0 x 10⁻² mmol) and NHS (2 mg, 1.7 x 10⁻² mmol) and it was
allowed to stand at room temperature for 30 minutes. The solution was then added to a
solution of poly-L-lysine (30000-70000 MW) in 0.01 M aqueous NaHCO3 (20 mL). The
resulting mixture was shielded from light and shaken for 8 hours on a rotating shaker. The
desired conjugate was purified by gel filtration. Methanol was added to the eluate, and the
conjugate was recovered by filtration through membrane and dried in vacuo. The desired
conjugate was obtained as a light orange-red solid. (42 mg, 84 % recovery). Estimated
loading: 398 nmol/mg; UV/vis: (H2O) λ (%): 401 (100), 517 (13.5), 552 (8.0)
Conjugate 4-poly-L-Lys: The conjugated nanospecies were obtained following the general
procedure, using porphyrin 4 (3 mg, 3.0 x 10⁻³ mmol). The desired conjugate was obtained as
a light red solid. (38 mg, 76 % recovery). Estimated loading: 263 nmol/mg; UV/vis: (H2O) λ
(%): 416 (100), 530 (10.0), 568 (3.5).
Conjugate 6-aminodextran: The desired conjugate was obtained following the general
procedure, using aminodextran (10000 MW, 100 mg) and porphyrin 6 (4 mg, 3.4 x 10⁻³
mmol). The desired conjugate was obtained as a dark red solid. (72 mg, 72 % recovery).
Estimated loading: 21.2 nmol/mg; UV/vis: (H2O) λ (%): 397 (100), 513 (11.1), 549 (3.6).
Conjugate 7-aminodextran: The conjugated nanospecies were obtained following the
general procedure, using aminodextran (10000 MW, 100 mg) and porphyrin 7 (4 mg, 3.7 x

3
10-3 mmol). The desired conjugate was obtained as a brownish red solid. (81 mg, 81 %
recovery). Estimated loading: 17.8 nmol/mg; UV/vis: (H2O) λ (%): 408 (100), 527 (10), 561
(1.3).

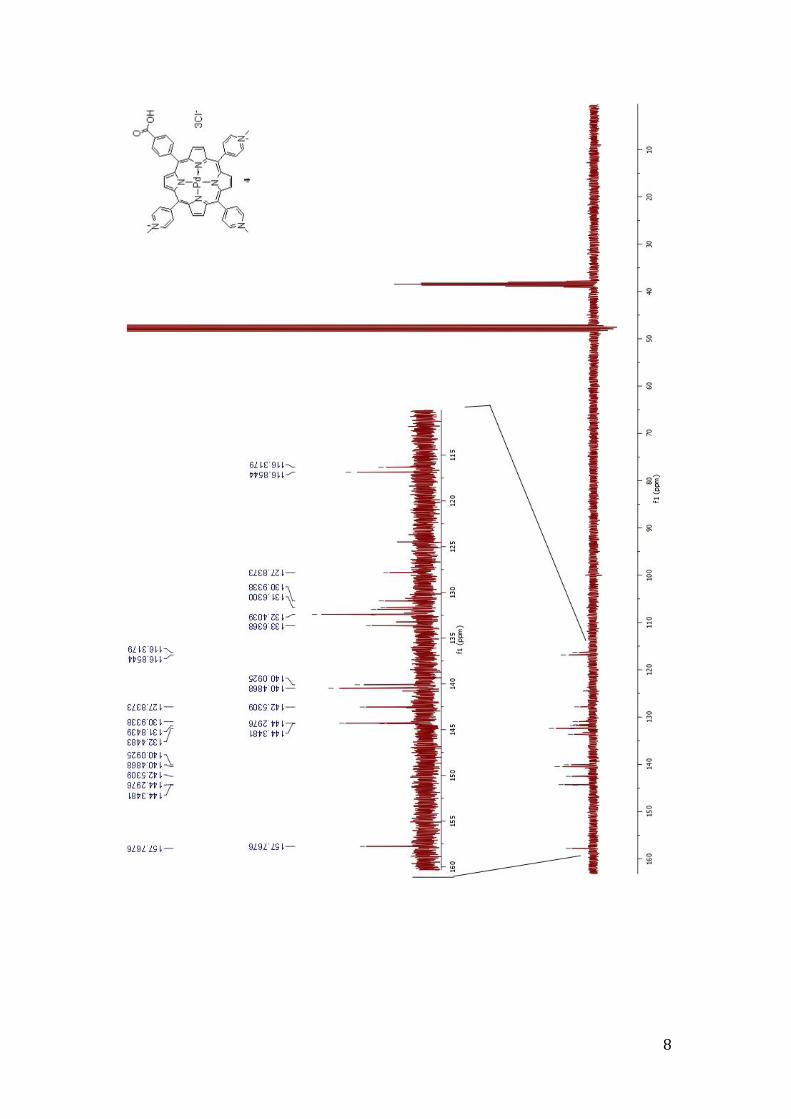
4
Spectra
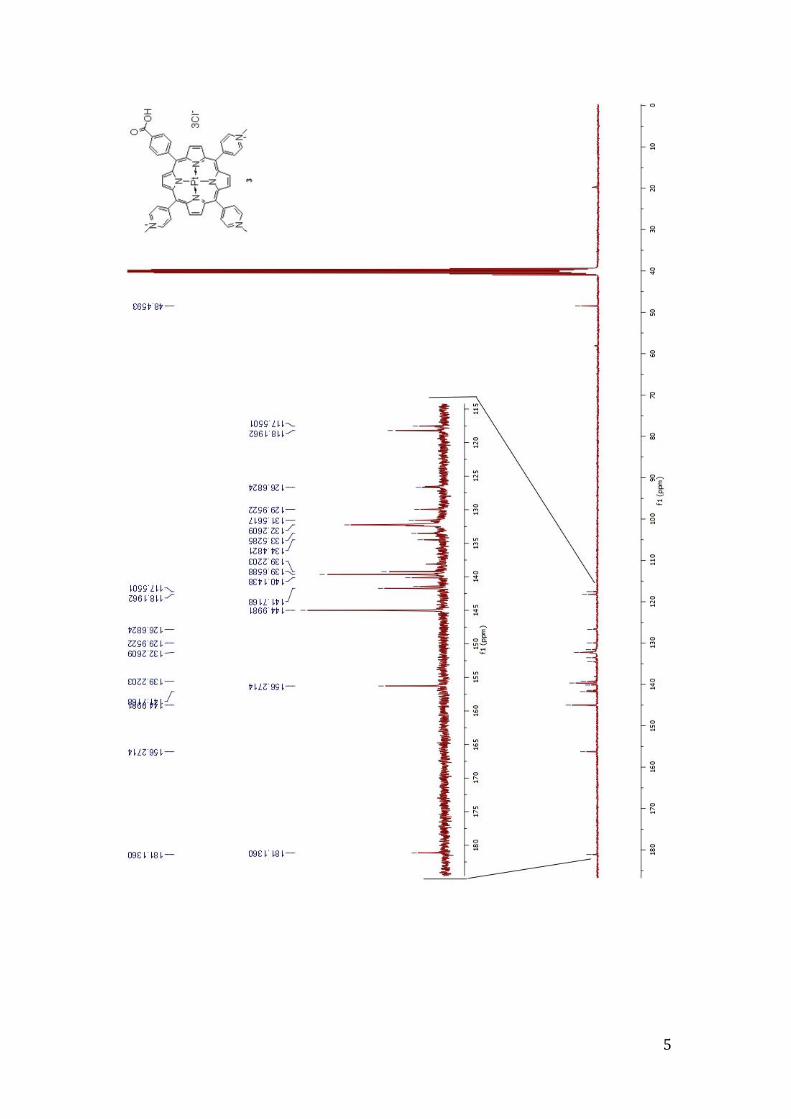
5

6

7
8
9

10
11
12
13

14
15

16
Structures of the porphyrins and nanoconjugates
Porphyrins Nanoconjugates
3
8
4
9
6
10
7
11
amino-functionalised polyacrylamide nanoparticle
17
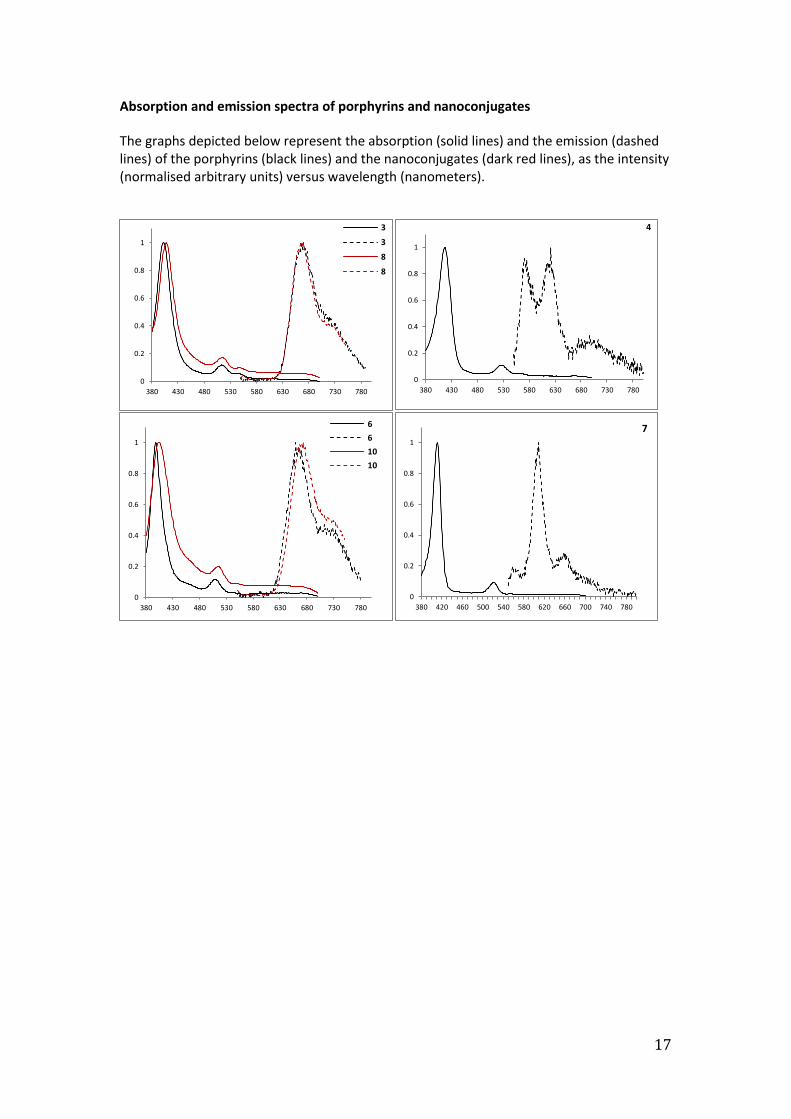
Absorption and emission spectra of porphyrins and nanoconjugates
The graphs depicted below represent the absorption (solid lines) and the emission (dashed lines) of the porphyrins (black lines) and the nanoconjugates (dark red lines), as the intensity (normalised arbitrary units) versus wavelength (nanometers).
0
0.2
0.4
0.6
0.8
1
380 430 480 530 580 630 680 730 780
3
3
8
8
0
0.2
0.4
0.6
0.8
1
380 430 480 530 580 630 680 730 780
4
0
0.2
0.4
0.6
0.8
1
380 430 480 530 580 630 680 730 780
6
6
10
10
0
0.2
0.4
0.6
0.8
1
380 420 460 500 540 580 620 660 700 740 780
7

18
O2 calibrations in time-resolved domain
The samples were held in a four-sided quartz cuvette equipped with a degassing bulb.
Prior to measurements the sample was completely degassed by a series of freeze-pump-thaw cycles.
Once degassed the concentration of oxygen in the sample cell was adjusted by back-
filling the cell with a known pressure of air, and according to Henry’s Law, [O2] pair.
Phosphorescence lifetime and intensity measurements (in correspondence of the emission λmax) were performed at six oxygen concentrations within the 0 - 0.27 M range.
Phosphorescence lifetimes were recorded using a time-correlated photon counting spectrometer. The samples were excited using the output of a pulsed nitrogen laser (VSL-337i OEM), which provided a 10Hz pulse train of pulse duration < 5 ns at 337 nm, with a pulse energy of ca. 5 μJ. Emission was collected at 90° to the excitation source and the emission wavelength was selected using a monochromator (Bentham TM300) and the selected light detected using a red-sensitive photon counting photomultiplier module (Hamamatsu H10682-1). The arrival times of multiple photons were recorded from each laser shot using a multi-channel scaler, and the data from a minimum of 10,000 laser shots was acquired to furnish the emission decay.
Example of calibration: porphyrin 3
M = measurement point pair = air pressure in the sample cell (in mmHg) pO2 = oxygen pressure in sample cell (in mmHg) [O2] = molar concentration of oxygen in the sample cell Iem = intensity of phosphorescence measured at the emission λmax (670 nm for 3) τ = triplet lifetime (in seconds) a: pO mmHg pair mmHg x 0. 1 b:
[O ] pO mmHg
( 0 mmHg atm 1)x( 5 atm
1)
0.21: molar fraction of oxygen in air 760 mmHg atm
-1: conversion factor from Torr to atm
757 atmM-1: Henry’s law constant for oxygen in water at 5 °C
The values (1/τ) or (1/I) were plotted against the oxygen concentration. The kq values were obtained from the corresponding linear regression equations 1/τ kq[O2] + 1/τ0) or (1/I = kq[O2] + 1/I0).
M pair (mmHg) pO2 (mmHg)a [O2] (M)
b Iem 1/Iem τ (s) 1 / τ
1 1.94 0.41 6.89x10-07
1.00 1.00 1.03 x10-05
9.71 x10+05
2 102.99 21.63 3.66 x10-05
0.49 2.03 6.04 x10-06
1.66 x10+05
3 283.09 59.45 1.01 x10-04
0.24 4.14 2.74 x10-06
3.65 x10+05
4 452.99 95.13 1.61 x10-04
0.17 5.85 2.09 x10-06
4.78 x10+05
5 588.90 123.67 2.09 x10-04
0.15 6.63 1.56 x10-06
6.41 x10+05
6 760.00 159.60 2.70 x10-04
0.10 9.65 1.15 x10-06
8.70 x10+05
19
1/τ vs. [O2] plots
1/τ = 2.81E+09[O2] + 7.15E+04 R² = 0.989
0.00
10.00
20.00
30.00
40.00
50.00
60.00
70.00
80.00
90.00
100.00
0.00E+00 1.00E-04 2.00E-04 3.00E-04
1E+
5/τ
O2 concentration (M)
1/τ = 2.46E+09[O2] + 1.62E+03 R² = 0.997
0.00
10.00
20.00
30.00
40.00
50.00
60.00
70.00
80.00
0.00E+00 1.00E-04 2.00E-04 3.00E-04
1E+
5/τ
O2 concentration (M)
1/τ = 3.12E+09[O2] + 1.27E+04 R² = 0.998
0.00
10.00
20.00
30.00
40.00
50.00
60.00
70.00
80.00
90.00
100.00
0.00E+00 1.00E-04 2.00E-04 3.00E-04
1E+5
/τ
O2 concentration (M)
1/τ = 2.74E+09[O2] + 9.49E+02 R² = 0.995
0.00
10.00
20.00
30.00
40.00
50.00
60.00
70.00
80.00
0.00E+00 1.00E-04 2.00E-04 3.00E-04
1E+5
/τ
O2 concentration (M)
1/τ = 6.27E+08[O2] + 7.57E+04 R² = 0.985
0.00
5.00
10.00
15.00
20.00
25.00
30.00
0.00E+00 1.00E-04 2.00E-04 3.00E-04
1E+
5 /τ
O2 concentration (M)
1/τ = 4.46E+08[O2] + 7.35E+03 R² = 0.996
0.00
2.00
4.00
6.00
8.00
10.00
12.00
14.00
0.00E+00 1.00E-04 2.00E-04 3.00E-04
1E+
5 /τ
O2 concentration (M)
1/τ = 1.95E+08[O2] + 3.34E+04 R² = 0.985
0.00
1.00
2.00
3.00
4.00
5.00
6.00
7.00
8.00
9.00
10.00
0.00E+00 1.00E-04 2.00E-04 3.00E-04
1E+5
/τ
O2 concentration (M)
1/τ = 1.85E+08[O2] + 2.42E+03 R² = 0.994
0.00
1.00
2.00
3.00
4.00
5.00
6.00
0.00E+00 1.00E-04 2.00E-04 3.00E-04
1E+
5/τ
O2 concentration (M)
3 4
6 7
8 9
10 11

20
1/I vs. [O2] plots
y = 3.06E+04x + 9.17E-01 R² = 9.86E-01
0.00
2.00
4.00
6.00
8.00
10.00
12.00
0.00E+00 1.00E-04 2.00E-04 3.00E-04
1/I
O2 concentration (M)
y = 2.78E+05x - 3.75E-01 R² = 9.97E-01
0.00
10.00
20.00
30.00
40.00
50.00
60.00
70.00
80.00
0.00E+00 1.00E-04 2.00E-04 3.00E-04
1/I
O2 concentration (M)
y = 8.15E+04x - 1.33E+00 R² = 9.36E-01
0.00
5.00
10.00
15.00
20.00
25.00
0.00E+00 1.00E-04 2.00E-04 3.00E-04
1/I
O2 concentration (M)
y = 5.26E+05x + 4.33E+00 R² = 9.92E-01
0.00
20.00
40.00
60.00
80.00
100.00
120.00
140.00
160.00
0.00E+00 1.00E-04 2.00E-04 3.00E-04
1/I
O2 concentration (M)
y = 8.31E+03x + 1.06E+00 R² = 9.91E-01
0.00
0.50
1.00
1.50
2.00
2.50
3.00
3.50
4.00
0.00E+00 1.00E-04 2.00E-04 3.00E-04
1/I
O2 concentration (M)
y = 5.25E+04x + 9.85E-01 R² = 9.89E-01
0.00
0.00
0.00
0.00
0.00
0.00
0.00
0.00
0.00
0.00E+00 1.00E-04 2.00E-04 3.00E-04
1/I
O2 concentration (M)
y = 7.66E+03x + 9.52E-01 R² = 9.95E-01
0.00
0.50
1.00
1.50
2.00
2.50
3.00
3.50
0.00E+00 1.00E-04 2.00E-04 3.00E-04
1/I
O2 concentration (M)
y = 5.43E+04x + 5.49E-01 R² = 9.95E-01
0.00
0.00
0.00
0.00
0.00
0.00
0.00
0.00
0.00
0.00
0.00E+00 1.00E-04 2.00E-04 3.00E-04
1/I
O2 concentration (M)
3 4
6 7
8 9
10 11
21
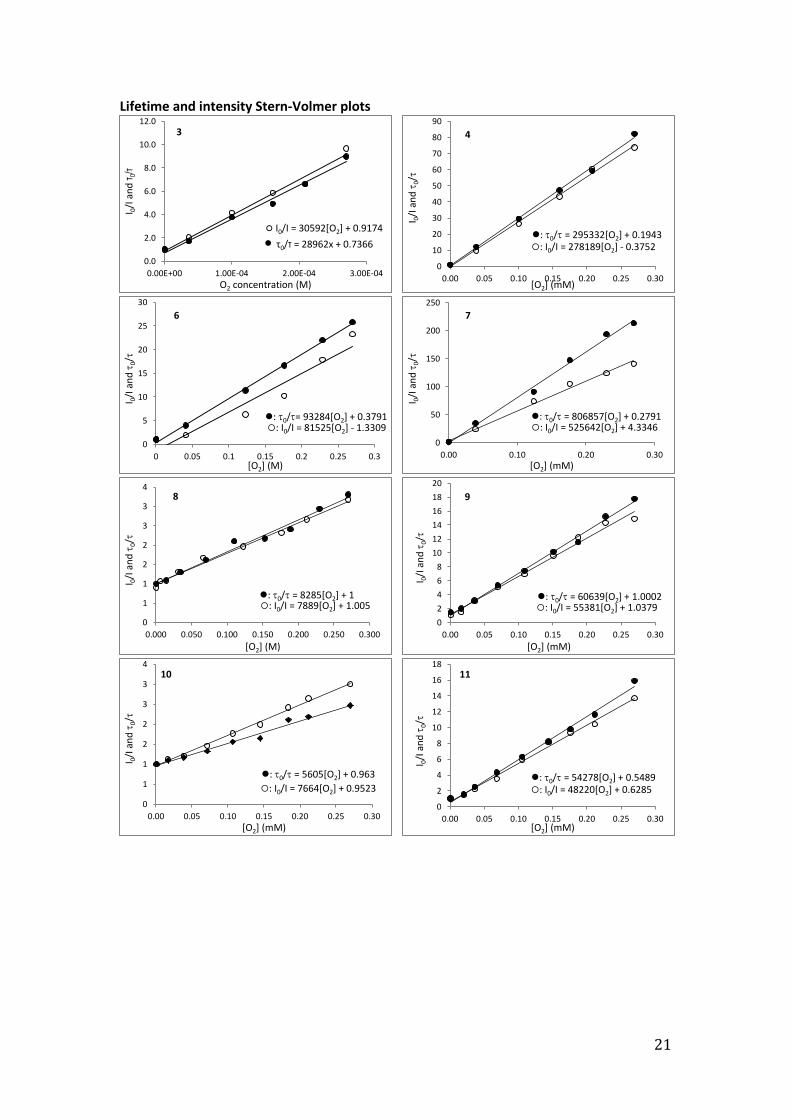
Lifetime and intensity Stern-Volmer plots
○ I0/I = 30592[O2] + 0.9174
τ0/τ = 28962x + 0.7366
0.0
2.0
4.0
6.0
8.0
10.0
12.0
0.00E+00 1.00E-04 2.00E-04 3.00E-04
I 0/I
an
d τ
0/τ
O2 concentration (M)
3
: I0/I = 278189[O2] - 0.3752 : 0/ = 295332[O2] + 0.1943
0
10
20
30
40
50
60
70
80
90
0.00 0.05 0.10 0.15 0.20 0.25 0.30
I 0/I
an
d
0/
[O2] (mM)
4
: I0/I = 81525[O2] - 1.3309 : 0/= 93284[O2] + 0.3791
0
5
10
15
20
25
30
0 0.05 0.1 0.15 0.2 0.25 0.3
I 0/I
an
d
0/
[O2] (M)
6
: I0/I = 525642[O2] + 4.3346 : 0/ = 806857[O2] + 0.2791
0
50
100
150
200
250
0.00 0.10 0.20 0.30
I 0/I
an
d
0/
[O2] (mM)
7
: I0/I = 7889[O2] + 1.005 : 0/ = 8285[O2] + 1
0
1
1
2
2
3
3
4
0.000 0.050 0.100 0.150 0.200 0.250 0.300
I 0/I
an
d
0/
[O2] (M)
8
: I0/I = 55381[O2] + 1.0379 : 0/ = 60639[O2] + 1.0002
0
2
4
6
8
10
12
14
16
18
20
0.00 0.05 0.10 0.15 0.20 0.25 0.30
I 0/I
an
d
0/
[O2] (mM)
9
: I0/I = 7664[O2] + 0.9523
: 0/ = 5605[O2] + 0.963
0
1
1
2
2
3
3
4
0.00 0.05 0.10 0.15 0.20 0.25 0.30
I 0/I
an
d
0/
[O2] (mM)
10
: 0/ = 54278[O2] + 0.5489 : I0/I = 48220[O2] + 0.6285
0
2
4
6
8
10
12
14
16
18
0.00 0.05 0.10 0.15 0.20 0.25 0.30
I 0/I
an
d
0/
[O2] (mM)
11

22
Spectrum of the diode lamp used for the photostability experiments
Wavelength (nm)