lanthanide functionalised gold nanoparticles as mri...
TRANSCRIPT

Lanthanide Functionalised Gold Nanoparticles as MRI
Contrast Agents
Muhammad Farooq Warsi
A thesis submitted for the degree of Doctor of Philosophy
The University of York
Department of Chemistry
September 2010

To,
My whole family
i
Abstract
The aim of this Ph.D project was to synthesize and characterise nanoparticle-based
MRI contrast agents. In the first instance, the DTPA (diethylenetriaminepentaacetic
acid) based ligand was designed, synthesized and characterised. This ligand was
utilised for stabilisation of gold nanoparticles. The gold nanoparticles protected by
DTPA based ligand were characterised using UV-Vis, NMR spectroscopies, TGA
and TEM. The nanoparticles were then loaded with gadolinium. The relaxivity of
gadolinium loaded gold nanoparticles were studied using inversion recovery method
and compared with commercially available MRI contrast agents (i.e. Gd-DTPA).
The Gd-loaded AuNPs showed only a moderate increase in their relaxivity as
compared to the Gd-DTPA complex.
The factors limiting the relaxivity of Gd-loaded AuNPs were explored using EPR
spectroscopy. For EPR measurements, Gd3+ was replaced with vanadyl (VO2+)
which gives EPR spectra sensitive to the rate of molecular tumbling on nanosecond
time scale. The EPR measurements of VO2+-loaded AuNPs showed that the
nanoparticle attached metal ion retains high molecular mobility. This is likely
responsible for only a moderate increase in relaxivity. We next explored different
strategies for increasing the relaxivity of gold nanoparticles based MRI contrast
agents. In the first strategy, in order to enhance ligand packing at AuNPs surface, the
size of the AuNPs was increased from ~2.0 nm to ~6.0 nm. The relaxivity was found
to increase with the increased size of the AuNPs. Secondly, polyelectrolyte coating
of charged Gd-loaded AuNPs surface also resulted in increase of relaxivity due to
better immobilisation of the Gd3+ ions.
Gold nanoparticles were also used as templates for nitroxide based redox sensitive
MRI contrast agents. The reducing behaviour and relaxivity of nitroxide protected
AuNPs was measured and found slightly better than that of free nitroxide.
Finally other useful applications of nanoparticles protected by DTPA based ligand
were explored. For example, the DTPA ligand can also chelate strongly with other

ii
lanthanides such as Eu3+, Tb3+etc. The luminescence measurements of lanthanides
(Eu3+ and Tb3+) loaded onto AuNPs were explored. Lanthanide-loaded AuNPs were
also used as model compounds to test an important EPR methodology after labelling
with a nitroxide based spin label.
iii
Declaration
This research thesis is my original work (carried out at Chemistry Department, The
University of York, Nov. 2006 to Sep. 2010) except where specific references have
been made. I have not submitted this work neither as a part nor as a whole for a
degree or diploma or other qualification at any other university.
Muhammad Farooq Warsi

iv
Acknowledgements
Firstly, I would like to thank my supervisor Dr. Victor Chechik for his continuous
and affectionate support in lab work as well as during writing up this thesis. I would
like to thank post doctorate fellows in our group (Dr. Marco Conte, Dr. Brendan
Garret, Dr. Xuetong Zhang and Dr. Jamie Gould) for useful suggestions and
assistance in the lab work. I would like to thank Dr. Ralph Adams (Prof. S. B.
Duckett group) for helping with imaging experiments and relaxation measurements.
For technical support and help I would like to thank Dr. Phil Helliwill (for general
lab assistance), Dr. Paul Elliott (for TGA analysis) and Miss Heather Fish (for NMR
analysis). We also thank Prof. Gunnar Jeschke, Dr. Maxim Yulikov and Ms. Petra
Lueders from ETH Zurich (Switzerland) for pulsed EPR measurements.
I would like to thank past (Ricarrdo Grazelli, Eleanor Hurst and Leonie Jones) and
present members (James Wallace, Kazim Raza, Thomas Newby and Ma Yun) of
research group. My friends (Muddassar Iqbal, Andy Reader, Muhammad Suleman,
Alan Burns etc) and staff members (David Lindsey, David Williams, Jason Lynam
etc) of the chemistry department with whom I used to play cricket during my stay in
York are also thanked. At the end my special thanks will go for my whole family,
my uncle Iqbal Javed (Manger Punjab Oil Mills Islamabad-Pakistan) for moral and
financial support throughout my educational career.
Higher Education Commission of Pakistan (HEC-Pak) and The University of York
(Wild Fund) are thanked for financial support.
v
Abbreviations
aq Aqueous
AuNPs Gold nanoparticles
Ar Aromatic
BTT Biotin terminated thiol
Calcd Calculated
CAs Contrast agents
Da Dalton
d Doublet
DTPA Diethylenetriamine pentaacetic acid
DCC Dicyclohexyl carbodimide
DMAP 4-N,N-Dimethylaminopyridine
DMF Dimethylformamide
DMSO Dimethylsulfoxide
DCM Dichloromethane
EPR Electron paramagnetic resonance
ESI Electron spray ionization
Eq Equation
g Gram
GPC Gel permeation chromatography
h Hour
ICP Inductively Coupled Plasma (Spectrometry)
HR-MS High Resolution Mass Spectrometry
Ln Lanthanide
kDa Kilo Dalton
MRI Magnetic resonance imaging
Mn Number average molecular mass
MW Molecular weight
MWCO Molecular weight cut off
MS Mass spectrometry
m/z Charge to mass ratio

vi
mL Millilitre
mg Milligram
min Minute
NMR Nuclear magnetic resonance
NMV Net magnetization vector
NBS N-bromosuccinimide
nm Nanometre
o/n Overnight
Obsd Observed
ppm Parts per million
R1 Spin lattice relaxivity
RF Radio frequency
RMM Relative molecular mass
s singlet , seconds
SPB Surface Plasmon Band
T1 Spin lattice relaxation time
T2 Spin spin relaxation time
TEM Transmission electron microscopy
TEMPO 2,2,6,6-tetramethyl-1-piperidinyloxyl
TFA Trifluroacetic acid
TGA Thermogravimetric analysis
THF Tetrahydrofuran
TR Time of repetition
TE Echo time
t triplet
UV-Vis. Ultraviolet visible
vii
Table of Contents
Abstract ........................................................................................................................ i
Declaration ................................................................................................................ iii
Acknowledgements .................................................................................................... iv
Abbreviations ............................................................................................................. v
Chapter 1: Introduction ............................................................................................ 1
1.1 Magnetic resonance imaging (MRI) ................................................................ 2
1.1.1 Principles of MRI ..................................................................................... 2
1.1.2 Basic theory of NMR (creating magnetic resonance signal) ................... 3
1.1.3 Spin-lattice relaxation .............................................................................. 7
1.1.4 Spin-spin relaxation ................................................................................. 8
1.1.5 Experimental determination of spin-lattice relaxation time (T1) ........... 10
1.1.5.1 Inversion-recovery sequence for determination of T1 .................... 11
1.1.6 How to get spatial information (for image formation in MRI)? ............ 12
1.1.6.1 Slice selection................................................................................. 13
1.1.6.2 Frequency encoding or readout process ......................................... 14
1.1.6.3 Phase encoding ............................................................................... 15
1.1.6.4 k-Space ........................................................................................... 16
1.1.7 Pulse sequences ...................................................................................... 16
1.1.7.1 Spin echo sequences ....................................................................... 17
1.2 Image contrast in MRI ................................................................................... 18
1.2.1 Contrast mechanism in MRI .................................................................. 18
1.2.1.1 T1 Weighted contrast ...................................................................... 18
1.2.1.2 T2 Weighted contrast ..................................................................... 20
1.2.1.3 Proton density images .................................................................... 23
1.2.1.4 Chemical shift imaging .................................................................. 24
viii
1.3 Contrast agents (CAs) in MRI ........................................................................ 24
1.4 Relaxivity of contrast agents (i.e. Metal Complexes) ..................................... 25
1.5 Gadolinium based contrast agents ................................................................. 27
1.6 Iron oxide based contrast agents ................................................................... 31
1.7 Factors affecting the relaxivity of Gd-based contrast agents ........................ 32
1.7.1 Number of coordinated water molecules (q) .......................................... 32
1.7.2 Metal-H distance (r) ............................................................................... 33
1.7.3 Rotational correlation time (τR) ............................................................. 34
1.7.4 Water exchange (or residence life time of water molecule τM) ............. 36
1.8 Recent advances / developments in MRI contrast agents .............................. 37
1.8.1 Liposome based MRI contrast agents .................................................... 38
1.8.2 Ensomes ................................................................................................. 38
1.8.3 Memsomes ............................................................................................. 39
1.8.4 Micellar MRI contrast agents ................................................................. 41
1.8.5 Dendritic MRI contrast agents ............................................................... 43
1.8.6 Zeolite based contrast agents ................................................................. 46
1.8.7 Mesoporous silica based contrast agents................................................ 48
1.8.8 Metal nanoparticles based contrast agents in MRI ................................ 50
1.8.9 Gold nanoparticle based MRI contrast agents ....................................... 50
1.8.9.1 Gold nanoparticles protected by multilayered Gd-chelates ........... 51
1.8.9.2 Multifunctional (or target specific) gold nanoparticle based MRI
contrast agents .................................................................................... 54
1.9 Aim of the project ........................................................................................... 57
1.10 References .................................................................................................. 59
ix
Chapter 2: Synthesis and relaxivity measurements of Gd-loaded gold
nanoparticles ............................................................................................................. 66
2.1 Introduction .................................................................................................... 67
2.2 Synthesis of DTPA based ligand 6 ................................................................. 69
2.2.1 Synthesis of t-butyl ester protected DTPA analogue 3 .......................... 71
2.2.2 Deprotection of DTPA analogue 3 ......................................................... 71
2.2.3 Coupling of t-butyl ester protected DTPA analogue 4 with dithiobutyric
acid ......................................................................................................... 72
2.2.4 Deprotection of t-butyl ester groups of DTPA based ligand 5 ............... 72
2.3 Synthesis of water soluble AuNPs protected by DTPA based ligand 6.......... 74
2.3.1 UV-Vis spectrum of AuNPs protected by DTPA ligand 6 .................... 76
2.3.2 1H NMR spectrum of AuNPs ................................................................. 77
2.3.3 TEM analysis of AuNPs ........................................................................ 78
2.3.4 Thermogravimetric analysis (TGA) of AuNPs ...................................... 79
2.4 Complexation of gadolinium (Gd3+) with DTPA ligand 6 at AuNP surface .. 80
2.4.1 Determination of [Gd3+] using xylenol orange titration ......................... 81
2.4.2 In situ monitoring of Gd3+ loading on AuNPs by UV-Vis titration using
xylenol orange as indicator .................................................................... 83
2.4.3 Characterisation of Gd-loaded AuNPs by ICP....................................... 84
2.4.4 Composition of Gd-loaded AuNPs ........................................................ 85
2.4.5 Spin lattice relaxivity (R1) of Gd-loaded AuNPs, Gd-DTPA and GdCl3 ..
................................................................................................................ 86
2.4.6 T1-weighted images of Gd-loaded AuNPs and Gd-DTPA .................... 90
2.4.7 Attaching a recognition vector to Gd-loaded AuNPs ............................ 90
2.4.7.1 Synthesis of biotin-terminated thiol (BTT) .................................... 91
2.4.7.2 Attachment of BTT to Gd-loaded AuNPs ...................................... 92
2.4.7.3 Molecular recognition of BTT-labelled-Gd-loaded AuNPs .......... 93
2.5 Conclusions .................................................................................................... 94
2.6 References ...................................................................................................... 96

x
Chapter 3: Strategies for increasing relaxivity of Gd-loaded gold nanoparticles ..
............................................................................................................................ 99
3.1 Introduction .................................................................................................. 100
3.1.1 An introduction to EPR ........................................................................ 101
3.1.1.1 Principles of EPR ......................................................................... 102
3.1.1.2 The anisotropic g-tensor ............................................................... 104
3.1.1.3 Hyperfine interactions .................................................................. 104
3.1.1.4 Mechanism of the hyperfine interactions ..................................... 106
3.2 Vanadyl complexation with DTPA and DTPA based ligand@AuNPs ......... 109
3.2.1 Determination of principal values of “g” and “A” tensors for free VO2+
and VO2+-DTPA@AuNPs ................................................................... 111
3.2.2 Determination of rotational correlational time from room temperature
EPR measurements............................................................................... 114
3.3 Conclusions of EPR results .......................................................................... 116
3.4 Growth of AuNPs ......................................................................................... 117
3.4.1 Characterisation of grown AuNPs ....................................................... 121
3.4.1.1 Transmission electron microscopy (TEM) analysis ..................... 121
3.4.1.2 Thermogravimetric analysis (TGA) of grown AuNPs ................. 122
3.4.1.3 ICP and AAS analysis of Gd-loaded large AuNPs ...................... 123
3.4.2 Composition of grown AuNPs ............................................................. 124
3.4.3 Rotational correlational time (τc) of ligand in large (4.0 and 6.0 nm)
AuNPs .................................................................................................. 124
3.4.4 Relaxivity measurements of large AuNPs ........................................... 125
3.5 Polyelectrolyte self assembly around nanoparticles .................................... 126
3.5.1 Poly (ethyleneimine) (PEI) coating on Gd-loaded AuNPs .................. 128
3.5.2 Stability of polyelectrolyte coated Gd-loaded AuNPs ......................... 129
3.5.3 Relaxivity of PEI-protected-Gd-loaded AuNPs ................................... 131
3.5.4 PAMAM dendrimer layers around AuNPs and their relaxivity ........... 131
3.5.5 Layer by layer assembly of polyelectrolytes around
Gd-loaded AuNPs ................................................................................ 134
xi
3.6 Conclusions .................................................................................................. 138
3.7 References .................................................................................................... 139
Chapter 4: Gold nanoparticles protected by nitroxide based ligand as redox
sensitive MRI contrast agents ............................................................................... 142
4.1 Introduction .................................................................................................. 143
4.1.1 Nitroxide based contrast agents ........................................................... 144
4.2 Synthesis of triphenyl phosphine (PPh3) protected gold nanoparticles
(AuNPs) ........................................................................................................ 147
4.3 Synthesis of gold nanoparticles protected by nitroxide based ligand .......... 148
4.3.1 Characterisation of AuNPs protected by nitroxide based ligand ......... 150
4.3.1.1 UV-Vis spectrum of AuNPs protected by nitroxide based ligand .....
...................................................................................................... 150
4.3.1.2 TEM ............................................................................................. 151
4.3.1.3 TGA of AuNPs protected by nitroxide based ligand ................... 151
4.3.1.4 Elemental analysis of AuNPs protected by nitroxide based ligand ...
...................................................................................................... 152
4.3.2 EPR analysis of AuNPs protected by nitroxide based ligand .............. 153
4.3.3 Quantitative estimation of nitroxide at AuNPs surface by EPR
spectroscopy ......................................................................................... 155
4.3.4 Determination of nitroxide radical concentration ................................ 156
4.3.5 Relaxation measurements..................................................................... 157
4.3.6 Redox behaviour of nitroxide at the surface of AuNPs ....................... 158
4.4 Conclusions .................................................................................................. 162
4.5 References .................................................................................................... 163
xii
Chapter 5: Other applications of Lanthanide-loaded AuNPs ........................... 165
5.1 Introduction .................................................................................................. 166
5.1.1 Luminescence ....................................................................................... 167
5.1.2 Sensitization (antenna effect) ............................................................... 169
5.2 Design and synthesis of tryptophan based ligand 7 ..................................... 171
5.3 UV-Vis absorption and emission spectra of tryptophan ligand 7 ................ 173
5.4 Synthesis of gold nanoparticles stabilised by DTPA based ligand 5 ........... 175
5.4.1 1H NMR characterisation of AuNPs protected by DTPA ligand 5 ...... 176
5.4.2 TGA of AuNPs protected by DTPA ligand 5 ...................................... 178
5.4.3 TEM of AuNPs protected by DTPA ligand 5 ...................................... 178
5.5 Ligand exchange of tryptophan ligand 7 with DTPA ligand 5 at AuNP
surface .......................................................................................................... 179
5.5.1 Deprotection of t-butyl ester groups of DTPA and tryptophan ligand at
AuNPs .................................................................................................. 180
5.5.2 Ln3+ (Tb3+ and Eu3+) loading on tryptophan labelled AuNPs and their
fluorescence emission spectra .............................................................. 180
5.6 Control experiments to confirm the quenching of lanthanide ion fluorescence
by AuNPs ...................................................................................................... 182
5.6.1 Ligand exchange approach (first control experiment) ......................... 182
5.6.2 Second control experiment (decomposition of AuNPs)....................... 184
5.7 Conclusions .................................................................................................. 186
5.8 Distance measurements by EPR spectroscopy ............................................. 187
5.8.1 Synthesis of TEMPO based ligand 8 ................................................... 189
5.8.2 Spin-labelling of AuNPs by TEMPO based ligand 8 .......................... 190
5.8.3 Deprotection of t-butyl ester groups of DTPA ligand at AuNP surface ....
.............................................................................................................. 192
5.8.4 Lanthanide loading on nitroxide spin labelled AuNPs and their cw and
pulsed-EPR measurements ................................................................... 193
5.8.5 Pulsed-EPR experiments ...................................................................... 195
xiii
5.8.5.1 Distance measurements (by DEER experiments) ........................ 195
5.8.5.2 Relaxation enhancement measurements ...................................... 196
5.9 Conclusions .................................................................................................. 198
5.10 References ................................................................................................ 199
Chapter 6: Conclusions and Proposed Future Work ......................................... 202
6.1 General conclusions ..................................................................................... 203
6.2 Proposed future work ................................................................................... 204
6.3 References .................................................................................................... 207
Chapter 7: Experimental ....................................................................................... 208
7.1 Materials and chemicals .............................................................................. 209
7.2 Instrumentation / techniques ........................................................................ 209
7.3 Experimental part for chapter 2 ................................................................... 211
7.3.1 Synthesis of DTPA based ligand 6 ...................................................... 211
7.3.1.1 Alkylation of ethanolamine by t-butyl protected bromoacetate (1) ...
...................................................................................................... 211
7.3.1.2 Bromination of compound 1 ........................................................ 212
7.3.1.3 Alkylation of N-ε-CBZ-L-Lysine t-butyl ester hydrochloride by
bromo derivative 2 ........................................................................... 213
7.3.1.4 Deprotection of DTPA-analogue 3 .............................................. 215
7.3.1.5 Coupling of DTPA-analogue 4 with dithiobutyric acid ............... 216
7.3.1.6 Deprotection of t-butyl ester groups of DTPA based ligand 5 ..... 218
7.3.1.7 Synthesis of AuNPs stabilised by DTPA based ligand 6 ............. 219
7.3.1.8 Complexation of gadolinium (Gd3+) with DTPA@AuNPs .......... 220
7.3.1.9 Synthesis of Gd-DTPA complex .................................................. 221
7.3.2 Synthesis of biotin-terminated thiol (BTT) .......................................... 221
7.3.3 Attachment of biotin-terminated thiol to the AuNP surface ................ 221
7.4 Experimental part for chapter 3 ................................................................... 223

xiv
7.4.1 Vanadyl complexation with DTPA@AuNPs ....................................... 223
7.4.2 Synthesis of VO-DTPA ....................................................................... 224
7.4.3 Growth of AuNPs (~4.0 nm) ................................................................ 224
7.4.4 Growth of AuNPs (~6.0 nm) ................................................................ 225
7.4.5 Formation of PEI layer around Gd-DTPA@AuNPs ............................ 225
7.4.6 Formation of PAMAM-dendrimer layer around Gd-DTPA@AuNPs . 226
7.4.7 Layer by layer assembly of PEI (Mn~1300) and PAA (Mn~1200) ...... 226
7.5 Experimental part for chapter 4 ................................................................... 227
7.5.1 Synthesis of triphenyl phosphine protected AuNPs (PPh3@AuNPs) .. 227
7.5.2 Synthesis of AuNPs protected by nitroxide based ligand .................... 228
7.6 Experimental part of chapter 5 .................................................................... 229
7.6.1 Synthesis of tryptophan based ligand 7 ................................................ 229
7.6.2 Synthesis of AuNPs stabilised by DTPA ligand 5 ............................... 230
7.6.3 Ligand exchange of tryptophan based ligand 7 with AuNPs ............... 231
7.6.4 Deprotection of t-butyl ester groups of DTPA based ligand 5 and
tryptophan ligand 7 at AuNP surface ................................................... 232
7.6.5 Lanthanide (Tb3+ and Eu3+) loading on AuNPs ................................... 232
7.6.6 Synthesis of Ln3+-DTPA Chelates ....................................................... 233
7.6.7 Ligand exchange of Tb-DTPA chelates@AuNPs with 3-
mercaptopropionic acid ........................................................................ 233
7.6.8 Treatment of tryptophan labelled Tb-loaded AuNPs with KI and I2 ... 234
7.6.9 Synthesis of TEMPO based ligand 8 (TEMPO based spin label) ........ 234
7.6.10 Labelling of AuNPs by TEMPO based spin label 8 ........................ 236
7.6.11 Deprotection of t-butyl ester groups of DTPA ligand 5 at AuNP
surface .............................................................................................. 237
7.6.12 Lanthanide-loading on (ligand 8) spin labelled AuNPs protected by
DTPA ligand .................................................................................... 238
7.7 References .................................................................................................... 239

Chapter 1
1
Chapter 1: Introduction

Chapter 1
2
Chapter 1: Introduction
1.1 Magnetic resonance imaging (MRI)
Magnetic resonance imaging (MRI) is a powerful modern diagnostic technique. It is
primarily used to produce anatomical images, but physico-chemical state, flow
diffusion and other tissue parameters can also be determined using MRI images.
MRI can provide excellent soft tissue contrast up to submillimeter resolution,
penetrating deep into the tissues. It is frequently used in modern biomedical
research.1-2 The first MRI image was published in 1973 and the first MRI scan of a
human body was done on July 3, 1977. 3-4 Paul Lauterbur and Peter Mansfield were
awarded a Noble Prize (in 2003) for their major contributions to the invention of
MRI. MRI has many advantages over other diagnostic techniques such as X-ray and
computed tomography (CT) scanning. The X-ray and CT scan both involve the use
of ionizing radiation. MRI, on the other hand, uses a harmless magnetic field and
electromagnetic radiation and is therefore referred to as a non-invasive technique.5
1.1.1 Principles of MRI
MRI relies on the nuclear magnetic resonance (NMR) phenomenon and was
originally termed NMR imaging. The 1H nucleus is magnetic resonance (MR)
active as it contains only one proton and has spin (I) = ½. Most MRI experiments
use the 1H nucleus due to the following reasons:
• It is abundant (>60%) in human body (in the form of water and fat).
• Its solitary proton gives it a large magnetic moment.6
MRI gives the spatial distribution of the intensity of water protons in the specific
volume of the body, while NMR gives information about chemical shifts and
coupling constants.
Chapter 1
3
The signal intensity depends upon the amount of (water) protons and their
relaxation times. The basic NMR theory and the relaxation phenomenon are
therefore discussed in detail in the following sections.
1.1.2 Basic theory of NMR (creating magnetic resonance signal)
According to the quantum mechanical approach, nuclei with spin “I” possess
(quantised) angular momentum P which is further associated with their magnetic
moment (µ) (Eq 1.1 and 1.2).
h)I(IP 1+= , where ħ=h/2π Eq. 1.1
γPµ = Eq. 1.2
In equation (1.2), γ is a proportionality constant (i.e. magnetogyric ratio) for the
given isotope. In the presence of an applied magnetic field (B0), the angular
momentum component parallel (along z-axis) to the B0 is given as:
hmzP = Eq. 1.3
In equation (1.3), “m” is the magnetic quantum number that has values from I, I–
1,…… to “–I”. The number of possible orientations of nuclear angular momentum in
the presence of B0 can be determined from the value of I by the simple formula 2I+1.
For example, in the case of 1H nuclei (I = ½), the nuclear angular momentum will
have two orientations i.e. either parallel (m= +1/2) or antiparallel (m= –1/2) to the
magnetic field. This classical approach which is used to simplify the NMR picture
assumes the magnetic moments of nuclei behave as tiny magnetic bars. In the
absence of B0 tiny magnetic bars are randomly oriented and thus their spins are
averaged out. In the presence of B0, the nuclear spins with relatively higher energy
align antiparallel while those with lower energy align parallel to B0 and the energy
difference (∆E) between these two states is given as:

Chapter 1
4
0
BE hγ=∆ Eq. 1.4
The energy difference is usually very small and therefore the population difference
of nuclei between these two states is also very small. For example the number of
excess nuclei in the lower energy level is 1 in 100000 at 3.0 T and 1 in 30000 at 9.4
T. These extra nuclei in the low energy state add together to give a net bulk
magnetisation along the direction (z-axis) of the applied magnetic field (B0) (Figure
1.1). This net magnetisation is usually represented by a vector called the net
magnetisation vector (NMV).
x y
z
Bo
Precessional motion
Figure 1.1: Schematic representation of bulk magnetisation (i.e. NMV) in the presence
of a magnetic field.
The applied magnetic field imposes a torque on the magnetic moments of nuclei and
therefore they are forced to remain at certain angle to the B0. As a result the
magnetic moments of the nuclei wobble around the axis of B0 with a certain
frequency. This motion (wobbling) is called precessional motion and the frequency
of this motion is called the Larmor frequency (ω) which is given as:
γω0
B= Eq. 1.5

Chapter 1
5
In above equation, ω is the angular frequency. Equation 1.5 can be modified to give
Larmor frequency “ν” (in hertz) as follows:
π
γ
π
ων
2
0
2
B
alprecession== Eq 1.6
When radiofrequency (RF) pulses are applied, the transition of nuclei between low
and high energy levels occurs as the frequency of the magnetic field component of
RF pulses matches the Larmor frequency. The magnetic field (B1) associated with
the RF pulses is in transverse (x-y) plane i.e. B1 is perpendicular to B0.
The visualisation of the processes occurring during an NMR experiment can be aided
by a simplified formalism known as “rotating frame of reference” which is opposite
to the “laboratory (fixed) frame of reference” (which has been used so far) (Figure
1.2). A rotating frame of reference is a non-inertial frame of reference which is
rotating relative to an inertial frame of reference. For simplification B1 is supposed to
be composed of two counter rotating magnetic vectors in x-y plane with the
frequency equal to Larmor frequency (νL). In the rotating frame of reference things
can be simplified further. Out of two parts of B1, one part can be frozen (as in
rotating frame of reference both NMV and B1 are moving) while the other part
(moving opposite to NMV) can be ignored as it is moving with frequency far away
from the Larmor frequency.

Chapter 1
6
Figure 1.2: Schematic representation of the laboratory frame of reference and the
rotating frame of reference.
As the electromagnetic field B1 imposes a torque on the NMV (i.e. Mz as NMV is
parallel to the z-axis) perpendicular to the direction of B1, the NMV moves from z-
axis to the x-y plane (Mxy) (depending upon the amplitude and duration of the pulse
which will be discussed later). When the RF pulses are turned off, two things occur:
(a) the NMV moves back to align along B0 (this phenomenon is called relaxation),
and (b) if a receiver coil is placed in the area of rotating magnetic moments, a
voltage (i.e. magnetic resonance signal) is produced; this voltage is responsible for
the NMR signal. The NMR signal thus depends upon the amplitude and duration of
the pulse. The 90o and 270o RF pulses yield the maximum signals while in case of
180o pulse, NMV will move into the –z-axis and no signal will be detected. 7-9
The relaxation phenomenon plays an important role in the image formation during
MRI. The relaxation phenomenon in NMR is of two types i.e. spin lattice relaxation
and spin-spin relaxation, and is discussed in the next section.10
Chapter 1
7
1.1.3 Spin-lattice relaxation
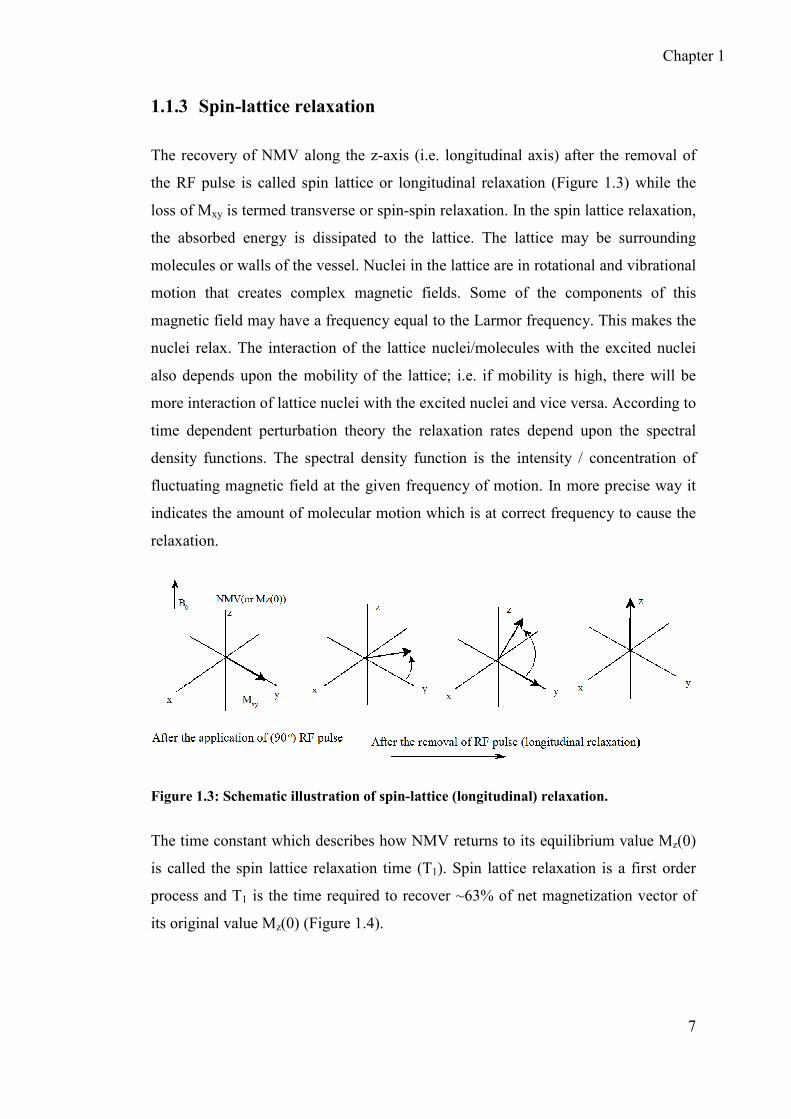
The recovery of NMV along the z-axis (i.e. longitudinal axis) after the removal of
the RF pulse is called spin lattice or longitudinal relaxation (Figure 1.3) while the
loss of Mxy is termed transverse or spin-spin relaxation. In the spin lattice relaxation,
the absorbed energy is dissipated to the lattice. The lattice may be surrounding
molecules or walls of the vessel. Nuclei in the lattice are in rotational and vibrational
motion that creates complex magnetic fields. Some of the components of this
magnetic field may have a frequency equal to the Larmor frequency. This makes the
nuclei relax. The interaction of the lattice nuclei/molecules with the excited nuclei
also depends upon the mobility of the lattice; i.e. if mobility is high, there will be
more interaction of lattice nuclei with the excited nuclei and vice versa. According to
time dependent perturbation theory the relaxation rates depend upon the spectral
density functions. The spectral density function is the intensity / concentration of
fluctuating magnetic field at the given frequency of motion. In more precise way it
indicates the amount of molecular motion which is at correct frequency to cause the
relaxation.
Figure 1.3: Schematic illustration of spin-lattice (longitudinal) relaxation.
The time constant which describes how NMV returns to its equilibrium value Mz(0)
is called the spin lattice relaxation time (T1). Spin lattice relaxation is a first order
process and T1 is the time required to recover ~63% of net magnetization vector of
its original value Mz(0) (Figure 1.4).

Chapter 1
8
Mz(0)
T1
Mz(t)
time
Figure 1.4: Spin-lattice relaxation time (T1).
Mathematically the recovery of magnetization is given by eq. (1.7)
1
)0()()(
T
zMtzM
dt
tzdM −= Eq. 1.7
In equation 1.7,
Mz(t) = Recovered magnetization vector after the removal of RF pulse at time t.9-10
1.1.4 Spin-spin relaxation
Spin-spin relaxation results in the loss of transverse magnetization (Mxy) and hence
is also called transverse relaxation. In spin-spin relaxation, energy is transferred from
one nucleus to another via fluctuating nuclear dipoles. As a result, the energy of one
nucleus is increased while for the other is decreased. The net energy remains the
same, only the Mxy(t) returns to Mxy(0). The Mxy is the sum of magnetic moments of
several nuclei, and all these nuclear magnetic moments are supposed to possess
phase coherence in the x-y plane after the application of RF pulse. All these nuclear

Chapter 1
9
spins (i.e. magnetic moments) will remain static in the rotating frame if all the
nuclear spins in the sample are experiencing exactly the same magnetic field.
However, in fact this is not possible; therefore some of the nuclei precess with the
frequency slightly higher than Larmor frequency while some exhibit precessional
motion with the frequency slightly smaller than the Larmor frequency. Two main
factors are responsible for inhomogeneous fields experienced by the sample: (a)
static magnetic field inhomogenity which is purely instrumental imperfection and (b)
local magnetic field arising from intermolecular and intramolecular interactions in
the sample. The second factor is responsible for the genuine or natural transverse
relaxation. When RF pulse is switched off, spin-spin interactions between low and
high energy nuclei lead to the fanning-out of the individual magnetisation vectors
(Figure 1.5).
Figure 1.5: Schematic illustration of spin-spin (or transverse) relaxation.
Both longitudinal and transverse relaxation phenomena take place simultaneously.
Spin-spin relaxation is characterized by the spin-spin relaxation time constant,
denoted by T2. Spin-spin relaxation time (T2) is the time required for ~37% of
transverse magnetization (Mxy(t)) to decay from its original value (Mxy(0)) (Figure
1.6).
Chapter 1
10
T2
Mxy
time
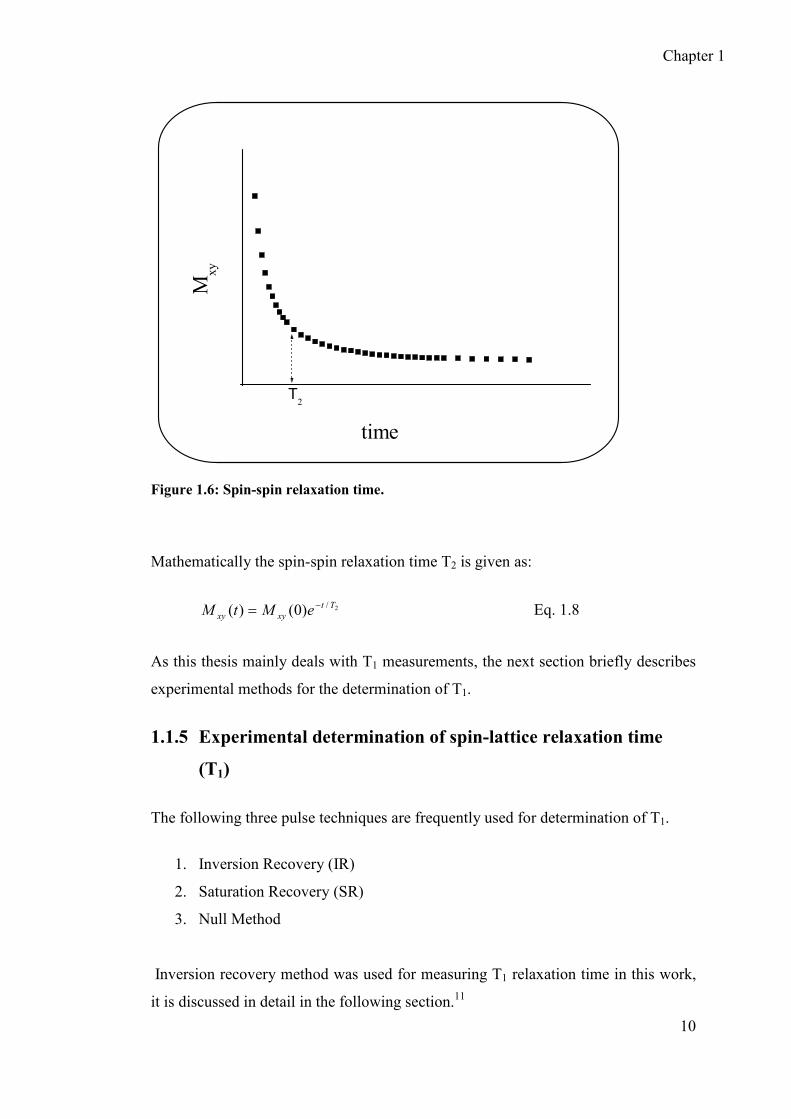
Figure 1.6: Spin-spin relaxation time.
Mathematically the spin-spin relaxation time T2 is given as:
2/)0()( Tt
xyxy eMtM −= Eq. 1.8
As this thesis mainly deals with T1 measurements, the next section briefly describes
experimental methods for the determination of T1.
1.1.5 Experimental determination of spin-lattice relaxation time
(T1)
The following three pulse techniques are frequently used for determination of T1.
1. Inversion Recovery (IR)
2. Saturation Recovery (SR)
3. Null Method
Inversion recovery method was used for measuring T1 relaxation time in this work,
it is discussed in detail in the following section.11

Chapter 1
11
1.1.5.1 Inversion-recovery sequence for determination of T1
The inversion-recovery is the most frequently used method for determination of
longitudinal relaxation time T1. The inversion recovery experiment is a simple two
pulse experiment. In the first instance, the Mz(0) is inverted (to –z axis) by applying
a 180o pulse. The –Mz(t) relaxes back to +Mz(0) with the time constant T1. As the
+Mz needs to be observed, it is again moved to the transverse (x-y) plane (Mxy) by a
90o pulse after a suitable delay time τ (Figure 1.7).
Figure 1.7: Schematic representation of inversion recovery process.
When τ is zero, the Mz = –Mz. This experiment is repeated with increasing values of
τ and the signal after every 90o pulse is recorded. Mathematically, magnetisation
detected at various values of τ is given as:
)21)(0()( 1/Tzz eMtM τ−−= Eq. 1.9

Chapter 1
12
In equation (1.9), Mz(0) is the equilibrium magnetisation which is recorded at τ∞.
The relaxation time T1 is determined by fitting the signal intensities (i.e. recovered
magnetisation at various time intervals τ) to equation (1.9). The fitting can be done
using algorithms which are available in many NMR software packages.
Alternatively, T1 can also be determined from the slope of the plot of ln(Mz(0) –
Mz(t)) vs τ.
1.1.6 Obtaining spatial information (for image formation in
MRI)12-14
In the above section, the basic principles of NMR were discussed i.e. interaction
between NMR active nuclei and the RF pulses in the presence of an applied
magnetic field. In MRI, magnetic field gradients are applied in addition to the main
magnetic field (B0), which are small perturbations superimposed on B0.
Mathematically, the magnetic field (Bi) at position “ri” is given as:
iTi rGBB += 0 Eq. 1.10
In equation (1.10), GT is the total gradient amplitude. Gradients are generated by
coils which are placed within the bore of the magnet and they produce linear
variations in one direction only, therefore for 3D imaging three gradient coils located
in three different orientations (i.e. along x, y and z-directions) are required. Gradients
are usually applied for a short period of time during a scan and hence are called
gradient pulses. Gradient pulses, RF-pulses, the data sampling period and the time
interval between each of them are collectively referred to as a pulse sequence
(discussed in section 1.1.7).
In the presence of magnetic field gradients, the Larmor frequency equation (1.5) will
be modified as:
)( 0 ii GrB += γω Eq. 1.11

Chapter 1
13
In equation (1.11), ωi is the Larmor frequency of protons at position i while G
represents the total gradient amplitude (expressed in mT/m or G/cm). According to
equation 1.11, every proton has a unique Larmor frequency which depends on its
location / position within the gradient field.
Gradients perform the following three main tasks in encoding the spatial
information.
(a) Slice selection
(b) Frequency encoding
(c) Phase encoding
1.1.6.1 Slice selection
Field gradients change the frequency (νL) of body protons in a linear fashion along
the direction of the gradients. Therefore, protons in selected slice along the direction
of the gradients have a specific range of Larmor frequencies (slice selection gradient
GSS). A frequency selective RF pulse having a central frequency and a narrow band
of frequencies which coincides with the proton frequencies in the selected slice is
applied. As a result, only the protons in the selected slice are excited. The central
frequency determines the particular position of the slice. The thickness of the slice
can be determined from the slice selected gradient amplitude (GSS) and the
bandwidth of frequencies (∆ωss) in the RF pulse as given by following equation
(1.12).
)Thickness Slice( ×∆=∆ ssGγω Eq 1.12
∆ω is usually fixed and the amplitude of GSS is changed to get a slice of the desired
thickness.
MRI requires multislice imaging, which is achieved by using the same GSS and a
unique RF pulse for each slice.
Chapter 1
14
After selecting the slice of desired thickness, the spatial location of MR signal in the
slice is determined by the frequency encoding (which tells us the position of the
nuclei giving rise to the signal along x-axis on the MR image) and phase encoding
(which tells us the position of signal along y-axis on the MR image) which are
discussed in the following sections.
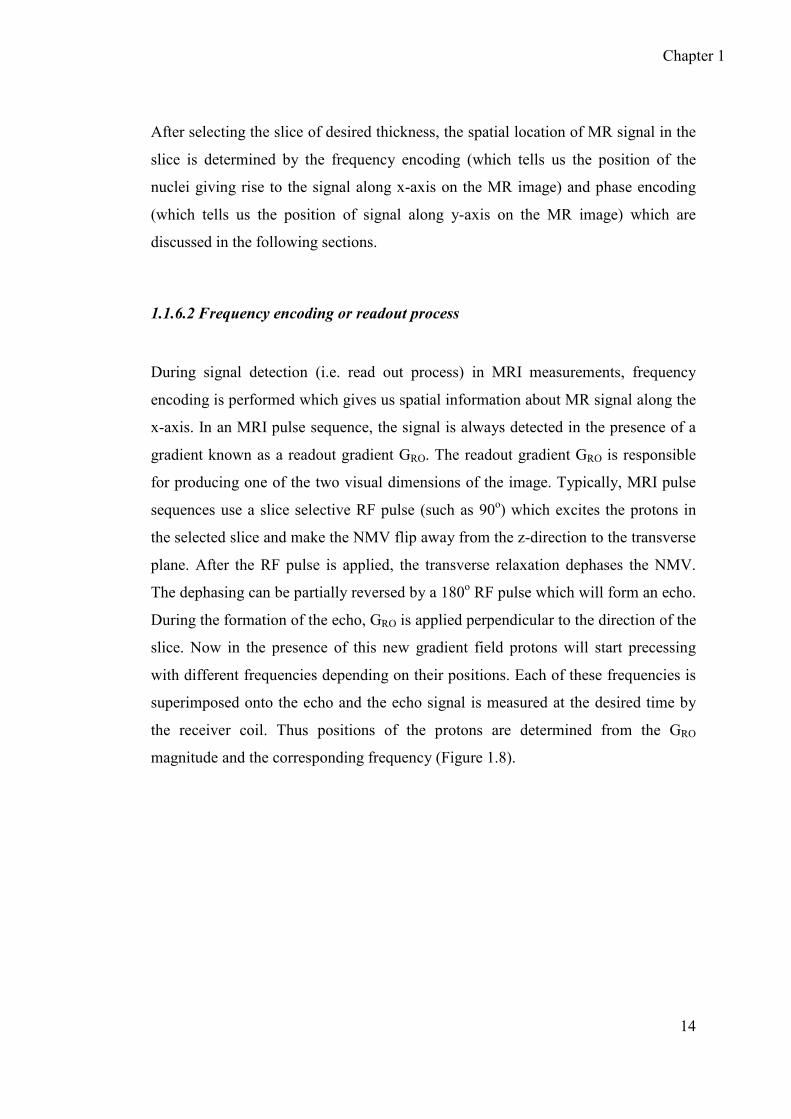
1.1.6.2 Frequency encoding or readout process
During signal detection (i.e. read out process) in MRI measurements, frequency
encoding is performed which gives us spatial information about MR signal along the
x-axis. In an MRI pulse sequence, the signal is always detected in the presence of a
gradient known as a readout gradient GRO. The readout gradient GRO is responsible
for producing one of the two visual dimensions of the image. Typically, MRI pulse
sequences use a slice selective RF pulse (such as 90o) which excites the protons in
the selected slice and make the NMV flip away from the z-direction to the transverse
plane. After the RF pulse is applied, the transverse relaxation dephases the NMV.
The dephasing can be partially reversed by a 180o RF pulse which will form an echo.
During the formation of the echo, GRO is applied perpendicular to the direction of the
slice. Now in the presence of this new gradient field protons will start precessing
with different frequencies depending on their positions. Each of these frequencies is
superimposed onto the echo and the echo signal is measured at the desired time by
the receiver coil. Thus positions of the protons are determined from the GRO
magnitude and the corresponding frequency (Figure 1.8).

Chapter 1
15
Figure 1.8: Schematic illustration of frequency encoding (or readout process).
In Figure (1.8), x1, x2 and x3 are three different positions of the protons in the
selected slice, while ω1, ω2, and ω3 are the corresponding detected frequencies.
1.1.6.3 Phase encoding
Phase encoding is applied before the readout process and it tells us about the MR
signal location along y-axis. The phase encoding gradient (GPE) is applied
perpendicular to both GSS and GRO which alters the magnetic field strength and the
precessional frequencies of the protons. GPE is usually applied just before the 180o
rephasing pulse as mentioned in the previous section. Prior to application of GPE,
protons have frequency ω0 (or Ф2 as indicated in Figure 1.9) called base frequency.
The GPE will increase or decrease this frequency. When the GPE is switched off,
protons will resume their base precessional frequency, but the relative phases will be
either slightly larger or smaller than Ф2 as illustrated in Figure 1.9. This change is
called induced shift and its magnitude depends on the magnitude and duration of
GPE. The induced shift is different for protons located at different positions in the
phase encoding direction for the same magnitude of GPE. For example in the Figure
1.9 y1, y2 and y3 are three different locations in the phase encoding direction and
they experience three different induced shifts indicated as Ф1, Ф2 and Ф3,
respectively.

Chapter 1
16
Figure 1.9: Schematic illustration of phase encoding phenomenon.
1.1.6.4 k-Space
Traditionally in MRI the letter “k” is used to represent the coordinate in the Fourier
domain, and hence the Fourier domain in MRI is represented as “k-space”. This term
was introduced by Ljunggren and Twieg in 1983. k-space has two axes i.e. kx which
represents the frequency information and ky which represents the phase information.
This information is then translated into an image using software with the help of
computers. Briefly, k-space is a two dimensional matrix of digitized MR data which
upon Fourier transformation yields the MR image.
1.1.7 Pulse sequences
A pulse sequence consists of RF pulses, gradient pulses and timings which are
applied in a specific order to generate an MR image. Several types of pulse sequence
Chapter 1
17
are used in MRI, of which spin echo and gradient echo sequences are the two main
methods while echo planar imaging sequence is an example of specialist sequences.
Here we will discuss only Spin Echo Sequences, which are commonly used in MRI.
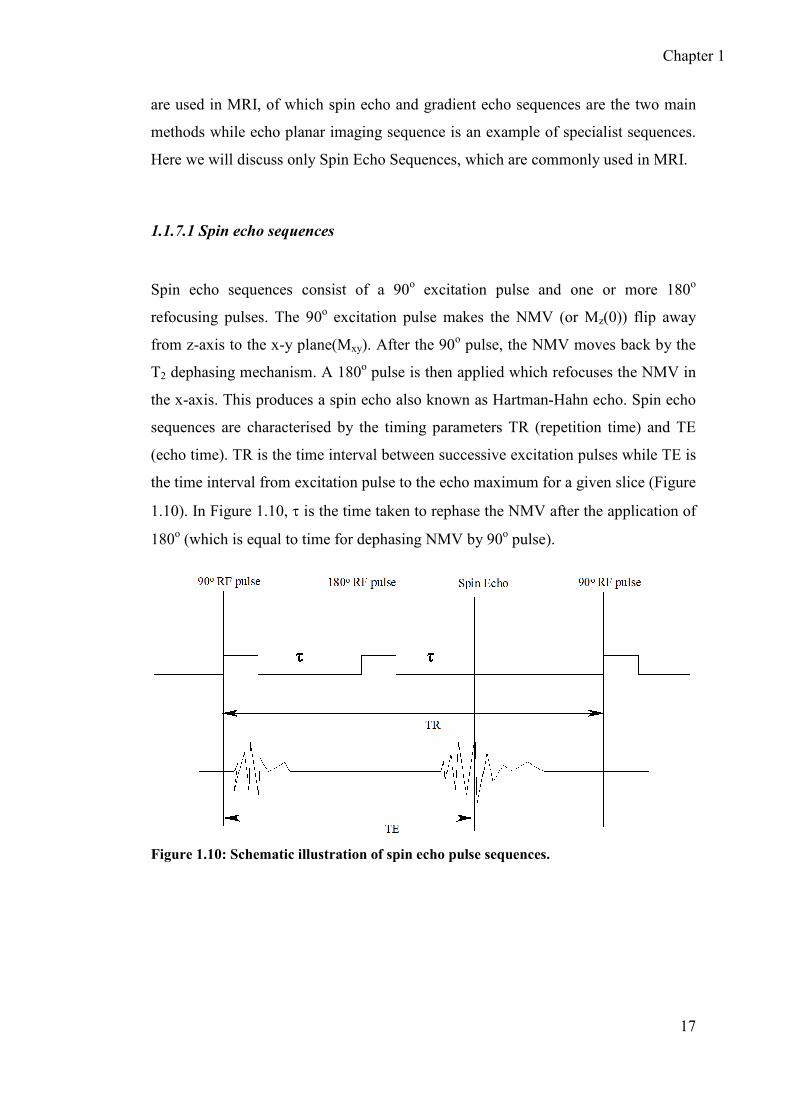
1.1.7.1 Spin echo sequences
Spin echo sequences consist of a 90o excitation pulse and one or more 180o
refocusing pulses. The 90o excitation pulse makes the NMV (or Mz(0)) flip away
from z-axis to the x-y plane(Mxy). After the 90o pulse, the NMV moves back by the
T2 dephasing mechanism. A 180o pulse is then applied which refocuses the NMV in
the x-axis. This produces a spin echo also known as Hartman-Hahn echo. Spin echo
sequences are characterised by the timing parameters TR (repetition time) and TE
(echo time). TR is the time interval between successive excitation pulses while TE is
the time interval from excitation pulse to the echo maximum for a given slice (Figure
1.10). In Figure 1.10, τ is the time taken to rephase the NMV after the application of
180o (which is equal to time for dephasing NMV by 90o pulse).
Figure 1.10: Schematic illustration of spin echo pulse sequences.

Chapter 1
18
1.2 Image contrast in MRI
To trace abnormal tissue, the MRI image must produce the contrast between normal
(healthy) tissue and abnormal (diseased) tissue. Intensity based image contrast
C(A, B) between two tissues A and B may be defined as:
refI
BIAIBAC
|)()(|),(
−= Eq. 1.13
In eq. 1.13, IA and IB are the intensities of tissues A and B, respectively and Iref is the
arbitrary reference intensity. In such a simple MRI image there is no external or
internal reference, image contrast is simply the difference between intensities of two
tissues. An MRI image has contrast if there are areas of high signal intensity (white
on the image) and areas of low signal intensity (dark on the MRI image). The images
having intermediate signal intensity have grey shades in between white and black.
1.2.1 Contrast mechanism in MRI
Generally three different types of intensity contrast in MR images can be created
which are briefly discussed in the following section.
1.2.1.1 T1 Weighted contrast
The repetition time TR (i.e. time interval between two successive excitation pulses)
is the key parameter responsible for T1 contrast during a pulse sequence. For T1
contrast a short TR is selected. When a pulse sequence with short TR is applied, the
tissues with relatively short T1 relax quickly (after the application of 90o pulse) and
thus exhibit large signal intensity after the application of next (180o) pulse. On the
other hand, tissues with a long T1 undergo only little relaxation between two RF
pulses and thus yield low signal intensity. For example fat has a shorter T1 (because
Chapter 1
19
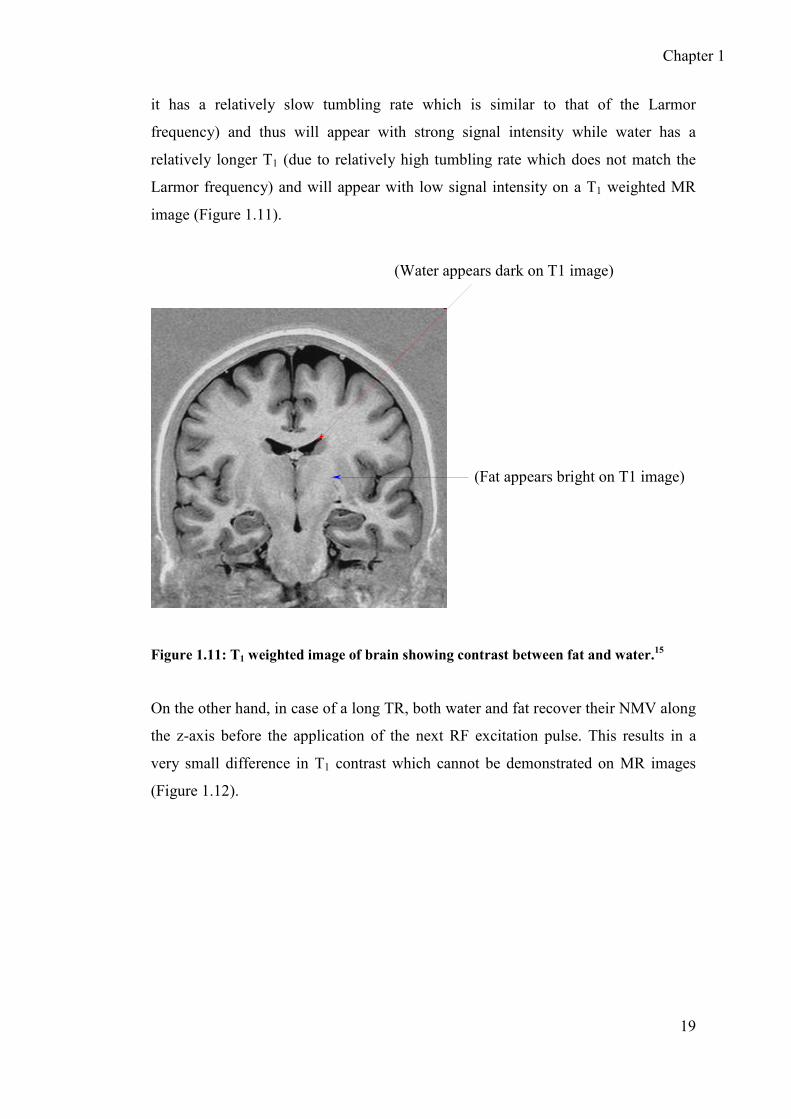
it has a relatively slow tumbling rate which is similar to that of the Larmor
frequency) and thus will appear with strong signal intensity while water has a
relatively longer T1 (due to relatively high tumbling rate which does not match the
Larmor frequency) and will appear with low signal intensity on a T1 weighted MR
image (Figure 1.11).
Figure 1.11: T1 weighted image of brain showing contrast between fat and water.15
On the other hand, in case of a long TR, both water and fat recover their NMV along
the z-axis before the application of the next RF excitation pulse. This results in a
very small difference in T1 contrast which cannot be demonstrated on MR images
(Figure 1.12).
(Water appears dark on T1 image)
(Fat appears bright on T1 image)

Chapter 1
20
Figure 1.12:T1 contrast between fat and water in a tissue due to different T1 values. 15
1.2.1.2 T2 Weighted contrast
The effect of T2 on the image contrast is based on the echo time (TE is the time
interval between (90o) excitation pulse and maximum echo). To create T2 contrast in
MR images, long TE (which must be in the range of T2 of tissues) is used in spin
echo pulse sequences. The tissues with relatively shorter T2 will lose magnetisation
(i.e. NMV) quickly which will yield low signal intensity, while tissues with
relatively larger T2 exhibit high signal intensity. For example fat appears with low
signal intensity (as it has short T2) and water appears with high signal intensity (as it
has larger T2) on T2-weighted images (Figure 1.13).

Chapter 1
21
(fat appear dark on T2 image)
(water appear bright on T2 image)
Figure 1.13: T2 weighted image of the brain showing contrast between fat and water.15
On the other hand, if a short TE is used, no contrast will be created because neither
the fat nor water transverse magnetization vectors will decay significantly. There
will not be much difference in T2 signals between fat and water as demonstrated in
Figure 1.14.

Chapter 1
22
Figure 1.14: T2 contrast between fat and water in the tissue.15

Chapter 1
23
1.2.1.3 Proton density images
Apart from differences in relaxation times in different tissues, the difference in the
number of protons per unit volume in different tissues can also create contrast in the
MRI images. In proton density images, the extrinsic parameters are selected in the
range (TE << T2 and TR >> T1) so that they do not significantly affect the image
contrast and thus image contrast primarily depends upon the proton density. In
proton density images, tissues with higher proton density appear bright (e.g. brain
tissues) and the tissues with lower proton density appear dark (e.g. cortical bone)
(Figure 1.15).
Brain tissues
Cortical bone
Figure 1.15: Proton density image of the brain. 15
Chapter 1
24
1.2.1.4 Chemical shift imaging
In conventional MRI, various hydrogen atoms in the body are not differentiated
depending upon their chemical environment. However the protons bonded with
water have different Larmor frequency than those bonded with aliphatic carbon
chains (such as methylene protons in lipids or tissues). The spatial determination of
these different protons leads to the chemical shift imaging. Proton chemical shifting
imaging may give better results than MRI in diagnostic studies in some situations.
For example, chemical shift imaging is reported to diagnose fatty liver disease more
efficiently.16
1.3 Contrast agents (CAs) in MRI
In the previous sections, it has been discussed that contrast in image can be created /
enhanced by altering TR or TE which gives T1 and T2 weighted images. The image
contrast also depends upon the proton density. However, abnormal tissues under
examination may not have significant differences in T1 and / or T2 from the
surrounding normal tissues which results in very little inherent contrast. The signal
difference between normal and diseased tissues can be enhanced through
administration of paramagnetic substances called contrast agents. For example in
Figure 1.16, the T1-weighted image without contrast agent lacks some information
which is clearly present (i.e. two additional lesions) in the image obtained after the
administration of a contrast agent.

Chapter 1
25
Figure 1.16: T1 weighted images of transverse orientation of central nervous system
(CNS) with (right) and without (left) contrast agent.13
In the early years (1948) of NMR, it was found that relaxation of the water protons
can be enhanced by paramagnetic substances like FeCl3 etc.17 30 years later,
Lauterbur et al.18 successfully distinguished different tissues on the basis of different
relaxation rate using a Mn(II) salt and thus published the first MRI image.
Nowadays, Gd-complexes are widely used as MRI contrast agents and will be
discussed in the section 1.5.
1.4 Relaxivity of contrast agents (i.e. Metal Complexes)
The main purpose of the use of contrast agent is to get better contrast so that one can
easily distinguish the diseased tissues from the normal ones. The body protons (in
the form of water or proteins) are the basis of MRI. The tumbling rate of body water
molecules is much higher than the Larmor frequency. As a result, relaxation rate of
water protons is very low which results in long relaxation (T1) times and thus poor /
weak MRI signals. By using contrast agents, the relaxation rate is increased resulting
in better contrast of the MRI image.1, 5 The fluctuating magnetic field around the
paramagnetic centre due to unpaired electrons is responsible for increasing the
relaxation of nearby water protons. There are several mechanisms for affecting the
relaxation of surrounding protons by paramagnetic metal complexes; the most

Chapter 1
26
dominant is the dipole-dipole interactions between paramagnetic centre and the
surrounding water molecules. The dipolar mechanism is orientation dependent i.e.
highly dependent on the rate of tumbling of coupled species. The dipolar mechanism
of relaxation is discussed in more detail in chapter 3 (section 3.1).
The general theory of solvent nuclear relaxation was developed by the groups of
Bloembergen, Solomon and others.19-21 According to this theory the metal
complexes affect both spin lattice relaxation rate (1/T1) and spin-spin relaxation rate
(1/T2). The observed relaxation rate of surrounding water protons (1/T1,obs) in the
presence of paramagnetic substance is generally given by the following
mathematical equation.
1 1 1
,, ,T T T
i pi obs i d
= + where i = 1, 2 Eq. 1.14
In equation 1.14, 1/Ti,d is the relaxation in the absence of any paramagnetic
substance, while 1/Ti,p is the relaxation enhancement by the paramagnetic
substance. The relaxation enhancement is directly proportional to the
concentration of the paramagnetic species 22, equation 1.14 can be modified as:
1 1
[ ]
, ,
r Mi
T Ti obs i d
= + Eq. 1.15
The concentration of paramagnetic species [M] is usually expressed in mmol/L
and relaxation time is in seconds. A straight line is obtained from the plot of
various concentrations of paramagnetic species vs relaxation rate; the slope of this
plot gives us relaxivity (ri). Relaxivity is the tendency of contrast agent to increase
the relaxation rate of surrounding protons and is usually expressed as mM-1s-1.
There are also several other factors which control / limit the relaxivity of contrast
agents and are discussed in the section 1.7.
Chapter 1
27
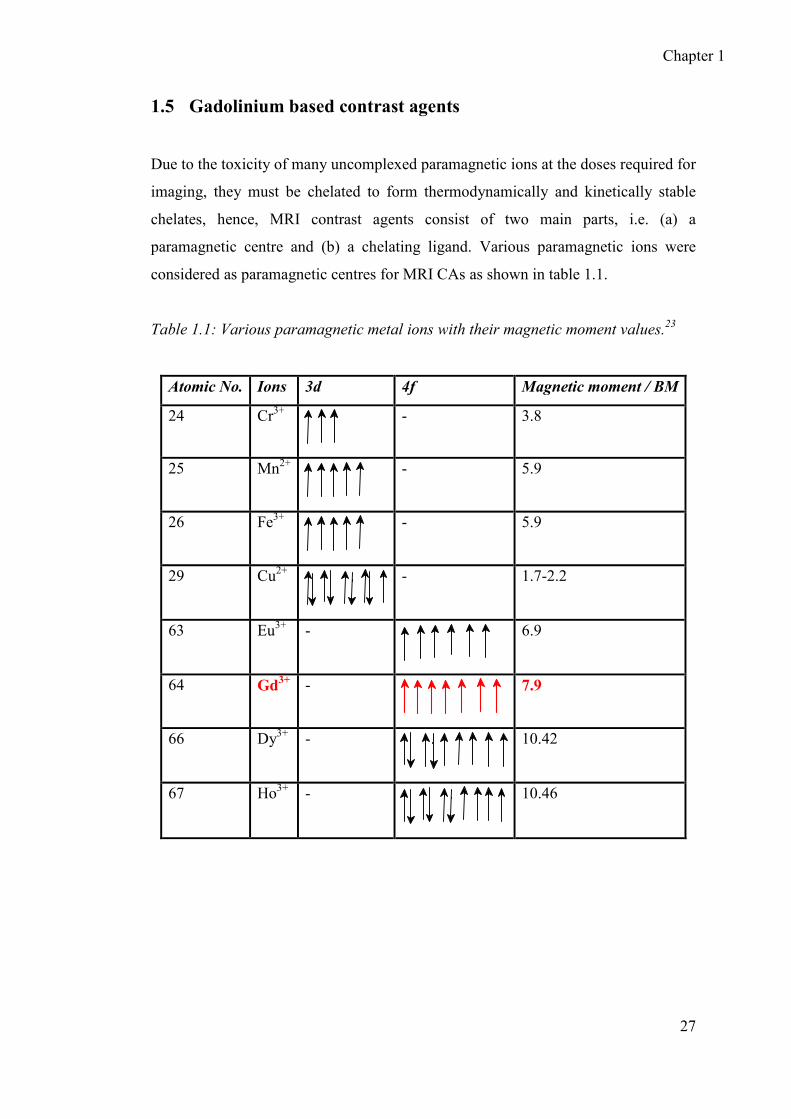
1.5 Gadolinium based contrast agents
Due to the toxicity of many uncomplexed paramagnetic ions at the doses required for
imaging, they must be chelated to form thermodynamically and kinetically stable
chelates, hence, MRI contrast agents consist of two main parts, i.e. (a) a
paramagnetic centre and (b) a chelating ligand. Various paramagnetic ions were
considered as paramagnetic centres for MRI CAs as shown in table 1.1.
Table 1.1: Various paramagnetic metal ions with their magnetic moment values.23
Atomic No. Ions 3d 4f Magnetic moment / BM
24 Cr3+
- 3.8
25 Mn2+
- 5.9
26 Fe3+
- 5.9
29 Cu2+
- 1.7-2.2
63 Eu3+ -
6.9
64 Gd3+ -
7.9
66 Dy3+ -
10.42
67 Ho3+ -
10.46

Chapter 1
28
Gd3+ has received the most attention as a paramagnetic centre for the MRI contrast
agent due to its following unique features:
• It has a very high value of magnetic moment due to the seven unpaired
electrons present in the “3+” oxidation state.
• The electronic relaxation time for Gd3+ is much longer (~10-9 s) than for the
other lanthanides such as Dy3+, Eu3+ and Ho3+ (~10-13 s).
Lanthanides such as Dy3+ and Ho3+ have higher magnetic moments than Gd due to a
greater orbital angular momentum contribution, but due to their relatively short
electronic relaxation time, they are rarely used as paramagnetic centres for MRI
contrast agents. The relatively high electronic relaxation time of Gd3+ is responsible
for changing the relaxation time of the surrounding protons. Another important
paramagnetic centre is the Fe3+ and iron oxide based MRI contrast agents will be
discussed briefly in section 1.6.
The second component of the contrast agent is the ligand which must possess some
unique characteristics to form the MRI contrast agents. For example, ligands must be
water soluble, form stable complexes with Gd and finally after chelating with Gd3+
they must have some exchangeable water molecules. The exchangeable water
molecules play a crucial role in increasing the relaxation rate of surrounding water
protons by transferring the effect of magnetic moment of the paramagnetic centre to
the surrounding protons.
Initially Ethylenediaminetetraacetic acid,(EDTA, a hexadentate ligand) was used for
complexation with gadolinium but due to poor in vivo stability, it is unsuitable for
clinical use, although Gd-EDTA complex includes three exchangeable water
molecules which could significantly contribute to increase the relaxation rate of the
surrounding protons (Figure 1.17).
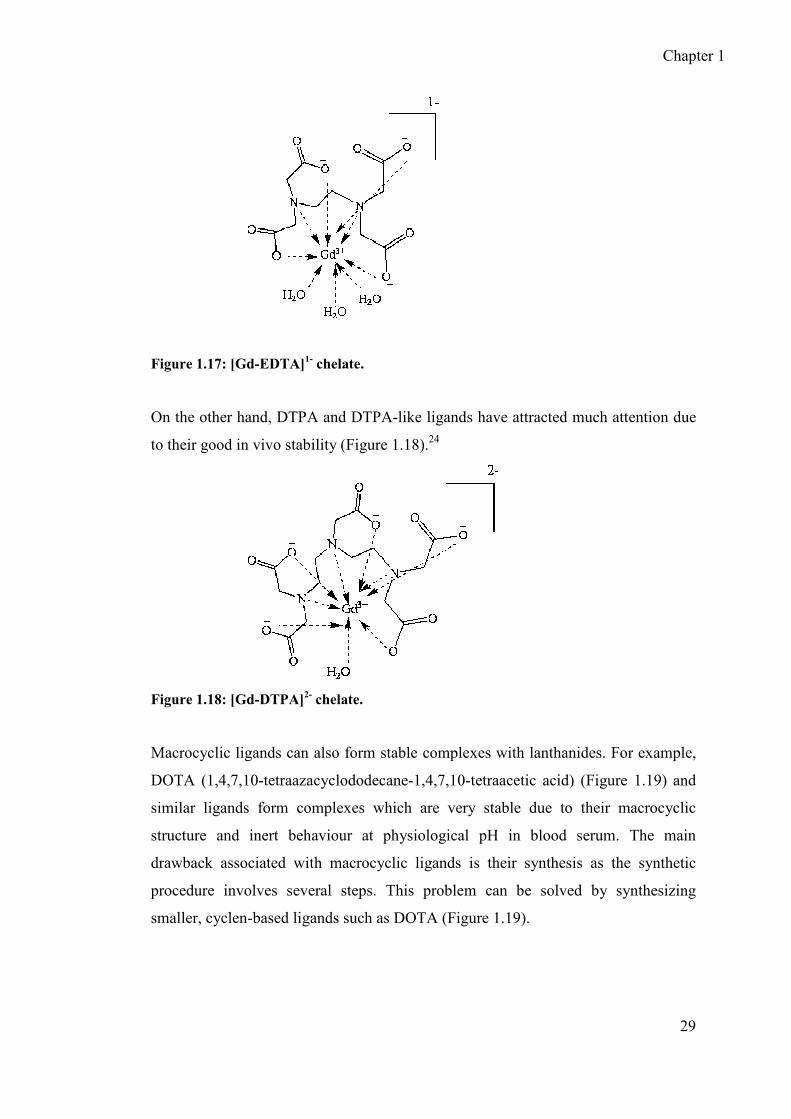
Chapter 1
29
Figure 1.17: [Gd-EDTA]1- chelate.
On the other hand, DTPA and DTPA-like ligands have attracted much attention due
to their good in vivo stability (Figure 1.18).24
Figure 1.18: [Gd-DTPA]2- chelate.
Macrocyclic ligands can also form stable complexes with lanthanides. For example,
DOTA (1,4,7,10-tetraazacyclododecane-1,4,7,10-tetraacetic acid) (Figure 1.19) and
similar ligands form complexes which are very stable due to their macrocyclic
structure and inert behaviour at physiological pH in blood serum. The main
drawback associated with macrocyclic ligands is their synthesis as the synthetic
procedure involves several steps. This problem can be solved by synthesizing
smaller, cyclen-based ligands such as DOTA (Figure 1.19).

Chapter 1
30
N N
COOHHOOC
N N
HOOC COOH
Figure 1.19: Chemical structure of DOTA.
Currently all MRI contrast agents approved for clinical applications are based on Gd-
chelates with either DTPA (and DTPA based ligands) or DOTA (and DOTA based
ligands) (Figure 1.20).25
Figure 1.20: Commercially available MRI contrast agents approved for clinical
applications.25
The main drawback associated with these small molecule based contrast agents is
their diffusion to the extravenous area immediately after the intravenous injection
because of their low molecular weights. In order to slow down their diffusion, high
molecular weight based contrast agents were developed and these will be discussed

Chapter 1
31
in section 1.8. Other drawbacks associated with small molecule based contrast agents
are that they are non-specific, and have relatively small circulation times due to their
fast renal excretion.26
1.6 Iron oxide based contrast agents
Iron oxide particles present a major advantage compared to other paramagnetic ions
such as Gd3+ and Mn2+ etc as each iron oxide particle bears a huge magnetic moment
as compared to a single paramagnetic ion (Gd3+ and Mn2+). Iron oxide particles are
superparamagnetic. On the other hand, the main drawback associated with iron oxide
based CAs is that they can only be used for T2-weighted images i.e. negative contrast
agents.
As naked iron oxide particles readily aggregate, a range of different ligands is used
to stabilise the particles. There are several functional groups, which can be
covalently bonded to the surface of iron oxide particles. For example, the presence of
the hydroxyl group (Fe-OH) at the surface of iron oxide particles provides the
opportunity to attach a wide range of other functionalities which will stabilise the
nanoparticles. A range of chemical reactions can be carried out at the Fe-OH surface,
via electrostatic or covalent interactions.
Depending upon the size, there are two main classes of iron oxides particles used for
MRI applications27 (a) Superparamagnetic iron oxide nanoparticles (SPIO) and (b)
Ultra-small superparamagnetic iron oxide (USPIO). Both SPIO and USPIO have
been extensively studied for MRI applications because both types of nanoparticles
can be synthesized easily and are bio-compatible.
SPIO are larger particles and have size range 60-350nm. SPIO suspension can be
used for oral applications for MRI studies of abdomen. These particles are usually
protected by a non-biodegradable and soluble matrix which reduces the aggregation
of SPIO particles. A typical example of SPIO is iron oxide crystals coated with
dextran having diameter 80-150 nm commercially known as Endorem.25 USPIO
have size smaller than 50 nm.28 They have prolonged blood half life, therefore they
Chapter 1
32
can pass through the capillary walls and can be taken up by lymph nodes and bone
marrow. Combidex i.e. iron oxide particles coated with dextran having size 20-40
nm is a typical example of USPIO and it has human blood pool half life more than
24 h.
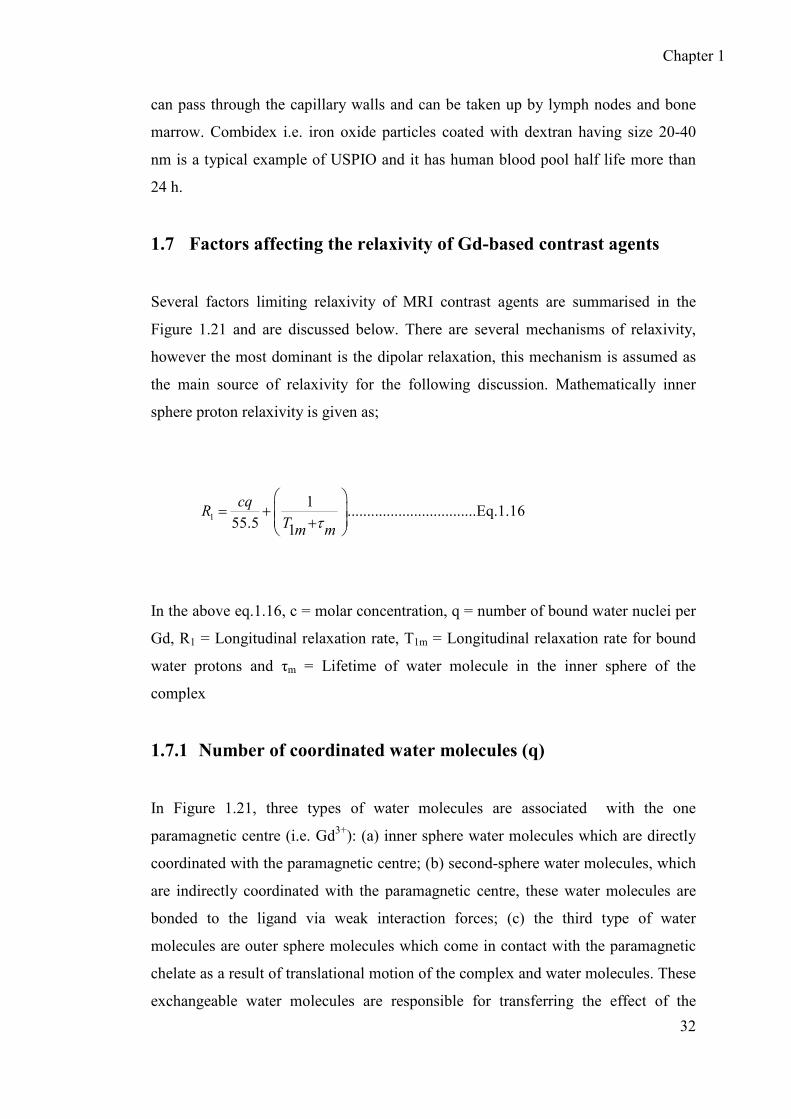
1.7 Factors affecting the relaxivity of Gd-based contrast agents
Several factors limiting relaxivity of MRI contrast agents are summarised in the
Figure 1.21 and are discussed below. There are several mechanisms of relaxivity,
however the most dominant is the dipolar relaxation, this mechanism is assumed as
the main source of relaxivity for the following discussion. Mathematically inner
sphere proton relaxivity is given as;
1
1.................................Eq.1.16
55.5 1
cqR
T m mτ
= +
+
In the above eq.1.16, c = molar concentration, q = number of bound water nuclei per
Gd, R1 = Longitudinal relaxation rate, T1m = Longitudinal relaxation rate for bound
water protons and τm = Lifetime of water molecule in the inner sphere of the
complex
1.7.1 Number of coordinated water molecules (q)
In Figure 1.21, three types of water molecules are associated with the one
paramagnetic centre (i.e. Gd3+): (a) inner sphere water molecules which are directly
coordinated with the paramagnetic centre; (b) second-sphere water molecules, which
are indirectly coordinated with the paramagnetic centre, these water molecules are
bonded to the ligand via weak interaction forces; (c) the third type of water
molecules are outer sphere molecules which come in contact with the paramagnetic
chelate as a result of translational motion of the complex and water molecules. These
exchangeable water molecules are responsible for transferring the effect of the

Chapter 1
33
magnetic moment from the Gd3+ centre to the surrounding water protons. Thus, the
observed relaxivity in the presence of paramagnetic centre is the sum of inner sphere
relaxivity and outer sphere relaxivity. But it is the inner sphere relaxivity which can
be modified and thus for the new generation of contrast agents inner sphere
relaxivity plays a crucial role in the overall relaxivity. This mechanism is depicted in
the Figure 1.21. The inner-sphere relaxivity is directly proportional to the number of
water molecules directly bonded to the paramagnetic centre. Generally, aquated Gd3+
can coordinate eight water molecules in its first coordination sphere, but due to
toxicity gadolinium has to be chelated with some stable ligand. Several
poly(aminocarboxylate) ligands have been approved for medicinal use; they occupy
eight coordination sites of gadolinium leaving one free to bind a water molecule.
Increasing the hydration number (q) of Gd-chelates is very difficult, as an increased
number of inner-sphere water molecules results in a decreased stability of the
gadolinium chelate. So far all approved gadolinium chelates for MRI applications
have just one water molecule in their first coordination sphere4 (Figure 1.21).
1.7.2 Metal-H distance (r)
Relaxivity (due to dipolar interactions) is proportional to 1/r6, which indicates that an
increase in distance between the Gd and the bound water molecule will decrease the
relaxivity and vice versa. The average Gd to OH2 distance (now referred as the Gd-H
distance for simplicity) has been found in the range of 2.5-3.3 Å.29 Theoretically a
decrease of 0.1 Å in Gd-H distance will enhance relaxivity by 20 %, and a 0.2 Å
decrease results in 50 % increased relaxivity. The Gd-H distance can be decreased by
increasing the tilt angle between the plane of bound water molecule with respect to
the Gd-O vector.30 The tilt angle can be increased by H-bonding between H2O
molecule and any suitable side group of the chelate.

Chapter 1
34
N
O
O
O
O
N
N
OO
O
O
O
OH
O
H
H
O
H
H
O
H
H
O
H
H
O
H
H
OH
HO
H
H
OH
H
O
H
H
OH
H
O
HH
O
H
HO
H
HO
HH
O
HGd
+ 3r
Inner sphere coordinated water molecule
Second sphere coordinated water molecules
Outer sphere coordinated water molecules
Bulk water
S
tR
Figure 1.21: Schematic illustration showing various factors which limit the relaxivity.1
1.7.3 Rotational correlation time (ττττR)
The time which a species takes to move by one radian is termed its rotational
correlation time.31 This is a very important parameter which controls the relaxivity
by controlling dipole-dipole interactions between electronic (Gd3+) and nuclear spins
(surrounding protons) as shown below mathematically:
1 1 1 1..................................Eq1.17
1c R mTe
τ τ τ= + +
In above equation 1.17, τc is the reorientational correlational time, τR is the rotational
correlational tome and T1e is the longitudinal electron spin relaxation time.

Chapter 1
35
The dipolar relaxivity can be enhanced by increasing the τR.1, 4
The increased τR will
increase the electronic-nuclear dipolar interactions leading to increased relaxivity.
For example, Figure 1.22 shows a typical effect of τR on relaxivity for Gd(III)
chelates. It is clear from the Figure (1.22) that as the τR is increased the relaxivity
also increased.
Figure 1.22: Calculated relaxivities vs Larmor frequency for different values of ττττR for
Gd(III) complexes. 4
According to Debye-Stokes theory, τR is directly proportional to the viscosity of the
medium as given by eq. 1.18.
kT
aR 3
34 ηπτ = Eq. 1.18
In eq. 1.16 “a” is the radius of a spherical molecule, k is Boltzman constant, and T is
the temperature. Three basic strategies for increasing the τR are found in literature.4
I. The distribution of the contrast agent into the tissue or compartment of a
tissue with high local viscosity.
II. By attaching contrast agents to large molecules, such as proteins etc before
injection.
Chapter 1
36
III. By non-covalent binding of the contrast agent molecule to a macromolecule
in the tissue.
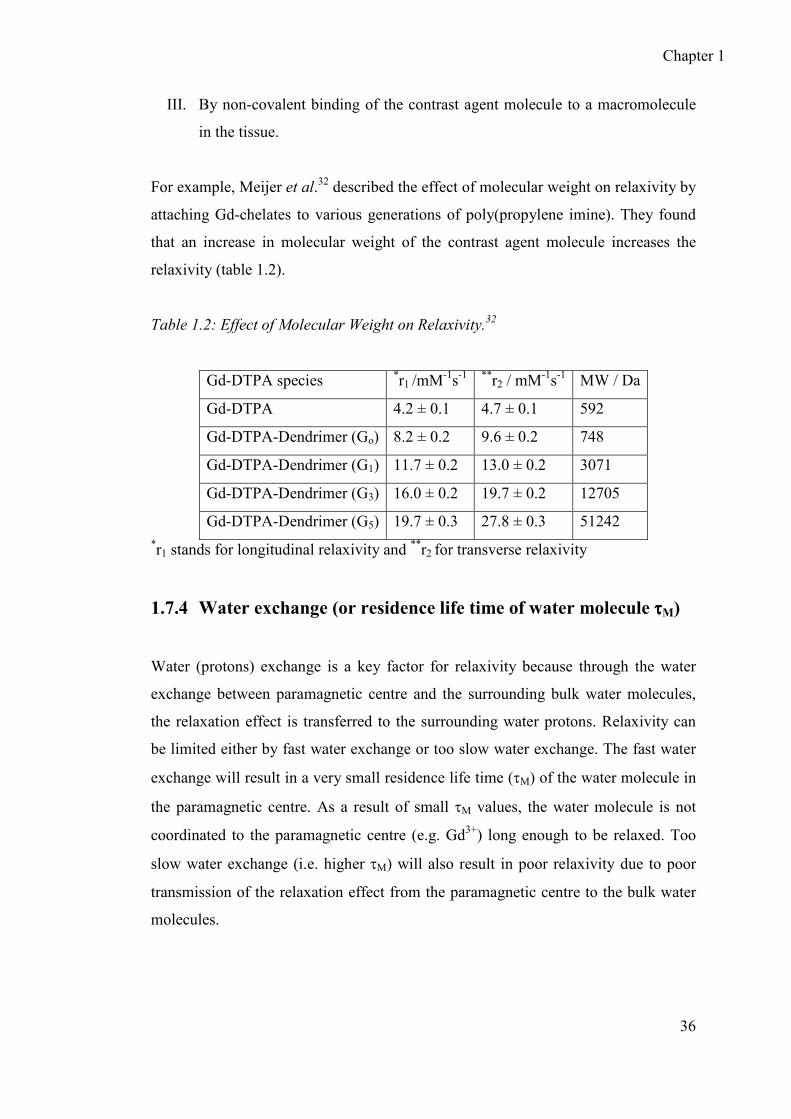
For example, Meijer et al.32 described the effect of molecular weight on relaxivity by
attaching Gd-chelates to various generations of poly(propylene imine). They found
that an increase in molecular weight of the contrast agent molecule increases the
relaxivity (table 1.2).
Table 1.2: Effect of Molecular Weight on Relaxivity.32
Gd-DTPA species *r1 /mM-1s-1 **r2 / mM
-1s-1 MW / Da
Gd-DTPA 4.2 ± 0.1 4.7 ± 0.1 592
Gd-DTPA-Dendrimer (Go) 8.2 ± 0.2 9.6 ± 0.2 748
Gd-DTPA-Dendrimer (G1) 11.7 ± 0.2 13.0 ± 0.2 3071
Gd-DTPA-Dendrimer (G3) 16.0 ± 0.2 19.7 ± 0.2 12705
Gd-DTPA-Dendrimer (G5) 19.7 ± 0.3 27.8 ± 0.3 51242 *r1 stands for longitudinal relaxivity and
**r2 for transverse relaxivity
1.7.4 Water exchange (or residence life time of water molecule ττττM)
Water (protons) exchange is a key factor for relaxivity because through the water
exchange between paramagnetic centre and the surrounding bulk water molecules,
the relaxation effect is transferred to the surrounding water protons. Relaxivity can
be limited either by fast water exchange or too slow water exchange. The fast water
exchange will result in a very small residence life time (τM) of the water molecule in
the paramagnetic centre. As a result of small τM values, the water molecule is not
coordinated to the paramagnetic centre (e.g. Gd3+) long enough to be relaxed. Too
slow water exchange (i.e. higher τM) will also result in poor relaxivity due to poor
transmission of the relaxation effect from the paramagnetic centre to the bulk water
molecules.

Chapter 1
37
1.8 Recent advances / developments in MRI contrast agents
In the previous sections, several factors have been discussed which limit / control of
the relaxivity of CAs. Among these factors, the tuning of τR is the most frequently
reported factor in the recent literature. The τR can be tuned easily by bio-conjugation
of a small paramagnetic molecule i.e. Gd-DTPA chelate with macromolecules or/and
macromolecular species (either) covalently (or non-covalently). There are many
reports in the literature of Gd complexes (i.e. Gd-chelates) covalently attached to
macromolecules or macromolecular species such as dendrimers, micelles, liposomes,
nano-emuslion, carbon nanotubes etc (Figure 1.23)33-35, in order to enhance the
efficiency of MRI CAs. In this section the discussion will focus recent advances in
the field of liposomes, micelles, dendrimers and zeolites and silica based contrast
agents.
Figure 1.23: Schematic illustration of Gd-loaded species (i.e. dendrimers, micelles,
liposomes etc).33

Chapter 1
38
1.8.1 Liposome based MRI contrast agents
Liposomes (discovered in early 1960s by Bangham et al.36) are microscopic
spherical vesicles composed of two phospholipids layers with a hydrophilic core and
a hydrophobic tail which are often used as drug delivery vehicles.37-38 Usually they
have a size in the range of ~20-400 nm. Recently, they attracted attention for MRI
contrast agents’ applications due to several favourable features. For example, they
can be readily prepared from simple reagents, their size can be easily manipulated
and they are biocompatible.25, 33 Liposome based contrast agents can be further
subdivided into the following sections.
1.8.2 Ensomes
The main advantage of selecting liposomes as paramagnetic chelates carriers for the
purpose of MRI contrast agents is attributed to their extended circulation time in
blood. A short circulation time is the main drawback associated with small molecule
based contrast agents. Initially the paramagnetic species were loaded into the interior
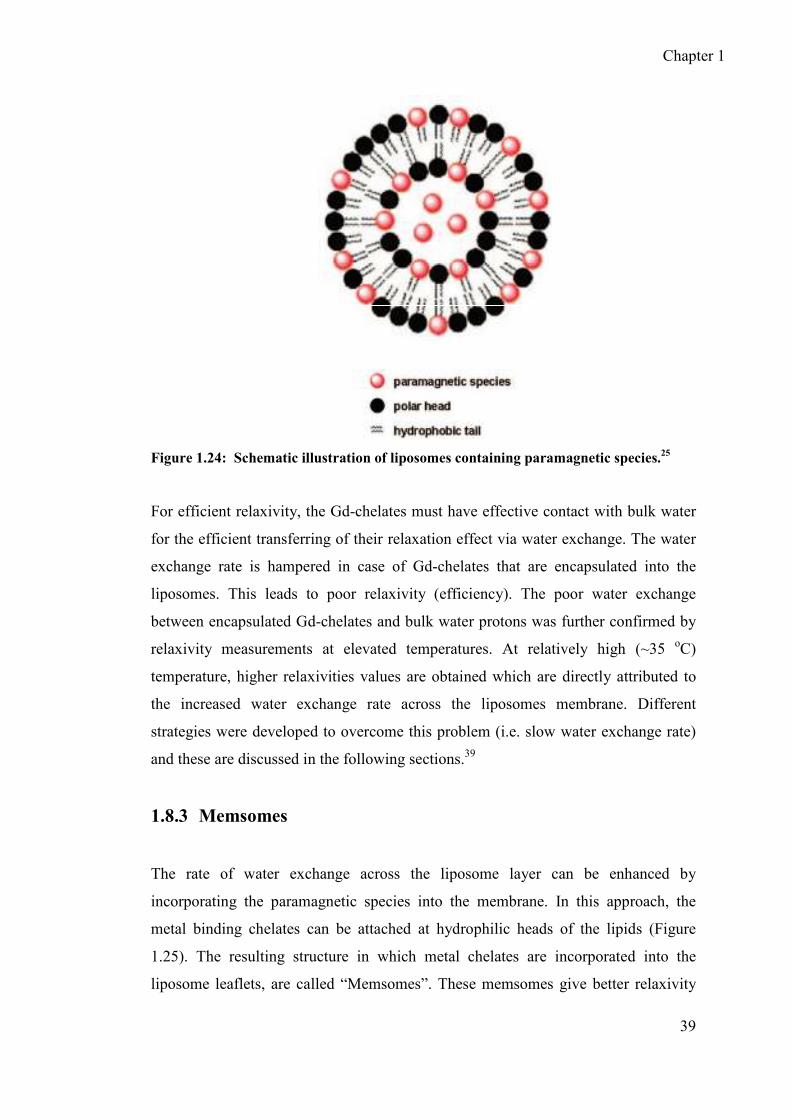
(hydrophilic) core of the liposome giving rise to the structures called “Ensomes”
(Figure 1.24). Various types of paramagnetic species such as Mn-chelates, Gd-
chelates etc can be loaded into the liposomes core. A significant decrease in the
relaxivity of Gd-chelates was observed after the encapsulation into the liposomes.
Chapter 1
39
Figure 1.24: Schematic illustration of liposomes containing paramagnetic species.25
For efficient relaxivity, the Gd-chelates must have effective contact with bulk water
for the efficient transferring of their relaxation effect via water exchange. The water
exchange rate is hampered in case of Gd-chelates that are encapsulated into the
liposomes. This leads to poor relaxivity (efficiency). The poor water exchange
between encapsulated Gd-chelates and bulk water protons was further confirmed by
relaxivity measurements at elevated temperatures. At relatively high (~35 oC)
temperature, higher relaxivities values are obtained which are directly attributed to
the increased water exchange rate across the liposomes membrane. Different
strategies were developed to overcome this problem (i.e. slow water exchange rate)
and these are discussed in the following sections.39
1.8.3 Memsomes
The rate of water exchange across the liposome layer can be enhanced by
incorporating the paramagnetic species into the membrane. In this approach, the
metal binding chelates can be attached at hydrophilic heads of the lipids (Figure
1.25). The resulting structure in which metal chelates are incorporated into the
liposome leaflets, are called “Memsomes”. These memsomes give better relaxivity
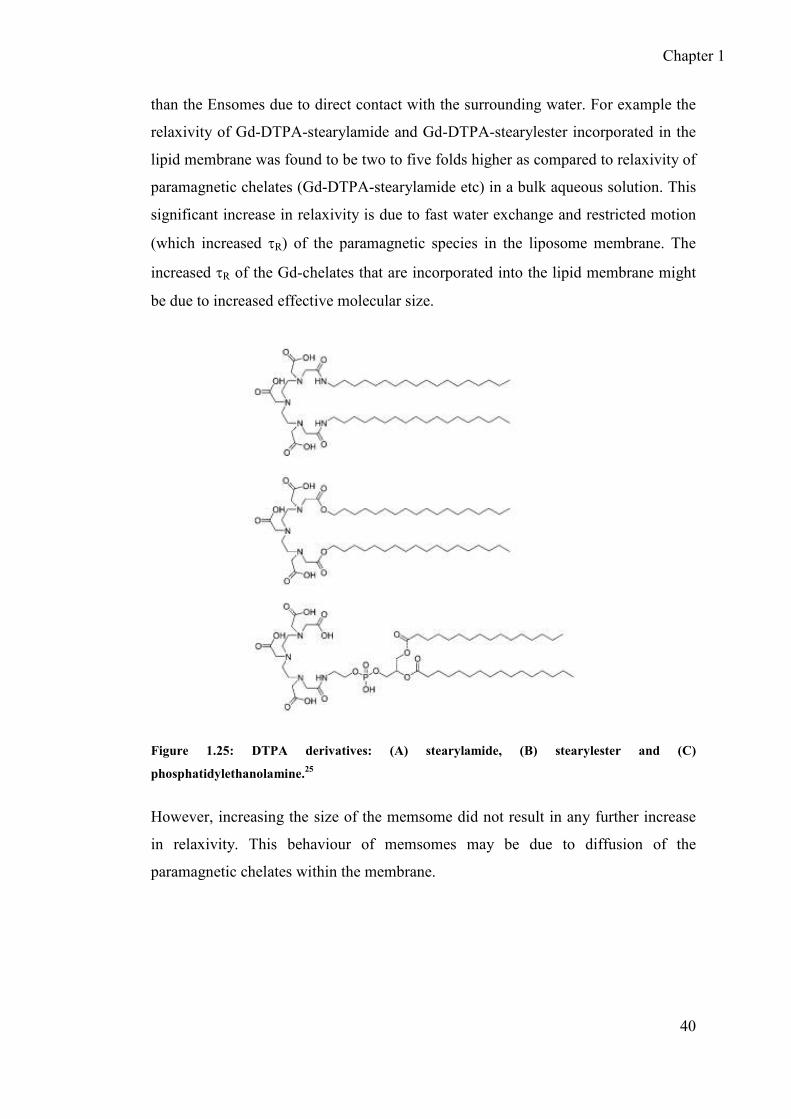
Chapter 1
40
than the Ensomes due to direct contact with the surrounding water. For example the
relaxivity of Gd-DTPA-stearylamide and Gd-DTPA-stearylester incorporated in the
lipid membrane was found to be two to five folds higher as compared to relaxivity of
paramagnetic chelates (Gd-DTPA-stearylamide etc) in a bulk aqueous solution. This
significant increase in relaxivity is due to fast water exchange and restricted motion
(which increased τR) of the paramagnetic species in the liposome membrane. The
increased τR of the Gd-chelates that are incorporated into the lipid membrane might
be due to increased effective molecular size.
Figure 1.25: DTPA derivatives: (A) stearylamide, (B) stearylester and (C)
phosphatidylethanolamine.25
However, increasing the size of the memsome did not result in any further increase
in relaxivity. This behaviour of memsomes may be due to diffusion of the
paramagnetic chelates within the membrane.
Chapter 1
41
1.8.4 Micellar MRI contrast agents
Amphiphilic Gd-chelates with carbon chains that are more than 10 carbons long can
self assemble to form colloidal aggregates called micelles. These micelles are much
smaller (~5-30 nm) than liposomes (~20-400 nm). Micelles are often used as carriers
of poorly soluble pharmaceutical agents.40-41 As the micelles have hydrophilic heads
(i.e. Gd-chelates in our case) that point outwards and hydrophobic tails that point
inwards, the water exchange between the paramagnetic centre and the surrounding
bulk is not affected. The water exchange rates between the paramagnetic centre and
the surrounding bulk as determined for free Gd-chelates and micellar Gd-chelates
did not show any difference. Furthermore the supramolecular assembly formed as a
result of the micellar phenomenon has a relatively rigid structure. This increased
rigidity of supramolecular assembly increases the rotational correlational time τR,
which increases the relaxivity. Further increases in relaxivity could be achieved by
further increases in rigidity e.g. rigidity of micelles can be increased by incorporating
cholesterol molecules into the hydrophobic interior.25 Various ligands can be
coupled to the surface of such micelles in order to allow them to target specific sites.
Alternatively, mixed micelles can be used to get target specific contrast agents. For
example Accardo et al.42 described the micellar contrast agent formed from two
different surfactants. Both these surfactants have a C18 carbon chain; however one
surfactant has Gd-DTPA chelates at its hydrophilic end while the other surfactant has
no Gd-DTPA chelates (Figure 1.26). The surfactant without Gd-chelates has a strong
affinity for specific receptors (which are over expressed in many tumours).
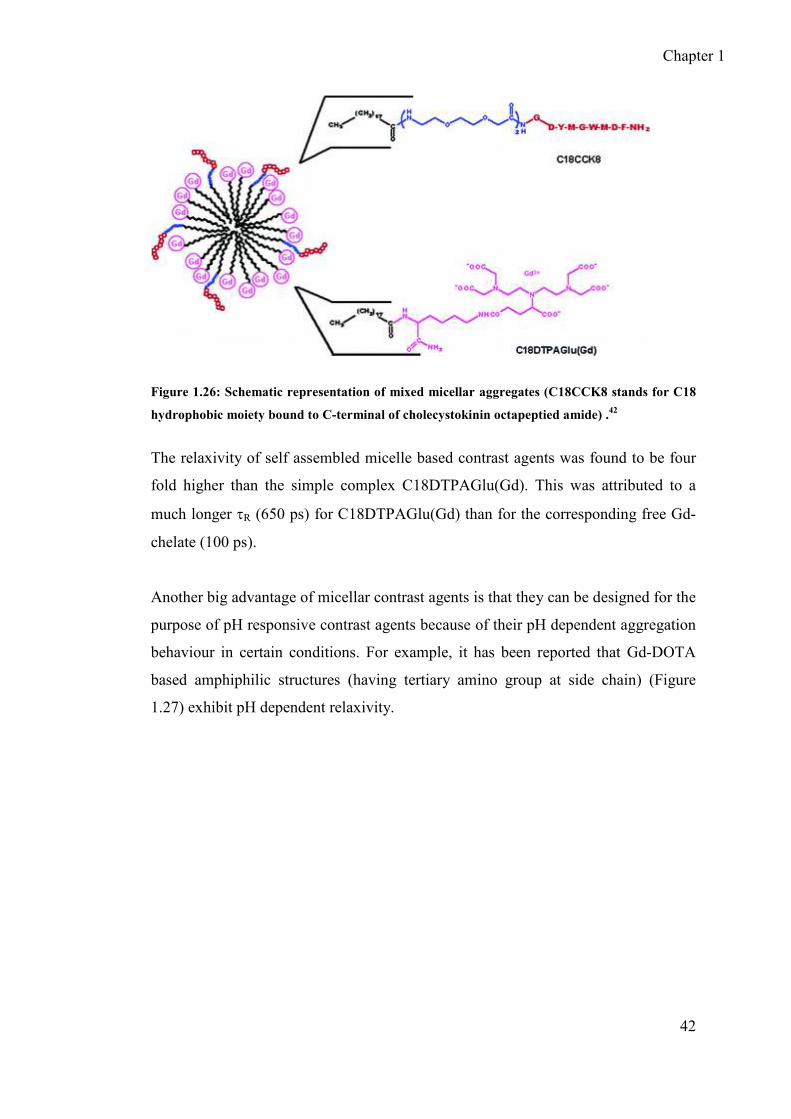
Chapter 1
42
Figure 1.26: Schematic representation of mixed micellar aggregates (C18CCK8 stands for C18
hydrophobic moiety bound to C-terminal of cholecystokinin octapeptied amide) .42
The relaxivity of self assembled micelle based contrast agents was found to be four
fold higher than the simple complex C18DTPAGlu(Gd). This was attributed to a
much longer τR (650 ps) for C18DTPAGlu(Gd) than for the corresponding free Gd-
chelate (100 ps).
Another big advantage of micellar contrast agents is that they can be designed for the
purpose of pH responsive contrast agents because of their pH dependent aggregation
behaviour in certain conditions. For example, it has been reported that Gd-DOTA
based amphiphilic structures (having tertiary amino group at side chain) (Figure
1.27) exhibit pH dependent relaxivity.

Chapter 1
43
N N
COOOOC
N N
OOC
NHO
C16H33
C16H33
Gd3+
Figure 1.27: Chemical structure of Gd-DOTA based chelate.
At lower pH (3-6) the relaxivity was relatively small (7.9 mM-1s-1), at higher pH (8-
10) an approximate three fold increase in relaxivity was observed. This increase is
attributed to the formation of colloidal aggregates of the deprotonated complex,
while no aggregation is suggested at lower pH (i.e. for the protonated or positively
charged complex). The presence of the tertiary amino group makes the overall
complex pH responsive. Consequently, by modifying the structures of the
amphiphilic Gd-chelates they can be made either pH-sensitive or pH-insensitive
contrast agents. The pH sensitive contrast agents have potential applications because
tumors usually have lower extracellular pH as compared to the normal tissues.
Unfortunately due to poor renal elimination problems associated with the liposomal
and micellar contrast agents they could not be approved for clinical use and so
researchers turned to dendrimers which are discussed in the next section. So far only
small molecule based CAs have been approved for clinical purpose.26
1.8.5 Dendritic MRI contrast agents
Dendrimers (discovered in 1980s by Donald Tomalia et al.43) are repeatedly
branched polymeric materials which possess three main parts, (a) core, (b) branches
and (c) end groups and usually they have a size in the range 1-10 nm (Figure 1.28).44

Chapter 1
44
N
N
N N
N N
N
N
N
N
H2N
NH2
NH2
NH2
NH2
NH2
NH2H2N
NH2
H2N
H2N
NH2
CoreBranches
Terminal Groups
Figure 1.28: Schematic representation of PAMAM (poly(amidoamine)) dendrimer.44
Dendrimers are actively used as drug delivery vehicles, in diagnostic studies and
tissue engineering etc.45-46 Due the feasibility of attaching multiple functionalities
(for instance, recognition vectors as well as Gd-chelates) to the same dendrimer
molecule, dendrimers are promising templates for MRI CAs. As dendritic CAs have
paramagnetic chelates at their termini, the water exchange rate will again not be
affected. Dendrimers have better efficiency / relaxivity than the liposomes and
micelles. Dendrimer relaxivity can be increased by increasing their size, on the other
hand the relaxivity of liposomes as well as micelles could not be increased by
increasing their size after a certain limit. The first report describing the feasibility of
using dendrimers as MRI CAs was published in 1994 by Wiener et al.47 They
prepared various generations of dendrimers containing Gd-chelates and described the
effect of generation on relaxivity (Figure 1.29).

Chapter 1
45
Figure 1.29: PAMAM based MRI contrast agent.
The Gd-DTPA chelates attached to the 6th generation of PAMAM dendrimer (MW:
139 kDa) exhibited about a six fold higher relaxivity than the free Gd-DTPA chelate
(0.55 kDa), which is due to restricted tumbling of GD-DTPA chelates at the termini
of the dendrimer molecule.48 The relaxivity measurements of Gd-DTPA chelates
attached to flexible polymers with similar MW did not show any increase in
relaxivity. There are several other literature reports related to dendrimer based MRI
contrast agents.49-55

Chapter 1
46
Dendrimer based contrast agents are excellent blood pool agents but their efficiency
can be further enhanced by attaching target specific vectors which will enable the
contrast agent to accumulate at the target site. Various groups such as
polysaccharides56, oligopeptides57, proteins58, antibodies59 and folic acid60 can be
attached at the periphery of the dendrimers as the recognition units.
There are some future challenges associated with dendrimer based contrast agents
and research in this regard is still in progress. For example, the optimal ratio between
targeting units and the Gd-chelates at the same dendrimer molecules is very
important for efficient output.
Another important class of chemical substances which attracted attention as potential
MRI CAs is zeolite and silica based nanomaterials which are discussed in the next
section.
1.8.6 Zeolite based contrast agents
Zeolites are microporous aluminosilicates with well defined pores (cavities) and
channels which can accommodate a wide variety of cations (such as Na+, K+, Mg2+,
Ca2+ etc). The ability of these materials to easily exchange with other cations61 led to
their applications as ion exchange beds for water purification. Zeolites are also used
as food additives as well as in personal care, thus their non-toxicity is already proven
and hence they can be used as MRI CA templates.61-69 Zeolites being microporous in
nature, have exceptionally high internal surface area which leads to their high
adsorption capacities. The main purpose of selecting zeolites and silica is to increase
immobilization of paramagnetic ions by attaching / adsorbing them to the inner side
of their cavities / pores. This increase in immobilization will lead to enhanced
relaxivity, which might be better than for dendrimer and micelle based contrast
agents.70 For example, Platas-Iglesias and co-workers64 described the Gd3+-doped
zeolite NaY nanoparticles with 80-100 nm diameter as high relaxivity MRI contrast
agents. Zeolite NaY is composed of eight sodalite cages which are linked with a
large central cavity called a supercage with diameter 0.74 nm (Figure 1.30).

Chapter 1
47
Sodalite cages
Supercage (Central Cavity)
Figure 1.30: Schematic illustration of water exchange between Gd-loaded Zeolites and
bulk solvent: “A” represents water coordinated to the Gd, “B” represents an intra-
framework water molecule and “C” are bulk water molecules.64
Different amounts of Gd3+ were incorporated into the central cavity of zeolite NaY
and the effect of [Gd3+] on the relaxivity was explored and very interesting
observations found. It was reported that relaxivity was decreased with increased
Gd3+ content. The maximum relaxivity by Gd-doped zeolites was found to be 37.7
mM-1s-1 (per Gd ion) for a 1.3 Gd3+ Wt% loading which is about nine fold higher
than that for the Gd-DTPA (at the same field strength). The increased relaxivity with
low Gd3+ content was supported by a ca. 25 times longer τR for the Gd3+ ions which
were immobilized in the interior cavity of the zeolite as compared to free Gd3+ ions
in aqueous. Another important parameter which played a role in the increased
relaxivity is the number of Gd3+ coordinated water molecules (q). As in the zeolites,
the Gd3+ ions are immobilized (rather than Gd-chelates), therefore about eight water
molecules are expected to coordinate per Gd3+ ion. This high number of q, and of
course τR, are responsible for the higher relaxivity of zeolites based contrast agents.
But the decrease in relaxivity with the increased Gd content might be due to several
factors. For example, the high Gd content might hinder the water exchange between
zeolite central cavity and the surrounding bulk solution. To increase the water
exchange rate between the paramagnetic centre and the bulk solution, lanthanides

Chapter 1
48
were incorporated into the framework of zeolites rather than into cavities (pores).67
But still the relaxivity of zeolite based contrast agents was limited by the slow water
exchange rate between the paramagnetic centre and the bulk solution. This
unexpected behaviour is attributed to the long distance between lanthanide ions in
the framework and the water molecules present in the central cavities. Due to this
large gap, the magnetic moment propagation between paramagnetic lanthanide ions
and the surrounding water protons via water molecules present in the pores of the
zeolites was hindered which decreased the relaxivity.
A unique feature of zeolite based contrast agents is the hydration number q. In the
zeolites, lanthanide ions (such as Gd3+ etc) are incorporated which can have upto
eight water molecules, on the other hand in liposomes and micelles Gd-chelates are
immobilized which have only one water molecule coordinated to the Gd-chelates.
In general, lanthanide ions (rather than lanthanides chelates) could be immobilized
on the interior cavities of the zeolites, but the water exchange rate between the
paramagnetic centre and the surrounding bulk water protons via zeolite channels
were greatly reduced due to the narrow size of the channels. The reduction in water
exchange rate directly affected the relaxivity of lanthanide loaded zeolites. However,
this problem can be solved using mesoporous materials (e.g. mesoporous silica)
which have relatively wider channel diameters of as discussed in the next section.
1.8.7 Mesoporous silica based contrast agents
Mesoporous silica has pores in the range of 2-50 nm and was first prepared by
researchers in Japan in 1990. Due to the relatively large pore size, as compared to
zeolites, and several other characteristics like non-toxicity, biocompatibility, surface
modification etc, mesoporous silica can be used as MRI contrast agents.71-74 The
relatively large pore size might solve the problem of slow water exchange which was
exhibited by zeolite based contrast agents and the immobilization of Gd-chelates on
their surface may exhibit better relaxivity than the liposome and dendrimer based
contrast agents. Recently, Taylor et al.73 described relaxivity measurements of
mesoporous silica based contrast agents. The mesoporous nanospheres (MSNs)
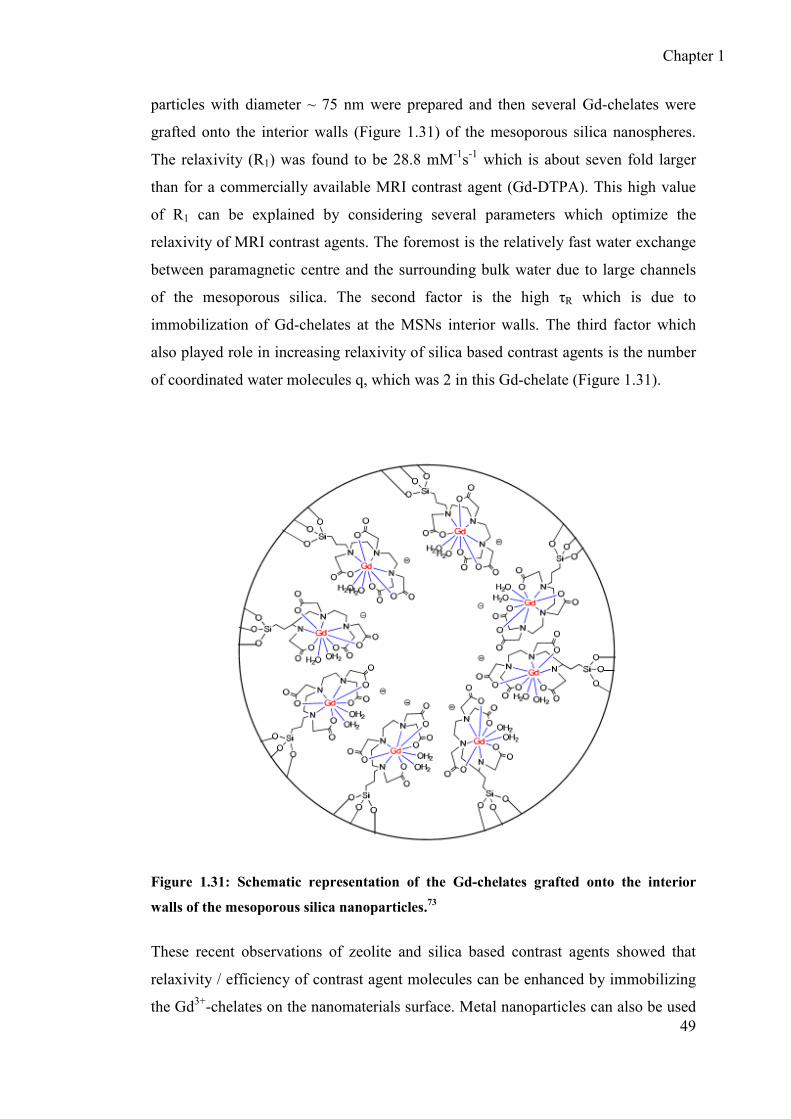
Chapter 1
49
particles with diameter ~ 75 nm were prepared and then several Gd-chelates were
grafted onto the interior walls (Figure 1.31) of the mesoporous silica nanospheres.
The relaxivity (R1) was found to be 28.8 mM-1s-1 which is about seven fold larger
than for a commercially available MRI contrast agent (Gd-DTPA). This high value
of R1 can be explained by considering several parameters which optimize the
relaxivity of MRI contrast agents. The foremost is the relatively fast water exchange
between paramagnetic centre and the surrounding bulk water due to large channels
of the mesoporous silica. The second factor is the high τR which is due to
immobilization of Gd-chelates at the MSNs interior walls. The third factor which
also played role in increasing relaxivity of silica based contrast agents is the number
of coordinated water molecules q, which was 2 in this Gd-chelate (Figure 1.31).
Figure 1.31: Schematic representation of the Gd-chelates grafted onto the interior
walls of the mesoporous silica nanoparticles.73
These recent observations of zeolite and silica based contrast agents showed that
relaxivity / efficiency of contrast agent molecules can be enhanced by immobilizing
the Gd3+-chelates on the nanomaterials surface. Metal nanoparticles can also be used
Chapter 1
50
as templates for MRI contrast agents because of their several unique features e.g.
metal nanoparticles are non-toxic, Gd-chelates can be adsorbed on the surface of the
nanoparticles rather than on the interior walls as in zeolites and silica based contrast
agents. In addition, various recognition vectors can be attached to Gd-chelates on the
surface of metal nanoparticles etc.
1.8.8 Metal nanoparticles based contrast agents in MRI
Metal nanoparticles (or metal colloids) attract much attention due to their unique
electronic and optical properties which are highly size dependent. The nanoparticles
have large surface to volume ratios and hence the behaviour of surface atoms is
different from the atoms inside the nanoparticle. This different behaviour of surface
atoms (and hence electrons) is responsible for several unique properties of
nanoparticles.75-76 For example, the optical properties of gold nanoparticles are size
dependent. They exhibit a wide range of colours from bright red (smallest particles)
to purple and blue (largest particles) depending upon the size of particle. Due to the
change in size, the frequency of the oscillating surface electrons is changed which
affects the colour of nanoparticle. Interestingly, the colour of the particles not only
depends on their size, but also on the shape of the particles and refractive index of
the medium. As metal nanoparticles exhibit intense colours, they can be used as
pigments for glasses and ceramics.77-78 They have also many other applications in
catalysis, nanoelectronics, medical diagnosis and therapy etc. However, we will limit
our discussion to the gold nanoparticle applications in medical diagnosis and
therapy, especially as MRI contrast agents.
1.8.9 Gold nanoparticle based MRI contrast agents
Gold nanoparticles (or colloidal gold) have been used in medicine for revitalization
and longevity since prehistoric times (i.e. ancient China and India). In Europe they
were used as a nerve tonic and as a drug for epilepsy and syphilis.79-80 In the modern
period, gold nanoparticles have a wide range of applications in medical science and

Chapter 1
51
in catalysis because of their non-toxic behaviour and good resistance to oxidation.
They are easy to synthesize, their size can be tuned easily and a wide range of
stabilizing agents can be attached at the gold nanoparticles surface. Gold
nanoparticles are the most stable metal nanoparticles.81 For example, gold
nanoparticles modified by gum arabic (GA) were reported82 as contrast agents for
computed tomography (Figure 1.32) after evaluation of their toxicity and stability
behaviour.
Figure 1.32: Synthesis of gold nanoparticles stabilised by GA.82
The contrast enhancement studies showed that gold due to high atomic number (Z)
and greater absorption coefficient than iodine can be used as contrast agent in CT
imaging. Gold nanoparticles are also reported in cellular imaging studies using light
scattering phenomenon,83 photothermal cellular damage,84 as DNA carrier for gene
therapy85 etc but we will focus our discussion on the recent reports of gold
nanoparticle based MRI contrast agents.
1.8.9.1 Gold nanoparticles protected by multilayered Gd-chelates
In 2006, a group in France (Prof. Roux et al.)86-87 pioneered the design of gold
nanoparticles for the purpose of MRI contrast agents. They synthesized dithiolated-
DTPA multilayered gold nanoparticles with diameter 2-2.5 nm. These multilayered
nanoparticles could accommodate ca. 150 gadolinium ions per nanoparticle (Figure
1.33). The T1-weighted images and relaxation measurements showed that these gold
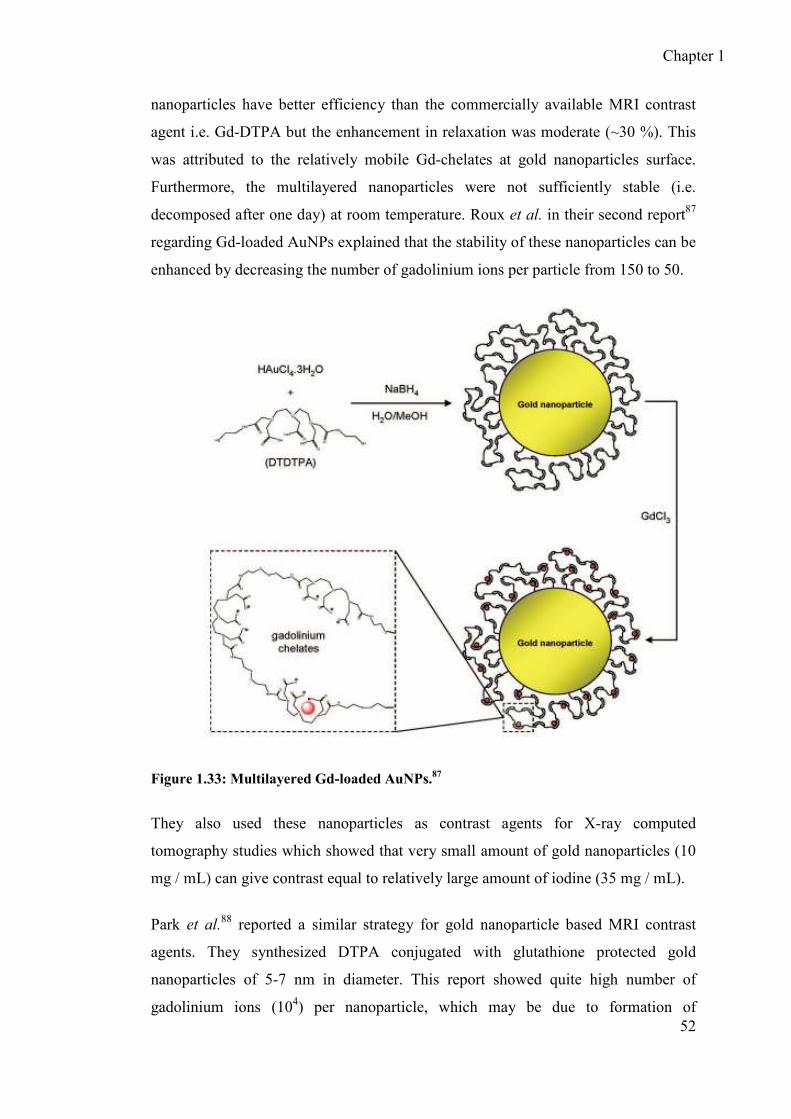
Chapter 1
52
nanoparticles have better efficiency than the commercially available MRI contrast
agent i.e. Gd-DTPA but the enhancement in relaxation was moderate (~30 %). This
was attributed to the relatively mobile Gd-chelates at gold nanoparticles surface.
Furthermore, the multilayered nanoparticles were not sufficiently stable (i.e.
decomposed after one day) at room temperature. Roux et al. in their second report87
regarding Gd-loaded AuNPs explained that the stability of these nanoparticles can be
enhanced by decreasing the number of gadolinium ions per particle from 150 to 50.
Figure 1.33: Multilayered Gd-loaded AuNPs.87
They also used these nanoparticles as contrast agents for X-ray computed
tomography studies which showed that very small amount of gold nanoparticles (10
mg / mL) can give contrast equal to relatively large amount of iodine (35 mg / mL).
Park et al.88 reported a similar strategy for gold nanoparticle based MRI contrast
agents. They synthesized DTPA conjugated with glutathione protected gold
nanoparticles of 5-7 nm in diameter. This report showed quite high number of
gadolinium ions (104) per nanoparticle, which may be due to formation of
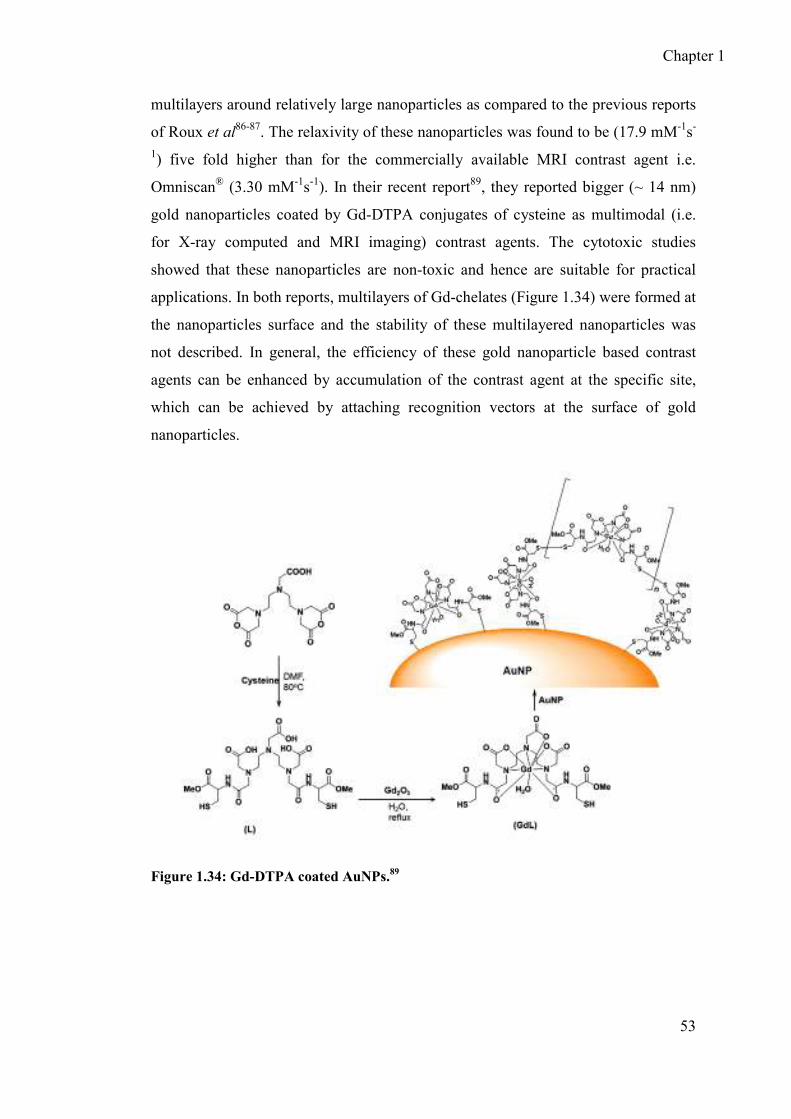
Chapter 1
53
multilayers around relatively large nanoparticles as compared to the previous reports
of Roux et al86-87. The relaxivity of these nanoparticles was found to be (17.9 mM-1s-
1) five fold higher than for the commercially available MRI contrast agent i.e.
Omniscan® (3.30 mM-1s-1). In their recent report89, they reported bigger (~ 14 nm)
gold nanoparticles coated by Gd-DTPA conjugates of cysteine as multimodal (i.e.
for X-ray computed and MRI imaging) contrast agents. The cytotoxic studies
showed that these nanoparticles are non-toxic and hence are suitable for practical
applications. In both reports, multilayers of Gd-chelates (Figure 1.34) were formed at
the nanoparticles surface and the stability of these multilayered nanoparticles was
not described. In general, the efficiency of these gold nanoparticle based contrast
agents can be enhanced by accumulation of the contrast agent at the specific site,
which can be achieved by attaching recognition vectors at the surface of gold
nanoparticles.
Figure 1.34: Gd-DTPA coated AuNPs.89
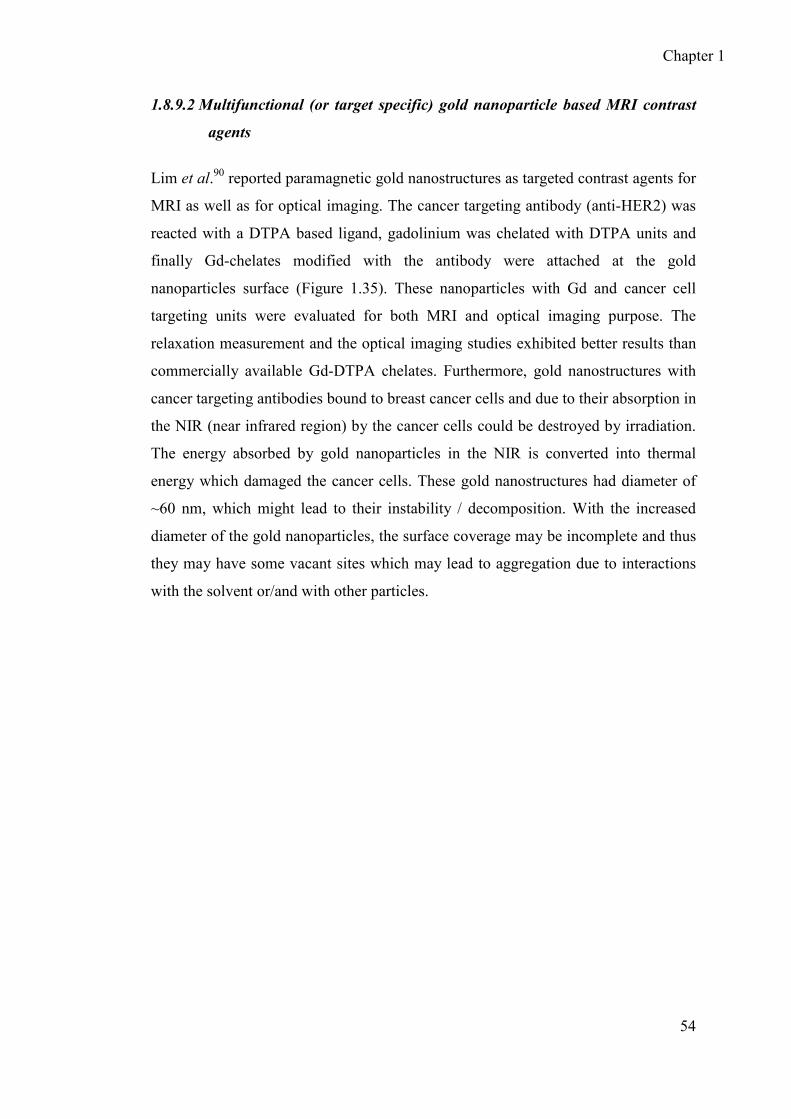
Chapter 1
54
1.8.9.2 Multifunctional (or target specific) gold nanoparticle based MRI contrast
agents
Lim et al.90 reported paramagnetic gold nanostructures as targeted contrast agents for
MRI as well as for optical imaging. The cancer targeting antibody (anti-HER2) was
reacted with a DTPA based ligand, gadolinium was chelated with DTPA units and
finally Gd-chelates modified with the antibody were attached at the gold
nanoparticles surface (Figure 1.35). These nanoparticles with Gd and cancer cell
targeting units were evaluated for both MRI and optical imaging purpose. The
relaxation measurement and the optical imaging studies exhibited better results than
commercially available Gd-DTPA chelates. Furthermore, gold nanostructures with
cancer targeting antibodies bound to breast cancer cells and due to their absorption in
the NIR (near infrared region) by the cancer cells could be destroyed by irradiation.
The energy absorbed by gold nanoparticles in the NIR is converted into thermal
energy which damaged the cancer cells. These gold nanostructures had diameter of
~60 nm, which might lead to their instability / decomposition. With the increased
diameter of the gold nanoparticles, the surface coverage may be incomplete and thus
they may have some vacant sites which may lead to aggregation due to interactions
with the solvent or/and with other particles.

Chapter 1
55
Figure 1.35: Schematic illustration of synthesis of targeted paramagnetic gold
nanostructures.90
Glyconanoparticles are particles which are protected by carbohydrates.
Multifunctional gold nanoparticles (with diameter 2-4 nm) protected by sugar
conjugates of β-glucose (glycC2S and glycC5S), β-galactcose (galC5S), and β-lactose
(lacC5S) have recently been studied as MRI CAs.91 Some sugar conjugates have Gd-
chelates at their ends while the sugar conjugates without Gd-chelates may serve as
recognition vectors. The in vivo imaging studies confirmed that glycC5SAuNPs
enhanced the contrast in tumoral zone while the other AuNPs (such as lacC5SAuNPs
etc) did not show any affinity for the tumors. The relaxivities of most of these
paramagnetic glyconanoparticles was higher than for the corresponding small
molecule Gd-chelate. The interesting observation is that the relaxivity of these
glyconanoparticles can be tuned by changing the nature of sugar moiety and length
of the linker (Figure 1.36).

Chapter 1
56
Figure 1.36: Thiol-ending sugar conjugates and the corresponding paramagnetic
glyconanoparticles.91
It has been found that the gold core of gold nanoparticles can exhibit paramagnetism
under certain conditions.92 This paramagnetism of the gold core may contribute to
the overall relaxivity of Gd-chelates attached to the gold nanoparticles surface. In all
previous reports on gold nanoparticle based MRI contrast agents86-88, 90-91, the
contribution of this paramagnetism from the gold core to the magnetic moment of
Gd3+ (and thus to the relaxivity) was not explored. Recently, Moriggi and co-
workers93 reported that gold nanoparticles do not contribute significantly to the
magnetic moment of Gd3+ ions at the gold nanoparticles surface. They prepared Gd-
coated and Ytterbium(Y)-coated gold nanoparticles with diameter ~ 5.0 nm, the
magnetic moment (µeff) of Gd in these Gd-chelated AuNPs was found 7.94BM
(which is exactly equal to the magnetic moment of free Gd3+), while no magnetic
moment was detected in Y-coated AuNPs. Thus it was proved that in Gd-loaded
AuNPs, there is no contribution of gold core paramagnetism to the overall relaxivity
of surrounding water protons.
In all reports of gold nanoparticle based contrast agents, it has been found that
several gadolinium ions can be loaded per particles and these contrast agents gave
Chapter 1
57
better relaxivity (presumably due to relatively slow tumbling of Gd-chelates at
nanoparticles surface) and T1 contrast in MRI images. In many reports86-89
multilayers of Gd-chelates were formed at nanoparticles surface, which might not
favour the stability issues of these nanostructures. Few reports87, 89 showed the
applicability of these gold nanoparticle based contrast agents for X-ray CT imaging
because nanoparticles have longer circulation time than iodine, they are non-toxic
and various targeting vectors can be attached at the gold nanoparticles surface.
1.9 Aim of the project
Gold nanoparticles as templates for MRI contrast agents were selected due to their
highest stability among metal nanoparticles, low toxicity and strong resistance
against oxidation. When the projected was started, there were no published reports in
the literature regarding gold nanoparticle based contrast agents, hence our main aim
was to synthesize and characterize new DTPA ligands which can chelate with
gadolinium ions on one end and then can bind to the gold surface on the other end to
give us gold nanoparticle based MRI contrast agents. In the very beginning of the
project (i.e. in 2006), the first report regarding gold nanoparticles based MRI CAs
appeared in the literature.86 That report dealt with multilayered gold nanoparticles
which were highly unstable. We then decided to continue with our aim to synthesize
and characterise more stable monolayer protected gold nanoparticles as MRI CAs.
Furthermore targeted specific gold nanoparticles based MRI CAs had also not been
explored at that time, therefore one direction of our project was to attach some
recognition vectors to the Gd-loaded AuNPs and to test their recognition studies. The
synthesis of monolayer protected AuNPs with and without recognition vectors and
their relaxivity measurements and imaging studies will be discussed in chapter 2.
As the project proceeded, a few more reports88, 90-91, 93 on gold nanoparticle based
MRI CAs were published. The relaxivity measurements of our monolayer Gd-loaded
AuNPs were found similar to the recent reports. The relaxivity values of Gd-loaded
AuNPs were not found much higher than for small molecule CAs. This relatively
low relaxivity of gold nanoparticle based MRI CAs warranted a mechanistic

Chapter 1
58
investigation which was lacking in the literature. Therefore, it was decided to explore
the main factor responsible for relatively poor relaxivity exhibited by gold
nanoparticle based contrast agents which is discussed in chapter 3 of this thesis.
Another important aim of the project was to synthesize and characterise redox
sensitive contrast agents for MRI applications. To achieve this goal, nitroxide radical
based ligand was used to form monolayer at the surface of gold nanoparticles and
then they were characterised and studied for the purpose of redox sensitive MRI CAs
and will be discussed in chapter 4.
Apart from applications as MRI contrast agents, the gold nanoparticles were also
studied as optical imaging contrast agents after replacing Gd3+ with other lanthanides
such as Tb3+ and Eu3+. The study was finally extended to apply gold nanoparticles as
model compounds for heterogeneous systems for distance measurements between
paramagnetic radical and metal ions which were attached at the gold nanoparticles
surface. The luminescence studies (for the purpose of optical imaging) and some
other useful application of lanthanide-loaded nitroxide labelled AuNPs are discussed
in chapter 5.
Chapter 6 contains overall conclusions of the project and some possible future
directions of the project and chapter 7 describes experimental procedures.

Chapter 1
59
1.10 References
1. P. Caravan, Chem. Soc. Rev., 2006, 35, 512-523.
2. P. Caravan, Acc. Chem. Res., 2009, 42, 851-862.
3. P. C. Lauterbur, Nature, 1973, 242, 190-191.
4. R. B. Lauffer, Chem. Rev., 1987, 87, 901-927.
5. M. Bottrill, L. Kwok and N. J. Long, Chem. Soc. Rev., 2006, 35, 557-571.
6. C. Westbrook, C. K. Roth and J. Talbot, MRI in Practice, Blackwell
Publishing, 2006, 3, Ch. 1.
7. T. D. W. Claridge, High-Resolution NMR Techniques in Organic Chemistry,
Elsevier, 1999, 19, Ch. 2.
8. R. S. Macomber, A complete Introduction to Modern NMR Spectroscopy,
Jhon Wiley & Sons, 1998, Ch.1.
9. J. Keeler, Understanding NMR Spectroscopy, Wiley, 2002, Ch. 8.
10. H. Friebolin, Basic One and Two Dimensional NMR spectroscopy, VCH
1990, 2, Ch. 1.
11. I. L. Pykett, B. R. Rosen, F. S. Buonanno and T. J. Brady, Phys. Med. Biol.,
1983, 28, 723-729.
12. M. A. Brown and R. C. Semelka, MRI Basic Principles and Applications,
Jhon Wiley and Sons 2003, Ch. 4.
13. D. Weishaupt, V. D. Kochli and B. Marincek, How Does MRI Work?,
Springer, 2006, 2, Ch. 4.
14. V. Kuperman, Magnetic Resonance Imaging, Academic Press, 2000, Ch. 3.
15. C. Westbrook, C. K. Roth and J. Talbot, MRI in Practice, Blackwell
Publishing, 2005, 3, Ch. 2.

Chapter 1
60
16. L. Brateman, Am. J. Roentgenol., 1986, 146, 971-980.
17. F. Bloch, W. W. Hansen and M. Packard, Phys. Rev., 1946, 70, 474-485
18. P. C. Lauterbur, M. H. Mendoca-Dias and A. M. Rudin, Frontiers of
Biological Energtics, Academic Press, New York, 1978, p. 752.
19. N. Bloembereg, E. M. Purcell and R. V. Pound, Phys. Rev., 1948, 73, 678-
693.
20. I. Solomon, Phys. Rev., 1955, 99, 559-565.
21. R. E. Connick and D. Fiat, J. Chem. Phys., 1966, 44, 4103-4107.
22. R. G. Egdell, M. H. Palmer and R. H. Findlay, Inorg. Chem., 1980, 19, 1314-
1319.
23. V. M. Runge, J. A. Clanton, C. M. Lukehart, C. L. Partain and A. E. James,
Am. J. Roentgenol., 1983, 141, 1209-1215.
24. A. Bianchi, L. Calabi, F. Corana, S. Fontana, P. Losi, A. Maiocchi, L. Paleari
and B. Valtancoli, Coord. Chem. Rev., 2000, 204, 309-393.
25. A. J. L. Villaraza, A. Bumb and M. W. Brechbiel, Chem. Rev., 2010, 110,
2921-2959.
26. S. Langereis, A. Dirksen, T. M. Hackeng, M. H. P. v. Genderen and E. W.
Meijer, New J. Chem., 2007, 31, 1152-1160.
27. A. E. Merbach and E. Toth, The Chemistry of Contrast Agents in Medical
Magnetic Resonance Imaging, Jhon Wiley & Sons, 2001, Ch. 10.
28. C. Boyer, M. R. Whittaker, V. Bulmus, J. Liu and P. T. Davis, NPG Asia
Mater, 2010, 2, 23-30.
29. P. Caravan, A. V. Astashkin and A. M. Raitsimring, Inorg. Chem., 2003, 42,
3972-3974.
30. D. Waysbort and G. Navon, J. Chem. Phys., 1978, 68, 3074-3077.
Chapter 1
61
31. S. F. Oppenheim, G. R. Buettner and V. G. J. Rodgers, J. Membrane Sci.,
1996, 118, 133-139.
32. S. Langereis, Q. G. de Lussanet, M. H. P. van Genderen, W. H. Backes and
E. W. Meijer, Macromolecules, 2004, 37, 3084-3091.
33. S. Aime, D. D. Castelli, S. G. Crich, E. Gianolio and E. Terreno, Acc. Chem.
Res., 2009, 42, 822-831.
34. M. Brinkley, Bioconjugate Chem., 1992, 3, 2-13.
35. P. Caravan, J. J. Ellison, T. J. McMurry and R. B. Lauffer, Chem. Rev., 1999,
99, 2293-2352.
36. A. D. Bangham, M. M. Standish and J. C. Watkins, J. Mol. Biol., 1965, 13,
238-252.
37. J. C. Gore, H. D. Sostman and V. J. Caride, J Microencapsul, 1986, 3, 251-
264.
38. V. P. Torchilin, Mol. Med. Today, 1996, 2, 242-249.
39. S. L. Fossheim, A. K. Fahlvik, J. Klaveness and R. N. Muller, Magn. Reson.
Imaging, 1999, 17, 83-89.
40. V. P. Torchilin, Cell. Mol. Life Sci., 2004, 61, 2549-2559.
41. W. J. M. Mulder, G. J. Strijkers, G. A. F. v. Tilborg, A. W. Griffioen and K.
Nicolay, NMR Biomed., 2006, 19, 142-164.
42. A. Accardo, D. Tesauro, P. Roscigno, E. Gianolio, L. Paduano, G. D'Errico,
C. Pedone and G. Morelli, J. Am. Chem. Soc., 2004, 126, 3097-3107.
43. D. A. Tomalia, H. Baker, J. Dewald, M. Hall, G. Kallos, S. Martin, J. Roeck,
J. Ryder and P. Smith, Polym. J., 1985, 17, 117-132.
44. F. Zeng and S. C. Zimmerman, Chem. Rev., 1997, 97, 1681-1712.
45. M. Fischer and F. Vögtle, Angew. Chem. Int. Ed., 1999, 38, 884-905.
Chapter 1
62
46. S. Hecht and J. M. J. Fréchet, Angew. Chem. Int. Ed., 2001, 40, 74-91.
47. E. Wiener, M. W. Brechbiel, H. Brothers, R. L. Magin, O. A. Gansow, D. A.
Tomalia and P. C. Lauterbur, Magn.Reson.Med., 1994, 31, 1-8.
48. E. C. Wiener, F. P. Auteri, J. W. Chen, M. W. Brechbiel, O. A. Gansow, D.
S. Schneider, R. L. Belford, R. B. Clarkson and P. C. Lauterbur, J. Am.
Chem. Soc., 1996, 118, 7774-7782.
49. G. M. Nicolle, É. Tóth, H. Schmitt-Willich, B. Radüchel and A. E. Merbach,
Chem. Eur. J., 2002, 8, 1040-1048.
50. M. Kawa and T. Takahagi, J. Polym. Sci. Pt. B-Polym. Phys., 2004, 42, 2680-
2689.
51. V. C. Pierre, M. Botta and K. N. Raymond, J. Am. Chem. Soc., 2004, 127,
504-505.
52. D. A. Fulton, M. O'Halloran, D. Parker, K. Senanayake, M. Botta and S.
Aime, Chem. Comm., 2005, 474-476.
53. H. Kobayashi and M. W. Brechbiel, Adv. Drug Delivery Rev., 2005, 57,
2271-2286.
54. S. D. Swanson, J. F. Kukowska-Latallo, A. K. Patri, C. Y. Chen, S. Ge, Z. Y.
Cao, A. Kotlyar, A. T. East and J. R. Baker, Int. J. Nanomed., 2008, 3, 201-
210.
55. K. Nwe, L. H. Bryant and M. W. Brechbiel, Bioconjugate Chem., 2010, 21,
1014-1017.
56. M. L. Wolfenden and M. J. Cloninger, J. Am. Chem. Soc., 2005, 127, 12168-
12169.
57. I. v. Baal, H. Malda, S. A. Synowsky, J. L. J. v. Dongen, T. M. Hackeng, M.
Merkx and E. W. Meijer, Angew. Chem. Int. Ed., 2005, 44, 5052-5057.

Chapter 1
63
58. R. Kluger and J. Zhang, J. Am. Chem. Soc., 2003, 125, 6070-6071.
59. C. Wu, M. W. Brechbiel, R. W. Kozak and O. A. Gansow, Bioorg. Med.
Chem. Lett., 1994, 4, 449-454.
60. S. D. Konda, M. Aref, M. Brechbiel and E. C. Wiener, Invest. Radiol., 2000,
35, 50-57.
61. I. Bresinska and K. J. Balkus, Jr., J. Phys. Chem., 1994, 98, 12989-12994.
62. S. W. Young, F. Qing, D. Rubin, K. J. Balkus, J. S. Engel, J. Lang, W. C.
Dow, J. D. Mutch and R. A. Miller, JMRI-J. Magn. Reson. Imaging, 1995, 5,
499-508.
63. K. J. Balkus and J. M. Shi, Microporous Mater., 1997, 11, 325-333.
64. C. Platas-Iglesias, L. Vander Elst, W. Z. Zhou, R. N. Muller, C. Geraldes, T.
Maschmeyer and J. A. Peters, Chemistry-a European Journal, 2002, 8, 5121-
5131.
65. E. Csajbok, I. Banyai, L. Vander Elst, R. N. Muller, W. Z. Zhou and J. A.
Peters, Chemistry-a European Journal, 2005, 11, 4799-4807.
66. R. N. Muller, L. Vander Elst, A. Roch, J. A. Peters, E. Csajbok, P. Gillis and
Y. Gossuin, in Advances in Inorganic Chemistry - Including Bioinorganic
Studies, Vol 57, Elsevier Academic Press Inc, San Diego, 2005, vol. 57, pp.
239-292.
67. G. A. Pereira, D. Ananias, J. Rocha, V. S. Amaral, R. N. Muller, L. V. Elst,
E. Toth, J. A. Peters and C. Geraldes, J. Mater. Chem., 2005, 15, 3832-3837.
68. M. Norek, I. C. Neves and J. A. Peters, Inorg. Chem., 2007, 46, 6190-6196.
69. G. A. Pereira, M. Norek, J. A. Peters, D. Ananias, J. Rocha and C. Geraldes,
Dalton Trans., 2008, 2241-2247.
70. J. A. Thomas and B. Ballantyne, J. Am. Coll. Toxicol., 1992, 11, 259.
Chapter 1
64
71. J. K. Hsiao, C. P. Tsai, T. H. Chung, Y. Hung, M. Yao, H. M. Liu, C. Y.
Mou, C. S. Yang, Y. C. Chen and D. M. Huang, Small, 2008, 4, 1445-1452.
72. C.-P. Tsai, Y. Hung, Y.-H. Chou, D.-M. Huang, J.-K. Hsiao, C. Chang, Y.-C.
Chen and C.-Y. Mou, Small, 2008, 4, 186-191.
73. K. M. L. Taylor, J. S. Kim, W. J. Rieter, H. An, W. Lin and W. Lin, J. Am.
Chem. Soc., 2008, 130, 2154-2155.
74. B. G. Trewyn, J. A. Nieweg, Y. Zhao and V. S. Y. Lin, Chem. Eng. J., 2008,
137, 23-29.
75. P. D. C. Burda, J. Am. Chem. Soc., 2009, 131, 6642-6642.
76. Dmitrii F. Perepichka and F. Rosei, Angew. Chem. Int. Ed., 2007, 46, 6006-
6008.
77. G. Schmid, Clusters and Colloids: From Theory to Applications, Wiley-VCH,
1994, Ch. 2.
78. P. Mulvaney, Langmuir, 1996, 12, 788-800.
79. S. Mahdihassan, Am. J. Chin. Med., 1985, 13, 93-108.
80. D. G. Richards, D. L. McMillin, E. A. Mein and C. D. Nelson, Int. J.
Neurosci., 2002, 112, 31-53.
81. M.-C. Daniel and D. Astruc, Chem. Rev., 2003, 104, 293-346.
82. V. Kattumuri, K. Katti, S. Bhaskaran, Evan J. Boote, Stan W. Casteel,
Genevieve M. Fent, David J. Robertson, M. Chandrasekhar, R. Kannan and
Kattesh V. Katti, Small, 2007, 3, 333-341.
83. I. H. El-Sayed, X. H. Huang and M. A. El-Sayed, Nano Lett., 2005, 5, 829-
834.
84. I. H. El-Sayed, X. H. Huang and M. A. El-Sayed, Cancer Lett., 2006, 239,
129-135.
Chapter 1
65
85. M. Ohsaki, T. Okuda, A. Wada, T. Hirayama, T. Niidome and H. Aoyagi,
Bioconjugate Chem., 2002, 13, 510-517.
86. P.-J. Debouttière, S. Roux, F. Vocanson, C. Billotey, O. Beuf, A. Favre-
Réguillon, Y. Lin, S. Pellet-Rostaing, R. Lamartine, P. Perriat and O.
Tillement, Adv. Funct. Mater., 2006, 16, 2330-2339.
87. C. Alric, J. Taleb, G. L. Duc, C. Mandon, C. Billotey, A. L. Meur-Herland,
T. Brochard, F. Vocanson, M. Janier, P. Perriat, S. Roux and O. Tillement, J.
Am. Chem. Soc., 2008, 130, 5908-5915.
88. J.-A. Park, P. A. N. Reddy, H.-K. Kim, I.-S. Kim, G.-C. Kim, Y. Chang and
T.-J. Kim, Bioorg. Med. Chem. Lett., 2008, 18, 6135-6137.
89. J.-A. Park, H.-K. Kim, J.-H. Kim, S.-W. Jeong, J.-C. Jung, G.-H. Lee, J. Lee,
Y. Chang and T.-J. Kim, Bioorg. Med. Chem. Lett., 2010, 20, 2287-2291.
90. Y. T. Lim, M. Y. Cho, B. S. Choi, J. M. Lee and B. H. Chung, Chem.
Comm., 2008, 4930-4932.
91. M. Marradi, D. Alcantara, J. M. d. l. Fuente, M. L. Garcia-Martin, S. Cerdan
and S. Penades, Chem. Comm., 2009, 3922-3924.
92. I. Carmeli, G. Leitus, R. Naaman, S. Reich and Z. Vager, J. Chem. Phys.,
2003, 118, 10372-10375.
93. L. c. Moriggi, C. Cannizzo, E. Dumas, C. d. R. Mayer, A. Ulianov and L.
Helm, J. Am. Chem. Soc., 2009, 131, 10828-10829.

Chapter 2
66
2 Chapter 2: Synthesis and relaxivity measurements of
Gd-loaded gold nanoparticles
Part of the work described in this chapter is published in:
M. F. Warsi, R. W. Adams, S.B. Duckett and V. Chechik, Chem. Comm., 2010, 46 , 451-453.

Chapter 2
67
Chapter 2: Synthesis and relaxivity measurements of
Gd-loaded gold nanoparticles
2.1 Introduction
Gadolinium (Gd3+), a highly paramagnetic hard acid needs to be reacted with hard
ligands to yield a stable chelate, to be utilised as an MRI contrast agent. Lanthanides
form strong complexes with carboxylate ligands due to the hard nature of the
carboxylic acid groups.1 Polyaminopolycarboxylic acids are thus an important class
of chelating ligands which are often used to bind lanthanides (such as Gd3+, Eu3+ etc)
as well as cations of radionuclides e.g. 90Y (III), 212Bi(III) etc. For example,
diethylenetriaminepentaacetic acid (DTPA) is an octadentate chelating ligand
(Figure 2.1) which forms very stable complexes with metals. The X-ray
crystallography of DTPA complexes with metals e.g. Gd-DTPA, show that eight out
of the nine coordination sites of Gd3+ are occupied by DTPA i.e. three by N atoms
and five by COO- groups. The remaining ninth site is occupied by a water molecule
which plays a crucial role in ensuring high relaxivity of Gd-DTPA complexes.2
O
N
OH
O
HO
N
N
O
OH
O
OH
O OH
Figure 2.1: Chemical structure of diethylenetriaminepentaacetic acid (H5DTPA).
Other polyaminopolycarboxylates (as mentioned in chapter 1, section 1.5) can also
be used to chelate Gd3+. For instance, ethylenediaminetetraacetic acid (EDTA) is a
commercially available hexadentate chelate; in its Gd-EDTA complex, three water
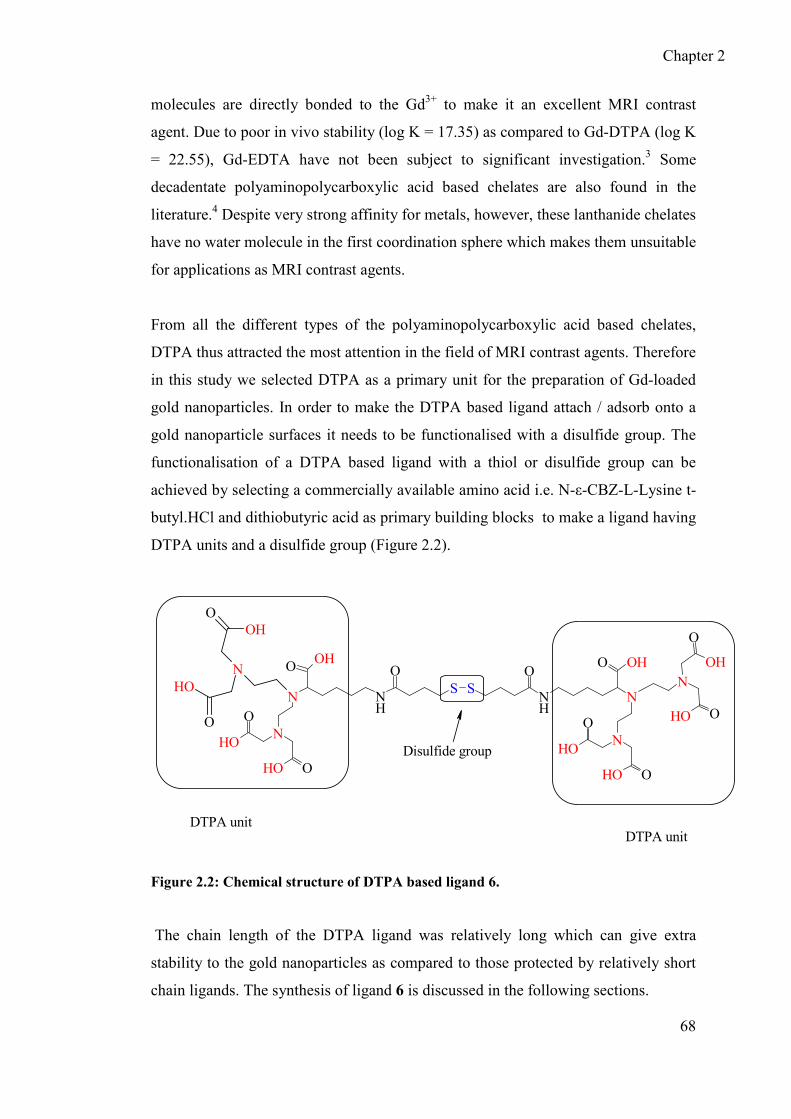
Chapter 2
68
molecules are directly bonded to the Gd3+ to make it an excellent MRI contrast
agent. Due to poor in vivo stability (log K = 17.35) as compared to Gd-DTPA (log K
= 22.55), Gd-EDTA have not been subject to significant investigation.3 Some
decadentate polyaminopolycarboxylic acid based chelates are also found in the
literature.4 Despite very strong affinity for metals, however, these lanthanide chelates
have no water molecule in the first coordination sphere which makes them unsuitable
for applications as MRI contrast agents.
From all the different types of the polyaminopolycarboxylic acid based chelates,
DTPA thus attracted the most attention in the field of MRI contrast agents. Therefore
in this study we selected DTPA as a primary unit for the preparation of Gd-loaded
gold nanoparticles. In order to make the DTPA based ligand attach / adsorb onto a
gold nanoparticle surfaces it needs to be functionalised with a disulfide group. The
functionalisation of a DTPA based ligand with a thiol or disulfide group can be
achieved by selecting a commercially available amino acid i.e. N-ε-CBZ-L-Lysine t-
butyl.HCl and dithiobutyric acid as primary building blocks to make a ligand having
DTPA units and a disulfide group (Figure 2.2).
N
O
O
OH
OH
NS
NNH
OHON
N
O
O
OH
OH
O
OOH
OHO
SNH
OO OHN
OHO
O
OH
DTPA unit
Disulfide group
DTPA unit
Figure 2.2: Chemical structure of DTPA based ligand 6.
The chain length of the DTPA ligand was relatively long which can give extra
stability to the gold nanoparticles as compared to those protected by relatively short
chain ligands. The synthesis of ligand 6 is discussed in the following sections.

Chapter 2
69
2.2 Synthesis of DTPA based ligand 6
The synthetic strategy for DTPA ligand 6 is depicted in Scheme 1. In the first step,
dialkylation of ethanolamine with an ester protected bromoacetate yielded
compound 1. The hydroxyl group was then converted into bromide to give
compound 2. The second dialkylation of commercially available N-ε-Cbz-L-
Lysine t-butyl ester with bromide 2 produced pentaester protected DTPA
analogue. The Cbz (benzoylcarboxy) protection was selected as it is orthogonal to
the t-Butyl protection therefore it can be removed easily by catalytic
hydrogenolysis to give pentaester protected DTPA analogue 4. The amino group
of the DTPA analogue 4 was then coupled with dithiobutyric acid to give the t-
butyl ester protected DTPA ligand 5. Dithiobutyric acid was selected to avoid
extra steps of protection and deprotection of thiol groups. In the last step, the
deprotection of t-butyl ester groups gave the target DTPA ligand 6.

Chapter 2
70
Scheme 1: Synthesis of DTPA based ligand 6
HONH2 Br
OtBu
O
HON
O
O
OtBu
1NaHCO3
DMF
BrN
O
O
OtBu
2
NH2O NHPh
OOtBuO
. HCl
pH 8.048 h
N
O
O
NN
O
OtBuO NHPh
O
3
HOOC SS COOH
RSS
O
R
O
R1SS
O
R1
O
5
TFA / DCM : 1 / 1
24-30 h
Pd (5.0 % on C)H2
6
NBS DCM
DCC + DMAP
EtOAc48 h
tBuO
tBuO
OtBu
OO
tBuO
tBuO
N
O
O
NN
O
OtBuNH2
4
OtBu
OO
tBuO
tBuO
tBuO
tBuO
NH
O
N
N
N
OtBu
O
O
O
OtBu
R =
O
OtBu
NH
HO O
N
N
N
O
HO
O
OHO
OH
R1 =
O
OH
tBuO
tBuO

Chapter 2
71
2.2.1 Synthesis of t-butyl ester protected DTPA analogue 3
Compounds 1 and 2 were prepared and purified by following the literature
procedure5 without any significant difference in yield.
Compound 3 was synthesized following the literature6 procedure. However, the
amphiphilic nature of compound 3 created some difficulties in its purification.
When the literature procedure was followed and the crude reaction product was
dissolved in DCM, washed with water and dried by anhydrous sodium sulphate,
~78 % material was lost. Silica gel flash chromatography led to 92 % loss of
product. To trace the lost material, the workup process was analyzed carefully.
Compound 3 could be lost during extraction from the aqueous phase. TLC and MS
data showed that extracting the crude material from aqueous phase with DCM did
not give any target material. NMR and TLC helped to trace the product losses to
the drying agent. The product was found to adsorb strongly to anhydrous sodium
sulphate. The second problem was traced to silica gel flash chromatography as
even after elution with very polar solvents (ethyl acetate and MeOH) no product
was collected from the column. But when the same purification was repeated using
silica gel of better quality (BDH), NMR, MS and TLC confirmed the successful
purification of compound 3 with good yield. The particle size in both grades of
silica gel was the same but the differences in the specific pore volume / surface
area and defect density might be responsible for irreversible adsorption of ligand
by a poorer grade silica gel.7
2.2.2 Deprotection of DTPA analogue 3
Hydrogenolysis of the t-butyl ester protected DTPA analogue 3 was carried out by
following the literature procedure6 to get compound 4. In the literature6, the flash
chromatographic purification of compound 4 was described using pure MeOH as
eluent. Compound 4, i.e. DTPA based primary amine, is basic and therefore could
adsorb on acidic sites of silica gel during flash chromatography. Indeed, a TLC of
crude product 4 in pure MeOH showed a long tail. However, well separated spots of
starting material and product were observed with slightly basic MeOH (i.e. with a

Chapter 2
72
few drops of Et3N). Therefore, compound 4 was purified using slightly basic MeOH.
The yield (72%) was higher than in the literature (60%).
2.2.3 Coupling of t-butyl ester protected DTPA analogue 4 with
dithiobutyric acid
Compound 5 (t-butyl ester protected DTPA based ligand) was synthesized using a
standard coupling procedure.8 The conversion of the carboxylic acid group into a
reactive acylating agent was achieved by using a coupling agent,
dicyclohexylcarbodiimide (DCC).9
The intermediate O-acyl urea that is formed during peptide coupling can undergo
rearrangement to form an N-acyl urea which is not reactive. The solution to this
problem is to use a nucleophilic catalyst alongside DCC. The commonly used
additives are 1-hydroxybenzotriazole (HOBt) and dimethylaminopyridine
(DMAP)10. We used DMAP due to its strong nucleophilicity. Compound 5 is a new
compound and it was characterized by MS and NMR. NMR peak assignments were
facilitated by using “SpecSurf” NMR prediction software that is available via the
chemistry database service at www.cds.dl.ac.uk.
2.2.4 Deprotection of t-butyl ester groups of DTPA based ligand 5
The t-butyl ester groups of compound 5 need to be removed in order to make the
ligand to chelate with Gd3+ ions. The deprotection also made the ligand water
soluble.
SNN
H
OHO
N
N
O
O
OH
OH
O
OOH
OHO
N
O
O
OH
OH
NS
NH
OO OH
NOH
O
O
OH
Figure 2.3: DTPA based ligand 6.
Chapter 2
73
The standard11,12 procedure for the deprotection of the t-butyl ester group includes
treatment of the desired reactant with a mixture of trifluoroacetic acid and
dichloromethane. We used a 1 / 1 ratio of TFA / DCM for the deprotection of the
t-butyl ester groups of DTPA based ligand 5. The main factor that we had to
optimise for the complete deprotection was the reaction time. The reaction was
monitored by taking 1H NMR spectra at regular time intervals; the 24-30 h period
was optimised for complete deprotection that gave us more than 70 % yield. After
the deprotection reaction, the crude product was quite soluble in water, which
confirmed the successful deprotection.
Compound 6 was purified by dialysing against deionised water using 500 MWCO
dialysis tubing. Purified compound 6 was characterized by MS and NMR
spectroscopy.
The 1H NMR spectra of compound 6 showed broadened peaks. This may be due to
the restricted tumbling of the large molecule (RMM 1130). The assigned 1H NMR
spectrum of compound 6 is shown in Figure 2.4. The complete deprotection is
indicated by complete absence of a t-butyl ester peak at 1.40 ppm. The 1H NMR
spectrum of compound 6 (Figure 2.4) will be referred to in the next section (2.3.2).

Chapter 2
74
Figure 2.4: 1H NMR spectrum of DTPA ligand 6.
2.3 Synthesis of water soluble AuNPs protected by DTPA based
ligand 6
Water soluble gold nanoparticles (AuNPs) protected by DTPA based ligand 6 were
prepared by modification of the Brust et al. protocol13 which involves the reduction
of metals in the presence of a stabilising agent. Brust’s protocol is a biphasic method
in which gold ions are transferred from the aqueous phase to the organic phase with
tetraoctylammonium bromide, a phase transfer agent. This is followed by reduction
of Au3+ in the presence of the stabilising / protecting agent in the organic phase. This
biphasic method is necessary if the protecting agents are soluble in the organic
medium. If the protecting agents are soluble in the aqueous medium, then gold
nanoparticles can be prepared by using a single phase method. As the DTPA ligand 6
was water soluble, therefore a single phase method was used.
0.0 0.0 0.50.5 1.01.0 1.51.52.0 2.0 2.52.53.03.0 3.53.54.04.04.5 4.55.0 5.0 5.55.5
4+5
D2O
3+9 14 12
2
6 + 7 + 8
13
S S 4 3
N
2 1
O
O HN 14
13 12
11NH10
9 8
7
6
5
OOH O
N
O O OH O H
O
OH
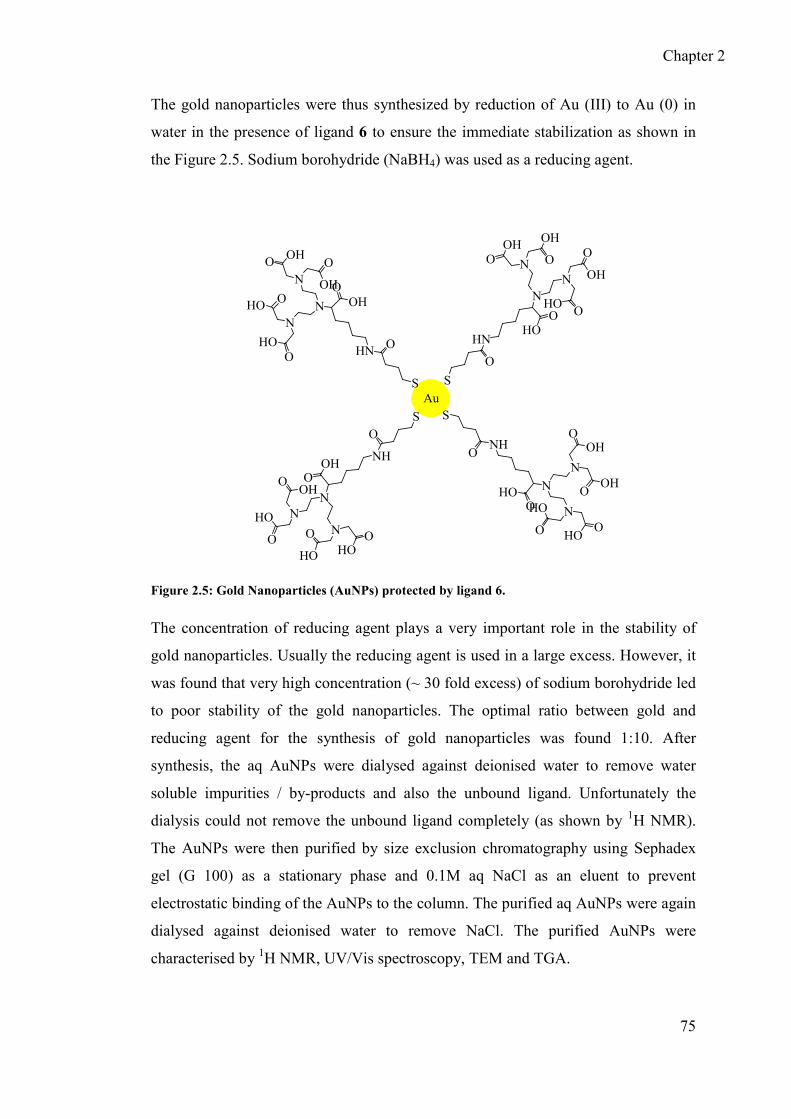
Chapter 2
75
The gold nanoparticles were thus synthesized by reduction of Au (III) to Au (0) in
water in the presence of ligand 6 to ensure the immediate stabilization as shown in
the Figure 2.5. Sodium borohydride (NaBH4) was used as a reducing agent.
Au
N OO
HO HO
N
S
NH
O
OOH
N
OHO
O
HO
N
O
OOH
OH
N
S
NHO
OHO
NHO
O OHO
N
O
OHO
HO
N
S
HN O
OOH
N OH
OOOH
NO O
OHOH
N
S
HN
O
OHO
N
HOO
O
OH
Figure 2.5: Gold Nanoparticles (AuNPs) protected by ligand 6.
The concentration of reducing agent plays a very important role in the stability of
gold nanoparticles. Usually the reducing agent is used in a large excess. However, it
was found that very high concentration (~ 30 fold excess) of sodium borohydride led
to poor stability of the gold nanoparticles. The optimal ratio between gold and
reducing agent for the synthesis of gold nanoparticles was found 1:10. After
synthesis, the aq AuNPs were dialysed against deionised water to remove water
soluble impurities / by-products and also the unbound ligand. Unfortunately the
dialysis could not remove the unbound ligand completely (as shown by 1H NMR).
The AuNPs were then purified by size exclusion chromatography using Sephadex
gel (G 100) as a stationary phase and 0.1M aq NaCl as an eluent to prevent
electrostatic binding of the AuNPs to the column. The purified aq AuNPs were again
dialysed against deionised water to remove NaCl. The purified AuNPs were
characterised by 1H NMR, UV/Vis spectroscopy, TEM and TGA.

Chapter 2
76
2.3.1 UV-Vis spectrum of AuNPs protected by DTPA ligand 6
Surface plasmon band (SPB) is the most distinct feature in the UV-Vis spectra of
noble metal (Cu, Ag & Au) nanoparticles. This peak is exhibited by particles having
d << λ (where d is the diameter of the nanoparticles and λ is the wavelength of
light).14 When light interacts with nanoparticles, the electric component of the light
induces the coherent oscillation of the surface electrons having frequency in the
range of visible region. The coherent oscillation of the surface electrons of the
nanoparticles is termed the Surface Plasmon Band (SPB). The interaction of the light
with the surface electrons of the nanoparticles is represented in Figure 2.6.
Figure 2.6: Origin of Surface Plasmon Band.15
In their UV-Vis spectra, AuNPs usually show a surface plasmon band (SPB) at 520-
525 nm.14-16 The SPB is strongly size dependent: with increase in AuNPs size, the
SPB is found to shift towards the longer wavelength. In nanoparticles with size less
than 1 nm, SPB is damped; SPB is also absent in bulk gold metal. The UV-Vis
spectrum of the AuNPs protected by ligand 6 showed a SPB at 520-525 nm (Figure
2.7) that confirmed the formation of gold nanoparticles. This intensity and position
of SPB (Figure 2.7) is typical for small alkanethiol protected AuNPs (~ 2.0 nm).17

Chapter 2
77
400 500 600 700 8000.0
0.1
0.2
0.3
0.4
0.5
Absorbance
Wavelength / nm
Figure 2.7: UV-Vis Spectrum of Gold Nanoparticles Stabilised by DTPA ligand 6.
2.3.2 1H NMR spectrum of AuNPs
NMR is a very important technique for the characterization of thiol based gold
nanoparticles. The major difference between the 1H NMR spectra of the free thiol
based ligand and that adsorbed at the gold nanoparticle surface is the lack of a peak
corresponding to the CH2 group adjacent to the S atom. This is due to the restricted
tumbling of ligands adsorbed at AuNPs surface. The peaks of the groups which are
further away from the AuNPs surface18-19 are also broadened. Restricted tumbling
leads to incomplete averaging of the anisotropic interactions and hence broadening
of peaks of thiol based ligands at AuNPs surface.
In the 1H NMR spectrum of gold nanoparticles protected by DTPA ligand 6, two
major changes were observed as compared with the 1H NMR spectrum of the free
ligand (Figure 2.8). The first change is the complete disappearance of the 1H peak of
the CH2S group. Secondly, all peaks became broader. These observations confirmed
the successful adsorption of ligand on the AuNPs surface. The peaks of ligand
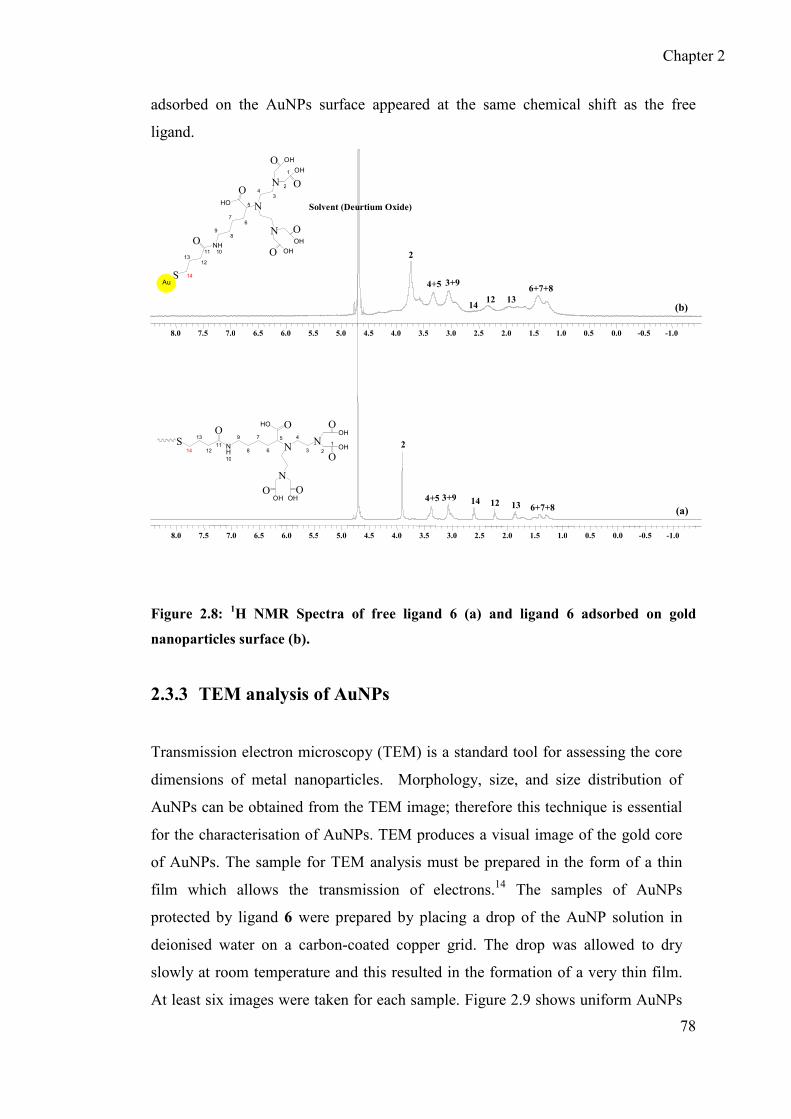
Chapter 2
78
adsorbed on the AuNPs surface appeared at the same chemical shift as the free
ligand.
Figure 2.8: 1H NMR Spectra of free ligand 6 (a) and ligand 6 adsorbed on gold
nanoparticles surface (b).
2.3.3 TEM analysis of AuNPs
Transmission electron microscopy (TEM) is a standard tool for assessing the core
dimensions of metal nanoparticles. Morphology, size, and size distribution of
AuNPs can be obtained from the TEM image; therefore this technique is essential
for the characterisation of AuNPs. TEM produces a visual image of the gold core
of AuNPs. The sample for TEM analysis must be prepared in the form of a thin
film which allows the transmission of electrons.14 The samples of AuNPs
protected by ligand 6 were prepared by placing a drop of the AuNP solution in
deionised water on a carbon-coated copper grid. The drop was allowed to dry
slowly at room temperature and this resulted in the formation of a very thin film.
At least six images were taken for each sample. Figure 2.9 shows uniform AuNPs
-1.0-0.50.00.51.01.52.02.53.03.54.04.55.05.56.06.57.07.58.0
-1.0-0.50.00.51.01.52.02.53.03.54.04.55.05.56.06.57.07.58.0
Solvent (Deurtium Oxide)
2
4+5 3+9
1412 13
6+7+8
2
4+5 3+9 14 12 13 6+7+8 (a)
(b)
N O OH
O OH
N 2
1
O
OH
O O H
S 14
1312
11NH
10
98
76
5
O
HO
O N
43
Au
N O
O H O OH
N 2
1
OOH
OOH
S 14
13
1211 N
H 10
9
8
7
6
5
O HO O
N 4
3

Chapter 2
79
distribution was achieved with reasonable application of dispersity. Nanoparticle
diameters were calculated from the particle areas by the mathematical formula
Diameter = [Area / π] ½× 2
The average diameter of the gold nanoparticles was found to be 1.75 nm ± 0.42,
which is comparable with those reported the literature20 for thiol protected AuNPs
prepared by a similar method.
0 1 2 3 4 5 6 70
10
20
30
40
50
Frequency
Diameter / nm
Figure 2.9: TEM image and histogram of AuNPs protected by ligand 6.
2.3.4 Thermogravimetric analysis (TGA) of AuNPs
Thermogravimetric analysis (TGA) determines the rate of change in the weight of
a material as a function of temperature in a controlled atmosphere (usually an inert
atmosphere). TGA measurements are used primarily to determine the composition
of materials and to predict their thermal stability at high temperature. The
technique can characterize materials that exhibit weight loss or gain due to
decomposition, oxidation, or dehydration. When gold nanoparticles protected by
organic ligands are heated, the organic ligands desorb from the AuNPs surface
leaving the gold core. The change in weight of AuNPs upon heating gives the
amount of organic ligand present on the AuNP surface. The AuNPs protected by
ligand 6 were accurately weighed (5.58 mg) and dried under vacuum for ca. 3-4
hours and submitted for TGA analysis. The TGA graph of AuNPs protected by
compound 6 is reported in Figure 2.10. The weight loss starts at ca. 200 oC. This
value is quite similar to values (200 oC) that are reported in the literature21 for
similar thiol protected AuNPs. Total weight loss calculated from the TGA graph

Chapter 2
80
corresponds to the loss of organic ligands from the nanoparticle surface. From
TGA analysis, the ratio between the gold and protecting ligand (compound 6) was
determined as 3.98:1 (Au: Ligand). This ratio allowed us to estimate the amount of
ligand present at AuNP surface which is needed for calculating gadolinium
loading. This composition of gold nanoparticles is similar to the simple
alkanethiol-protected gold nanoparticles having similar diameters. 22-23
0 100 200 300 400 500 600 70050
60
70
80
90
100
Weight / %
T / oC
Figure 2.10: TGA graph of gold nanoparticles protected by DTPA ligand 6.
2.4 Complexation of gadolinium (Gd3+) with DTPA ligand 6 at
AuNP surface
The characterised AuNPs protected by DTPA ligand 6 were loaded with gadolinium
to act as MRI contrast agents. The loaded gadolinium was complexed with DTPA
units of the ligand at AuNPs surface as shown in Figure 2.11.

Chapter 2
81
Au
N
O
O
O
O
NSHN
O OON
O
O
OO
Gd3+
2-
OH2
Figure 2.11: Gd-loaded AuNPs.
The amount of gadolinium for loading on AuNPs was calculated using the
composition of AuNPs as described in the previous (TGA) section. The protocol was
similar to that developed for Gd-complexation with similar AuNPs.24 To the
aqueous AuNPs protected by ligand 6, aqueous GdCl3 was added portion wise. The
excess amount of gadolinium was removed by dialysing the Gd-loaded AuNPs
against deionised water. The exact amount of gadolinium in Gd-loaded AuNPs was
then determined by ICP and UV-Vis spectroscopy independently and is discussed in
the following sections.
2.4.1 Determination of [Gd3+] using xylenol orange titration
A calibration curve for determination of [Gd3+] in Gd-loaded AuNPs was
determined by following the literature procedure.25 Xylenol orange is a weak
lanthanide chelating agent that can chelate with free gadolinium ions. Xylenol
orange exhibits two absorption peaks at 434 nm and 576 nm in the absence of any
lanthanide. In the presence of lanthanides, the intensity of the first peak at 434 nm
decreases while that at 575 nm increases. The ratio between the intensities of the
two peaks can be used for the quantitative determination of lanthanides (Gd3+ in
our case). The UV/Vis spectra of xylenol orange in the presence of various
concentrations of Gd-atomic standard solutions and the calibration curve built
using these spectra are shown in Figures 2.12 and 2.13, respectively.
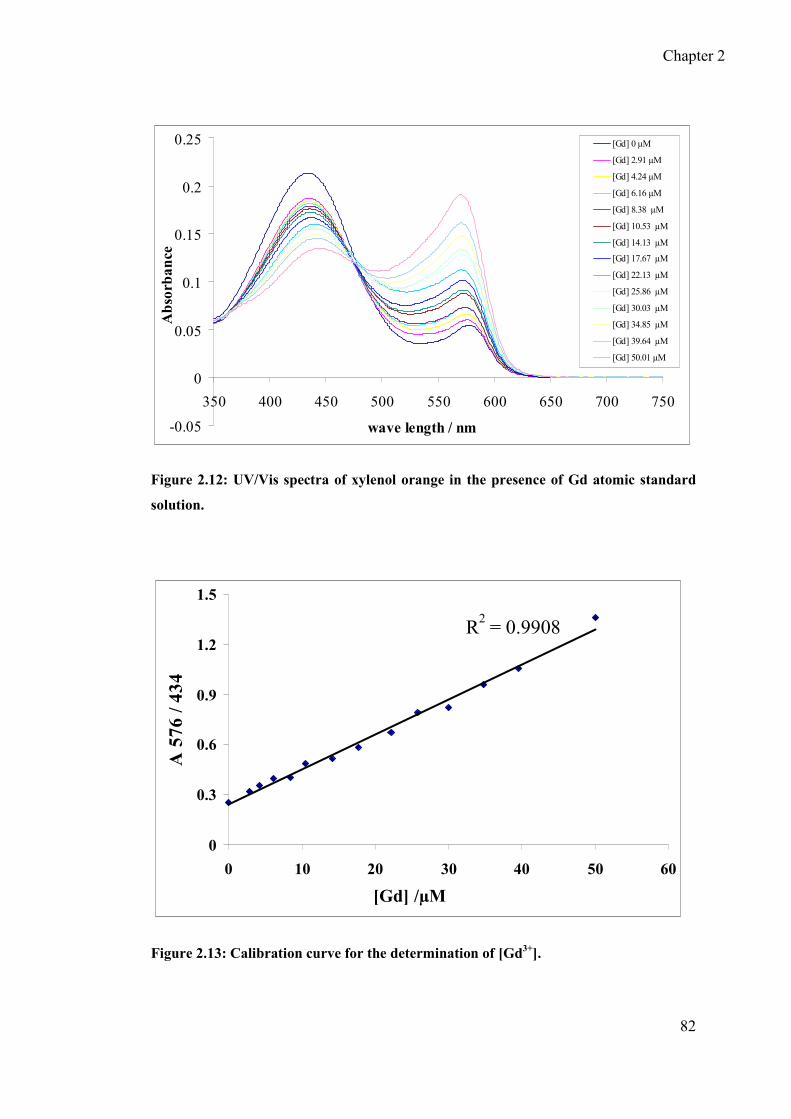
Chapter 2
82
-0.05
0
0.05
0.1
0.15
0.2
0.25
350 400 450 500 550 600 650 700 750
wave length / nm
Absorbance
[Gd] 0 µM
[Gd] 2.91 µM
[Gd] 4.24 µM
[Gd] 6.16 µM
[Gd] 8.38 µM
[Gd] 10.53 µM
[Gd] 14.13 µM
[Gd] 17.67 µM
[Gd] 22.13 µM
[Gd] 25.86 µM
[Gd] 30.03 µM
[Gd] 34.85 µM
[Gd] 39.64 µM
[Gd] 50.01 µM
Figure 2.12: UV/Vis spectra of xylenol orange in the presence of Gd atomic standard
solution.
R2 = 0.9908
0
0.3
0.6
0.9
1.2
1.5
0 10 20 30 40 50 60
[Gd] /µM
A 576 / 434
Figure 2.13: Calibration curve for the determination of [Gd3+].
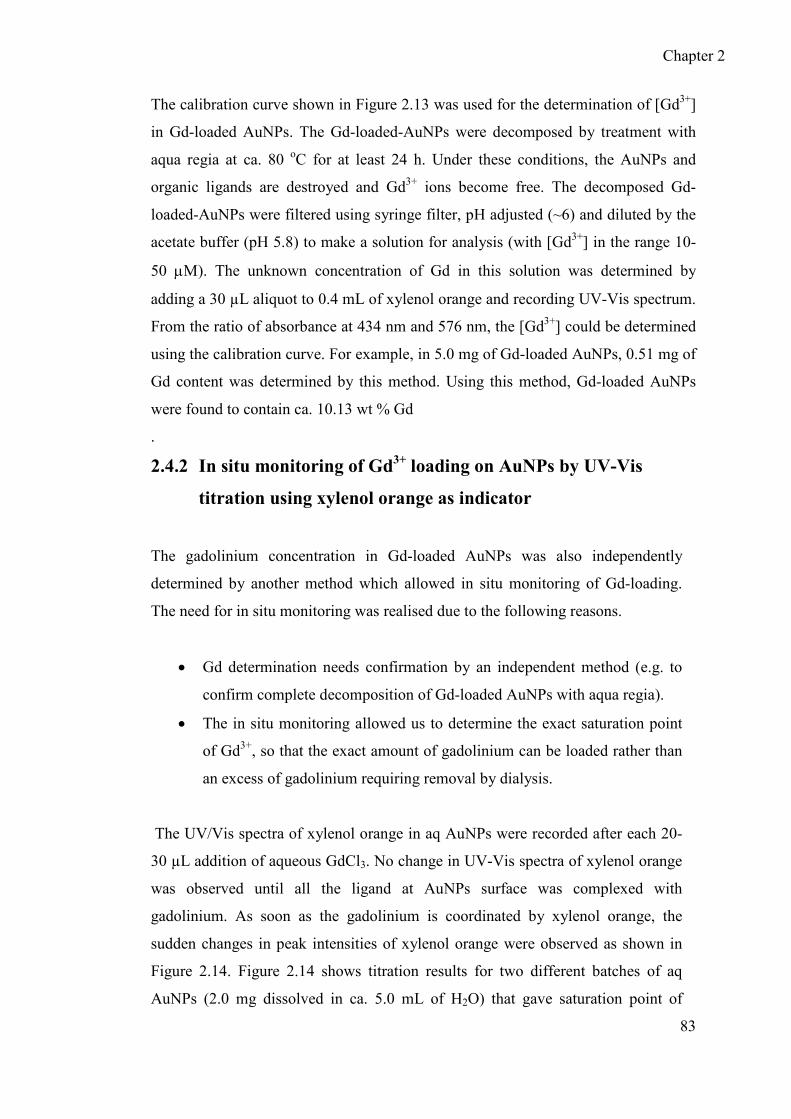
Chapter 2
83
The calibration curve shown in Figure 2.13 was used for the determination of [Gd3+]
in Gd-loaded AuNPs. The Gd-loaded-AuNPs were decomposed by treatment with
aqua regia at ca. 80 oC for at least 24 h. Under these conditions, the AuNPs and
organic ligands are destroyed and Gd3+ ions become free. The decomposed Gd-
loaded-AuNPs were filtered using syringe filter, pH adjusted (~6) and diluted by the
acetate buffer (pH 5.8) to make a solution for analysis (with [Gd3+] in the range 10-
50 µM). The unknown concentration of Gd in this solution was determined by
adding a 30 µL aliquot to 0.4 mL of xylenol orange and recording UV-Vis spectrum.
From the ratio of absorbance at 434 nm and 576 nm, the [Gd3+] could be determined
using the calibration curve. For example, in 5.0 mg of Gd-loaded AuNPs, 0.51 mg of
Gd content was determined by this method. Using this method, Gd-loaded AuNPs
were found to contain ca. 10.13 wt % Gd
.
2.4.2 In situ monitoring of Gd3+ loading on AuNPs by UV-Vis
titration using xylenol orange as indicator
The gadolinium concentration in Gd-loaded AuNPs was also independently
determined by another method which allowed in situ monitoring of Gd-loading.
The need for in situ monitoring was realised due to the following reasons.
• Gd determination needs confirmation by an independent method (e.g. to
confirm complete decomposition of Gd-loaded AuNPs with aqua regia).
• The in situ monitoring allowed us to determine the exact saturation point
of Gd3+, so that the exact amount of gadolinium can be loaded rather than
an excess of gadolinium requiring removal by dialysis.
The UV/Vis spectra of xylenol orange in aq AuNPs were recorded after each 20-
30 µL addition of aqueous GdCl3. No change in UV-Vis spectra of xylenol orange
was observed until all the ligand at AuNPs surface was complexed with
gadolinium. As soon as the gadolinium is coordinated by xylenol orange, the
sudden changes in peak intensities of xylenol orange were observed as shown in
Figure 2.14. Figure 2.14 shows titration results for two different batches of aq
AuNPs (2.0 mg dissolved in ca. 5.0 mL of H2O) that gave saturation point of

Chapter 2
84
gadolinium at the AuNPs surface at 235 µL concentration of GdCl3. According to
this data, 9.98 % the gadolinium content in AuNPs was determined by this
method which is in a very close agreement with that determined by the calibration
curve method (10.13 %) as described in the previous section.
Figure 2.14: Titration of AuNPs with [GdCl3] in the presence of xylenol orange.
2.4.3 Characterisation of Gd-loaded AuNPs by Inductively Coupled
Plasma Spectrometry (ICP)
Gd-loaded AuNPs were characterised by ICP to determine the amount of gold and
gadolinium. The ICP, TGA and UV/Vis data are summarised in Table 2.1.
0.05
0.2
0.35
0.5
0.65
0.8
0 100 200 300 400 500 600
GdCl3 / µL
A 576 / 434
Saturation Point of Gd @ AuNPs surface

Chapter 2
85
Table 2.1: ICP, TGA and UV/Vis data for Gd-loaded AuNPs.
Technique Element Composition / %
ICP Au 45.64
Gd 10.95
TGA Ligand 42.0
UV/Vis
Gd 10.13*
9.98**
*Determined by Calibration Curve Method, **By In situ monitoring method
The amount of gadolinium in Gd-loaded AuNPs determined by ICP analysis was
compatible with the amount of DTPA ligand 6 at the AuNP surface determined by
thermogravimetric analysis (42 %). Similarly, the amount of gadolinium determined
by UV/Vis method and ICP are in close agreement with each other. These data were
used to derive the composition of Gd-loaded AuNPs which is described in the next
section.
2.4.4 Composition of Gd-loaded AuNPs
On the basis of TEM, TGA, ICP and UV-Vis data, the composition of the Gd-loaded
AuNPs was determined. The average number of gold atoms per particle (166) were
determined from TEM data (i.e. 1.75 nm average diameter of AuNPs) by assuming
the same packing density of AuNPs as in bulk gold (eq. 2.1).17
fcc
AuAu nDN 3
6
π= Eq. 2.1

Chapter 2
86
Here NAu is the number of gold atoms in particle, D is the diameter of the AuNPs and
fcc
Aun is the packing density of gold (59.2 g / cm3). The ratio between gold and ligand
was estimated by TGA and then confirmed by ICP analysis and UV/Vis
spectroscopy. The ratio between Au, Gd and ligand was found as Au3.3 Ligand1.07
Gd1.0. As each nanoparticle contains 166 atoms, the composition of Gd-loaded
AuNPs was determined as Au166 Ligand54 Gd50.
2.4.5 Spin lattice relaxivity (r1) of Gd-loaded AuNPs, Gd-DTPA and
GdCl3
The longitudinal relaxation constant for the water 1H signal, T1, was measured in the
presence of Gd-DTPAligand@AuNPs, Gd-DTPA and GdCl3 using an inversion
recovery method (which has been discussed in detail in chapter 1 (section 1.5)).26
The T1 (spin lattice relaxation time) can be calculated using equation 2.2.
))/exp(21( 10 TMM z τ−−= Eq. 2.2
Here Mz is the longitudinal magnetisation, M0 is the equilibrium magnetisation and τ
is the variable time delay. All the relaxation measurements were carried out at
magnetic field 7.0 T with variable time delay “τ” ranging from 0.0001-6.0 s. The
inversion recovery curves for Gd-loaded AuNPs are shown in Figure 2.15.
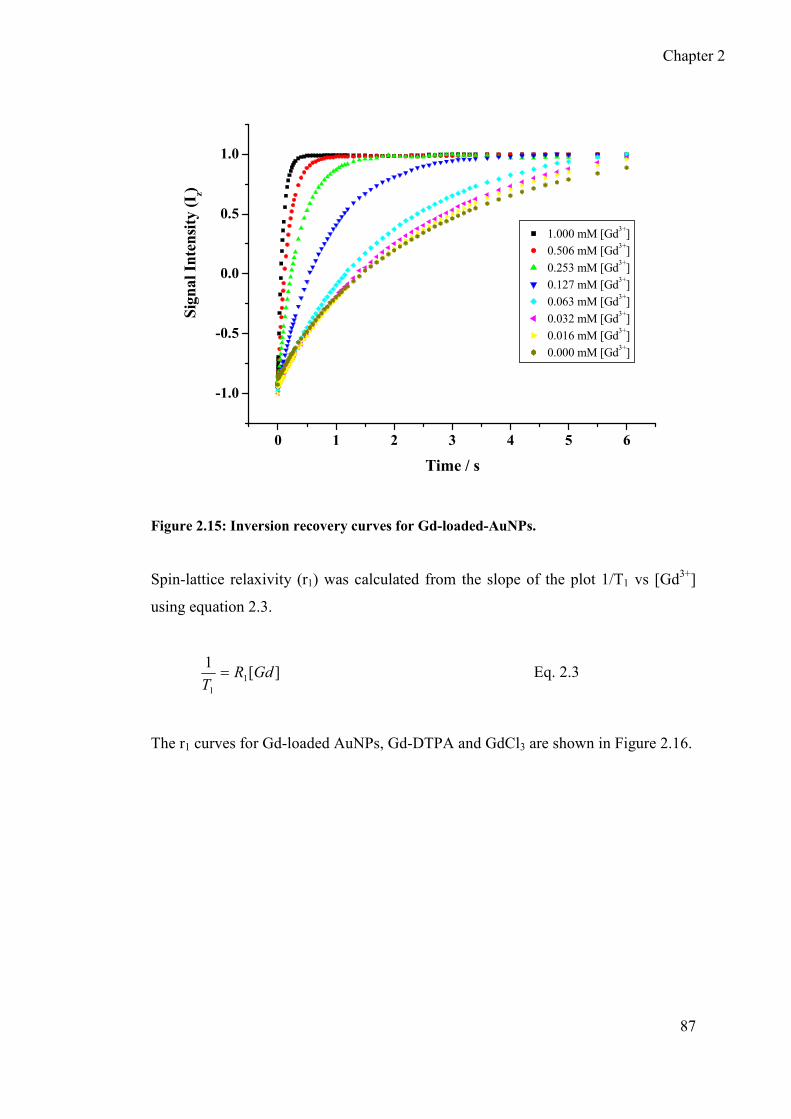
Chapter 2
87
0 1 2 3 4 5 6
-1.0
-0.5
0.0
0.5
1.0
Signal Intensity (I z)
Time / s
1.000 mM [Gd3+]
0.506 mM [Gd3+]
0.253 mM [Gd3+]
0.127 mM [Gd3+]
0.063 mM [Gd3+]
0.032 mM [Gd3+]
0.016 mM [Gd3+]
0.000 mM [Gd3+]
Figure 2.15: Inversion recovery curves for Gd-loaded-AuNPs.
Spin-lattice relaxivity (r1) was calculated from the slope of the plot 1/T1 vs [Gd3+]
using equation 2.3.
][1
11
GdRT
= Eq. 2.3
The r1 curves for Gd-loaded AuNPs, Gd-DTPA and GdCl3 are shown in Figure 2.16.

Chapter 2
88
y = 3.831x + 0.4242
R2 = 0.9951
y = 4.771x + 0.6619
R2 = 0.9978
y = 12.102x - 0.0084
R2 = 0.9961
0
3
6
9
12
15
0 0.3 0.6 0.9 1.2
[Gd] / mM
1 / T
1 (s-1)
Figure2.16: Spin lattice relaxivity (r1) curves for Gd-DTPA (blue), Gd-DTPA@AuNPs
(green), and GdCl3 (black) at 300 MHz and 298 K
The R1 of GdCl3 was found to be (12.10 mM-1 s-1) much higher than for Gd-DTPA
and Gd-loaded AuNPs, but unfortunately due to high toxicity of free Gd3+, it cannot
be utilised as an MRI contrast agent. In free Gd3+, eight water molecules are directly
coordinated with Gd3+ [i.e. Gd(H2O)8]3+. This water can exchange with surrounding
water molecules and thus transfer more magnetic moment from Gd3+ centre to the
surrounding medium, resulting in high R1.
The r1 (at 300 MHz and at 298 K) value for Gd-loaded AuNPs (4.77 mM-1 s-1) was
found somewhat higher than that of a commercially available MRI contrast agent i.e.
[Gd-DTPA]-2 (3.83 mM-1 s-1) at the same field strength and same temperature. This
increase, however (~25.0%) is not very large. The only moderate increase in R1 by
Gd-loaded AuNPs may be due to several reasons. One possibility is the slow water
exchange rate between Gd-DTPA ligand at the AuNPs surface and the surrounding
medium. But as the AuNPs are protected by a monolayer of the DTPA ligand,
therefore all Gd-DTPA ligand chelates are located at the surface of AuNPs and their
water molecules are expected to exchange with surrounding medium easily without
any hindrance as shown in Figure 2.17.
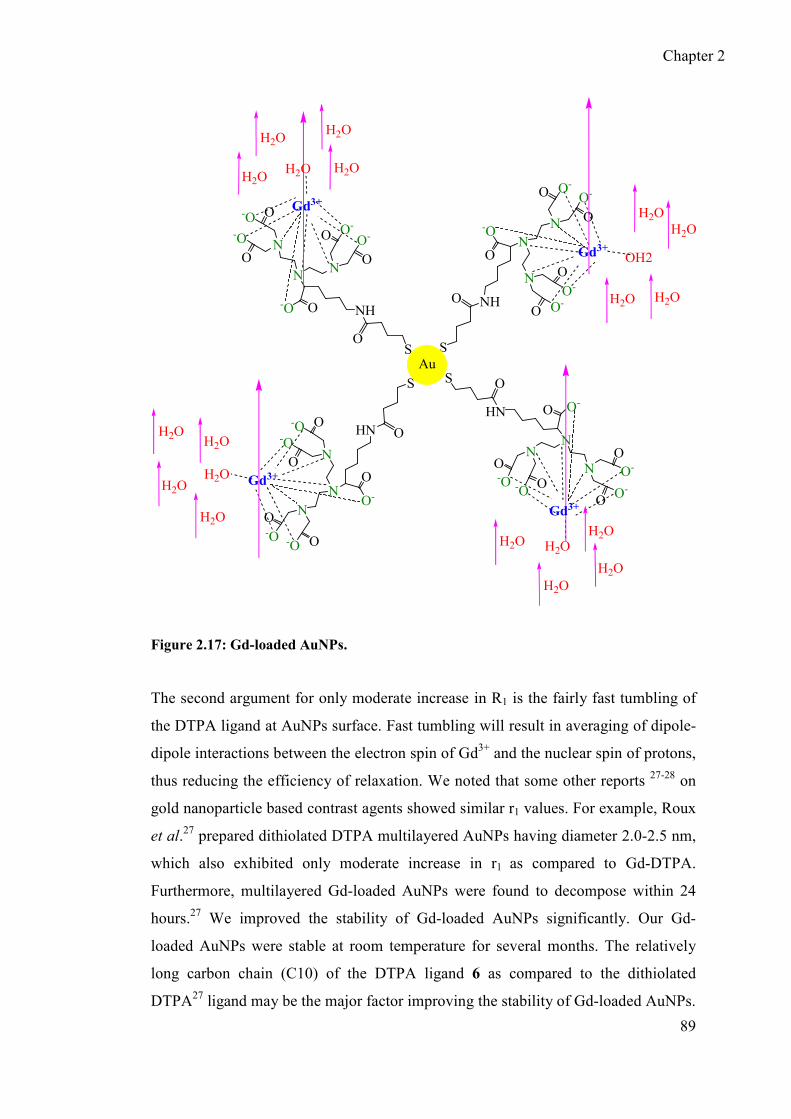
Chapter 2
89
HN O O-
N
NN O
O-
OO-O O-
S O
O-O
NH
O
-ON
N
N
O O-
O
O
O-
O-
S
OO O-
HN
O
O-N
N
N
O-O
O
O
-O
-O
S
OO-O
NHO-O
N
N
NO
-O
O
O O--O
SO
O
O-
OH2
Gd3+
Gd3+
H2O
Gd3+H2O
Gd3+
H2O
H2O
H2O
H2O
H2O
H2O
H2O
H2O
H2O
H2OH2O
H2OH2O
H2OH2O
H2O
H2O
Au
Figure 2.17: Gd-loaded AuNPs.
The second argument for only moderate increase in R1 is the fairly fast tumbling of
the DTPA ligand at AuNPs surface. Fast tumbling will result in averaging of dipole-
dipole interactions between the electron spin of Gd3+ and the nuclear spin of protons,
thus reducing the efficiency of relaxation. We noted that some other reports 27-28 on
gold nanoparticle based contrast agents showed similar r1 values. For example, Roux
et al.27 prepared dithiolated DTPA multilayered AuNPs having diameter 2.0-2.5 nm,
which also exhibited only moderate increase in r1 as compared to Gd-DTPA.
Furthermore, multilayered Gd-loaded AuNPs were found to decompose within 24
hours.27 We improved the stability of Gd-loaded AuNPs significantly. Our Gd-
loaded AuNPs were stable at room temperature for several months. The relatively
long carbon chain (C10) of the DTPA ligand 6 as compared to the dithiolated
DTPA27 ligand may be the major factor improving the stability of Gd-loaded AuNPs.

Chapter 2
90
2.4.6 T1-weighted images of Gd-loaded AuNPs and Gd-DTPA
The suitability of Gd-loaded AuNPs for MRI applications was evaluated by taking
T1 weighted images of solutions of commercially available MRI contrast agent i.e.
Gd-DTPA and Gd-loaded AuNPs. The concentration of gadolinium in both
samples for taking T1-weighted images was kept at 0.25 mM. Figure 2.18 clearly
shows the contrast enhancement with increased nanoparticle concentration. Gd-
loaded AuNPs have somewhat higher relaxivity than the Gd-DTPA complex as
discussed in previous section, which leads to a slightly better contrast in T1-
weighted images (Figure 2.18).
0.00 0.015 0.03 0.06 0.12 0.25
Gd-loaded-AuNPs
Gd-DTPA
[Gd] / mM
0.00 0.015 0.03 0.06 0.120.000.00 0.0150.015 0.030.03 0.060.06 0.120.12 0.250.25
Gd-loaded-AuNPsGd-loaded-AuNPs
Gd-DTPAGd-DTPA
[Gd] / mM[Gd] / mM
0.000.00 0.0150.015 0.030.03 0.060.06 0.120.12
Figure 2.18: T1-weighted images of Gd-DTPA and Gd-DTPA@AuNPs.
The positive contrast thus confirmed the feasibility of using Gd-loaded AuNPs as
MRI contrast agents. The positive contrast in T1 weighted images by other gold
nanoparticles based contrast agent was also reported in the literature.29
2.4.7 Attaching a recognition vector to Gd-loaded AuNPs
For applications in medical diagnosis and therapy, the surface modification of gold
nanoparticles is important.30 For example to transport the nanoparticles to a
specific tissue / organ, a recognition vector with ability to recognise the specific
target is required. Target-specific MRI contrast agents modified with a recognition
vector yield better contrast as compared to the non-specific contrast agents due to
in situ accumulation at the target place. For example, Dirksen et al.31 recently
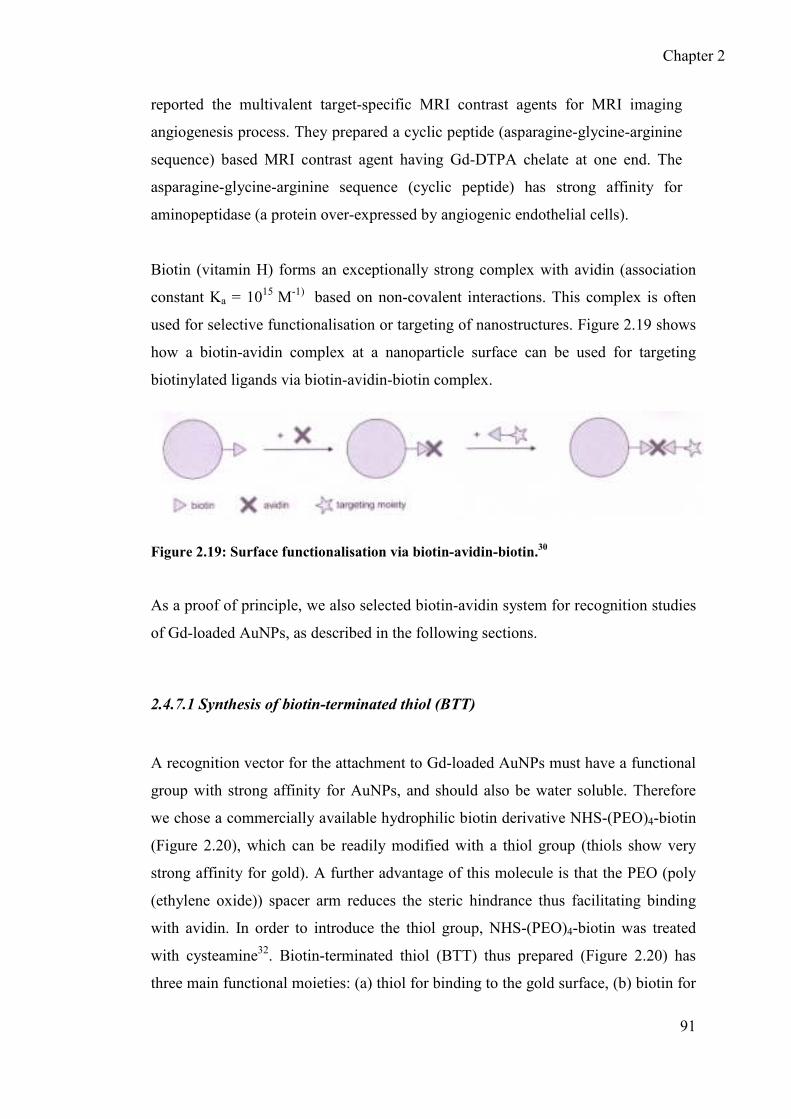
Chapter 2
91
reported the multivalent target-specific MRI contrast agents for MRI imaging
angiogenesis process. They prepared a cyclic peptide (asparagine-glycine-arginine
sequence) based MRI contrast agent having Gd-DTPA chelate at one end. The
asparagine-glycine-arginine sequence (cyclic peptide) has strong affinity for
aminopeptidase (a protein over-expressed by angiogenic endothelial cells).
Biotin (vitamin H) forms an exceptionally strong complex with avidin (association
constant Ka = 1015 M-1) based on non-covalent interactions. This complex is often
used for selective functionalisation or targeting of nanostructures. Figure 2.19 shows
how a biotin-avidin complex at a nanoparticle surface can be used for targeting
biotinylated ligands via biotin-avidin-biotin complex.
Figure 2.19: Surface functionalisation via biotin-avidin-biotin.30
As a proof of principle, we also selected biotin-avidin system for recognition studies
of Gd-loaded AuNPs, as described in the following sections.
2.4.7.1 Synthesis of biotin-terminated thiol (BTT)
A recognition vector for the attachment to Gd-loaded AuNPs must have a functional
group with strong affinity for AuNPs, and should also be water soluble. Therefore
we chose a commercially available hydrophilic biotin derivative NHS-(PEO)4-biotin
(Figure 2.20), which can be readily modified with a thiol group (thiols show very
strong affinity for gold). A further advantage of this molecule is that the PEO (poly
(ethylene oxide)) spacer arm reduces the steric hindrance thus facilitating binding
with avidin. In order to introduce the thiol group, NHS-(PEO)4-biotin was treated
with cysteamine32. Biotin-terminated thiol (BTT) thus prepared (Figure 2.20) has
three main functional moieties: (a) thiol for binding to the gold surface, (b) biotin for

Chapter 2
92
molecular recognition studies, (c) poly (ethylene oxide) spacer arm for solubility in
aqueous medium, and is hence suitable for recognition studies of Gd-loaded AuNPs.
SN
O
O
O ONH
O
OHN NH
O
HSNH2
4+
DMF : DMSO / 1 :1NHS-(PEO)4-Biotin
Cysteamine
Biotin-terminated Thiol (BTT)
o / n
N2
RT
HS
HN SO
NH
O
O
HNNH
O
4
Figure 2.20: Synthesis of biotin-terminated thiol (BTT).
2.4.7.2 Attachment of BTT to Gd-loaded AuNPs
Ligand exchange reaction at AuNPs surface is an efficient way of preparing poly-
functionalised nanoparticles. Ligand exchange can be carried out using ligands
higher affinity for gold than the ligands already present on the surface. The ligands
having similar affinity can also be exchanged.33 DTPA ligands 6 at Gd-loaded
AuNPs surface were exchanged with biotin-terminated thiol (that has similar affinity
for gold as the DTPA ligand) by stirring in aqueous medium at room temperature.
Biotin terminated thiol (BTT) replaced some of the DTPA ligand molecules on gold
nanoparticles (Figure 2.21).

Chapter 2
93
NH
O
O-N
N
N
O O-
O
OO-
O-
OO O-
S
NHOO-
N
N
NOO-
O
O O-O-
O
OO-
S
HN
O
O-NN
N
OO-O
OO-
O-
OOO-
SNH
S
O
HN
O
O
HNNH
O
4
H2OGd3+
H2O
Gd3+
H2O Gd3+
AuS
Figure 2.21: BTT-labelled Gd-loaded AuNPs.
The excess of BTT molecules was removed by overnight dialysis against deionised
water. The Gd-loaded AuNPs having BTT recognition vectors at their surface were
found quite stable and then their recognition studies were carried out (as described in
the next section). The gold nanoparticle based targeted MRI contrast agents were
thus prepared which contain Gd-DTPA chelates (to act as an MRI contrast agent)
and biotin-terminated thiol (a recognition vector) at their surface (Figure 2.21).
2.4.7.3 Molecular recognition of BTT-labelled-Gd-loaded AuNPs
Recognition studies of BTT-labelled-Gd-loaded-AuNPs were carried out by MRI
imaging experiments. The avidin-functionalized gel was taken as a target, to which
BTT-labelled Gd-loaded AuNPs were expected to bind. Two columns filled with the
target gel of identical length and diameters were taken. BTT-labelled-Gd-loaded-
AuNPs and Gd-loaded-AuNPs without BTT labelling were passed through the two
columns. The BTT labelled Gd-loaded-AuNPs were found to adsorb to the avidin

Chapter 2
94
column, while the nanoparticles without BTT labelling do not show any affinity for
the avidin column. Although the binding of BTT-labelled Gd-loaded AuNPs with the
avidin functionalized gel could be observed easily with a naked eye, it was further
confirmed by acquiring T1-weighted images of the columns and the filtrates (i.e.
BTT labelled and unlabelled AuNPs). T1 weighted MRI images are shown in Figure
2.22. The image “I” (i.e. for avidin column with nanoparticles) is brighter than the
image “III” (i.e. for avidin column without nanoparticles).
Figure 2.22: T1-weighted images of BTT labelled and unlabelled Gd-loaded AuNPs,
and avidin-functionalized gel columns.
2.5 Conclusions
A DTPA based ligand was synthesized and characterised successfully. The Au
nanoparticles protected by the new ligand were synthesized and characterised by
UV-Vis spectroscopy, TEM and TGA. The gold nanoparticles were then
characterised by ICP after loading with gadolinium. Two different methods based on
UV/Vis titrations were established for determination / monitoring of Gd3+ loading on

Chapter 2
95
AuNPs. The average composition of Gd-loaded AuNPs was determined as “Au166
Lig54Gd50”. The efficiency of Gd-loaded AuNPs to act as MRI contrast agents was
assessed in terms of relaxivity. The gold nanoparticles based contrast agent showed a
25 % increase in relaxivity as compared to the commercially available MRI contrast
agent Gd-DTPA. The increase in R1 for Gd-loaded AuNPs was not very large,
possibly due to relatively fast tumbling of nanoparticle-attached Gd-DTPA units.
A recognition vector (biotin terminated thiol) was synthesized and then attached to
Gd-loaded-AuNPs. The gold nanoparticles with recognition vector were found to
successfully recognize their target (i.e. avidin modified gel). This illustrates that gold
nanoparticle based MRI contrast agents can be used as target specific contrast
agents.
Chapter 2
96
2.6 References
1. S. Cotton, Lanthanide and Actinide Chemistry, John Wiley & Sons, 2006, 1,
pp. 42-43.
2. A. E. Merbach and E. Toth, The Chemistry of Contrast Agents in Medical
Magnetic Resonance Imaging, John Wiley & Sons, 2001, pp. 45-119.
3. A. Bianchi, L. Calabi, F. Corana, S. Fontana, P. Losi, A. Maiocchi, L. Paleari
and B. Valtancoli, Coord. Chem. Rev., 2000, 204, 309-393.
4. A. E. Merbach and E. Toth, The Chemistry of Contrast Agents in Medical
Magnetic Resonance Imaging, John Wiley & Sons, 2001, pp. 121-150.
5. M. A. Williams and H. Rapoport, J. Org. Chem., 1993, 58, 1151-1158.
6. P. L. Anelli, F. Fedeli, O. Gazzotti, L. Lattuada, G. Lux and F. Rebasti,
Bioconjugate Chem., 1999, 10, 137-140.
7. J. Sherma and B. Fried, Handbook of Thin-Layer Chromatography, Marcel
Dekker, 1996, 2, 101-107.
8. D. C. Johnson Ii and T. S. Widlanski, Tetrahed. Lett., 2001, 42, 3677-3679.
9. J. C. Sheehan and G. P. Hess, J. Am. Chem. Soc., 1955, 77, 1067-1068.
10. Y. Xu, X. Duan, M. Li, L. Jiang, G. Zhao, Y. Meng and L. Chen, Molecules,
2005, 10, 259-264.
11. L. Lattuada and M. Gabellini, Synth. Commun., 2005, 35, 2409 - 2413.
12. S. Langereis, Q. G. de Lussanet, M. H. P. van Genderen, W. H. Backes and
E. W. Meijer, Macromolecules, 2004, 37, 3084-3091.
13. M. Brust, M. Walker, D. Bethell, D. J. Schiffrin and R. Whyman, J. Chem.
Soc.-Chem. Commun., 1994, 801-802.
14. M.-C. Daniel and D. Astruc, Chem. Rev., 2003, 104, 293-346.

Chapter 2
97
15. P. K. Jain, I. H. El-Sayed and M. A. El-Sayed, Nano Today, 2007, 2, 18-29.
16. M. Sastry, Curr. Sci., 2003, 85, 1735-1745.
17. V. Chechik, J. Am. Chem. Soc., 2004, 126, 7780-7781.
18. R. H. Terrill, T. A. Postlethwaite, C.-H. Chen, C.-D. Poon, A. Terzis, A.
Chen, J. E. Hutchison, M. R. Clark and G. Wignall, J. Am. Chem. Soc., 1995,
117, 12537-12548.
19. S. Abraham, I. Kim and Carl A. Batt, Angew. Chem. Int. Ed., 2007, 46, 5720-
5723.
20. S. Koenig and V. Chechik, Langmuir, 2006, 22, 5168-5173.
21. S. F. Sweeney, G. H. Woehrle and J. E. Hutchison, J. Am. Chem. Soc., 2006,
128, 3190-3197.
22. T. Teranishi, S. Hasegawa, T. Shimizu and M. Miyake, Adv. Mater., 2001,
13, 1699-1701.
23. T. Shimizu, T. Teranishi, S. Hasegawa and M. Miyake, J. Phys. Chem. B,
2003, 107, 2719-2724.
24. P.-J. Debouttière, S. Roux, F. Vocanson, C. Billotey, O. Beuf, A. Favre-
Réguillon, Y. Lin, S. Pellet-Rostaing, R. Lamartine, P. Perriat and O.
Tillement, Adv. Funct. Mater., 2006, 16, 2330-2339.
25. A. Barge, G. Cravotto, E. Gianolio and F. Fedeli, Contrast Med. & Mole.
Imag., 2006, 1, 184-188.
26. I. L. Pykett, B. R. Rosen, F. S. Buonanno and T. J. Brady, Phys. Med. Biol.,
1983, 28, 723-729.
27. C. Alric, J. Taleb, G. L. Duc, C. Mandon, C. Billotey, A. L. Meur-Herland,
T. Brochard, F. Vocanson, M. Janier, P. Perriat, S. Roux and O. Tillement, J.
Am. Chem. Soc., 2008, 130, 5908-5915.

Chapter 2
98
28. P. J. Debouttiere, S. Roux, F. Vocanson, C. Billotey, O. Beuf, A. Favre-
Reguillon, Y. Lin, S. Pellet-Rostaing, R. Lamartine, P. Perriat and O.
Tillement, Adv. Funct. Mater., 2006, 16, 2330-2339.
29. Y. T. Lim, M. Y. Cho, B. S. Choi, J. M. Lee and B. H. Chung, Chem.
Comm., 2008, 4930-4932.
30. C. Kumar, Nanomaterials for Medical Diagnosis and Therapy, Wiley-VCH,
2007, 1, 359-379.
31. A. Dirksen, S. Langereis, B. F. M. d. Waal, M. H. P. v. Genderen, T. M.
Hackeng and E. W. Meijer, Chem. Comm., 2005, 2811-2813.
32. A. K. Salem, M. Chen, J. Hayden, K. W. Leong and P. C. Searson, Nano
Lett., 2004, 4, 1163-1165.
33. P. Ionita, J. Wolowska, V. Chechik and A. Caragheorgheopol, J. Phys. Chem.
C, 2007, 111, 16717-16723.

Chapter 3
99
3 Chapter 3: Strategies for increasing relaxivity of
Gd-loaded gold nanoparticles
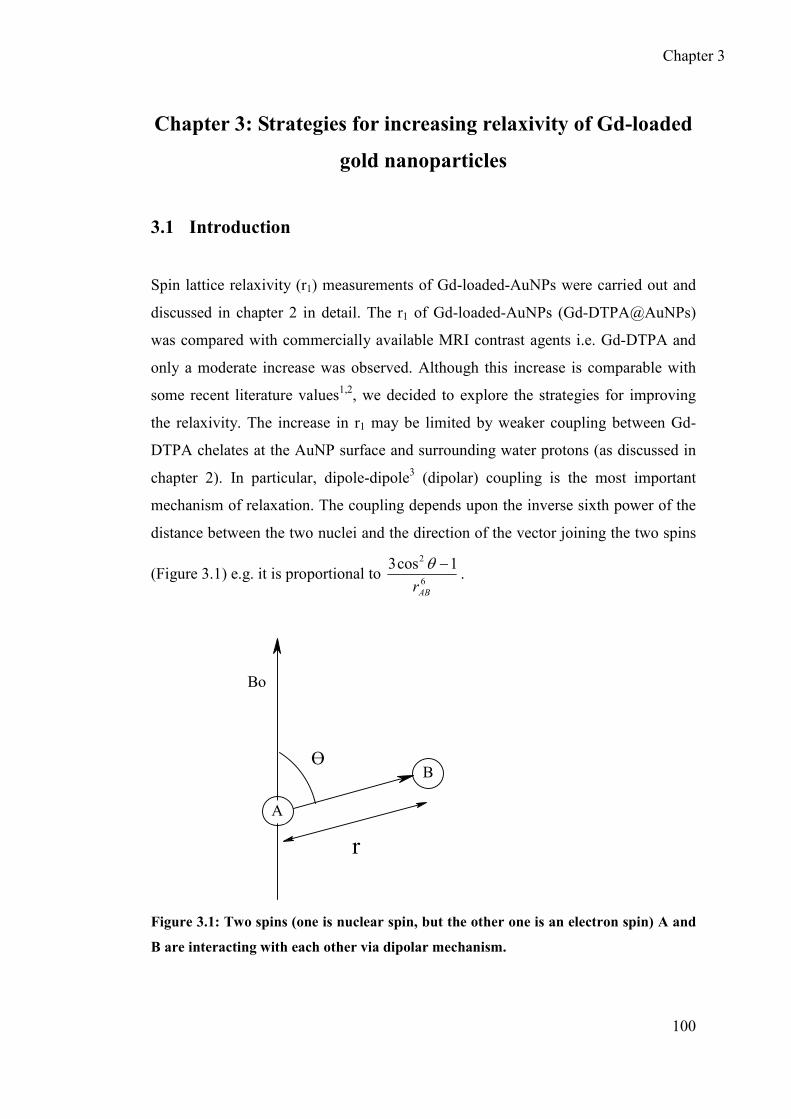
Chapter 3
100
Chapter 3: Strategies for increasing relaxivity of Gd-loaded
gold nanoparticles
3.1 Introduction
Spin lattice relaxivity (r1) measurements of Gd-loaded-AuNPs were carried out and
discussed in chapter 2 in detail. The r1 of Gd-loaded-AuNPs (Gd-DTPA@AuNPs)
was compared with commercially available MRI contrast agents i.e. Gd-DTPA and
only a moderate increase was observed. Although this increase is comparable with
some recent literature values1,2, we decided to explore the strategies for improving
the relaxivity. The increase in r1 may be limited by weaker coupling between Gd-
DTPA chelates at the AuNP surface and surrounding water protons (as discussed in
chapter 2). In particular, dipole-dipole3 (dipolar) coupling is the most important
mechanism of relaxation. The coupling depends upon the inverse sixth power of the
distance between the two nuclei and the direction of the vector joining the two spins
(Figure 3.1) e.g. it is proportional to 6
2 1cos3
ABr
−θ.
Figure 3.1: Two spins (one is nuclear spin, but the other one is an electron spin) A and
B are interacting with each other via dipolar mechanism.
B
r
Bo
A
Ө

Chapter 3
101
The frequency of rotational motion of tumbling species is also important for
effective dipolar coupling and this frequency is usually expressed in terms of so-
called correlation time (τc). The τc is related with spin-lattice relaxation time (T1) as:
2
1 )2(1
1
co
c
T τπντ
+∝ Eq. 3.1
Here νo is the precessional frequency of the target nucleus (e.g A in Figure 3.1).
According to this equation, for rapidly tumbling species with 1/τc>>2πνo, relaxation
rate (1/T1) will be proportional to τc, while in case of slowly tumbling species
(1/τc<< 2πνo) 1/T1 will be inversely proportional to τc. In rapidly tumbling species
(τc <10-11 s ), the dipolar interaction averages out, while in slowly tumbling species
(τc >10-11 s ) the dipolar coupling is significant which can lead to higher relaxivity.4
Table 3.13 illustrates this effect of τc on r1. For instance, if τc is decreased 1000 fold,
the r1 will increase four-fold.
Table 3.1 Effect of τc on r1.
Rotational Correlational
Time (τc) / ps
Relaxivity (r1 / mM-1s-1)
58 8.0
58,000 32.0
In this chapter, EPR spectroscopy was used to determine the tumbling rate (τc) of
nanoparticle-attached ligand in order to unravel the main factors responsible for the
limited increase in R1 of Gd-loaded AuNPs as compared to commercially available
Gd-DTPA MRI contrast agent.
3.1.1 An introduction to EPR5-7
Electron Paramagnetic Resonance phenomenon was discovered by Prof. E. K.
Zavoisky in 1944 at Kazan University (Russia) and is abbreviated as EPR and also

Chapter 3
102
as ESR (i.e. electron spin resonance). The EPR spectroscopy is used to study
materials with unpaired electron(s). EPR is similar to NMR, but EPR is based on the
interaction of magnetic field with electron spin, while NMR relies on the nuclear
spin.
3.1.1.1 Principles of EPR
Electrons have intrinsic angular momentum called spin (S). Electron has two spin
states represented as α and β in the presence of static magnetic field (Bo) (this
phenomenon is called Zeeman Effect). These two spin states have different
orientations but the same magnitude of spin angular momentum. Electronic angular
momentum (S) gives rise to magnetic moment (µe). Both µe and S are equal in
magnitude and opposite in direction (proportionality constant µB in negative) and
related by following equation.
Sg Be µµ = Eq. 3.1
In eq 3.1 “g” is a constant called g-factor and µB (Bohr magneton) is also a constant.
The α and β states of a free electron in the presence of a static magnetic field are
shown schematically in Figure 3.2.
Bo ≠ 0
Bo = 0
β
α
oBBgE µ=∆E = 0
Figure 3.2: Spin states of an electron in the absence and presence of the applied
magnetic field Bo.

Chapter 3
103
As electron spin energy is a scalar product of magnetic moment (µe) and applied
magnetic filed (B), the energy difference between α and β states of a free electron is
given by equation 3.2.
oBBgE µ=∆ Eq 3.2
In EPR, magnetic field is swept keeping the frequency of electromagnetic radiation
constant. As the magnetic field strength matches the energy difference between
electron spin states (i.e. α and β), the inversion of the spin state occurs. The energy
absorbed for inversion / transition of electron from one state to the other is recorded.
EPR spectra are usually recorded as first derivative of the absorbed energy against
applied magnetic field. The first derivative is used to improve the resolution and to
decrease the background noise. An example of a first derivative of absorbed energy
vs magnetic field is shown in Figure 3.3.
Figure 3.3: EPR absorption curve and its first derivative.

Chapter 3
104
3.1.1.2 The anisotropic g-tensor
“g” factor is a constant and a free electron has “g” (i.e. ge) value 2.002319.
Equation 3.2 implies that the position of EPR signal depends on the “g” factor for a
given field Bo. For example, in the case of organic free radical (especially when they
contain only light atoms), the “g” values are very close to “ge” (i.e. g∆ ~ 0) and
hence provide relatively little structural information. On the other hand, g∆ may be
significant for heavy atoms. The “g” factor becomes more important for structure
determination when hyperfine splitting (described in the next section) is not
observed.
The value of “g” factor may depend on the direction of magnetic field with respect to
molecular axes. In general the “g” factor is a rank 2 tensor defined by the principal
values which often correspond to molecular axes. This anisotropic behaviour of “g”
factor can be illustrated by TEMPO (2,2,6,6-tetramethyl pyrrolidine-N-oxyl) free
radical as shown in Figure 3.4.
N
O
2.0090
2.0060
2.0027
Figure 3.4: Chemical structure of TEMPO radical with anisotropic principal values of
the "g" tensor.
3.1.1.3 Hyperfine interactions
The presence of magnetic nuclei with I ≠ 0 affects the transition of electrons. As a
result of this coupling between electron and nuclear spins, EPR signal of unpaired
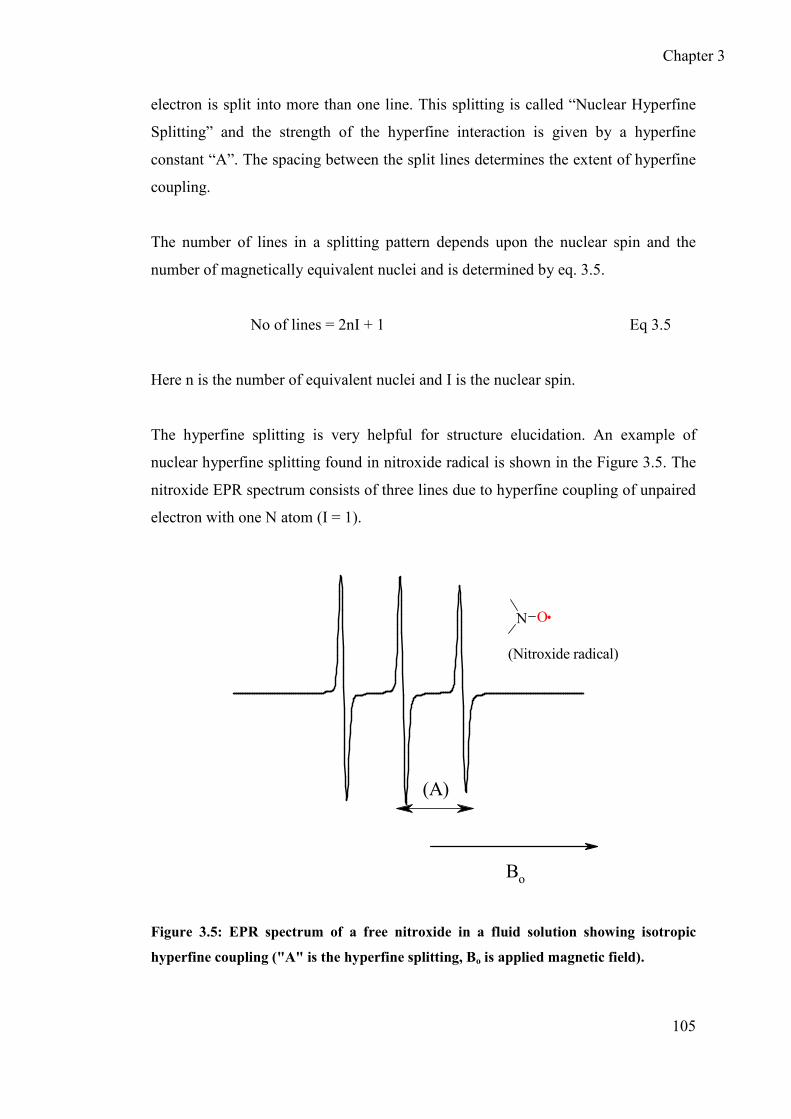
Chapter 3
105
electron is split into more than one line. This splitting is called “Nuclear Hyperfine
Splitting” and the strength of the hyperfine interaction is given by a hyperfine
constant “A”. The spacing between the split lines determines the extent of hyperfine
coupling.
The number of lines in a splitting pattern depends upon the nuclear spin and the
number of magnetically equivalent nuclei and is determined by eq. 3.5.
No of lines = 2nI + 1 Eq 3.5
Here n is the number of equivalent nuclei and I is the nuclear spin.
The hyperfine splitting is very helpful for structure elucidation. An example of
nuclear hyperfine splitting found in nitroxide radical is shown in the Figure 3.5. The
nitroxide EPR spectrum consists of three lines due to hyperfine coupling of unpaired
electron with one N atom (I = 1).
N O
(Nitroxide radical)
Bo
(A)
Figure 3.5: EPR spectrum of a free nitroxide in a fluid solution showing isotropic
hyperfine coupling ("A" is the hyperfine splitting, Bo is applied magnetic field).
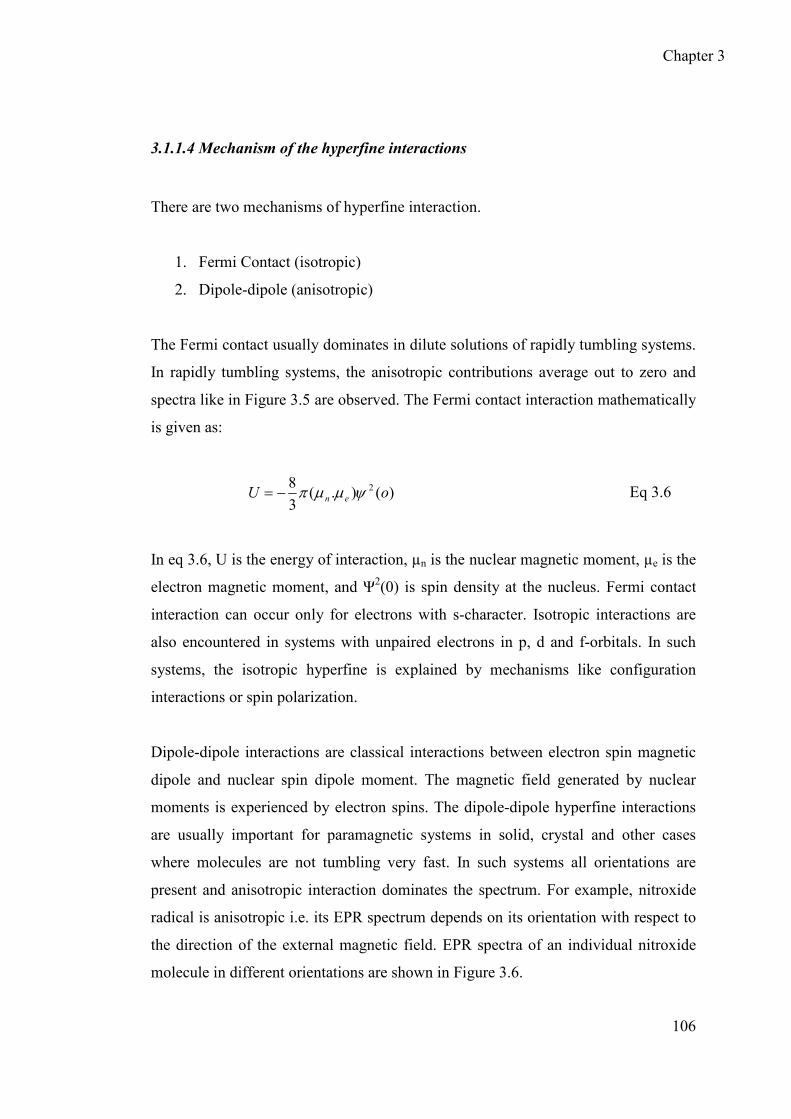
Chapter 3
106
3.1.1.4 Mechanism of the hyperfine interactions
There are two mechanisms of hyperfine interaction.
1. Fermi Contact (isotropic)
2. Dipole-dipole (anisotropic)
The Fermi contact usually dominates in dilute solutions of rapidly tumbling systems.
In rapidly tumbling systems, the anisotropic contributions average out to zero and
spectra like in Figure 3.5 are observed. The Fermi contact interaction mathematically
is given as:
)().(3
8 2 oU en ψµµπ−= Eq 3.6
In eq 3.6, U is the energy of interaction, µn is the nuclear magnetic moment, µe is the
electron magnetic moment, and Ψ2(0) is spin density at the nucleus. Fermi contact
interaction can occur only for electrons with s-character. Isotropic interactions are
also encountered in systems with unpaired electrons in p, d and f-orbitals. In such
systems, the isotropic hyperfine is explained by mechanisms like configuration
interactions or spin polarization.
Dipole-dipole interactions are classical interactions between electron spin magnetic
dipole and nuclear spin dipole moment. The magnetic field generated by nuclear
moments is experienced by electron spins. The dipole-dipole hyperfine interactions
are usually important for paramagnetic systems in solid, crystal and other cases
where molecules are not tumbling very fast. In such systems all orientations are
present and anisotropic interaction dominates the spectrum. For example, nitroxide
radical is anisotropic i.e. its EPR spectrum depends on its orientation with respect to
the direction of the external magnetic field. EPR spectra of an individual nitroxide
molecule in different orientations are shown in Figure 3.6.
Chapter 3
107
Figure 3.6: Single crystal spectra of nitroxide in three directions of nitroxide frame.8
Figure 3.6 shows that when the direction of external magnetic field is changed, the
distance between hyperfine extrema and central line (hyperfine splitting) changed
uniformly. In the spectra of frozen solutions, spins are orientated randomly with
respect to the magnetic field and the resulting spectrum is the sum of the contribution
of all the orientations as explained in Figure 3.7. The hyperfine splitting tensor ⟨A⟩
can be obtained by simulation of such powder / frozen spectra.

Chapter 3
108
Figure 3.7: Frozen solution spectrum of a nitroxide in toluene. In sets: the overlapping
of 1st derivative features yields the positive and negative signals at low and high
field respectively.8
“g” is also anisotropic but at X-band region of the microwave frequency “A”
anisotropy dominates.
Consequently the tumbling rate of species on a ns (nanosecond) time scale has a
direct effect on hyperfine interactions, which defines the line shape (and line width)
of the EPR spectra. By analysing / simulating line shape of EPR spectra, tumbling
rate of species under question can be determined. The tumbling rate of nanoparticle-
attached DTPA ligand was determined using EPR spectroscopy and is discussed in
the next section.

Chapter 3
109
3.2 Vanadyl complexation with DTPA and DTPA based
ligand@AuNPs
To assess the tumbling rate (i.e. rotational correlational time) of nanoparticle-
attached DTPA ligand using EPR spectroscopy, Gd3+ needed to be replaced with
some other paramagnetic ion due to the following reasons:
• Gd3+ is paramagnetic (due to seven unpaired electrons), but its EPR
spectrum consists of only one broad line due to spin-spin interactions
between unpaired electrons (Figure 3.8).
• As no hyperfine splitting is observed in Gd3+ EPR spectrum, hence it is
isotropic and is not affected by changing the motion of the Gd3+.
Figure 3.8: EPR spectrum of Gd3+ (i.e. aq solution of GdCl3).
The alternative paramagnetic ion must be able to bind with DTPA and DTPA based
ligands and its EPR spectrum should be motionally sensitive.9
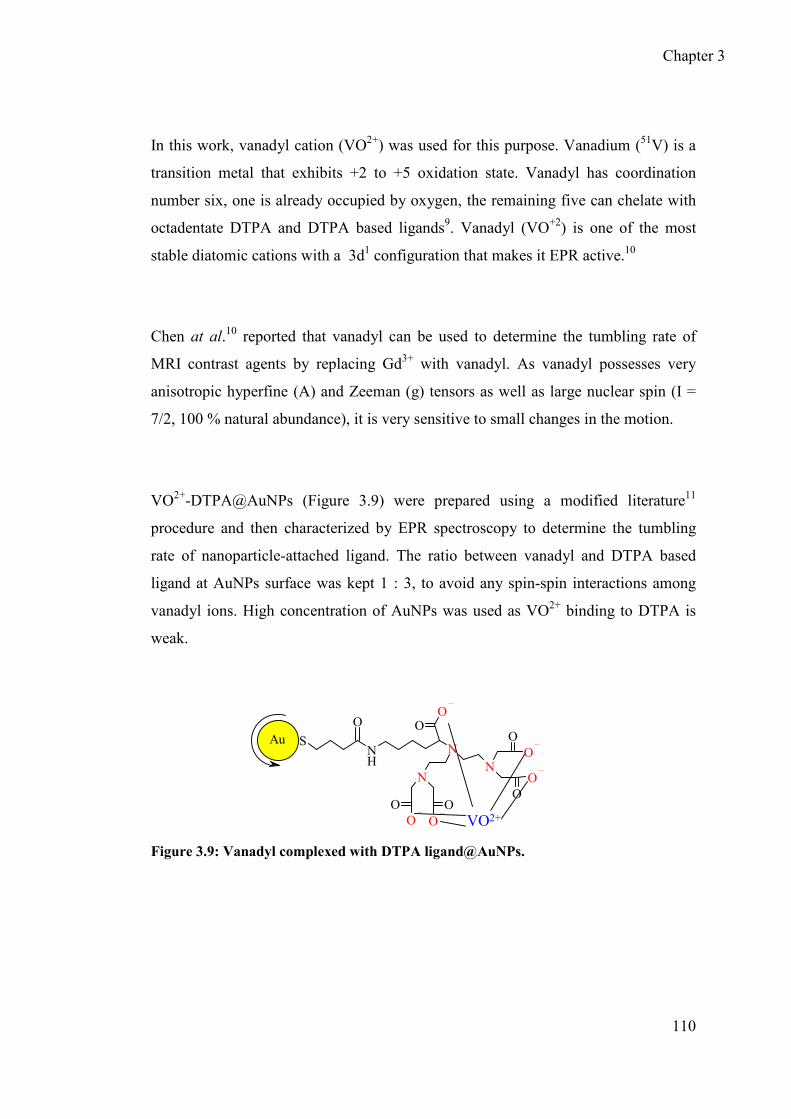
Chapter 3
110
In this work, vanadyl cation (VO2+) was used for this purpose. Vanadium (51V) is a
transition metal that exhibits +2 to +5 oxidation state. Vanadyl has coordination
number six, one is already occupied by oxygen, the remaining five can chelate with
octadentate DTPA and DTPA based ligands9. Vanadyl (VO+2) is one of the most
stable diatomic cations with a 3d1 configuration that makes it EPR active.10
Chen at al.10 reported that vanadyl can be used to determine the tumbling rate of
MRI contrast agents by replacing Gd3+ with vanadyl. As vanadyl possesses very
anisotropic hyperfine (A) and Zeeman (g) tensors as well as large nuclear spin (I =
7/2, 100 % natural abundance), it is very sensitive to small changes in the motion.
VO2+-DTPA@AuNPs (Figure 3.9) were prepared using a modified literature11
procedure and then characterized by EPR spectroscopy to determine the tumbling
rate of nanoparticle-attached ligand. The ratio between vanadyl and DTPA based
ligand at AuNPs surface was kept 1 : 3, to avoid any spin-spin interactions among
vanadyl ions. High concentration of AuNPs was used as VO2+ binding to DTPA is
weak.
NH
OO
NN
N
OO
OO
O
O
S
O
OO
Au
VO2+
Figure 3.9: Vanadyl complexed with DTPA ligand@AuNPs.
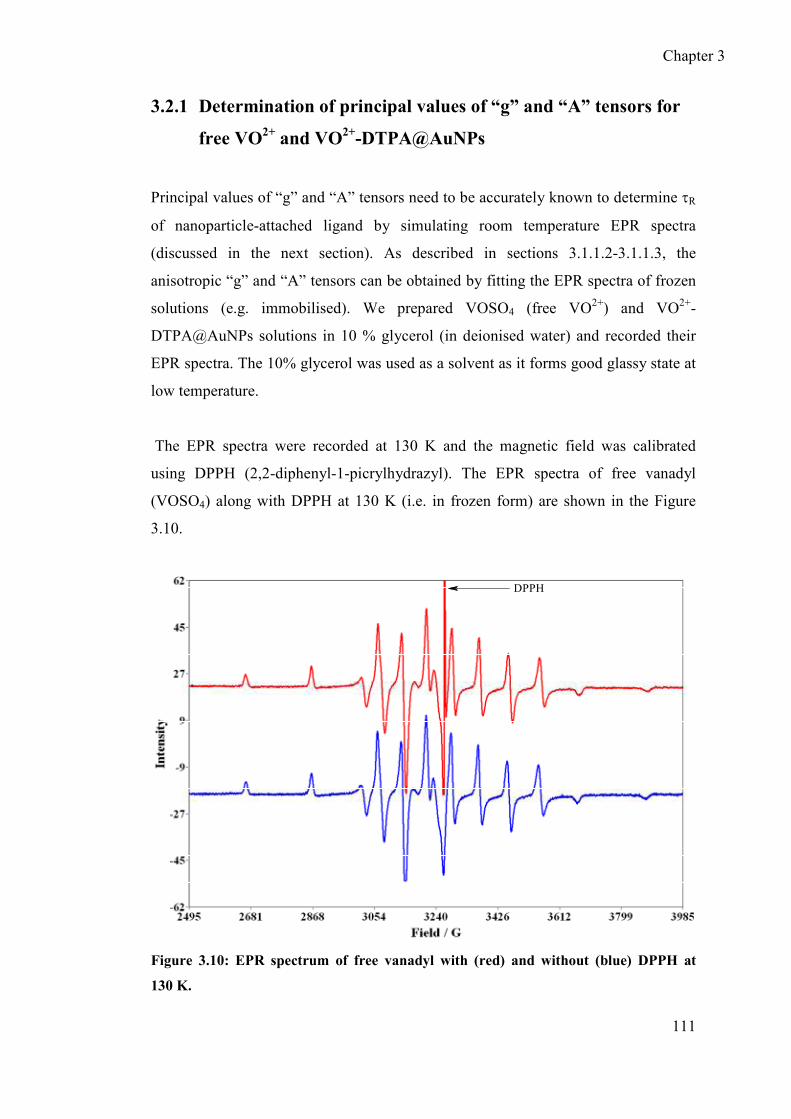
Chapter 3
111
3.2.1 Determination of principal values of “g” and “A” tensors for
free VO2+ and VO
2+-DTPA@AuNPs
Principal values of “g” and “A” tensors need to be accurately known to determine τR
of nanoparticle-attached ligand by simulating room temperature EPR spectra
(discussed in the next section). As described in sections 3.1.1.2-3.1.1.3, the
anisotropic “g” and “A” tensors can be obtained by fitting the EPR spectra of frozen
solutions (e.g. immobilised). We prepared VOSO4 (free VO2+) and VO2+-
DTPA@AuNPs solutions in 10 % glycerol (in deionised water) and recorded their
EPR spectra. The 10% glycerol was used as a solvent as it forms good glassy state at
low temperature.
The EPR spectra were recorded at 130 K and the magnetic field was calibrated
using DPPH (2,2-diphenyl-1-picrylhydrazyl). The EPR spectra of free vanadyl
(VOSO4) along with DPPH at 130 K (i.e. in frozen form) are shown in the Figure
3.10.
DPPH
Figure 3.10: EPR spectrum of free vanadyl with (red) and without (blue) DPPH at
130 K.
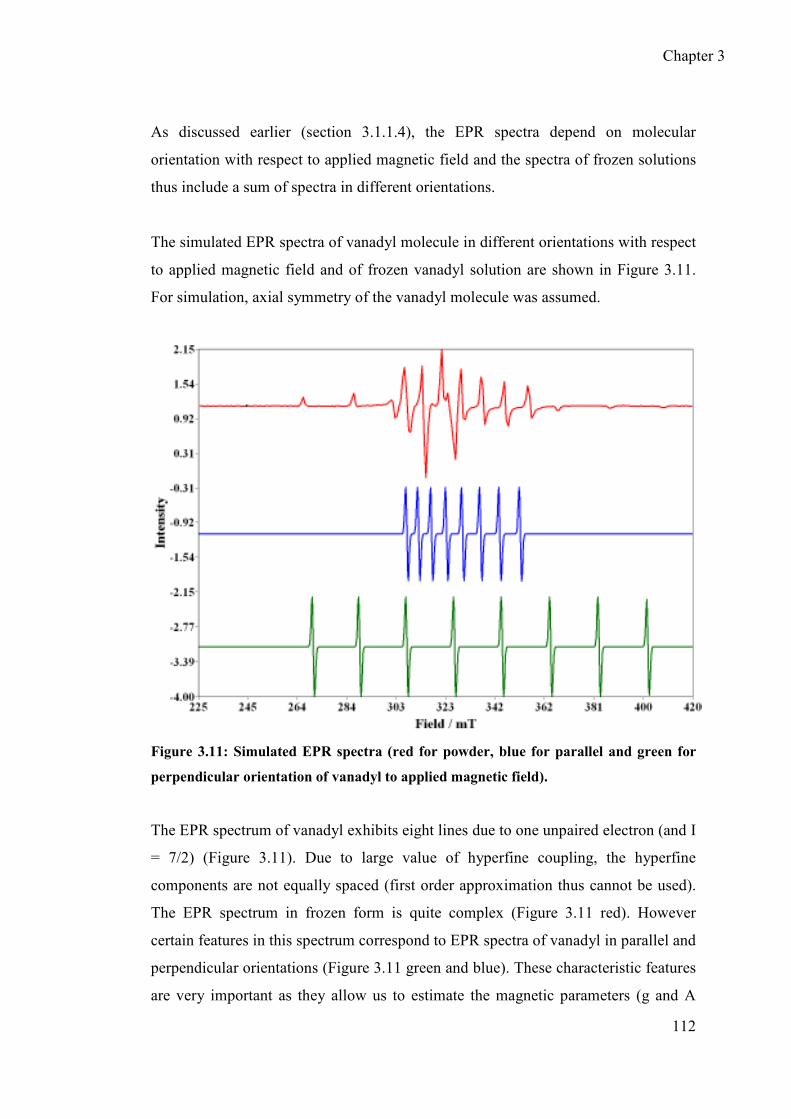
Chapter 3
112
As discussed earlier (section 3.1.1.4), the EPR spectra depend on molecular
orientation with respect to applied magnetic field and the spectra of frozen solutions
thus include a sum of spectra in different orientations.
The simulated EPR spectra of vanadyl molecule in different orientations with respect
to applied magnetic field and of frozen vanadyl solution are shown in Figure 3.11.
For simulation, axial symmetry of the vanadyl molecule was assumed.
Figure 3.11: Simulated EPR spectra (red for powder, blue for parallel and green for
perpendicular orientation of vanadyl to applied magnetic field).
The EPR spectrum of vanadyl exhibits eight lines due to one unpaired electron (and I
= 7/2) (Figure 3.11). Due to large value of hyperfine coupling, the hyperfine
components are not equally spaced (first order approximation thus cannot be used).
The EPR spectrum in frozen form is quite complex (Figure 3.11 red). However
certain features in this spectrum correspond to EPR spectra of vanadyl in parallel and
perpendicular orientations (Figure 3.11 green and blue). These characteristic features
are very important as they allow us to estimate the magnetic parameters (g and A

Chapter 3
113
tensors) in parallel and perpendicular orientations of applied magnetic field. These
estimates are then used as a starting point for simulations to get accurate values of
“g” and “A” tensors.
The experimental EPR spectrum of frozen vanadyl (Figure 3.10) is similar to that of
the simulated spectrum (Figure 3.11 red). The fitting of experimental EPR spectra of
free vanadyl and VO-DTPA@AuNPs was done using easyspin12 and the values of g
and A-tensors are given in Table 3.2. The experimental and simulated EPR spectra
for free vanadyl and VO-DTPA@AuNPs are shown in Figures 3.12.
(A)
(B)
Figure 3.12: Experimental (thick lines) and simulated (thin lines) EPR spectra of free
vanadyl (A) and VO-DTPA@AuNPs (B) at 130 K.
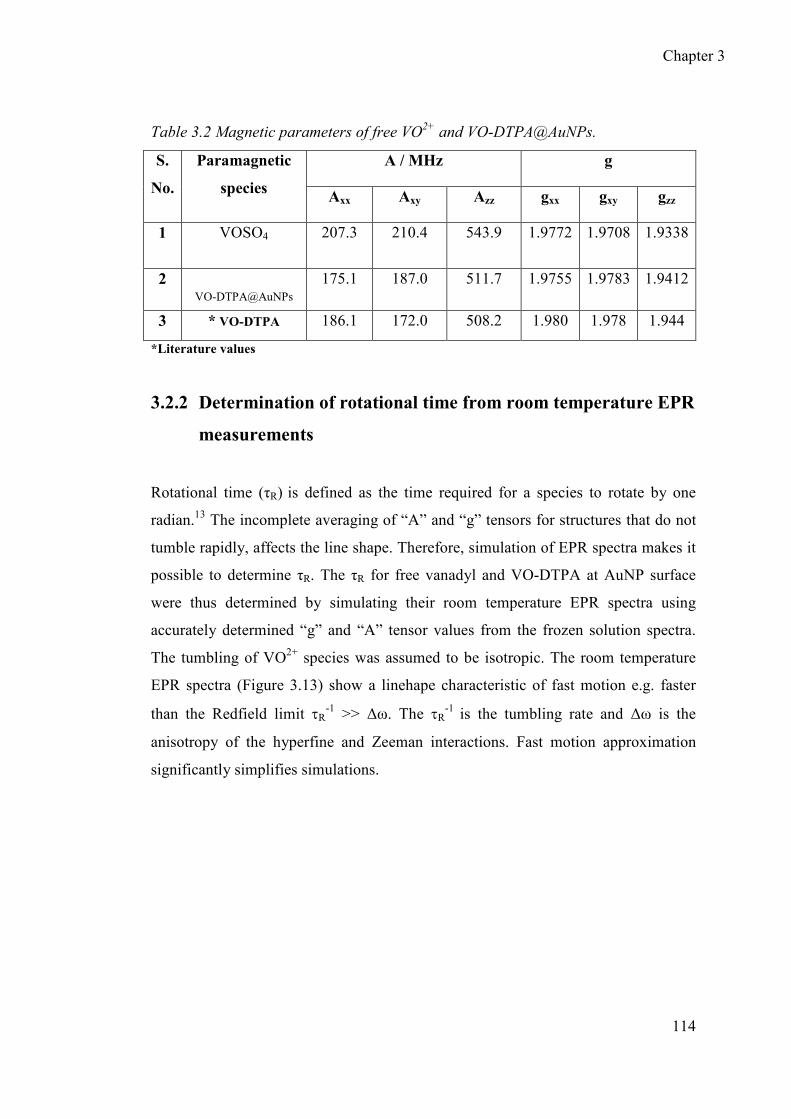
Chapter 3
114
Table 3.2 Magnetic parameters of free VO2+ and VO-DTPA@AuNPs.
S.
No.
Paramagnetic
species
A / MHz g
Axx Axy Azz gxx gxy gzz
1 VOSO4 207.3 210.4 543.9 1.9772 1.9708 1.9338
2
VO-DTPA@AuNPs
175.1 187.0 511.7 1.9755 1.9783 1.9412
3 * VO-DTPA 186.1 172.0 508.2 1.980 1.978 1.944
*Literature values
3.2.2 Determination of rotational time from room temperature EPR
measurements
Rotational time (τR) is defined as the time required for a species to rotate by one
radian.13 The incomplete averaging of “A” and “g” tensors for structures that do not
tumble rapidly, affects the line shape. Therefore, simulation of EPR spectra makes it
possible to determine τR. The τR for free vanadyl and VO-DTPA at AuNP surface
were thus determined by simulating their room temperature EPR spectra using
accurately determined “g” and “A” tensor values from the frozen solution spectra.
The tumbling of VO2+ species was assumed to be isotropic. The room temperature
EPR spectra (Figure 3.13) show a linehape characteristic of fast motion e.g. faster
than the Redfield limit τR-1 >> ∆ω. The τR
-1 is the tumbling rate and ∆ω is the
anisotropy of the hyperfine and Zeeman interactions. Fast motion approximation
significantly simplifies simulations.

Chapter 3
115
(A)
(B)
Figure 3.13: Experimental (thick lines) and simulated (thin lines) EPR spectra of free
vanadyl (A) and VO-DTPA@AuNPs (B) at 298 K.
The τR values for free VO2+ and of VO-DTPA@AuNPs are shown in table 3.3. The
τR of VO-DTPA@AuNPs was found to be only twice as long as for free VO2+. This
increase is not very large. The relatively high tumbling rate suggests that ligand
molecules are not well packed at AuNP surface (ligand packing at nanoparticles
surface is discussed in detail in section 3.4). The branching of DTPA units at the end
of ligand molecule might be responsible for preventing tight packing of ligands at
the AuNP surface.

Chapter 3
116
Table 3.3 Rotational correlational time of free vanadyl and vanadyl-
DTPA@AuNPs.
3.3 Conclusions of EPR results
The EPR results showed that the DTPA based ligand molecules at the AuNP
surface tumble relatively fast; attachment of ligands to nanoparticle surface only
resulted in slowing down molecular tumbling by a factor of ca. 2. This fast tumbling
is probably responsible for the only moderate increase in relaxivity of Gd-loaded
AuNPs as compared to commercially available (small molecule based) MRI contrast
agents.
The EPR data are important as they show the way to enhance the relaxivity by
reducing the tumbling of nanoparticle-attached ligands.
We explored several strategies to reduce the tumbling of nanoparticle-attached
ligand which may result in increased relaxivity of gold nanoparticle based MRI
contrast agents. They are discussed in the following sections.
Paramagnetic Species τR
VOSO4 (Free VO2+) 4.52 × 10⁻¹¹s
VO-DTPA 4.84×10⁻¹¹s
VO-DTPA@AuNPs 1.03 × 10⁻¹⁰s
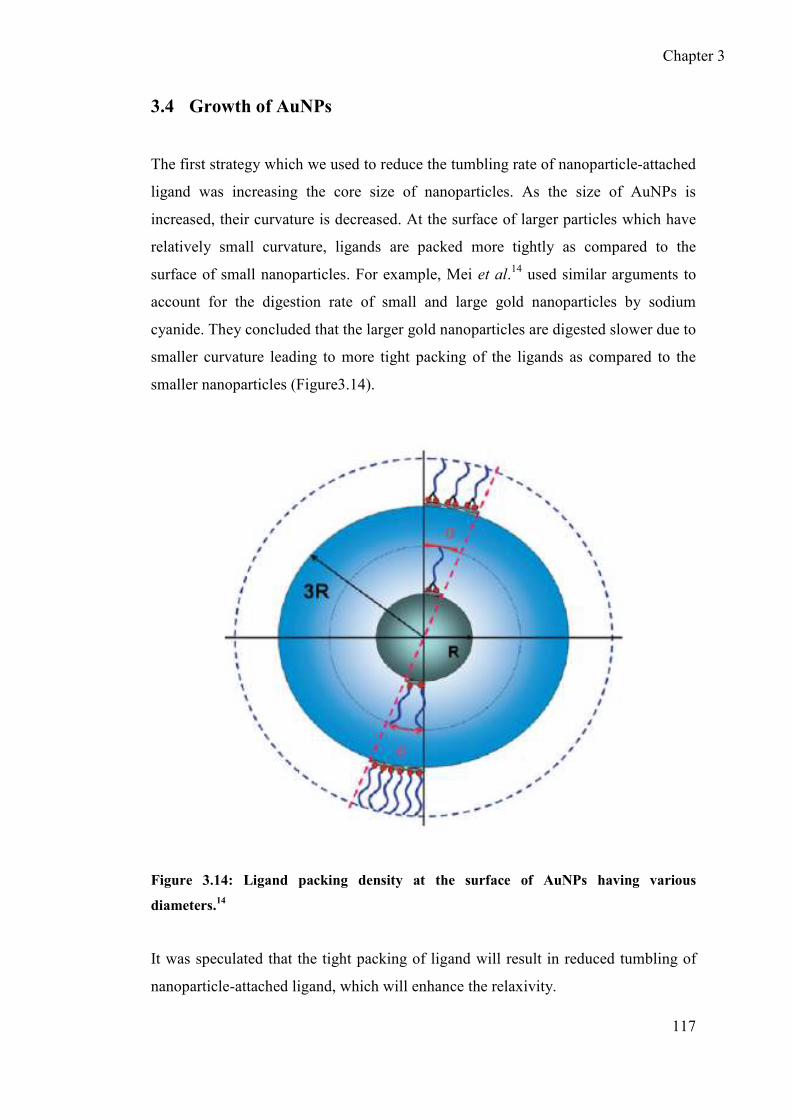
Chapter 3
117
3.4 Growth of AuNPs
The first strategy which we used to reduce the tumbling rate of nanoparticle-attached
ligand was increasing the core size of nanoparticles. As the size of AuNPs is
increased, their curvature is decreased. At the surface of larger particles which have
relatively small curvature, ligands are packed more tightly as compared to the
surface of small nanoparticles. For example, Mei et al.14 used similar arguments to
account for the digestion rate of small and large gold nanoparticles by sodium
cyanide. They concluded that the larger gold nanoparticles are digested slower due to
smaller curvature leading to more tight packing of the ligands as compared to the
smaller nanoparticles (Figure3.14).
Figure 3.14: Ligand packing density at the surface of AuNPs having various
diameters.14
It was speculated that the tight packing of ligand will result in reduced tumbling of
nanoparticle-attached ligand, which will enhance the relaxivity.
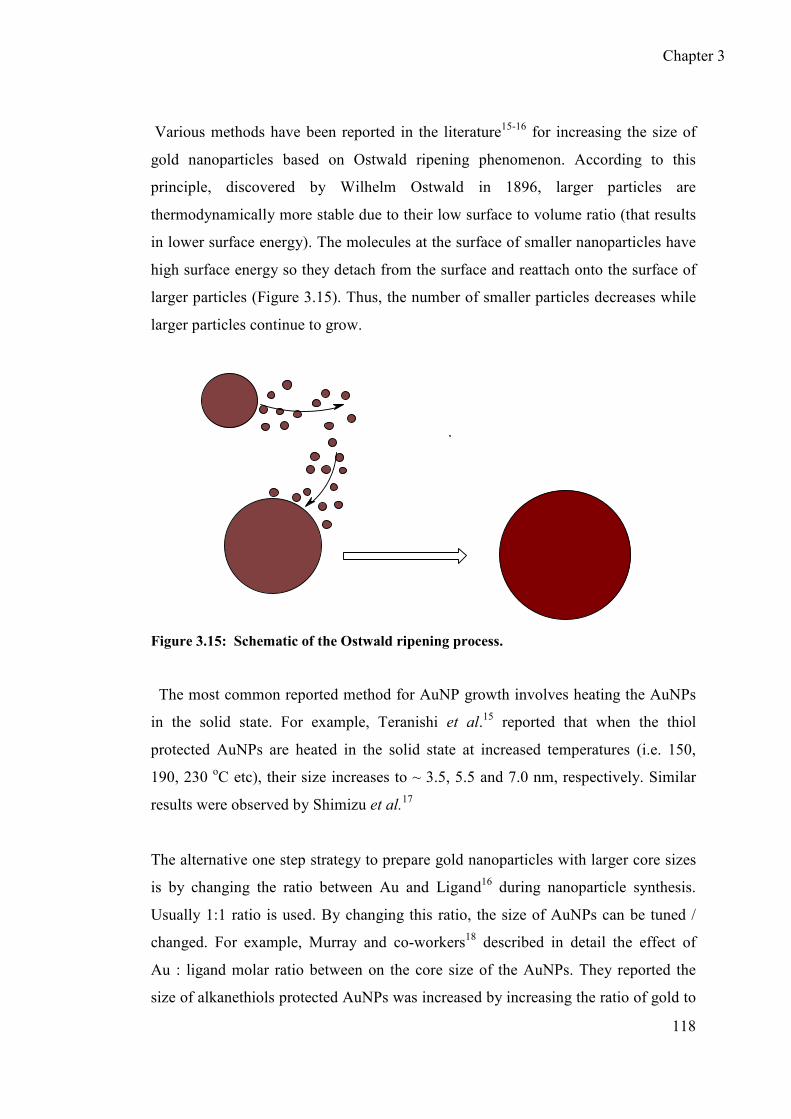
Chapter 3
118
Various methods have been reported in the literature15-16 for increasing the size of
gold nanoparticles based on Ostwald ripening phenomenon. According to this
principle, discovered by Wilhelm Ostwald in 1896, larger particles are
thermodynamically more stable due to their low surface to volume ratio (that results
in lower surface energy). The molecules at the surface of smaller nanoparticles have
high surface energy so they detach from the surface and reattach onto the surface of
larger particles (Figure 3.15). Thus, the number of smaller particles decreases while
larger particles continue to grow.
Figure 3.15: Schematic of the Ostwald ripening process.
The most common reported method for AuNP growth involves heating the AuNPs
in the solid state. For example, Teranishi et al.15 reported that when the thiol
protected AuNPs are heated in the solid state at increased temperatures (i.e. 150,
190, 230 oC etc), their size increases to ~ 3.5, 5.5 and 7.0 nm, respectively. Similar
results were observed by Shimizu et al.17
The alternative one step strategy to prepare gold nanoparticles with larger core sizes
is by changing the ratio between Au and Ligand16 during nanoparticle synthesis.
Usually 1:1 ratio is used. By changing this ratio, the size of AuNPs can be tuned /
changed. For example, Murray and co-workers18 described in detail the effect of
Au : ligand molar ratio between on the core size of the AuNPs. They reported the
size of alkanethiols protected AuNPs was increased by increasing the ratio of gold to

Chapter 3
119
alkanethiols. This effect can be explained by slower ligand passivation as compared
to the growth of incipient AuNPs at lower ligand / gold ratio.
The change in size of AuNPs can be easily monitored by intensity of surface
plasmon band (SPB) using UV-Vis spectroscopy (as discussed in chapter 2, section
2.3.1). The bigger particles have more intense SPB as compared to the smaller
particles (Figure 3.17).15
We tested several methods for increasing the size of AuNPs protected by DTPA
based ligand 6. In the first instance, freshly prepared AuNPs were heated in the solid
state at 90-200 oC, but no significant increase in AuNP diameter (shown by UV-Vis
spectra, Figure 3.16) was observed. Even heating for longer period (i.e. for 12-24 h)
and at high temperature (i.e. 230-280 oC) failed to increase the size of the small
AuNPs.
300 400 500 600 700 8000.0
0.1
0.2
0.3
0.4
0.5
0.6
0.7
Absorbance
Wavelength / nm
No Heat
90 oC
130 oC
180 oC
230 oC
280 oC
Figure 3.16: UV-Vis spectra of small AuNPs heated at various temperatures in solid
state.
The second strategy was to vary the ratio between gold and ligand during synthesis.
Various ratios between gold and ligand such as 3/1, 5/1, 7/1 were used. No

Chapter 3
120
significant difference in size was observed by UV-Vis spectra, moreover the AuNPs
were not very stable. So this method was ruled out for growing the DTPA based
ligand protected AuNPs.
In a third approach, the crude aqueous solution of freshly prepared AuNPs was
heated at reflux and the increase in nanoparticle size was monitored by UV-Vis
spectroscopy. The crude AuNP synthesis mixture contained excess ligands which
were needed for stabilisation of AuNPs. The reflux temperature (i.e. boiling point) of
aqueous solution of AuNPs was increased by addition of ca. 20% v/v DMF. This
method was successful and UV-Vis spectra of grown AuNPs are shown in Figure
3.17. The exact diameter of grown AuNPs was then confirmed by TEM (discussed in
next section 3.4.1.1).
Figure 3.17: UV/Vis spectra of small and large AuNPs.
After the growth of aq AuNPs, DMF was removed by dialysis against deionised
water using 12-14 kDa dialysis tubing. The excess ligands were removed by gel
permeation chromatography using 0.1 M NaCl as an eluent and Sephadex gel (G-
100) as a stationary phase. The purified larger AuNPs were again dialysed against
deionised water to remove NaCl. The water was evaporated to get solid grown
AuNPs protected by DTPA ligand 6.
~ 2.0 nm ~ 4.0 nm ~ 6.0 nm
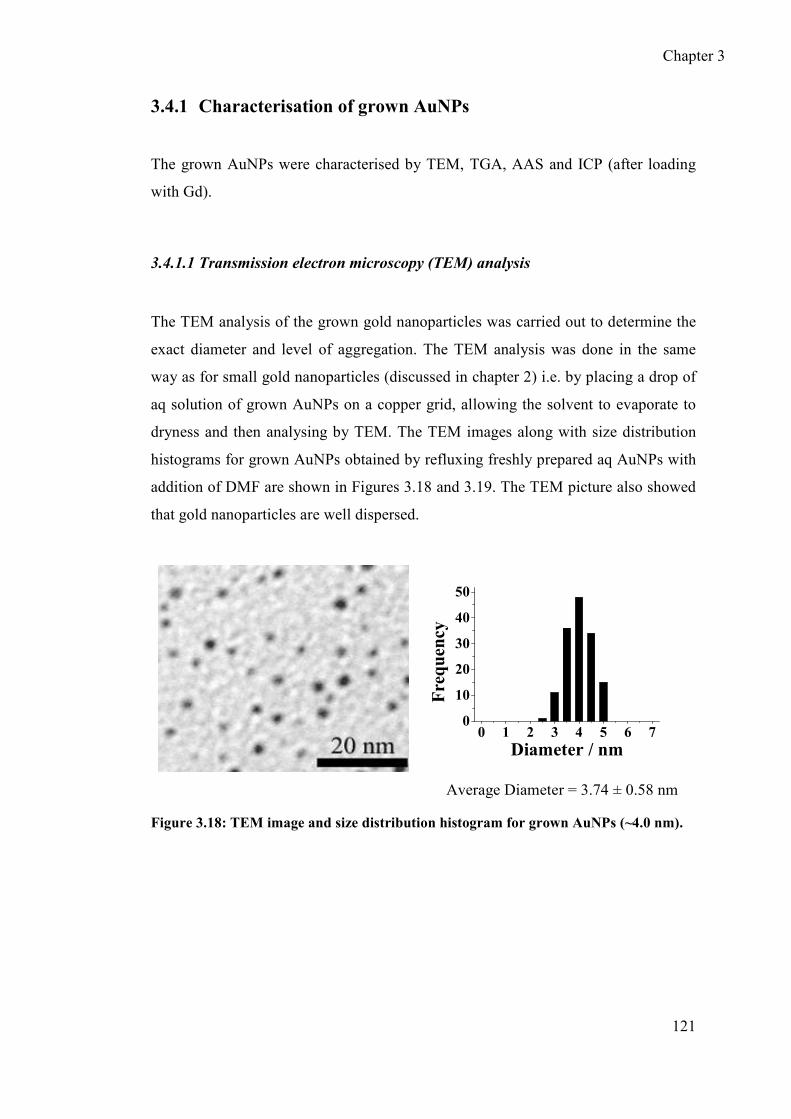
Chapter 3
121
3.4.1 Characterisation of grown AuNPs
The grown AuNPs were characterised by TEM, TGA, AAS and ICP (after loading
with Gd).
3.4.1.1 Transmission electron microscopy (TEM) analysis
The TEM analysis of the grown gold nanoparticles was carried out to determine the
exact diameter and level of aggregation. The TEM analysis was done in the same
way as for small gold nanoparticles (discussed in chapter 2) i.e. by placing a drop of
aq solution of grown AuNPs on a copper grid, allowing the solvent to evaporate to
dryness and then analysing by TEM. The TEM images along with size distribution
histograms for grown AuNPs obtained by refluxing freshly prepared aq AuNPs with
addition of DMF are shown in Figures 3.18 and 3.19. The TEM picture also showed
that gold nanoparticles are well dispersed.
0 1 2 3 4 5 6 70
10
20
30
40
50
Frequency
Diameter / nm
Average Diameter = 3.74 ± 0.58 nm
Figure 3.18: TEM image and size distribution histogram for grown AuNPs (~4.0 nm).
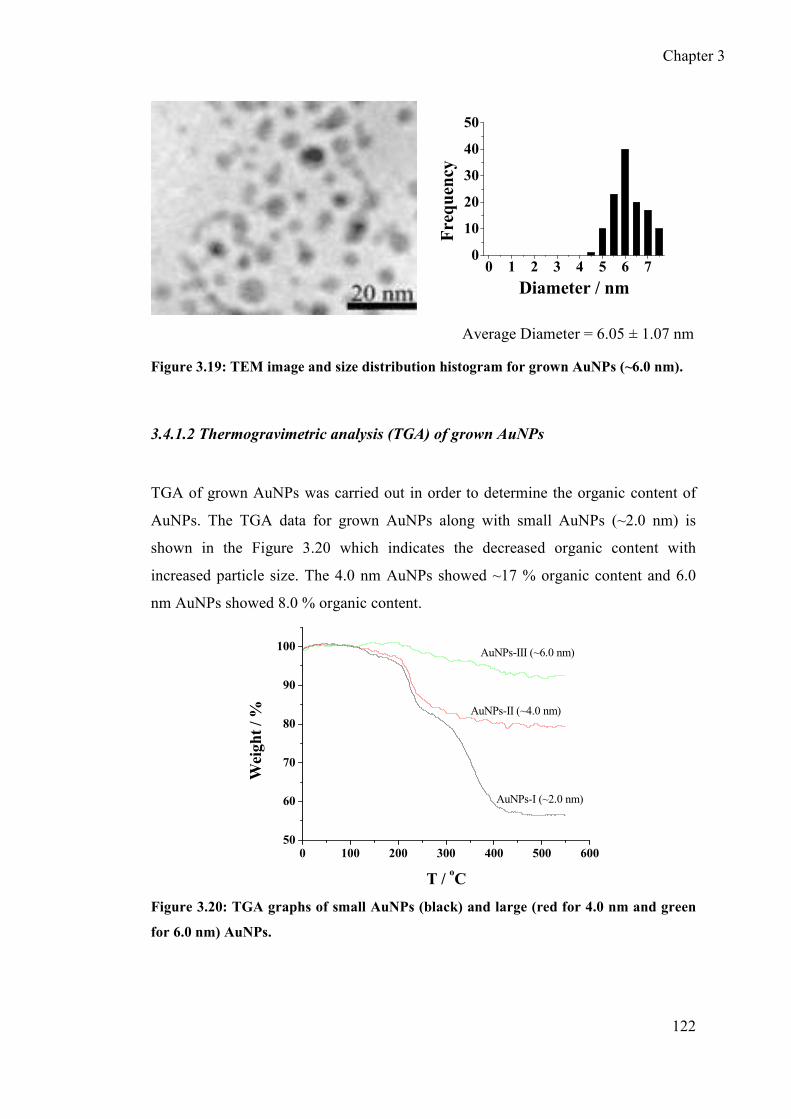
Chapter 3
122
0 1 2 3 4 5 6 70
10
20
30
40
50
Frequency
Diameter / nm
Average Diameter = 6.05 ± 1.07 nm
Figure 3.19: TEM image and size distribution histogram for grown AuNPs (~6.0 nm).
3.4.1.2 Thermogravimetric analysis (TGA) of grown AuNPs
TGA of grown AuNPs was carried out in order to determine the organic content of
AuNPs. The TGA data for grown AuNPs along with small AuNPs (~2.0 nm) is
shown in the Figure 3.20 which indicates the decreased organic content with
increased particle size. The 4.0 nm AuNPs showed ~17 % organic content and 6.0
nm AuNPs showed 8.0 % organic content.
0 100 200 300 400 500 60050
60
70
80
90
100 AuNPs-III (~6.0 nm)
AuNPs-II (~4.0 nm)
AuNPs-I (~2.0 nm)
Weight / %
T / oC
Figure 3.20: TGA graphs of small AuNPs (black) and large (red for 4.0 nm and green
for 6.0 nm) AuNPs.

Chapter 3
123
The ratio between gold and protecting ligand (Au / Ligand) was increased with
increased particle size because a greater proportion of the Au is located in the core
rather than at the surface. Therefore, fewer ligand molecules are required for
stabilisation of the larger AuNPs. This is well established in the literature.15 The
TGA graphs for grown AuNPs are shown in Figure 3.20.
3.4.1.3 ICP and AAS analysis of Gd-loaded large AuNPs
The AuNPs were analysed by ICP, AAS and UV-Vis spectroscopy after loading with
gadolinium and results are shown in Table 3.4.
Table 3.4: ICP, UV/Vis and AAS data for large (4.0 nm & 6.0 nm) Gd-loaded
AuNPs.
Technique Element AuNPs
diameter Metal content / %
ICP Gd 4.0 nm 4.21
6.0 nm 2.57
UV/Vis Gd 4.0 nm 4.39
6.0 nm 2.32
AAS Au 4.0 nm 70.35
6.0 nm 82.25
The results of different techniques are quite comparable to each other. The Gd
content was later used to determine the relaxivity of Gd-loaded AuNPs. The
increased gold content in grown AuNPs as compared to small AuNPs is also
confirmed by TGA analysis (as discussed in section 3.4.1.2.).

Chapter 3
124
3.4.2 Composition of grown AuNPs
Composition of large AuNPs was calculated by the same method as for the small
AuNPs (discussed in chapter 2). The average nanoparticle composition was
calculated for ~4.0 nm and ~6.0 nm Gd-loaded AuNPs:
Au1543 Ligand160 Gd128 (~ 4.0 nm AuNPs)
Au8429 Ligand65 Gd65 (~ 6.0 nm AuNPs)
3.4.3 Rotational time (τR) of ligand in large (4.0 and 6.0 nm) AuNPs
The large AuNPs were complexed with vanadyl as described in section 3.3. The ratio
between VO2+ and DTPA ligand@AuNPs was kept 1 / 3 in order to avoid spin-spin
interaction. The τR of grown (~4.0 nm and 6.0 nm) gold nanoparticles were
determined by simulating room temperature EPR spectra. The τR of free vanadyl,
VO-DTPA, VO-DTPA@AuNPs (~2.0 nm) VO-DTPA@AuNPs (~4.0 nm) and VO-
DTPA@AuNPs (~6.0 nm) are shown in Table 3.5.
Table 3.5: Rotational correlational time of VO2+, VO-DTPA and VO-
DTPA@AuNPs.
Paramagnetic Species τR / s
VOSO4 (Free VO2+) 4.52 × 10⁻¹¹
VO-DTPA@AuNPs (~2.0 nm) 1.03 × 10⁻¹⁰
VO-DTPA@AuNPs (~4.0 nm) 1.25×10⁻¹⁰
VO-DTPA@AuNPs (~6.0 nm) 1.90×10⁻¹⁰
The τR of the ligand in large (4.0 & 6.0 nm) AuNPs was not found to be significantly
different from the ligands in small AuNPs, but the τR in larger AuNPs (~6.0 nm)-
attached ligand was found to be reasonably higher (i.e. 4 fold) than that of free

Chapter 3
125
vanadyl. The increased τR with the increase in nanoparticle size suggested the
decreased tumbling of ligand at the surface of relatively larger AuNPs which might
give higher relaxivity of nanoparticle based MRI contrast agents. The effect of
decreased tumbling rate on relaxivity is discussed in the following section.
3.4.4 Relaxivity measurements of large AuNPs
Relaxivity measurements of large (~4.0 nm and ~6.0 nm) Gd-loaded AuNPs were
carried out using the same method as for the small Gd-loaded AuNPs. The R1 values
for small and large Gd-loaded AuNPs are shown in Table 3.6.
It was observed that r1 increased steadily with increased size of AuNPs. The increase
in r1 is directly attributed to the decreased tumbling of nanoparticle-attached ligand
in larger AuNPs as compared to small AuNPs as discussed in section 3.5. In the
larger AuNPs, the higher packing density of ligand due to tight packing resulted in
higher relaxivity (Figure 3.14).
Table 3.6: Relaxivity values of small and large AuNPs.
Although larger AuNP based contrast agents have higher (about 3 fold) relaxivity
than the small AuNPs, there are some disadvantages associated with larger AuNPs
which might not favour their use for real applications as MRI contrast agents. The
Gd-loaded gold
nanoparticles
Relaxivity / mM-1s-1
~ 2.0 nm
4.77
~ 4.0 nm
8.34
~ 6.0 nm
11.04

Chapter 3
126
larger AuNPs are relatively less stable19 and hence may be more toxic as compared
to the small AuNPs. Overall, our strategy of increasing nanoparticle size for
increasing relaxivity was successful but due to disadvantages (associated with large
nanoparticles) alternative methods / strategies were explored for increasing relaxivity
of small gold nanoparticle based MRI contrast agents. This is discussed in the next
section.
3.5 Polyelectrolyte self assembly around nanoparticles
An alternative strategy to decrease the tumbling of nanoparticle-attached ligands (in
order to enhance the relaxivity of gold nanoparticle based MRI contrast agents)
could include increasing the rigidity of the nanoparticle-attached ligands. The gold
nanoparticles protected by DTPA based ligand have overall significant negative
charge as each Gd-DTPA chelate has a -2 charge. The flexibility of charged
nanoparticle-attached ligands can thus be reduced by adsorbing oppositely charged
polyelectrolytes.
Polyelectrolytes are reported20 to self assemble around charged species i.e.
positively charged polyelectrolytes can form self assembled layers around
negatively charged species and vice versa. The main driving force for this
assembly is electrostatic interactions. Multilayered materials can be prepared by
layer by layer (LBL) self assembly technique. The LBL technique was developed
in 1997 by G. Decher.21 The LBL involves the alternating deposition of
oppositely charged polyelectrolytes on charged templates. For example as shown
in Figure 3.21, the positively charged solid substrate was selected as a template
and on this solid substrate the polyelectrolyte layers can be deposited by simply
dipping it into solutions containing charged polyelectrolyte of interest. After
formation of each layer, the excess / unbound molecules can be removed by
washing with a suitable solvent. The multilayer build up based on LBL is
schematically shown in Figure 3.21.

Chapter 3
127
Figure 3.21: Schematic diagram of layer by layer (LBL) self assembly (“A” for film
deposition process and “B” for simplified molecular picture) by consecutive adsorption
of cationic and anionic polyelectrolytes on positively charged solid substrate.21
The LBL principle can also be used to form multilayers of polyelectrolytes using
charged particles as templates. The charged particles are usually used to prepare
micro- and nanometre sized capsules, as the particle core after formation of
polyelectrolytes layers can be destroyed / dissolved by suitable solvents to get
hollow microcapsules. The micro- and nanometre sized capsules have wide range of
applications in drug delivery systems, gene therapy and biosensor devices. For
example, Kotov et al.22 successfully reported polyelectrolyte multilayer formation
around nanoparticles (Figure 3.22). Polyelectrolytes have also been reported to self-
assemble on the surface of charged gold nanoparticles.23-24
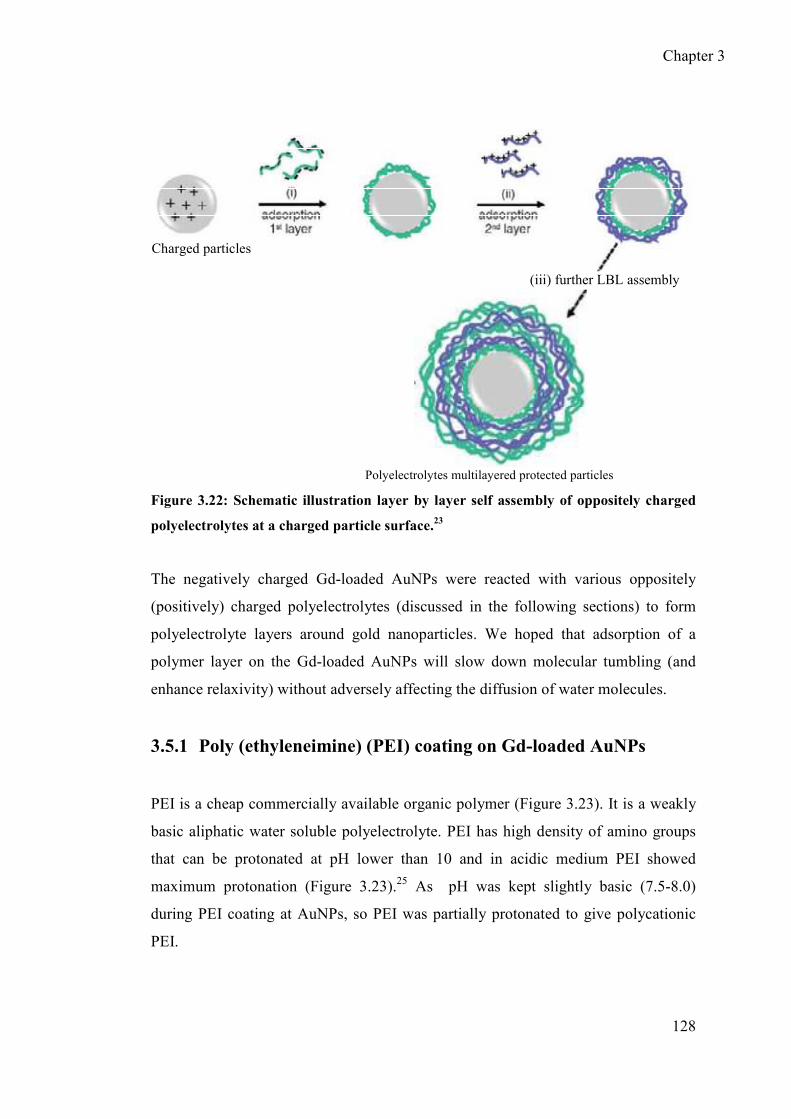
Chapter 3
128
Charged particles
Polyelectrolytes multilayered protected particles
(iii) further LBL assembly
Figure 3.22: Schematic illustration layer by layer self assembly of oppositely charged
polyelectrolytes at a charged particle surface.23
The negatively charged Gd-loaded AuNPs were reacted with various oppositely
(positively) charged polyelectrolytes (discussed in the following sections) to form
polyelectrolyte layers around gold nanoparticles. We hoped that adsorption of a
polymer layer on the Gd-loaded AuNPs will slow down molecular tumbling (and
enhance relaxivity) without adversely affecting the diffusion of water molecules.
3.5.1 Poly (ethyleneimine) (PEI) coating on Gd-loaded AuNPs
PEI is a cheap commercially available organic polymer (Figure 3.23). It is a weakly
basic aliphatic water soluble polyelectrolyte. PEI has high density of amino groups
that can be protonated at pH lower than 10 and in acidic medium PEI showed
maximum protonation (Figure 3.23).25 As pH was kept slightly basic (7.5-8.0)
during PEI coating at AuNPs, so PEI was partially protonated to give polycationic
PEI.

Chapter 3
129
NHNHn
N
H2+
NH2
+n
pH ~ 7.5-8.0
Figure 3.23: Poly (ethyleneimine) (PEI).
The polycationic PEI can adsorb at the surface of negatively charged Gd-loaded
AuNPs (Figure 3.24). PEIs are available in different molecular masses.26 Three
different PEIs (PEI-1, 2 and 3) with number average molar masses (Mn) 423, 1800
and 60000 Da, respectively were selected. The ratio between NH+ and Gd-
DTPA@AuNPs- was kept 2 / 1 to ensure complete adsorption of PEI. The pH of the
PEI-protected-Gd-loaded AuNPs (Figure 3.19) was controlled using dilute HCl
around physiological range (~7.5-8.0).
NH2
+
H2N+
H2N+
H2N+H2N+
H2N+
n N
H
OO
N
NN
OO
OO
O
O
SO
OO
Au
H2O
Gd3+
Figure 3.24: PEI-protected Gd-loaded AuNPs.
Before measuring relaxivity of polyelectrolyte coated Gd-loaded AuNPs, their
stability was tested as discussed below.
3.5.2 Stability of polyelectrolyte coated Gd-loaded AuNPs
The stability of polyelectrolytes coated AuNPs was tested by UV-Vis spectroscopy
and electron microscopy. UV-Vis spectra showed that the PEI-protected Gd-loaded
AuNPs exhibited the SPB at the same position as the nanoparticles without any PEI

Chapter 3
130
coating (Figure 3.25). Thus, the nanoparticles after polyelectrolyte coating are not
aggregated.
400 500 600 700 800
0.0
0.1
0.2
0.3
0.4
0.5
0.6
Absorbance
Wavelength / nm
Figure 3.25: UV-Vis spectra of Gd-loaded AuNPs without PEI coating (green) and with
PEI (red) coating.
Similarly, the TEM images of polyelectrolyte coated AuNPs also showed that the
AuNPs are well dispersed and no aggregation was observed. A typical TEM image
with size distribution histogram of PEI-1 protected AuNPs is shown in Figure 3.26.
Both UV-Vis and TEM data confirmed the stability of nanoparticles after
polyelectrolyte coating. The relaxivity of polyelectrolyte coated-Gd-loaded AuNPs is
discussed in the next section.
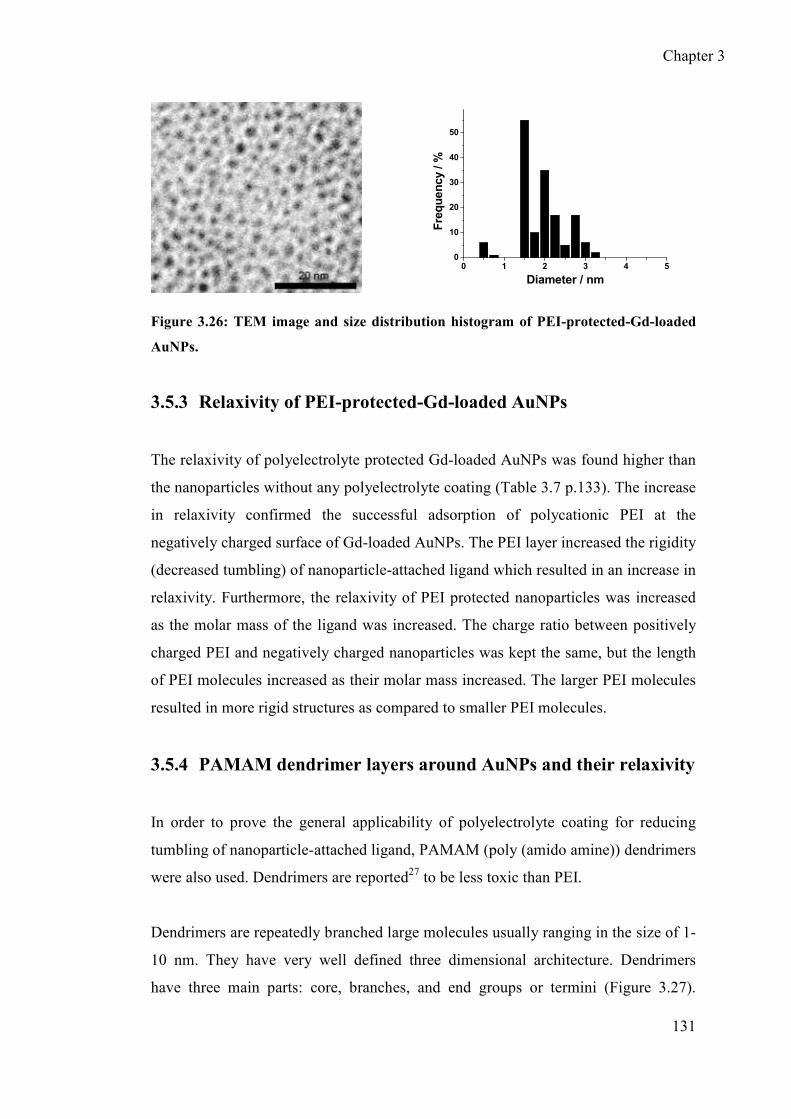
Chapter 3
131
0 1 2 3 4 50
10
20
30
40
50
Frequency / %
Diameter / nm
Figure 3.26: TEM image and size distribution histogram of PEI-protected-Gd-loaded
AuNPs.
3.5.3 Relaxivity of PEI-protected-Gd-loaded AuNPs
The relaxivity of polyelectrolyte protected Gd-loaded AuNPs was found higher than
the nanoparticles without any polyelectrolyte coating (Table 3.7 p.133). The increase
in relaxivity confirmed the successful adsorption of polycationic PEI at the
negatively charged surface of Gd-loaded AuNPs. The PEI layer increased the rigidity
(decreased tumbling) of nanoparticle-attached ligand which resulted in an increase in
relaxivity. Furthermore, the relaxivity of PEI protected nanoparticles was increased
as the molar mass of the ligand was increased. The charge ratio between positively
charged PEI and negatively charged nanoparticles was kept the same, but the length
of PEI molecules increased as their molar mass increased. The larger PEI molecules
resulted in more rigid structures as compared to smaller PEI molecules.
3.5.4 PAMAM dendrimer layers around AuNPs and their relaxivity
In order to prove the general applicability of polyelectrolyte coating for reducing
tumbling of nanoparticle-attached ligand, PAMAM (poly (amido amine)) dendrimers
were also used. Dendrimers are reported27 to be less toxic than PEI.
Dendrimers are repeatedly branched large molecules usually ranging in the size of 1-
10 nm. They have very well defined three dimensional architecture. Dendrimers
have three main parts: core, branches, and end groups or termini (Figure 3.27).
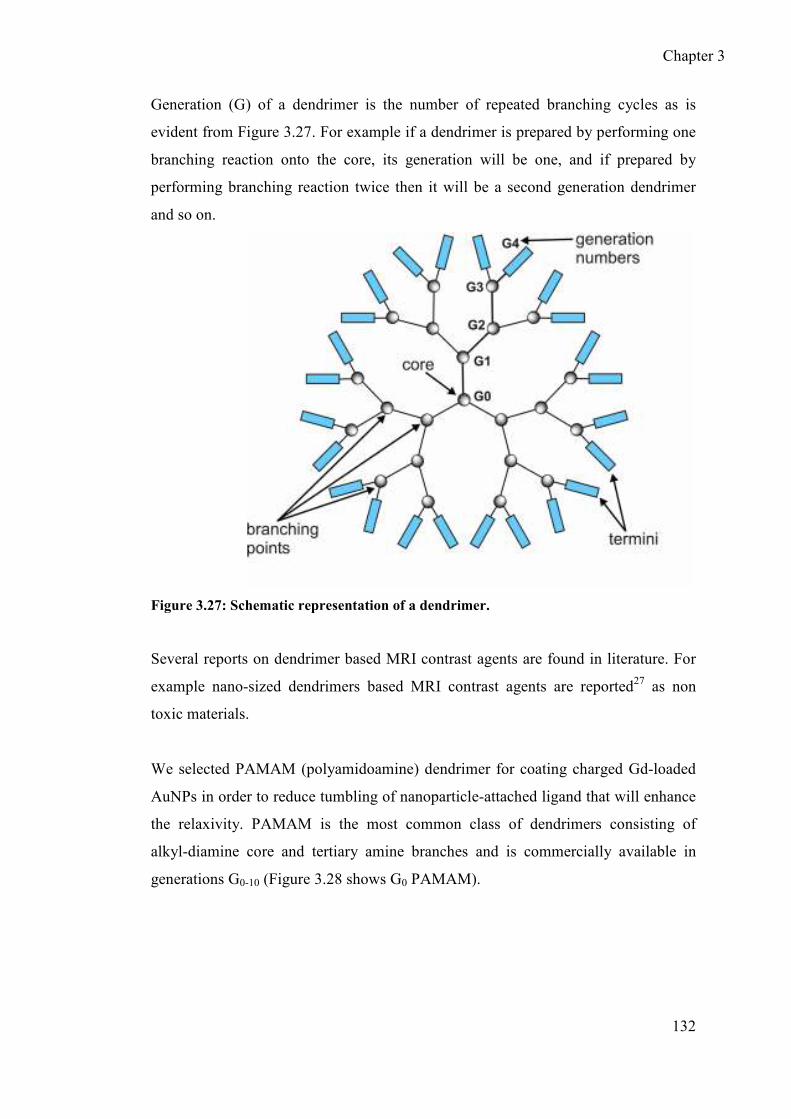
Chapter 3
132
Generation (G) of a dendrimer is the number of repeated branching cycles as is
evident from Figure 3.27. For example if a dendrimer is prepared by performing one
branching reaction onto the core, its generation will be one, and if prepared by
performing branching reaction twice then it will be a second generation dendrimer
and so on.
Figure 3.27: Schematic representation of a dendrimer.
Several reports on dendrimer based MRI contrast agents are found in literature. For
example nano-sized dendrimers based MRI contrast agents are reported27 as non
toxic materials.
We selected PAMAM (polyamidoamine) dendrimer for coating charged Gd-loaded
AuNPs in order to reduce tumbling of nanoparticle-attached ligand that will enhance
the relaxivity. PAMAM is the most common class of dendrimers consisting of
alkyl-diamine core and tertiary amine branches and is commercially available in
generations G0-10 (Figure 3.28 shows G0 PAMAM).

Chapter 3
133
NN
HN
NHNH
HN
NH2
NH2H2N
H2N
O
O
O
O
NN
HN
NHNH
HN
N+H3
N+H3
H3N+
O
O
O
O
PAMAM dendrimer G0 Positively charged PAMAM in aq solution
H3N+
H+
Figure 3.28: Zero generation PAMAM dendrimer (in aq solution).
PAMAM is water soluble as it has hydrophilic end groups. In the aq solution,
PAMAM gets partially protonated. Two generations of PAMAM i.e. G0 and G4 were
selected in our study. The PAMAM protected Gd-loaded AuNPs exhibited higher
relaxivity as compared to nanoparticles without any dendrimers (Table 3.7). The G0
PAMAM protected nanoparticles did not show any increase in relaxivity, but G4
PAMAM showed ~50% increase in relaxivity as compared to nanoparticles without
any dendrimers protection. This increase is somewhat (~5%) higher than for the PEI-
protected-Gd-loaded AuNPs. The PAMAM dendrimers due to their branched
structure resulted in more rigid structure when they adsorbed at the charged surface
of Gd-loaded AuNPs. The more rigid structure decreased the tumbling of
nanoparticle-attached ligands which enhanced the relaxivity.

Chapter 3
134
Table 3.7: R1 of polyelectrolyte and dendrimer coated Gd-loaded AuNPs.
Gd-Compound Molar Mass of
Polyelectrolyte and
Dendrimer / Da
r1 / mM-1s-1 Increase in r1
relative to Gd-
AuNPs / %
Gd-AuNPs - 4.77 -
PEI-1-Gd-AuNPs 423 6.50 36
PEI-2-Gd-AuNPs 1800 6.74 41
PEI-3-Gd-AuNPs 60000 7.00 46
PAMAM (G0)-Gd-
AuNPs
517 4.74 -
PAMAM (G4)-Gd-
AuNPs
14000 7.10 50
3.5.5 Layer by layer assembly of polyelectrolytes around Gd-loaded
AuNPs
In the above section, the Gd-loaded AuNPs were protected by monolayers of various
polyelectrolytes and dendrimers that resulted in reduced tumbling of nanoparticle-
attached ligand and consequently an increase in r1 was observed. In order to further
increase relaxivity, multilayers of polyelectrolytes were assembled around AuNPs.
The multilayers were formed by LBL technique (discussed in section 3.5) which

Chapter 3
135
involves sequential coating by oppositely charged polyelectrolytes.28-29 PEI (Figure
3.23) and poly (acrylic acid) (PAA) (negatively charged) (Figure 3.29)
polyelectrolytes were selected for multilayers formation. Two different PEIs (PEI-I
and PEI-II) with molar masses 1300 and 2000 respectively, and two different PAAs
(PAA-I and PAA-II) with molar masses 1200 and 2100 were selected. On the
negatively charged surface of Gd-loaded AuNPs, positively charged PEI layer was
coated first. The excess PEI was removed by dialysis against deionised water using
12-14 kDa dialysis tubing. The PAA was then coated on positively charged PEI-Gd-
DTPA@AuNPs. The PAA-PEI-Gd-DTPA@AuNPs (Figure 3.30) were again
dialysed to remove the excess PAA. The removal of excess polyelectrolytes i.e. PEI
and PAA by dialysis was confirmed by a control test. In the control test, ca. 100 mg
of each polyelectrolyte dissolved in ca. 10 mL of deionised water was dialysed
against deionised water. The dialysis showed complete disappearance of
polyelectrolytes which confirmed that the excess polyelectrolytes could pass through
the dialysis membrane and thus could be removed. In this way, multilayers of
oppositely charged polyelectrolytes were formed at Gd-loaded AuNPs (Figure 3.30).
*
O O
n
Figure 3.29: Chemical structure of PAA polyelectrolyte.

Chapter 3
136
Figure 3.30: Polyelectrolyte multilayers on the surface of Gd-loaded AuNPs
The relaxivity (r1) was measured after formation of each layer at Gd-loaded AuNPs
and a plot of r1 values against the number of polyelectrolyte layers is shown in
Figure 3.31.
NH
O
ON
N
N
O O
O
O O
O
S
O O O N
HOO
N
N
NO O
O
O O
O
SO
O
O
NH
O O
N
N
N O
O
O O
O O
SO
O
O
NH
O
O N
N
N
OO
O
O
O
O
S
O
OO
H2O
A u
G d 3+
H2O
G d 3+
H 2OG d3+
H2O
Gd3+
(+) Charged PEI layers
(-) Charged PAA layers

Chapter 3
137
0
1
2
3
4
5
6
7
8
0 1 2 3 4 5 6
No. of polyelectrolytes layers
R1 / mM
-1s-1
PEI (1300) + PAA (1200)
PEI (2000) + PAA (2100)
Figure 3.31: R1 values vs no of polyelectrolyte layers@ Gd-loaded AuNPs
Figure 3.31 shows that initially r1 increased with the increased number of
polyelectrolyte layers. The increase in r1 is due to the progressive reduction in the
tumbling of nanoparticle-attached ligand. Interestingly, in case of PEI-I and PAA-I, a
plateau was then reached. Despite the reduced tumbling of nanoparticle-attached
ligand, presumably the slower water exchange rate between Gd-DTPA chelates at
AuNP surface and the surrounding medium also affected the r 1. Furthermore, rapid
loss in r1 was observed after the fourth layer of polyelectrolyte. The rapid loss in R1
suggested the drop in water exchange rate between Gd at nanoparticle surface and
surrounding medium. Peyratout et al.30 reported that the water exchange through
polyelectrolyte layers is strongly affected by thickness of the layer. Thus it can be
suggested that the rapid loss in r1 occurred due to increased thickness of
polyelectrolyte layers which hindered the water exchange.
The effect of polyelectrolyte multilayers on relaxivity of Gd-loaded AuNPs was
further confirmed using another pair of polyelectrolytes with higher molar masses.
PEI-II and PAA-II coated AuNPs were prepared and their relaxivity was measured.
The relaxivity behaviour of PEI-II-PAA-II is depicted in Figure 3.31. The greater

Chapter 3
138
increase in r1 was observed by PEI-II and PAA-II as compared to PEI-I and PAA-I.
The effect of molar mass of polyelectrolyte on relaxivity has already been discussed
in section 3.5.1 (Table 3.7). The other difference is the rapid loss in r1 after
formation of only two layers. Presumably the larger polyelectrolytes formed
relatively thick layers which hindered the water exchange resulting in sudden
decrease in r1.
3.6 Conclusions
The EPR analysis of vanadyl labelled AuNPs showed that fairly high tumbling rate
of nanoparticle-attached ligand limited the increase in relaxivity of Gd-loaded
AuNPs as compared to the small molecule based MRI contrast agents. The relaxivity
can be increased further by reducing the tumbling of nanoparticle-attached ligand.
Two strategies were developed to reduce the tumbling of nanoparticle-attached
ligand. The small (~ 2.0 nm) gold nanoparticles were grown into larger nanoparticles
(4-6 nm). The larger nanoparticles have more flat surface (smaller curvature). At the
more flat surface of larger nanoparticles the tumbling of ligand was decreased due to
higher ligand density / tighter ligand packing. The increased nanoparticle size led to
higher relaxivity.
The Gd-DTPA chelates have a significant negative charge at AuNPs surface. This
negative charge can be neutralised by adsorbing oppositely charged polyelectrolytes.
The adsorption of oppositely charged polyelectrolytes at the charged nanoparticles
increased the rigidity of nanoparticle-attached ligand. The increased rigidity resulted
in an increase in relaxivity.

Chapter 3
139
3.7 References
1. P. J. Debouttiere, S. Roux, F. Vocanson, C. Billotey, O. Beuf, A. Favre-
Reguillon, Y. Lin, S. Pellet-Rostaing, R. Lamartine, P. Perriat and O.
Tillement, Adv. Funct. Mater., 2006, 16, 2330-2339.
2. C. Alric, J. Taleb, G. L. Duc, C. Mandon, C. Billotey, A. L. Meur-Herland,
T. Brochard, F. Vocanson, M. Janier, P. Perriat, S. Roux and O. Tillement, J.
Am. Chem. Soc., 2008, 130, 5908-5915.
3. A. E. Merbach and E. Toth, The Chemistry of Contrast Agents in Medical
Magnetic Resonance Imaging, John Wiley & Sons, 2001, pp. 45-119.
4. R. S. Mccomber, A complete Introduction to Modern NMR Spectroscopy,
John Wiley & Sons, 1998, pp. 13-20.
5. M. Brustolon and E. Giamello, Electron Paramagnetic Resonance, John
Wiley & Sons, 2009, CH. 1-2.
6. J. A. Weil, J. R. Bolton and J. E. Wertz, Electron Paramagnetic Resonance:
Elementary Theory and Practical Applications, John Wiley & Sons, 1994,
CH. 3-5.
7. F. Gerson and W. Huber, Electron Spin Resonance Spectroscopy of Organic
Radicals, John Wiley & Sons, 2003, pp. 97-153.
8. R. Garzelli, Ph.D thesis, The University of York, 2007, pp. 7-11.
9. J. W. Chen, F. P. Auteri, D. E. Budil, R. L. Belford and R. B. Clarkson, J.
Phys. Chem., 1994, 98, 13452-13459.
10. J. W. Chen, R. L. Belford and R. B. Clarkson, J. Phys. Chem. A, 1998, 102,
2117-2130.
Chapter 3
140
11. E. C. Wiener, F. P. Auteri, J. W. Chen, M. W. Brechbiel, O. A. Gansow, D.
S. Schneider, R. L. Belford, R. B. Clarkson and P. C. Lauterbur, J. Am.
Chem. Soc., 1996, 118, 7774-7782.
12. S. Stoll and A. Schweiger, J. Magn. Reson., 2006, 178, 42-55.
13. S. F. Oppenheim, G. R. Buettner and V. G. J. Rodgers, J. Membrane Sci.,
1996, 118, 133-139.
14. B. C. Mei, E. Oh, K. Susumu, D. Farrell, T. J. Mountziaris and H. Mattoussi,
Langmuir, 2009, 25, 10604-10611.
15. T. Teranishi, S. Hasegawa, T. Shimizu and M. Miyake, Adv. Mater., 2001,
13, 1699-1701.
16. X. Sun, X. Jiang, S. Dong and E. Wang, Macromol. Rapid. Comm., 2003, 24,
1024-1028.
17. T. Shimizu, T. Teranishi, S. Hasegawa and M. Miyake, J. Phys. Chem. B,
2003, 107, 2719-2724.
18. M. J. Hostetler, J. E. Wingate, C.-J. Zhong, J. E. Harris, R. W. Vachet, M. R.
Clark, J. D. Londono, S. J. Green, J. J. Stokes, G. D. Wignall, G. L. Glish, M.
D. Porter, N. D. Evans and R. W. Murray, Langmuir, 1998, 14, 17-30.
19. T. Stakenborg, S. Peeters, G. Reekmans, W. Laureyn, H. Jans, G. Borghs and
H. Imberechts, J. Nanopart. Res., 2008, 10, 143-152.
20. W. Tong, C. Gao and H. Möhwald, Polym. Adv. Technol., 2008, 19, 817-823.
21. G. Decher, Science, 1997, 277, 1232-1237.
22. J. W. Ostrander, A. A. Mamedov and N. A. Kotov, J. Am. Chem. Soc., 2001,
123, 1101-1110.
23. P. R. Gil, L. L. del Mercato, P. del Pino, A. Muñoz Javier and W. J. Parak,
Nano Today, 2008, 3, 12-21.

Chapter 3
141
24. C. Lu, H. Möhwald and A. Fery, J. Phys. Chem. C, 2007, 111, 10082-10087.
25. M. Amara and H. Kerdjoudj, Desalination, 2003, 155, 79-87.
26. A. R. Vancha, S. Govindaraju, K. V. L. Parsa, M. Jasti, M. Gonzalez-Garcia
and R. P. Ballestero, BMC Biotechnol., 2004, 4.
27. H. Kobayashi and M. W. Brechbiel, Adv. Drug Delivery Rev., 2005, 57,
2271-2286.
28. D. Grigoriev, D. Gorin, G. B. Sukhorukov, A. Yashchenok, E. Maltseva and
H. Möhwald, Langmuir, 2007, 23, 12388-12396.
29. A. P. R. Johnston, C. Cortez, A. S. Angelatos and F. Caruso, Curr. Opin.
Colloid Interface Sci., 2006, 11, 203-209.
30. C. S. Peyratout and L. Dähne, Angew. Chem. Int. Ed., 2004, 43, 3762-3783.

Chapter 4
142
4 Chapter 4: Gold nanoparticles protected by nitroxide
based ligand as redox sensitive MRI contrast agents
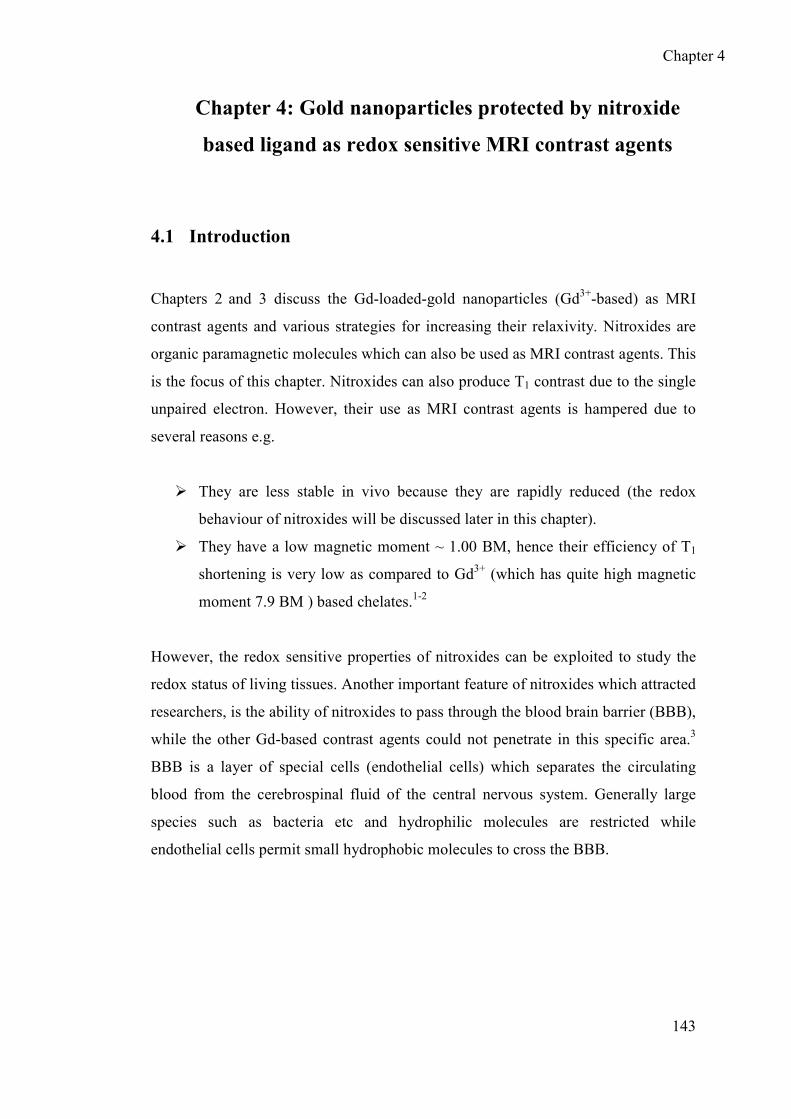
Chapter 4
143
Chapter 4: Gold nanoparticles protected by nitroxide
based ligand as redox sensitive MRI contrast agents
4.1 Introduction
Chapters 2 and 3 discuss the Gd-loaded-gold nanoparticles (Gd3+-based) as MRI
contrast agents and various strategies for increasing their relaxivity. Nitroxides are
organic paramagnetic molecules which can also be used as MRI contrast agents. This
is the focus of this chapter. Nitroxides can also produce T1 contrast due to the single
unpaired electron. However, their use as MRI contrast agents is hampered due to
several reasons e.g.
� They are less stable in vivo because they are rapidly reduced (the redox
behaviour of nitroxides will be discussed later in this chapter).
� They have a low magnetic moment ~ 1.00 BM, hence their efficiency of T1
shortening is very low as compared to Gd3+ (which has quite high magnetic
moment 7.9 BM ) based chelates.1-2
However, the redox sensitive properties of nitroxides can be exploited to study the
redox status of living tissues. Another important feature of nitroxides which attracted
researchers, is the ability of nitroxides to pass through the blood brain barrier (BBB),
while the other Gd-based contrast agents could not penetrate in this specific area.3
BBB is a layer of special cells (endothelial cells) which separates the circulating
blood from the cerebrospinal fluid of the central nervous system. Generally large
species such as bacteria etc and hydrophilic molecules are restricted while
endothelial cells permit small hydrophobic molecules to cross the BBB.

Chapter 4
144
4.1.1 Nitroxide based contrast agents
In the early 1980s, nitroxides were identified as potential MRI contrast agents due to
the previously mentioned features i.e. paramagnetism and permeability through
BBB. In 1983, Brasch and co-workers4 published a preliminary report on the
utilization of nitroxides as contrast agents for MRI. They used a
piperidinyl derivative of stable nitroxide radical to study the brains of living animals
and found that the nitroxide based free radical crossed the BBB (which was
confirmed by MRI). After confirming the feasibility of using nitroxides as MRI
contrast agents in animals, their stability was studied. Couet et al.5 described the
stability of two different nitroxides (Figure 4.1) (a) a six member ring i.e. N-
succinyl-4-amino-2,2,6,6-tetramethylpiperidine-1-oxyl (TES) and (b) a five member
ring i.e. 2,2,5,5-tetramethylpyrrolidine-1-oxyl-3-carboxylic acid (PCA), in vitro as
well as in vivo.
N
O
N O
COOH
N
O
COOH
TES PCA
Figure 4.1: Chemical structures of TES (piperidinyl based nitroxide) and PCA
(pyrrolidinyl based nitroxide).5
Both the in vivo and in vitro studies confirmed that PCA is more resistant to
reduction and hence is more stable as compared to TES. The five-membered ring
based PCA is more stable than six-membered TES because it is planar rather than
puckered.

Chapter 4
145
To increase the efficiency of nitroxide based MRI contrast agents, dendrimers were
selected as templates. At the termini of dendrimer molecules, several nitroxide
moieties can be attached (Figure 4.2).6-8 It has been found that for higher generation
dendrimers, extensive line broadening could be observed due to spin-spin exchange
interactions. Yordanov et al.7 reported spin labelled dendrimers in EPR imaging
studies. They selected the PAMAM (G 6) dendrimer and different amounts (e.g. 198
and 80) of nitroxides were attached on them. Their studies showed that with the
increased number of nitroxides, the tendency of dendrimers to aggregate could
increase which hinders the in vivo applications. The aggregation of nitroxide-
attached dendrimers may be due to highly lipophilic nature of their surface.
Figure 4.2: G2 DAB dendrimer containing 16 nitroxide moieties.6
Winalski et al.152 described the relaxation measurements of different dendrimers
functionalised with various numbers of nitroxides. Three different types of
dendrimers were selected (a) tris(2-aminoethyl)amine (TREN) (b) DAB and (c)
PAMAM. To these dendrimers, nitroxides were attached. The relaxivity of these
dendrimer based nitroxides was increased with the increased number of nitroxides to
a certain level of dendrimer generation and then became approximately constant.
This might be due to sharing of hydration spheres by nitroxides in higher

Chapter 4
146
generations. The sharing of hydration spheres may be due to hydrogen bonding
between amides of the terminal groups. The relaxivity of PAMAM (G 4) containing
32 nitroxides was found even higher (5.00 mM-1s-1) than the Gd-DTPA
(4.76 mM-1s-1). In fact the relaxivity per nitroxide was 0.18 mM-1s-1. Many other
reports can be found in the literature describing the utilization of nitroxides as MRI
contrast agents.2, 4, 9-11
We used gold nanoparticles as a template for nitroxides based MRI contrast agents.
Nanoparticles make it possible to attach several nitroxides per particle. The
nanoparticle-attached nitroxides were expected to have better relaxivity due to
reduced tumbling of nanoparticle-attached nitroxides. Furthermore, gold
nanoparticles might be able to pass through BBB after coating with suitable
biomolecules such as carbohydrates etc.
Gold nanoparticles protected by nitroxide radical based ligands could not be
synthesized by Brust et al.12 protocol, because nitroxide radicals are decomposed
during the reduction of Au(III) to Au(0). Therefore the nitroxide protected gold
nanoparticles found in literature13-15 were prepared by a ligand exchange approach
using triphenylphosphine (PPh3@AuNPs) protected AuNPs. The nitroxide protected
AuNPs prepared by this strategy could not be utilised for the purpose of MRI
contrast agents due to several reasons. Firstly, they were insoluble in aqueous
medium (the MRI contrast agents must be water soluble). Secondly the ligand
exchange approach may lead to the incomplete exchange reaction particularly at
room temperature (Figure 4.3). The elevated temperature could result in complete
ligand exchange but may be accompanied by some decomposition of the nitroxide
radicals.
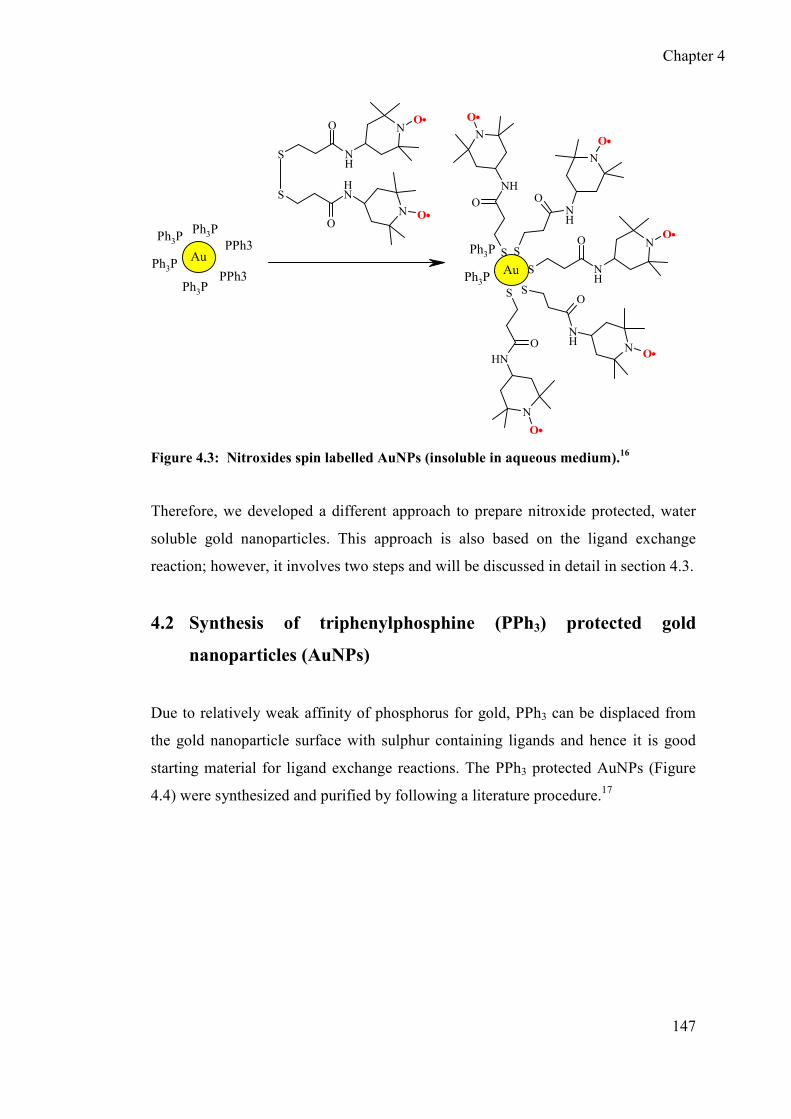
Chapter 4
147
N O
NO
S
S
O
O
NH
NH N
O
S
ONH
NO
S
O
NH
N
O
S
O
NH
N
O
S
ONH
NO
SO
NH
Au
Ph3P
Ph3P
Ph3P
Ph3PPPh3
PPh3 Au
Ph3P
Ph3P
Figure 4.3: Nitroxides spin labelled AuNPs (insoluble in aqueous medium).16
Therefore, we developed a different approach to prepare nitroxide protected, water
soluble gold nanoparticles. This approach is also based on the ligand exchange
reaction; however, it involves two steps and will be discussed in detail in section 4.3.
4.2 Synthesis of triphenylphosphine (PPh3) protected gold
nanoparticles (AuNPs)
Due to relatively weak affinity of phosphorus for gold, PPh3 can be displaced from
the gold nanoparticle surface with sulphur containing ligands and hence it is good
starting material for ligand exchange reactions. The PPh3 protected AuNPs (Figure
4.4) were synthesized and purified by following a literature procedure.17

Chapter 4
148
P P
P
Au
Figure 4.4: Triphenylphosphine protected gold nanoparticles.
PPh3 protected AuNPs were characterised by conventional techniques e.g. UV-Vis,
TEM and TGA. The UV-Vis spectrum showed SPB at 520-525 nm. TGA showed
ca. 25 % organic content in the AuNPs. This low amount of ligand corresponds to
the large steric bulk of ligand (PPh3) as compared to straight chain ligands. This
amount of organic content (i.e. PPh3) determined from TGA will be used to calculate
the stoichiometry for further ligand exchange reactions. The diameter determined
from the TEM image of the PPh3@AuNPs was found 1.91 ± 0.24 nm.
4.3 Synthesis of gold nanoparticles protected by nitroxide based
ligand
We prepared nitroxide protected water soluble AuNPs using a modified ligand
exchange approach18 which involved two steps. In the modified ligand exchange
approach, the triphenylphosphine molecules were exchanged with a relatively more
stable ligand DSP (dithiobis [succinimdylpropionate]) ligand at relatively elevated
temperature (i.e. 50 oC) in chloroform. The ligand exchange reaction at elevated
temperature (i.e. 50 oC) was done to ensure the complete ligand exchange reaction.

Chapter 4
149
N
O
O
S
O
O SO
OH
N
O
NH
SO
NO
NH
S
O
N
O
O
S
O
O N
O
O
S
O
O
N
O
NH2
Au
Ph3P
Ph3P
Ph3P
Ph3PDSP
Au
AuNPs 1
Chloroform Chloroform
50 C
amino-TEMPOAu
AuNPs 2 AuNPs 3
PPh3
PPh3
DSP
= =
Nitroxide Protected AuNPs
Amino-TEMPO
50 oC
Ligand A
Ligand B
Figure 4.5: Scheme showing synthesis of AuNPs protected by nitroxides based ligand.
The AuNPs protected by DSP (i.e. after first step of ligand exchange approach)
could not be purified, because the DSP ligand can be easily hydrolysed during
purification. As free DSP ligand was not removed, excess amount of amino-TEMPO
was required in the second step. 1.0 min after the addition of DSP to the
PPh3AuNPs, the amino-TEMPO solution in chloroform was added. The amino
(-NH2) group of amino-TEMPO reacted rapidly with the activated ester group of the
DSP ligand at the AuNP surface to form stable amide linkage (Figure 4.5). NHS
esters are easy to hydrolyze by adventitious water; this small amount of carboxylate
(Figure 4.5) will make the gold nanoparticles soluble in aqueous media. After
stirring the reaction mixture for ca. 2h, the solvent was evaporated at room
temperature, and AuNPs were purified using Sephadex LH-20 as a stationary phase
and MeOH as an eluent. The purified AuNPs protected by nitroxide based ligand
were quite soluble in MeOH, and furthermore the concentrated solution of these
nanoparticles in MeOH was miscible with deionised water. The miscibility with
water confirmed our assumption that some of the NHS groups of DSP ligand were
hydrolysed into carboxylic acid (-COOH) groups (Figure 4.5). The purified AuNPs

Chapter 4
150
protected by nitroxide based ligand were characterised by UV-Vis, TEM
spectroscopies, TGA, elemental analysis and EPR (characterisation is discussed in
the next section).
4.3.1 Characterisation of AuNPs protected by nitroxide based
ligand
The purified AuNPs were characterised by UV-Vis., TEM, TGA, elemental analysis
and EPR spectroscopy which are discussed below.
4.3.1.1 UV-Vis spectrum of AuNPs protected by nitroxide based ligand
The UV-Vis spectrum of gold nanoparticles protected by nitroxide based ligand
showed SPB at 520-525 nm (Figure 4.6), which confirmed the formation of gold
nanoparticles and its intensity is consistent with the size (~2.0 nm) of the
nanoparticles.
400 500 600 700 800
0.2
0.3
0.4
0.5
0.6
0.7
0.8
Absorbance
Wavelength / nm
Figure 4.6: UV-Vis spectrum of AuNPs protected by nitroxide based ligand

Chapter 4
151
4.3.1.2 TEM
A TEM image of nitroxide based ligand protected AuNPs was recorded by the same
method as for the DTPA ligand protected AuNPs (discussed in ch. 2 and 3). The
TEM image shows well dispersed gold nanoparticles with an average diameter 2.12
± 0.39 nm (Figure 4.7).
0 1 2 3 4 50
10
20
30
40
Frequency / No.
Diameter / nm
Figure 4.7: TEM image and size distribution histogram of AuNPs protected by
nitroxides based ligand
4.3.1.3 TGA of AuNPs protected by nitroxide based ligand
The thermogravimetric analysis (Figure 4.8) showed ca. 32% of total organic matter
present on the gold nanoparticle surface. As mentioned in section 4.3, it is possible
that two different types of ligands are present at the nanoparticles surface. Hence for
the exact determination of nanoparticle composition, elemental analysis of the
nanoparticles was carried out and is discussed in the next section.

Chapter 4
152
0 100 200 300 400 500 60065
70
75
80
85
90
95
100
Weight / %
T / oC
Figure 4.8: TGA graph of AuNPs protected by nitroxide based ligand.
4.3.1.4 Elemental analysis of AuNPs protected by nitroxide based ligand
The elemental analysis was carried out to estimate the nanoparticle composition. The
best fit composition (Au : LigandA: LigandB = 34 : 13 : 1) (Table 4.1) (Figure 4.5)
determined from elemental analysis was found to be in agreement with the TGA
results.
Table 4.1: Percentage composition of various elements present in nitroxide protected
AuNPs.
Element C H N Au
% Theory
17.69
2.85
3.15
68
% Found
19.05
2.42
3.08
65
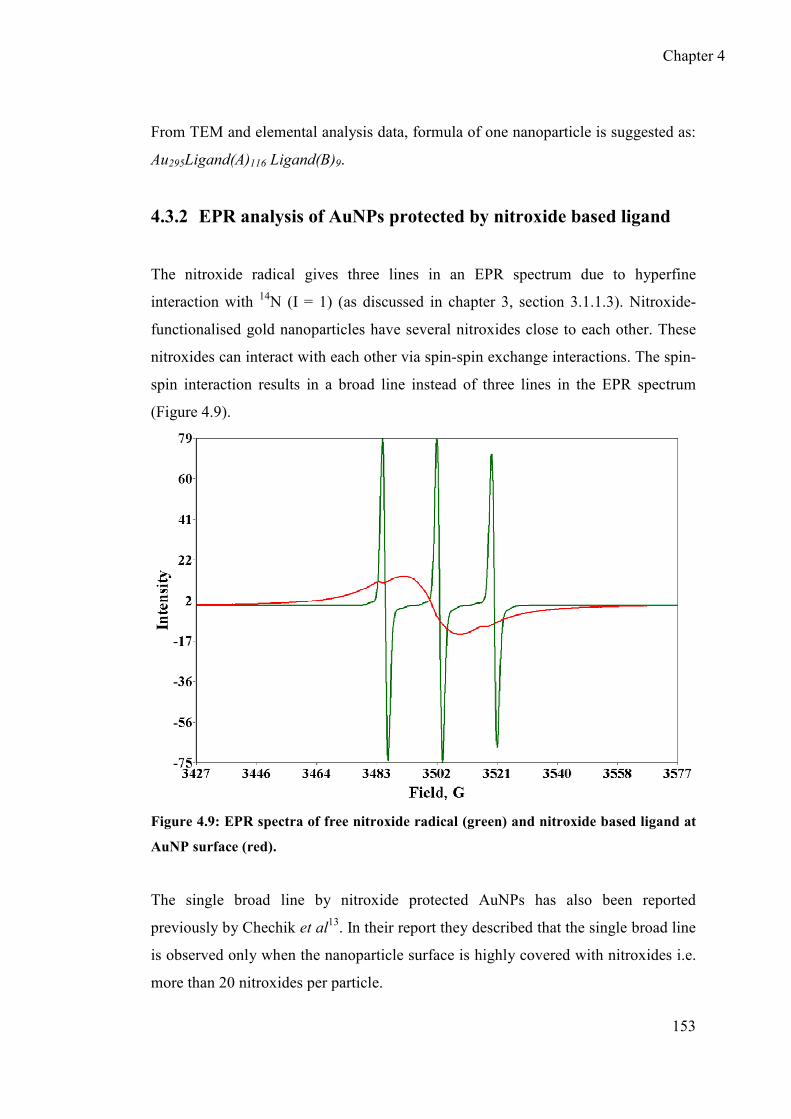
Chapter 4
153
From TEM and elemental analysis data, formula of one nanoparticle is suggested as:
Au295Ligand(A)116 Ligand(B)9.
4.3.2 EPR analysis of AuNPs protected by nitroxide based ligand
The nitroxide radical gives three lines in an EPR spectrum due to hyperfine
interaction with 14N (I = 1) (as discussed in chapter 3, section 3.1.1.3). Nitroxide-
functionalised gold nanoparticles have several nitroxides close to each other. These
nitroxides can interact with each other via spin-spin exchange interactions. The spin-
spin interaction results in a broad line instead of three lines in the EPR spectrum
(Figure 4.9).
Figure 4.9: EPR spectra of free nitroxide radical (green) and nitroxide based ligand at
AuNP surface (red).
The single broad line by nitroxide protected AuNPs has also been reported
previously by Chechik et al13. In their report they described that the single broad line
is observed only when the nanoparticle surface is highly covered with nitroxides i.e.
more than 20 nitroxides per particle.

Chapter 4
154
The line width of the single broad line is an important parameter to estimate the
concentration of nitroxides on the surface of the nanoparticle. As shown in Figure
4.10, nitroxide radicals exhibit three lines at low concentration (e.g. 10-4 M); these
lines become broader (i.e. due to exchange broadening) and then merge to give a
single broad line with the increased concentration of nitroxides. The line width of the
single broad line decreases with the further increase in nitroxide concentration
(Figure 4.7)19, this phenomenon is called exchange narrowing.
Figure 4.10: EPR spectra of di-t-butyl nitroxide radical in ethanol at room temperature
having various concentrations: (a) 10-4 M, (b) 10
-2 M, (c) 10
-1 M and (d) pure liquid
nitroxide.19
The line width of EPR spectrum of AuNPs protected by nitroxide based ligand was
found to be 16.8 G. Based on the literature, the nitroxide protected gold
nanoparticles with similar line width were expected to have ~ 40 nitroxides per
particle.13 Thus EPR confirmed that several nitroxides are closely present at the

Chapter 4
155
nanoparticles surface; therefore they can be studied for the purpose of MRI contrast
agents. Their relaxation measurements and redox behaviour will be discussed in
section 4.3.5 and 4.3.6 respectively.
4.3.3 Quantitative estimation of nitroxide at AuNPs surface by EPR
spectroscopy
Unfortunately EPR signal intensity of nitroxide protected AuNPs was not in
agreement with the TGA and elemental analysis data. For example, 6.4 mg of
nitroxide protected AuNPs dissolved in 2.9 mL of deionised water exhibited EPR
spectra with double integral intensity corresponding to ca. 13 wt% of nitroxide based
ligand while elemental analysis (and TGA) predicted ca. 32 wt % of the nitroxide
based ligand. This discrepancy is attributed to the decomposition of some of the
nitroxides at the nanoparticles surface. However the total organic content determined
by TGA is compatible with the elemental analysis data. This suggests that amino-
TEMPO successfully reacted with DSP ligand but nitroxide functionality degraded
during the reaction. To check if nitroxide degradation resulted in hydroxylamine,
attempts to oxidised hydroxylamine back to nitroxide with PbO2 failed. In another
control experiment, the nitroxide protected AuNPs were decomposed by KI and I2
solution in MeOH in order to release the nitroxide based ligand which will form a
disulphide linkage to give a diradical (Figure 4.11).
SO
OH
N
O
NH
SO
NO
NH
S
O
N O
NO
S
S
O
O
NH
NH
Au
KI + I2
MeOH * + AuI3
Figure 4.11: Scheme showing control test.

Chapter 4
156
The nitroxide based diradical was expected to exhibit spectra with some additional
peaks (*) due to be spin-spin interactions (Figure 4.12). The intensity of the
additional peaks (*) was found lower than expected in DCM which confirmed the
decomposition of nitroxides. Furthermore, no difference in the EPR signal (double
integral) intensity was found before and after decomposing nitroxide protected
AuNPs.
N O
NO
S
S
O
O
NH
NH
*
**
TEMPO based ligand
Figure 4.12: EPR spectrum of nitroxide diradicals.
4.3.4 Determination of nitroxide radical concentration
The accurate nitroxide radicals’ concentration must be known for determination of
relaxivity. The calibration curve was set up using double integral values of EPR
spectra of known concentrations of nitroxide radical solutions (TEMPO was used
radical for the calibration curve) (Figure 4.13). This calibration curve was then used
for determination of nitroxide concentration in nitroxide protected gold nanoparticle
solutions.

Chapter 4
157
R2 = 0.9931
0
200
400
600
800
1000
1200
1400
1600
0 0.2 0.4 0.6 0.8 1 1.2 1.4
[NO] / mM
Double Integral / No.
Figure 4.13: Calibration curve for determination of [NO].
4.3.5 Relaxation measurements
The relaxivity of nitroxide protected gold nanoparticles in water was measured
using the same method as for Gd-loaded AuNPs. The relaxivity of nitroxide
protected AuNPs (0.32 mM-1s-1) was slightly higher than that for free nitroxides
(0.30 mM-1s-1) (Table 4.2). This slight increase may be due to reduced tumbling of
nanoparticle-attached nitroxide based ligand. This value of relaxivity for nitroxide
based compound is much smaller as compared to Gd3+-based chelates, and is easily
justified by the presence of seven unpaired electrons in Gd3+, while the nitroxide
contain only one unpaired electron. The similar values of relaxivity for nitroxide
based contrast agents have also been reported previously3. However, unlike the Gd3+
based contrast agents, relatively hydrophobic nitroxides can pass through the BBB
and they can report on redox status of the brain tissues. Furthermore, nitroxides are
non-toxic, while Gd3+ ions are extremely toxic and they must be chelated before
utilisation for MRI applications. Gd3+ may also leach from the chelates which can
cause serious problems.

Chapter 4
158
Table 4.2: Comparison of R1 values of Nitroxides@AuNPs with Gd-DTPA@AuNPs.
4.3.6 Redox behaviour of nitroxide at the surface of AuNPs
It was hoped that attaching several nitroxides to the gold nanoparticles surface would
increase their stability towards reducing agents. Nitroxides can undergo redox
transformation i.e. either to oxoammonium cation by gaining one electron or
hydroxylamine by losing one electron2, but in biological media they are reduced
(e.g. by ascorbic acid). This limits their applications as T1-contrast agents in MRI
imaging. However their redox behaviour can be exploited to study the redox status of
the living tissues.
Nitroxides are cell permeable and depending upon the presence of abnormal amounts
of oxidising or reducing species in the cells, the cell status can be studied by
measuring the rate of nitroxide transformation reactions and then comparing with the
rate of reduction of nitroxides in the normal cells. For example in the tumour cells,
the nitroxides are reduced more rapidly as compared to normal tissues.
The rate of reduction of free nitroxides and nitroxides at the surface of gold
nanoparticles was studied in vitro. Sodium ascorbate, a commonly used reducing
agent, was used as a reducing agent. Sodium ascorbate was selected rather than
Compound Relaxivity / mM-1s-1
Free Nitroxides 0.29
Nitroxides@AuNPs 0.32
Gd-DTPA 3.83
Gd-loaded AuNPs 4.77
Chapter 4
159
ascorbic acid in order to avoid the decomposition of gold nanoparticles in acidic
medium. Ascorbate ions can reduce nitroxide radicals as they possess a labile H-
atom (Figure 4.14). The ascorbate radical formed is relatively persistent.
OOH
OHO
O
OH
OOH
O O
O
OH
N O N OH
H
Na+
Nitroxide Radical Hydroxylamine
Sod. Ascorbate Ascorbate Radical
Reduced
Oxidised
Figure 4.14: Mechanism of reduction of nitroxide radicals by sodium ascorbate.
The rate of reduction of free as well as nanoparticle-attached nitroxides was
monitored by recording EPR spectra at regular intervals. EPR spectra of
nanoparticle-attached nitroxides and free nitroxides in the presence of sodium
ascorbate (4-fold excess) are shown in Figures 4.15 and 4.16 respectively. In Figure
4.15, the two sharp lines are assigned to ascorbate radical. The intensity of the single
broad line exhibited by gold nanoparticle-attached nitroxides (Figure 4.15) and of
three lines exhibited by free nitroxides (Figure 4.16) was reduced over time. The
decrease in intensity was due to reduction of nitroxides by sodium ascorbate (Figure
4.14). During the reduction of surface-bound nitroxides, very weak evolution of 14N
hyperfine interactions (**) (i.e. three lines) was observed due to decrease in the
number of nitroxides attached to the same nanoparticle (Figure 4.15). The decreased
number of nitroxides per particle decreased the spin-spin interactions which resulted
in appearance of three lines (**).
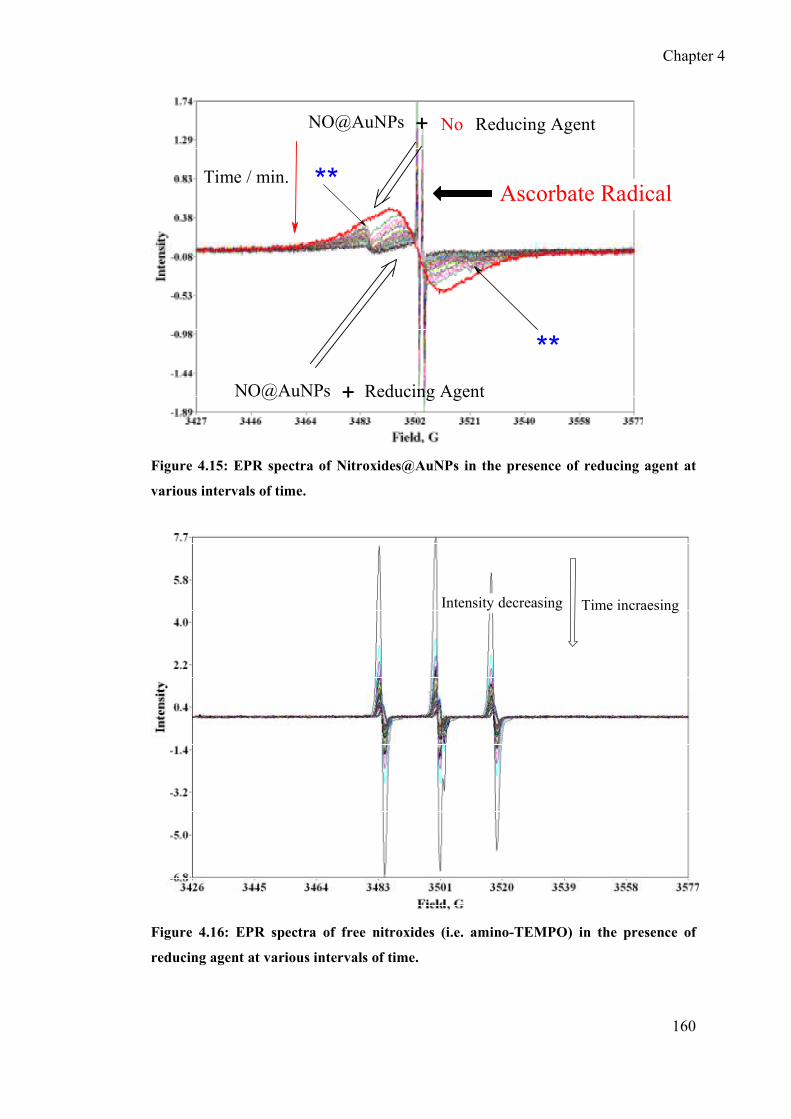
Chapter 4
160
NO@AuNPs + Reducing AgentNo
NO@AuNPs + Reducing Agent
Ascorbate RadicalTime / min. **
**
Figure 4.15: EPR spectra of Nitroxides@AuNPs in the presence of reducing agent at
various intervals of time.
Time incraesingIntensity decreasing
Figure 4.16: EPR spectra of free nitroxides (i.e. amino-TEMPO) in the presence of
reducing agent at various intervals of time.

Chapter 4
161
The rate of reduction of free as well as nanoparticle-attached nitroxides was
determined by plotting the double integral intensity of their EPR spectra vs time
(Figure 4.17). Figure 4.17 shows that free nitroxides are reduced more rapidly as
compared to the nitroxides adsorbed at the surface of gold nanoparticles. The
nitroxides at gold nanoparticle surface have compact packing and hence access of
ascorbate to the nitroxides is restricted as compared to the access to the free
nitroxides. The nanoparticle-attached nitroxides follow the first order decay while
the first order decay was not well fitted for the free nitroxides (Figure 4.17). This
difference in the reduction behaviour might be attributed to the different
compositional changes as the reaction proceeds.
0 20 40 60 80 100 120 1400
100
200
300
Time / min
Normalised EPR Signal Intensity
Free NitroxidesGold nanoparticles attached nitroxides
Figure 4.17: Rate of reduction of free nitroxides and nanoparticles-attached nitroxides.
Chapter 4
162
4.4 Conclusions
Water soluble gold nanoparticles protected by nitroxide based ligand were prepared
and characterised. After characterisation, the relaxivity measurements and oxidising
behaviour of nitroxide protected gold nanoparticles was studied and compared with
free nitroxides in vitro. The nitroxide protected gold nanoparticles showed a slightly
higher relaxivity than the free nitroxides. This increase in relaxivity is attributed to
the slower tumbling of nitroxide ligand at the nanoparticle surface as compared to
the free nitroxides. The nitroxides at nanoparticles surface also showed slow
reduction as compared to the free nitroxides due to compact packing, which may
encourage their in vivo applications as MRI contrast agents.

Chapter 4
163
4.5 References
1. V. M. Runge, J. A. Clanton, C. M. Lukehart, C. L. Partain and A. E. James,
Am. J. Roentgenol., 1983, 141, 1209-1215.
2. K.-i. Matsumoto, F. Hyodo, A. Matsumoto, A. P. Koretsky, A. L. Sowers, J.
B. Mitchell and M. C. Krishna, Clin. Cancer Res., 2006, 12, 2455-2462.
3. K.-i. Matsumoto, H. Yakumaru, M. Narazaki, H. Nakagawa, K. Anzai, H.
Ikehira and N. Ikota, Magn. Reson. Imaging, 2008, 26, 117-121.
4. R. C. Brasch, D. E. Nitecki, M. Brantzawadzki, D. R. Enzmann, G. E.
Wesbey, T. N. Tozer, L. D. Tuck, C. E. Cann, J. R. Fike and P. Sheldon, Am.
J. Roentgenol., 1983, 141, 1019-1023.
5. W. R. Couet, U. G. Eriksson, T. N. Tozer, L. D. Tuck, G. E. Wesbey, D.
Nitecki and R. C. Brasch, Pharm. Res., 1984, 1, 203-209.
6. A. W. Bosman, R. A. J. Janssen and E. W. Meijer, Macromolecules, 1997,
30, 3606-3611.
7. A. T. Yordanov, K. Yamada, M. C. Krishna, J. B. Mitchell, E. Woller, M.
Cloninger and M. W. Brechbiel, Angew. Chem.-Int. Edit., 2001, 40, 2690-
2692.
8. A. J. Maliakal, N. J. Turro, A. W. Bosman, J. Cornel and E. W. Meijer, J.
Phys. Chem. A, 2003, 107, 8467-8475.
9. J. F. W. Keana and F. L. Vannice, Physiol. Chem. Phys. Med. NMR, 1984,
16, 477-480.
10. F. Hyodo, K.-i. Matsumoto, A. Matsumoto, J. B. Mitchell and M. C. Krishna,
Cancer Res., 2006, 66, 9921-9928.

Chapter 4
164
11. H. C. Chan, K. Sun, R. L. Magin and H. M. Swartz, Bioconjugate Chem.,
1990, 1, 32-36.
12. M. Brust, M. Walker, D. Bethell, D. J. Schiffrin and R. Whyman, J. Chem.
Soc.-Chem. Commun., 1994, 801-802.
13. V. Chechik, H. J. Wellsted, A. Korte, B. C. Gilbert, H. Caldararu, P. Ionita
and A. Caragheorgheopol, Faraday Discuss., 2004, 125, 279-291.
14. P. Ionita, A. Caragheorgheopol, B. C. Gilbert and V. Chechik, J. Am. Chem.
Soc., 2002, 124, 9048-9049.
15. P. Ionita, A. Caragheorgheopol, B. C. Gilbert and V. Chechik, Langmuir,
2004, 20, 11536-11544.
16. M. Zachary, Ph.D thesis, The University of York, 2005, Ch. 5.
17. M. Conte, H. Miyamura, S. Kobayashi and V. Chechik, J. Am. Chem. Soc.,
2009, 131, 7189-7196.
18. S. Durocher, A. Rezaee, C. Hamm, C. Rangan, S. Mittler and B. Mutus, J.
Am. Chem. Soc., 2009, 131, 2475-2477.
19. J. A. Weil, J. R. Bolton and J. E. Wertz, Electron Paramagnetic Resonance,
John Wiley & Sons, 1994, Ch. 10.

Chapter 5
165
5 Chapter 5: Other applications of lanthanide-loaded
gold nanoparticles

Chapter 5
166
Chapter 5: Other applications of lanthanide-loaded
gold nanoparticles
5.1 Introduction
Previous chapters (2-3) describe the preparation of gold nanoparticles protected by
DTPA based ligand and their applications as MRI contrast agents. The DTPA ligand
protected AuNPs have also some other useful and interesting applications apart from
MRI contrast agents. For example, the DTPA based ligand is a strong chelate which
can also bind other lanthanides such as terbium (Tb3+), europium (Eu3+), dysprosium
Dy3+ etc. As Tb3+ and Eu3+ both exhibit luminescence (discussed in the next section),
therefore Tb3+ or Eu3+-loaded AuNPs in principle can be used as optical imaging
contrast agents. By loading Gd3+ (as MRI contrast agent) and Tb3+ (as optical imaging
contrast agent) on the same nanoparticle, dual imaging contrast agents can be
obtained.1 MRI usually provides high spatial resolution to give physiological and
anatomical information while optical imaging allows the rapid screening i.e. accurate
delineation between the targeted (diseased) and the surrounding (normal) tissues.2
Currently a lot of effort is being devoted to the development of dual modal imaging
probes.3-5 For example, Lee and co-workers5 described iron oxide particles conjugated
to fluorescent dye doped silica nanoparticles for dual optical and magnetic resonance
imaging (Figure 5.1).

Chapter 5
167
Figure 5.1: Schematic representation of dual imaging contrast agents i.e. core-satellite
DySiO2-(Fe3O4)n nanoparticles.5
Dye (Rhodamine) doped silica nanoparticles acted as optical imaging contrast agents
while iron oxide particles were used as MRI contrast agents.
Furthermore, gold nanoparticles protected by DTPA ligand can also be used to test an
important EPR methodology. The relaxation of unpaired electrons of paramagnetic
species can be enhanced by other paramagnetic lanthanide metal ions which are close
to each other. So, if we attach a nitroxide radical to the gold nanoparticles which
already have lanthanides, the relaxation enhancement of nitroxide radical by
paramagnetic lanthanide ion can be monitored by EPR spectroscopy. The EPR
methodology which was tested using nitroxide-labelled-lanthanide-loaded gold
nanoparticles will be discussed in the second part of this chapter.
5.1.1 Luminescence
Luminescence is the emission of light by a substance and it occurs when excited
electron returns to the ground state from the excited state. Luminescence phenomena
are divided into two classes depending upon the nature of the excited state:

Chapter 5
168
• Fluorescence
• Phosphorescence
In fluorescence the electrons in the excited orbital have opposite spin as compared to
the electrons in the ground state. Therefore they return to the ground state rapidly by
emission of photons as this transition is spin allowed (paring of opposite spins). The
emission rates of fluorescence are usually in the range of 108 s-1 (typical florescence
life times are near 10 ns). Phosphorescence is the emission of light from triplet excited
states. In phosphorescence the excited electron has the same spin orientation as the
ground state electron. The transition to the ground state is thus forbidden and hence
emission becomes slow. The phosphorescence life times are typically in milliseconds
to seconds.6
In lanthanides, 4f orbitals are shielded by outer lying 5s25p6 filled sub shells, and
hence the spectral properties of LnIII are minimally affected by the external field,
caused by counter ions or ligands. As a result, very narrow f→f absorption bands are
observed as compared to d→d absorption bands of transition metals. The f→f
absorption bands are observed mostly in visible or near infrared regions. The f→f
transitions have very low molar absorptivities i.e. typically <3 M-1 cm-1. Therefore
both absorption and emission bands are weak for lanthanides. The radiative life times
for f-f transitions are in the range of 0.1-1.0 ms. 7-8
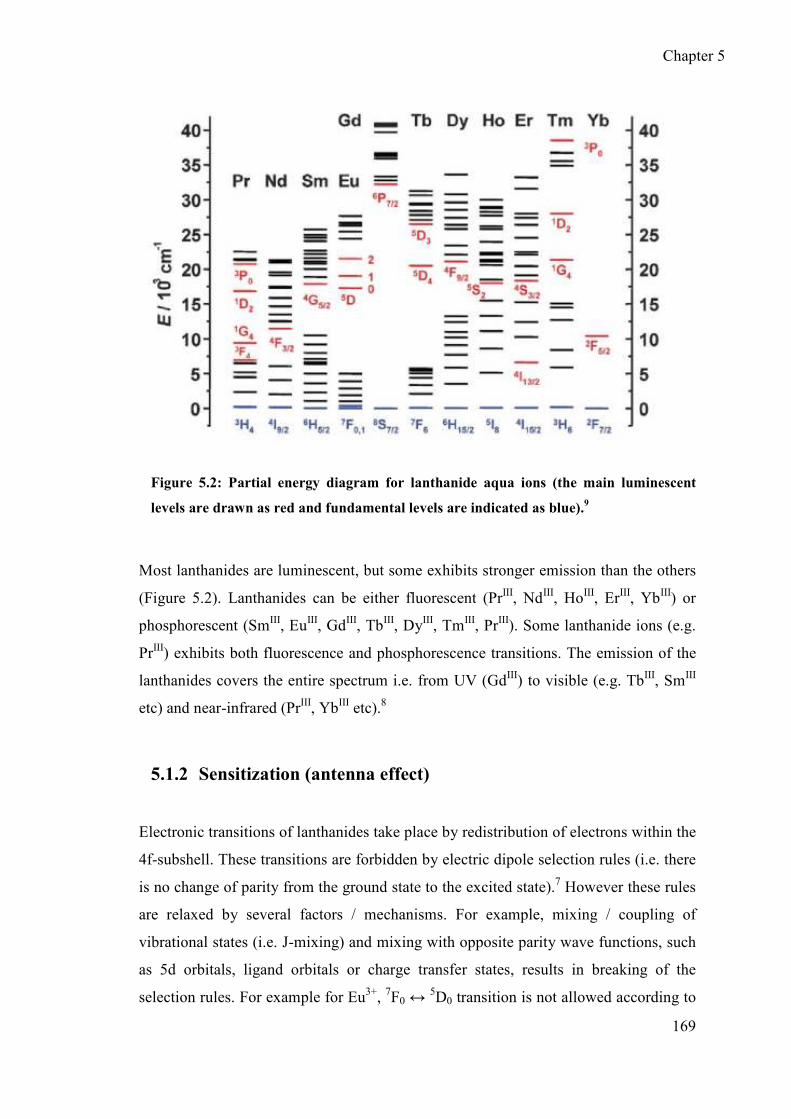
Chapter 5
169
Figure 5.2: Partial energy diagram for lanthanide aqua ions (the main luminescent
levels are drawn as red and fundamental levels are indicated as blue).9
Most lanthanides are luminescent, but some exhibits stronger emission than the others
(Figure 5.2). Lanthanides can be either fluorescent (PrIII, NdIII, HoIII, ErIII, YbIII) or
phosphorescent (SmIII, EuIII, GdIII, TbIII, DyIII, TmIII, PrIII). Some lanthanide ions (e.g.
PrIII) exhibits both fluorescence and phosphorescence transitions. The emission of the
lanthanides covers the entire spectrum i.e. from UV (GdIII) to visible (e.g. TbIII, SmIII
etc) and near-infrared (PrIII, YbIII etc).8
5.1.2 Sensitization (antenna effect)
Electronic transitions of lanthanides take place by redistribution of electrons within the
4f-subshell. These transitions are forbidden by electric dipole selection rules (i.e. there
is no change of parity from the ground state to the excited state).7 However these rules
are relaxed by several factors / mechanisms. For example, mixing / coupling of
vibrational states (i.e. J-mixing) and mixing with opposite parity wave functions, such
as 5d orbitals, ligand orbitals or charge transfer states, results in breaking of the
selection rules. For example for Eu3+, 7F0 ↔ 5D0 transition is not allowed according to
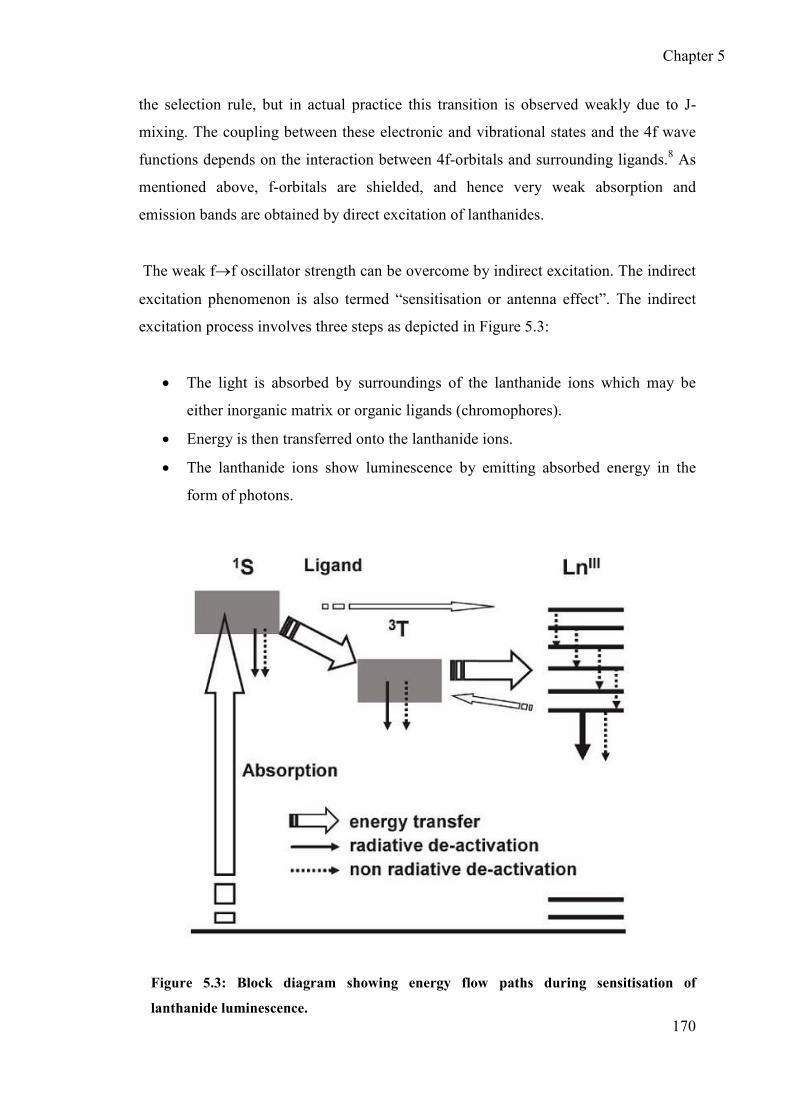
Chapter 5
170
the selection rule, but in actual practice this transition is observed weakly due to J-
mixing. The coupling between these electronic and vibrational states and the 4f wave
functions depends on the interaction between 4f-orbitals and surrounding ligands.8 As
mentioned above, f-orbitals are shielded, and hence very weak absorption and
emission bands are obtained by direct excitation of lanthanides.
The weak f→f oscillator strength can be overcome by indirect excitation. The indirect
excitation phenomenon is also termed “sensitisation or antenna effect”. The indirect
excitation process involves three steps as depicted in Figure 5.3:
• The light is absorbed by surroundings of the lanthanide ions which may be
either inorganic matrix or organic ligands (chromophores).
• Energy is then transferred onto the lanthanide ions.
• The lanthanide ions show luminescence by emitting absorbed energy in the
form of photons.
Figure 5.3: Block diagram showing energy flow paths during sensitisation of
lanthanide luminescence.

Chapter 5
171
Usually organic ligands (chromophores) are used as sensitisation agents. Many organic
chromophores have very strong absorption and emission characteristics i.e. they have
very high value of molar absorptivities (>104 M-1cm-1).
As lanthanide ions or / and lanthanide chelates need a sensitizer in close proximity
which can enhance lanthanide luminescence, gold nanoparticles can be used as a
template to achieve this target because:
• More than one functional group / ligand can be attached on the surface of
AuNPs easily.
• The sensitizer species / ligand can be attached on the nanoparticle surface in
the same ligand shell as the lanthanide-DTPA chelate.
• There is no need to make a separate linker molecule to bring lanthanide
chelate close to the sensitizer species.
• The ratio between sensitizer and lanthanide chelates at the nanoparticle surface
can be tuned depending upon the requirement.
On the other hand, as gold absorbs light in the visible region strongly, this might affect
the luminescence of lanthanide chelates at its surface. In order to test the feasibility of
gold nanoparticles as dual imaging contrast agents, a ligand containing sensitizer
group was designed which can be attached on gold nanoparticles protected by DTPA
ligand and is discussed in the next section.
5.2 Design and synthesis of tryptophan based ligand 7
Tryptophan contains an indole group which absorbs light in UV-Vis region. The
absorbed energy can be transferred to lanthanide ions if the tryptophan and lanthanide
ion are in close proximity. Recently, Duhme-Klair and co-workers10 reported the long
lived luminescence of Tb-containing amphiphile which was sensitised by a tryptophan
based compound. The Tb-chelate and the sensitizer were brought close to each other in
a micelle via non-covalent interactions (Figure 5.4).

Chapter 5
172
Figure 5.4: Schematic illustration of the intermolecular sensitisation process.10
Thus it was confirmed that covalent linkage between lanthanide ion and the sensitizer
is not necessary for efficient transfer of energy. This report10 strongly supports the idea
of attaching tryptophan based ligand and lanthanide ion on the gold nanoparticle
surface in the same ligand shell.
The tryptophan based ligand 7 (Figure 5.5) was synthesised by DCC coupling of L-
amino tryptophan ester hydrochloride with dithiobutyric acid.

Chapter 5
173
NH
NH
OO
NH
NH
O
OS S
OO
L-tryptophan
Disulphide
L-tryptophan
Figure 5.5: Chemical structure of tryptophan based ligand 7
The dithiobutyric acid was selected as it contains disulphide group which will make
the ligand attach at the gold nanoparticle surface. The other important advantage of
dithiobutyric acid selection was to maintain the chain length of ligand 7 in the same
range as DTPA ligand 6. The Tryptophan ligand 7 was characterised by MS and NMR
spectroscopies (data shown in experimental chapter 7).
5.3 UV-Vis absorption and emission spectra of tryptophan ligand 7
After characterisation, the absorption and emission spectra of tryptophan based ligand
7 were recorded and compared with L-tryptophan ester hydrochloride. The UV-Vis
absorption spectra (Figure 5.6) show λmax = 282 nm for L-tryptophan and tryptophan
ligand. The absorbance of tryptophan ligand 7 in the normalised UV-Vis spectra was
twice as high as for L-tryptophan. This is due to the presence of two tryptophan units
in the tryptophan ligand molecule. The UV-Vis spectra were used to determine the
wavelength for excitation of tryptophan ligand.

Chapter 5
174
300 400 500 600 700 800
0.0
0.2
0.4
0.6
0.8
1.0
282 nm
Absorbance
Wave Length / nm
Tryptophan Based Ligand
L-Tryptophan Ester Hydrochloride
Figure 5.6: UV-Vis spectra of L-tryptophan and tryptophan based ligand 7.
The fluorescence emission spectra of tryptophan ligand were recorded by exciting at
282 nm. The emission spectrum of tryptophan ligand shows very strong emission in
the range of 330-430 nm (Figure 5.7).11
200 300 400 500 600 700 800
0
1000
2000
3000
4000
5000
6000
7000Excitation band
Emission BandIntensity
Wavelength / nm
Figure 5.7: Fluorescence emission spectrum of tryptophan ligand 7.
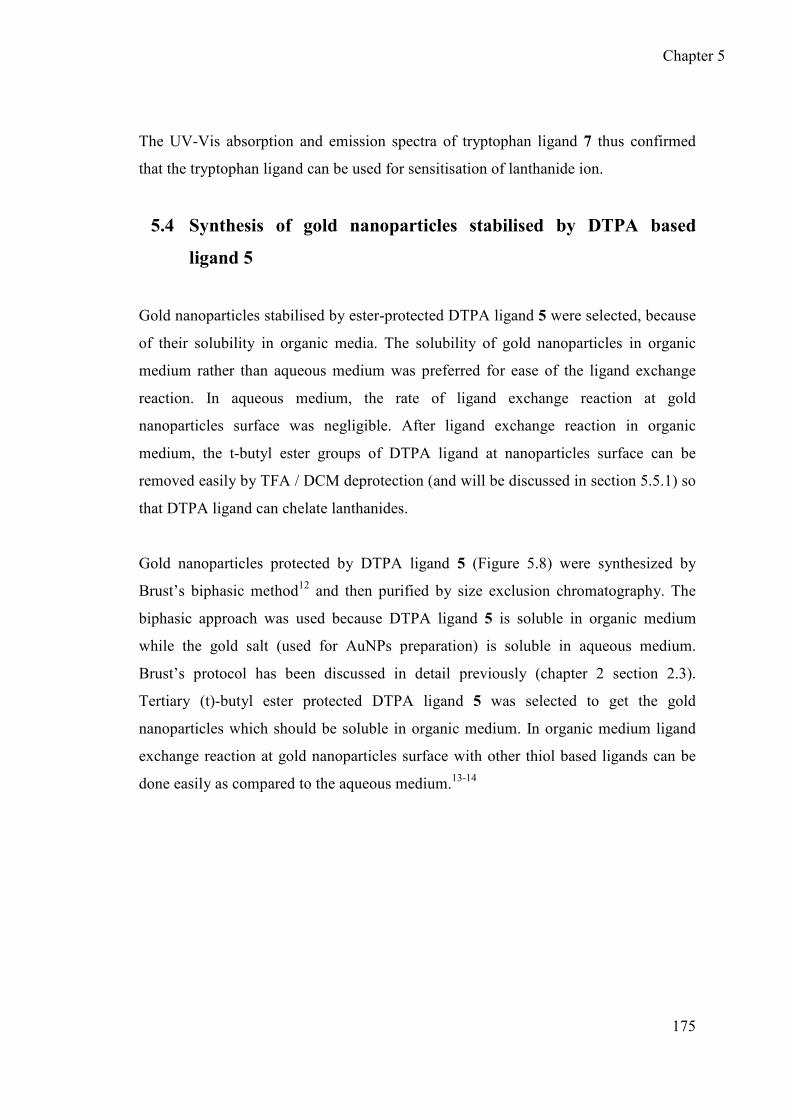
Chapter 5
175
The UV-Vis absorption and emission spectra of tryptophan ligand 7 thus confirmed
that the tryptophan ligand can be used for sensitisation of lanthanide ion.
5.4 Synthesis of gold nanoparticles stabilised by DTPA based
ligand 5
Gold nanoparticles stabilised by ester-protected DTPA ligand 5 were selected, because
of their solubility in organic media. The solubility of gold nanoparticles in organic
medium rather than aqueous medium was preferred for ease of the ligand exchange
reaction. In aqueous medium, the rate of ligand exchange reaction at gold
nanoparticles surface was negligible. After ligand exchange reaction in organic
medium, the t-butyl ester groups of DTPA ligand at nanoparticles surface can be
removed easily by TFA / DCM deprotection (and will be discussed in section 5.5.1) so
that DTPA ligand can chelate lanthanides.
Gold nanoparticles protected by DTPA ligand 5 (Figure 5.8) were synthesized by
Brust’s biphasic method12 and then purified by size exclusion chromatography. The
biphasic approach was used because DTPA ligand 5 is soluble in organic medium
while the gold salt (used for AuNPs preparation) is soluble in aqueous medium.
Brust’s protocol has been discussed in detail previously (chapter 2 section 2.3).
Tertiary (t)-butyl ester protected DTPA ligand 5 was selected to get the gold
nanoparticles which should be soluble in organic medium. In organic medium ligand
exchange reaction at gold nanoparticles surface with other thiol based ligands can be
done easily as compared to the aqueous medium.13-14
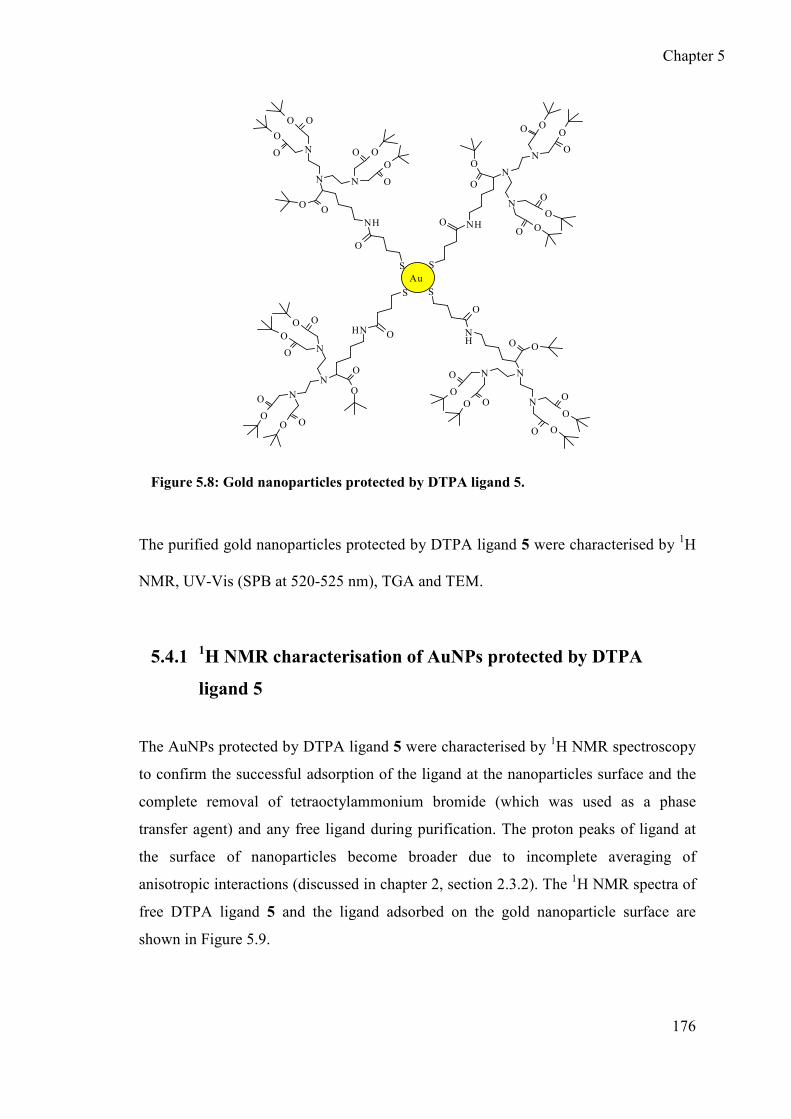
Chapter 5
176
NH
O
ON
N
N
OO
O
O
O
O
S
O
OO
NHOO
N
N
N
O
O
O
O O
O
S
O
O
O
NH O O
N
N
N
O
O
O
OO
O
S
O
O
O
NH
O
ON
N
N
O O
O
O
O
O
S
OO O
Au
Figure 5.8: Gold nanoparticles protected by DTPA ligand 5.
The purified gold nanoparticles protected by DTPA ligand 5 were characterised by 1H
NMR, UV-Vis (SPB at 520-525 nm), TGA and TEM.
5.4.1 1H NMR characterisation of AuNPs protected by DTPA
ligand 5
The AuNPs protected by DTPA ligand 5 were characterised by 1H NMR spectroscopy
to confirm the successful adsorption of the ligand at the nanoparticles surface and the
complete removal of tetraoctylammonium bromide (which was used as a phase
transfer agent) and any free ligand during purification. The proton peaks of ligand at
the surface of nanoparticles become broader due to incomplete averaging of
anisotropic interactions (discussed in chapter 2, section 2.3.2). The 1H NMR spectra of
free DTPA ligand 5 and the ligand adsorbed on the gold nanoparticle surface are
shown in Figure 5.9.

Chapter 5
177
Figure 5.9: 1H NMR spectra of free DTPA ligand 5 (a) and ligand 5 adsorbed at AuNPs
surface (b).
Figure 5.9 shows significant broadening of the 1H peaks consistent with the successful
adsorption of ligand at the nanoparticle surface. Furthermore, no evidence of any free
ligand is observed in 1H NMR spectrum. After NMR characterisation of gold
nanoparticles, the DTPA ligand coverage at nanoparticle surface was estimated by
TGA and is discussed in the next section.
0.20.4 0.60.81.0 1.2 1.4 1.61.82.0 2.22.42.6 2.83.03.23.4 3.6 3.84.0
0.20.40.6 0.8 1.01.21.41.6 1.82.0 2.22.42.6 2.83.03.2 3.4 3.6 3.84.0
1
2222
1
2
12
1213
1311
11 5+9
5+93+4
3+4 6+7+8
6+7+8(a)
(b)
N
O
O
OO
N O
O 2
O
O S
13
12
11NH10
9
8
7
6
5
OO O
N
4
3
1
N
O O
O O
N O
O 2
O O
S 13
1211
N H10
98
76
5
O
O O
N
43
1
A u

Chapter 5
178
5.4.2 TGA of AuNPs protected by DTPA ligand 5
Thermogravimetric analysis (TGA) was carried out by the same method as for the
AuNPs protected by DTPA ligand 6 (discussed in chapter 2 section 2.3.4) to determine
the amount of organic content (DTPA ligand 5) present at gold nanoparticle surface.
Organic content was needed to estimate the composition of AuNPs. The TGA graph of
AuNPs protected by DTPA ligand 5 (Figure 5.10) shows about 47 % of the organic
content. This amount is compatible with similar type of AuNPs protected by thiol
based ligands.15
50
40
30
10
20
00 100 200 300 400 500 600
T / oC
Weight Loss / %
Figure 5.10: TGA plot of AuNPs protected by DTPA ligand 5.
5.4.3 TEM of AuNPs protected by DTPA ligand 5
TEM was carried out by the same method as for the gold nanoparticles discussed in
previous chapters. TEM image (Figure 5.11) of AuNPs showed well dispersed
nanoparticles with average diameter 2.42 ± 0.34 nm.
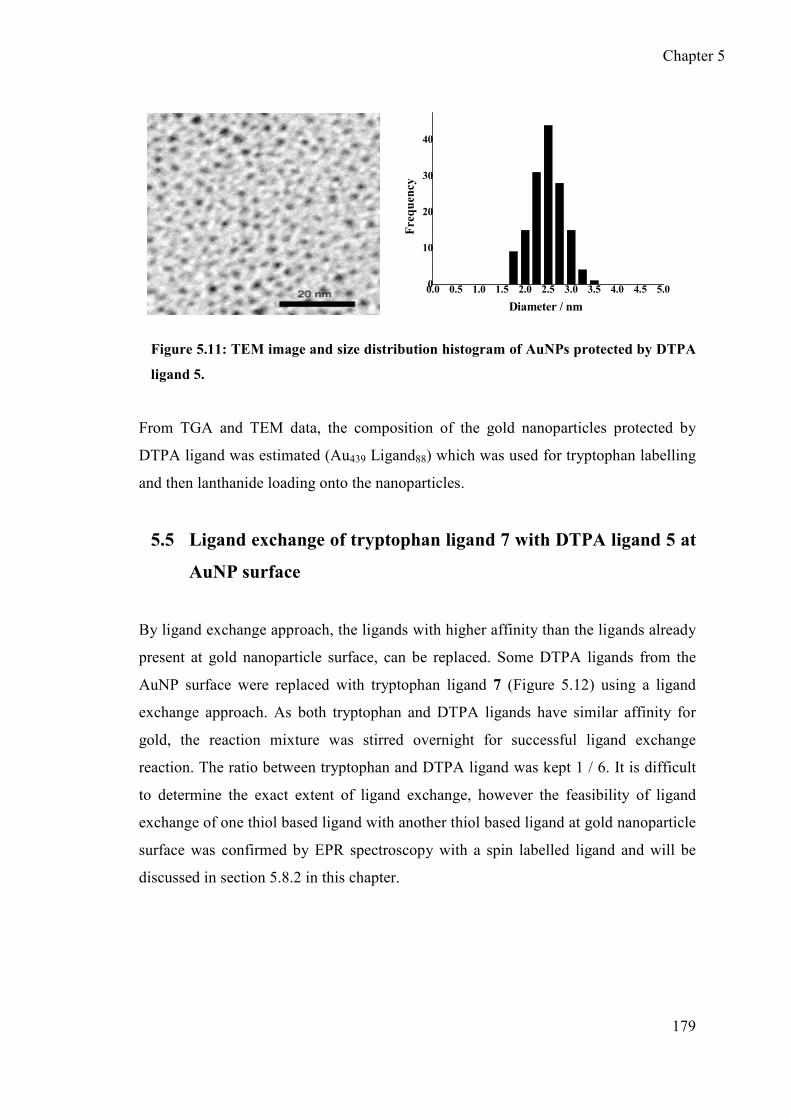
Chapter 5
179
0.0 0.5 1.0 1.5 2.0 2.5 3.0 3.5 4.0 4.5 5.00
10
20
30
40
Frequency
Diameter / nm
Figure 5.11: TEM image and size distribution histogram of AuNPs protected by DTPA
ligand 5.
From TGA and TEM data, the composition of the gold nanoparticles protected by
DTPA ligand was estimated (Au439 Ligand88) which was used for tryptophan labelling
and then lanthanide loading onto the nanoparticles.
5.5 Ligand exchange of tryptophan ligand 7 with DTPA ligand 5 at
AuNP surface
By ligand exchange approach, the ligands with higher affinity than the ligands already
present at gold nanoparticle surface, can be replaced. Some DTPA ligands from the
AuNP surface were replaced with tryptophan ligand 7 (Figure 5.12) using a ligand
exchange approach. As both tryptophan and DTPA ligands have similar affinity for
gold, the reaction mixture was stirred overnight for successful ligand exchange
reaction. The ratio between tryptophan and DTPA ligand was kept 1 / 6. It is difficult
to determine the exact extent of ligand exchange, however the feasibility of ligand
exchange of one thiol based ligand with another thiol based ligand at gold nanoparticle
surface was confirmed by EPR spectroscopy with a spin labelled ligand and will be
discussed in section 5.8.2 in this chapter.
Chapter 5
180
N
NH
O
O
S
O
NH
O
ON
N
N
OO
O
O
O
O
S
OOO
NHOO
N
N
N
O
O
O
O O
O
S
O
O
O
NH
OO
N
N
N
O
OO
OO
O
S
O
O
O
NH
O
ON
N
N
OO
O
O
O
O
S
O OO
N
NH
O
O S
O
Au
Figure 5.12: Tryptophan labelled AuNPs
5.5.1 Deprotection of t-butyl ester groups of DTPA and tryptophan
ligand at AuNPs
The deprotection of t-butyl ester groups of DTPA ligand 5 at AuNP surface was
carried out to generate the chelating unit. The deprotection was carried out using 1:1
mixture of TFA and DCM by a modified literature procedure16 as described in detail in
chapter 2 (section 2.2.4). To avoid the decomposition of gold nanoparticles in acidic
medium, the deprotection reaction was carried under the inert (N2) atmosphere. After
deprotection, the AuNPs were water soluble which is a sign of successful deprotection.
5.5.2 Lanthanide (Tb3+ and Eu3+) loading on tryptophan labelled
AuNPs and their fluorescence emission spectra
From several luminescent lanthanides, Tb3+ and Eu3+ were selected as they exhibit the
most intense emission band in the visible region. Lanthanide loading onto the AuNPs
protected by DTPA ligand was monitored by UV-Vis titration using xylenol orange as
an indicator as described in detail in chapter 2 (section 2.4.2).
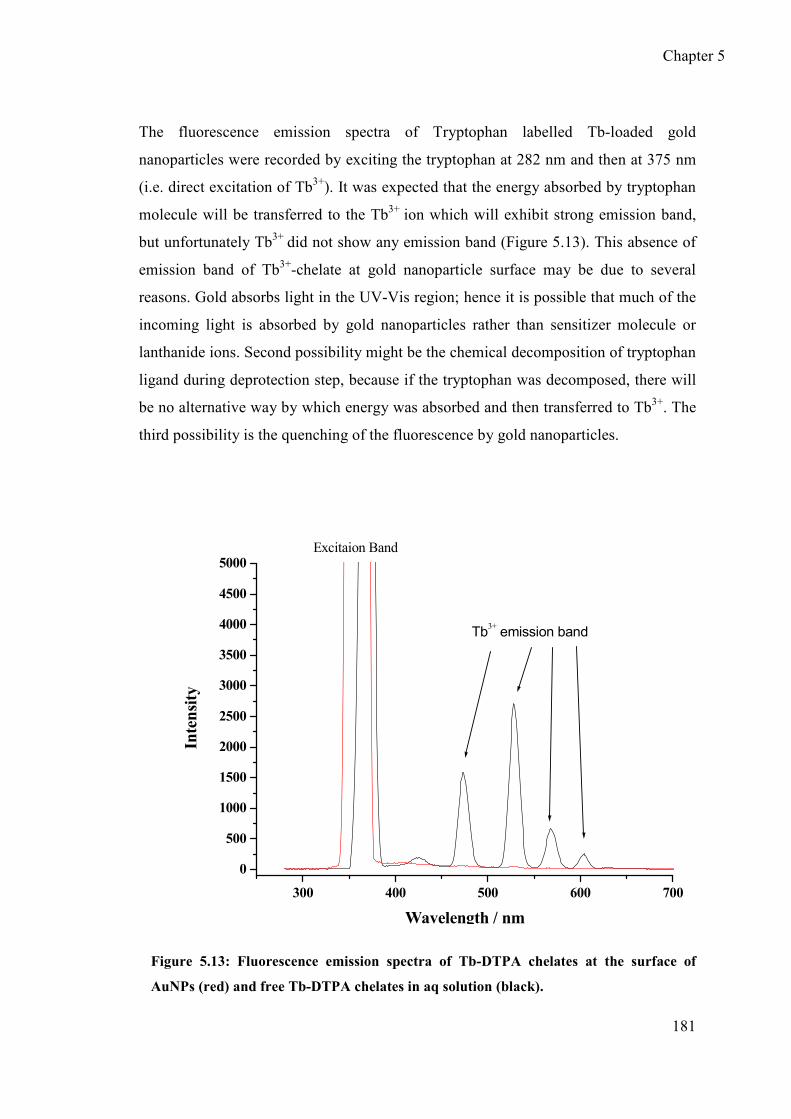
Chapter 5
181
The fluorescence emission spectra of Tryptophan labelled Tb-loaded gold
nanoparticles were recorded by exciting the tryptophan at 282 nm and then at 375 nm
(i.e. direct excitation of Tb3+). It was expected that the energy absorbed by tryptophan
molecule will be transferred to the Tb3+ ion which will exhibit strong emission band,
but unfortunately Tb3+ did not show any emission band (Figure 5.13). This absence of
emission band of Tb3+-chelate at gold nanoparticle surface may be due to several
reasons. Gold absorbs light in the UV-Vis region; hence it is possible that much of the
incoming light is absorbed by gold nanoparticles rather than sensitizer molecule or
lanthanide ions. Second possibility might be the chemical decomposition of tryptophan
ligand during deprotection step, because if the tryptophan was decomposed, there will
be no alternative way by which energy was absorbed and then transferred to Tb3+. The
third possibility is the quenching of the fluorescence by gold nanoparticles.
300 400 500 600 700
0
500
1000
1500
2000
2500
3000
3500
4000
4500
5000
Tb3+
emission band
Excitaion Band
Intensity
Wavelength / nm
Figure 5.13: Fluorescence emission spectra of Tb-DTPA chelates at the surface of
AuNPs (red) and free Tb-DTPA chelates in aq solution (black).

Chapter 5
182
5.6 Control experiments to confirm the quenching of lanthanide
ion fluorescence by AuNPs
Two independent control experiments were carried to explore the reason for the
absence of Tb3+ emission band at gold nanoparticle surface.
5.6.1 Ligand exchange approach (first control experiment)
In the first control experiment, most lanthanide-DTPA chelates were displaced from
the gold surface using a large (100 fold) excess of an alkane thiol (Figure 5.14).

Chapter 5
183
NH
O
O
NN
N
O O
O
O
O
O
S
O
O O
NHOO
N
N
N
O
O
O
O O
O
S
O
O
O
NH O O
N
N
N
O
O
O
OO
O
S
O
O
O
NH
O
O
NN
N
OO
O
O
O
O
S
O
OO
NH
O
O
N
N
N
O
O O
OO
O
S
O
O
O
NH
OO
NN
N
OO
O
O
O
O S
O
OO
NH
O
ON
N
N
OO
O
O
O
O
S
O
OO
NH
OO
N
N
N
O
O O
OO
O
S
O
O
O
S
HOOC
S
HOOC
S
COOH
S
COOH
S
HOOCS
COOHS
COOH
S
HOOCS
COOH
Au
H2O
H2O
H2O
H2O
Eu3+
H2O
Au
H2O
H2O
H2O
3-mercaptopropionic acid
Eu3+
Eu3+
Eu3+
Eu3+
Eu3+
Eu3+
Eu3+
hν
hν
Fluorescence
Fluorescence
Figure 5.14: Schematic representation of the first control experiment.

Chapter 5
184
The purpose of removing all lanthanide -DTPA chelates from the gold surface was to
remove the possibility of quenching the fluorescence of lanthanide-chelates by gold
nanoparticles. Mercaptopropionic acid was used for ligand exchange as it is water
soluble and has strong affinity (due to thiol group) for gold. The fluorescence
emission spectra of Eu3+-loaded AuNPs were recorded before and after ligand
exchange. When the lanthanide-DTPA chelates were replaced from the nanoparticle
surface, they exhibited intense fluorescence emission spectra (Figure 5.15) upon
excitation at 400 nm. This confirmed that Eu-DTPA chelate fluorescence was
quenched by gold nanoparticles.
200 300 400 500 600 700
0
1000
2000
3000
4000
5000 Eu3+ Emission Band
Excitation Band
Intensity
Wavelength / nm
Figure 5.15: Fluorescence emission spectra of Eu3+-DTPA@AuNPs, first control
experiment (black) and second control experiment (blue).
5.6.2 Second control experiment (decomposition of AuNPs)
The second control experiment confirmed the observations of the first control
experiment independently. In this experiment, gold nanoparticles were decomposed in
order to release the lanthanide-DTPA chelates from nanoparticle surface. It is well
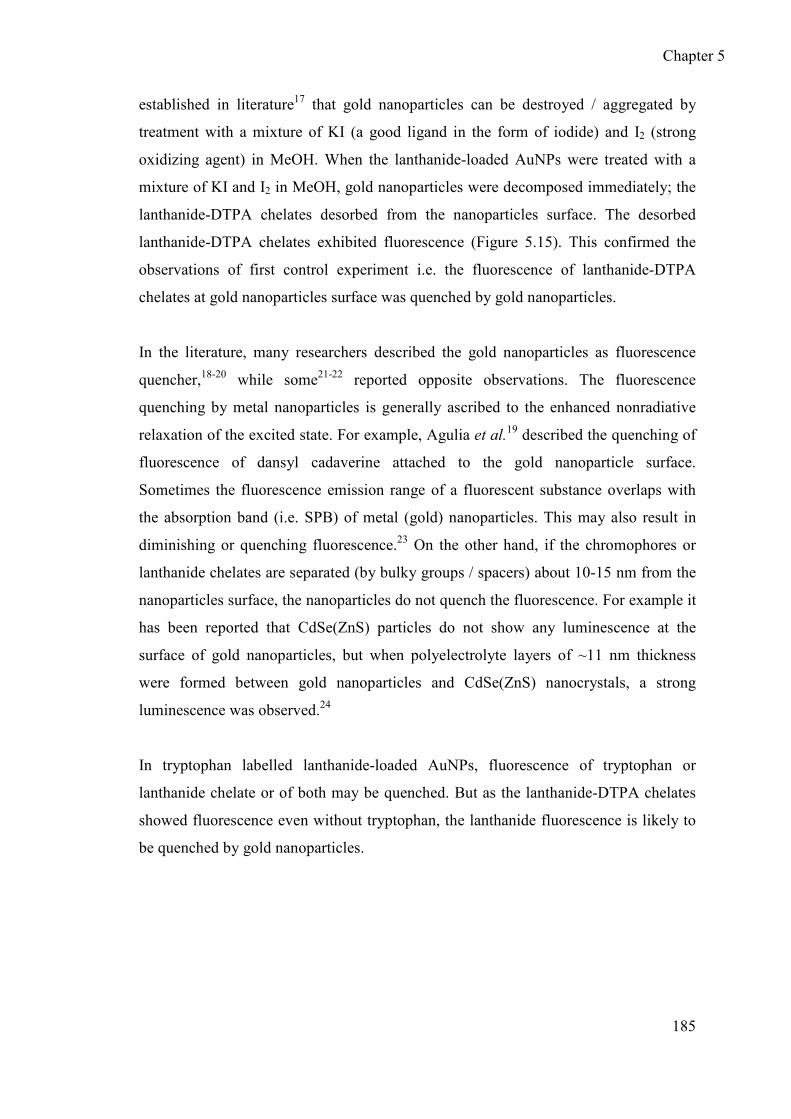
Chapter 5
185
established in literature17 that gold nanoparticles can be destroyed / aggregated by
treatment with a mixture of KI (a good ligand in the form of iodide) and I2 (strong
oxidizing agent) in MeOH. When the lanthanide-loaded AuNPs were treated with a
mixture of KI and I2 in MeOH, gold nanoparticles were decomposed immediately; the
lanthanide-DTPA chelates desorbed from the nanoparticles surface. The desorbed
lanthanide-DTPA chelates exhibited fluorescence (Figure 5.15). This confirmed the
observations of first control experiment i.e. the fluorescence of lanthanide-DTPA
chelates at gold nanoparticles surface was quenched by gold nanoparticles.
In the literature, many researchers described the gold nanoparticles as fluorescence
quencher,18-20 while some21-22 reported opposite observations. The fluorescence
quenching by metal nanoparticles is generally ascribed to the enhanced nonradiative
relaxation of the excited state. For example, Agulia et al.19 described the quenching of
fluorescence of dansyl cadaverine attached to the gold nanoparticle surface.
Sometimes the fluorescence emission range of a fluorescent substance overlaps with
the absorption band (i.e. SPB) of metal (gold) nanoparticles. This may also result in
diminishing or quenching fluorescence.23 On the other hand, if the chromophores or
lanthanide chelates are separated (by bulky groups / spacers) about 10-15 nm from the
nanoparticles surface, the nanoparticles do not quench the fluorescence. For example it
has been reported that CdSe(ZnS) particles do not show any luminescence at the
surface of gold nanoparticles, but when polyelectrolyte layers of ~11 nm thickness
were formed between gold nanoparticles and CdSe(ZnS) nanocrystals, a strong
luminescence was observed.24
In tryptophan labelled lanthanide-loaded AuNPs, fluorescence of tryptophan or
lanthanide chelate or of both may be quenched. But as the lanthanide-DTPA chelates
showed fluorescence even without tryptophan, the lanthanide fluorescence is likely to
be quenched by gold nanoparticles.

Chapter 5
186
5.7 Conclusions
Multifunctional gold nanoparticles bearing a fluorophore were prepared. Various
fluorescent lanthanides were chelated with DTPA based ligand at AuNPs surface. A
tryptophan based ligand (sensitizer for lanthanides) was prepared and adsorbed at the
nanoparticle surface via ligand exchange approach. Unfortunately tryptophan-labelled
lanthanide-loaded AuNPs did not show any fluorescence. The fluorescence was found
to be quenched by gold nanoparticles as confirmed by two independent control
experiments.
The next section of this chapter describes the other applications of lanthanide-
functionalised gold nanoparticles.

Chapter 5
187
5.8 Distance measurements by EPR spectroscopy
The second part of this chapter describes another important area of applications of
lanthanide-loaded gold nanoparticles which deals with the use of gold nanoparticles as
a model system for distance measurements. Interradical distance measurements have
wide spread applications in dynamics and structural studies of biomacromolecules and
their complexes.25 For example site-directed spin labelling (SDSL), discovered in
1994, is a technique used for probing protein local environment using EPR
spectroscopy. To study with EPR, a spin label is attached to the proteins, which exhibit
EPR spectra depending upon the dynamical and local chemical behaviour of proteins.
In most SDSL, nitroxide based spin labels are used (Figure 5.16). Furthermore, two
spin labels can also be attached at two different sites of the protein, the distance
between these two spins can be determined on the basis of dipolar interactions using
EPR spectroscopy. Most important applications of SDSL is to study the membrane
proteins as these proteins represent more than 50% of all proteins and future drug
targets, and are difficult to crystallize.26
Figure 5.16: Reaction of the methanethiosulfonate spin label with cysteine to generate
the disulfide-linked side chain to a protein.26
The following four techniques were developed for distance measurements in various
ranges.
1. Exchange interaction ESR
2. Dipolar cw-EPR
3. DEER (double electron-electron resonance)
4. Double quantum coherence

Chapter 5
188
The first two methods (based on continuous wave (cw) EPR) are limited to only
short distance measurements (0.4-2.5 nm) as they rely on the line shape analysis for
which strong interactions are required. The remaining two methods (3 and 4) are
based on pulsed EPR, and are much more sensitive than the cw-EPR spectroscopy.
These methods can extract dipolar interactions of weaker intensity and are thus
sensitive to long range distances between 1.7-8.0 nm.27 A new method for distance
measurements is being developed based on relaxation enhancement by paramagnetic
metal ions.28 For example, recently Jeschke and co-workers described the distance
measurement between nitroxide spin label and lanthanide chelate which are attached
at two ends of a model compound (Figure 5.17).25 The lanthanide chelate was used
for relaxation enhancement of nitroxide spin label.
2.72 nm
Figure 5.17: Structure of a model compound having lanthanide chelate and nitroxide
spin label.25
Gold nanoparticles protected by DTPA ligand were selected as a model system for
distance measurements by DEER due to several reasons. For example nanoparticles
having good size range (i.e. 1.5 nm to 15 nm) can be prepared easily with predictable
size distribution. Their size can be determined independently by TEM. Furthermore
more than one ligand can be attached at gold nanoparticle surface easily. For
distance measurements based on relaxation enhancement method, a spin label and a
lanthanide ion are needed. The DTPA ligand which is used for stabilisation of gold
nanoparticles can chelate lanthanides easily, while the spin label was synthesized
separately and then attached at gold nanoparticles surface by ligand exchange

Chapter 5
189
approach. Thus these nanoparticles; a model system can be used to test the
application of pulsed EPR method for distance measurements to the heterogeneous
systems. The synthesis and characterisation of TEMPO based ligand 8 (i.e. nitroxide
based spin label) by EPR is discussed in next section.
5.8.1 Synthesis of TEMPO based ligand 8
TEMPO based ligand 8 was synthesized by peptide coupling of dithiodipropionic acid
with amino-TEMPO. Dithiodipropionic acid contain disulphide group which will
make the ligand adsorb at the gold nanoparticle surface, while amino-TEMPO has a
stable nitroxide radical (Figure 5.18). The TEMPO based ligand was characterised by
MS (data shown in experimental chapter) and EPR spectrum. The EPR spectrum
showed characteristic features due to spin-spin interactions between the two nitroxide
radicals. A free nitroxide exhibit three lines, but if two nitroxides are placed close to
each other (as in TEMPO based ligand 8), some extra lines of low intensity (marked as
* in Figure 5.18) are observed, which confirmed the successful synthesis of TEMPO
based ligand 8.

Chapter 5
190
Figure 5.18: EPR spectrum of TEMPO based ligand 8 in DCM.
5.8.2 Spin-labelling of AuNPs by TEMPO based ligand 8
Spin labelling of gold nanoparticles with TEMPO based ligand i.e. nitroxide spin label
was carried out at 60-65 oC. The number of spin labels per nanoparticle can be
controlled by controlling stoichiometric ratio between gold nanoparticles and spin
label (i.e. TEMPO based ligand 8). To avoid multiple distances, on average 2-3 spin
labels were adsorbed per nanoparticle. The spin labelling was monitored using EPR
spectroscopy. After spin labelling, the free ligand could be removed by size exclusion
chromatography. When the nitroxide spin labels were adsorbed at gold nanoparticles
surface, the characteristic features (*) in their EPR spectrum disappeared (Figure
5.20). Another important change in an EPR spectrum of nitroxide adsorbed at the
nanoparticle surface was the line broadening. The line broadening occurs due to slower
motion of the nitroxide at the nanoparticle surface than the free nitroxide (Figure 5.20).
These two changes in EPR spectrum of TEMPO based ligand at gold nanoparticle
surface confirmed the successful spin labelling of gold nanoparticles.

Chapter 5
191
NHOO
N
N
NO
O
O
O OO
SO
O
O
NH
O
ON
N
N
O O
O
O
O
O
S
OO O
NH
O
O
NN
N
OO
O
O
O
O
S
O
OO
NH
O O
N
N
N O
O
O
OO
O
SO
O
O
N
O
S
NO
N
O
S
NO
Au
Figure 5.19: Spin labelled AuNPs protected by DTPA ligand 5.
**
Figure 5.20: EPR spectra of free nitroxide spin label (black) and adsorbed at AuNP
surface (red).

Chapter 5
192
5.8.3 Deprotection of t-butyl ester groups of DTPA ligand at AuNP
surface
The t-butyl esters groups of DTPA ligand were removed in order to chelate with
lanthanides. As deprotection involves the use of acid (TFA) and DCM (discussed
previously in chapter 2, section 2.2.4), the reaction was carried out under inert
atmosphere in order to avoid the decomposition of nitroxide radical. Furthermore, use
of excess (about 2 fold) DCM as compared to TFA, also helped to avoid nitroxide
radical decomposition. The nitroxide radical can disproportionate in the presence of
acid. During deprotection reaction, about half of nitroxide radicals at the nanoparticle
surface were found to decompose as evident from the EPR spectra shown in Figure
5.22. The deprotected spin-labelled gold nanoparticles (Figure 5.21) were water
soluble, and were purified by size exclusion chromatography.
NH
O
OHN
N
N
O OH
O
O
OH
OH
S
OO OH
N O
S NH
O
NH
O
OHN
N
N
OOH
O
O
OH
OH
S
O
OOH
NH O OH
N
N
N
O
OH
O
OOH
OH
S
O
O
OH
NH
OOH
N
N
NO
OH
O
OOH
OH
SO
O
OH
Au
Figure 5.21: Water soluble spin-labelled AuNPs protected by DTPA ligand 6.
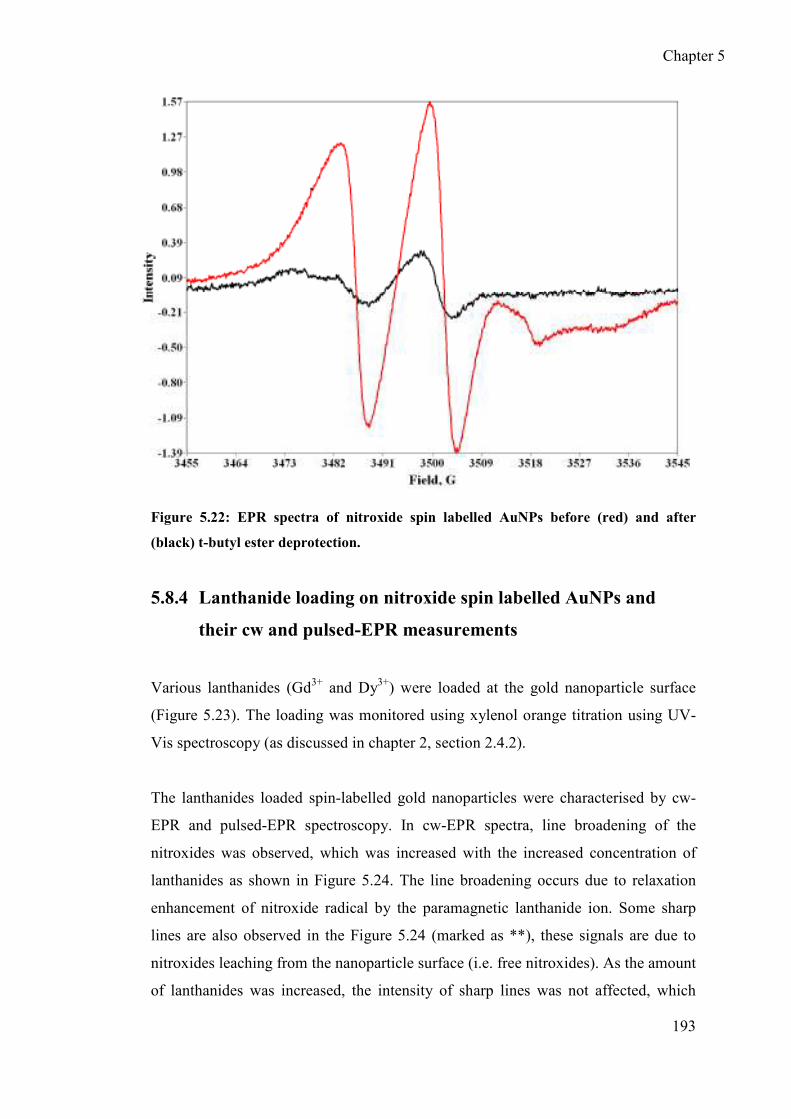
Chapter 5
193
Figure 5.22: EPR spectra of nitroxide spin labelled AuNPs before (red) and after
(black) t-butyl ester deprotection.
5.8.4 Lanthanide loading on nitroxide spin labelled AuNPs and
their cw and pulsed-EPR measurements
Various lanthanides (Gd3+ and Dy3+) were loaded at the gold nanoparticle surface
(Figure 5.23). The loading was monitored using xylenol orange titration using UV-
Vis spectroscopy (as discussed in chapter 2, section 2.4.2).
The lanthanides loaded spin-labelled gold nanoparticles were characterised by cw-
EPR and pulsed-EPR spectroscopy. In cw-EPR spectra, line broadening of the
nitroxides was observed, which was increased with the increased concentration of
lanthanides as shown in Figure 5.24. The line broadening occurs due to relaxation
enhancement of nitroxide radical by the paramagnetic lanthanide ion. Some sharp
lines are also observed in the Figure 5.24 (marked as **), these signals are due to
nitroxides leaching from the nanoparticle surface (i.e. free nitroxides). As the amount
of lanthanides was increased, the intensity of sharp lines was not affected, which
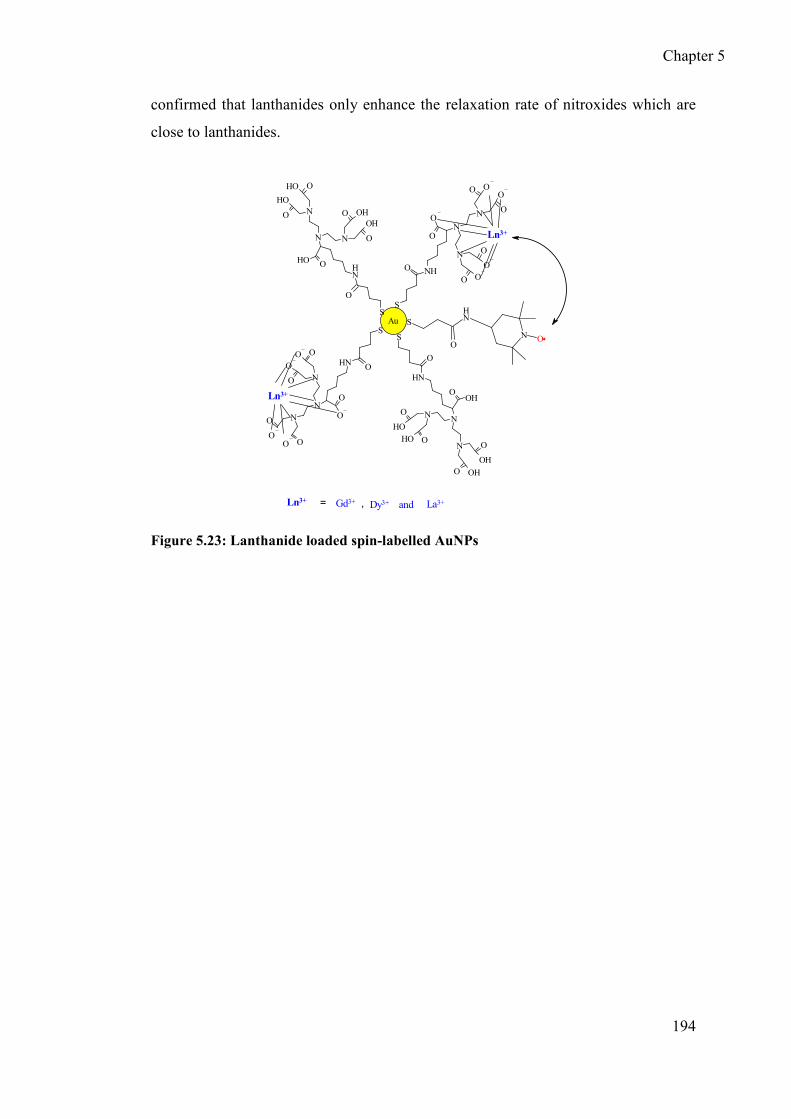
Chapter 5
194
confirmed that lanthanides only enhance the relaxation rate of nitroxides which are
close to lanthanides.
N O
S NH
O
NH
O
ON
N
N
O O
O
O
O
O
S
OO ON
HOOH
N
N
N
O
OH
O
O OH
OH
S
O
O
OH
NH
O
ON
N
N
OO
O
O
O
O
S
O
OO
NH
OOH
N
N
N
O
OHO
OOH
OH
S
O
O
OH
Au
Gd3+Ln3+ Dy3+ La3+= and
Ln3+
Ln3+
,
Figure 5.23: Lanthanide loaded spin-labelled AuNPs

Chapter 5
195
**[Gd3+]@ nitroxide labelled AuNPsincreasing
**
Figure 5.24: CW-EPR spectra of nitroxide spin labelled AuNPs in the presence of
various [Gd3+] concentrations.
5.8.5 Pulsed-EPR experiments
All the pulsed-EPR experiments were carried out in the laboratory of Prof. Gunnar
Jeschke at ETH Zürich (Switzerland). The pulsed EPR experiments consist of two
main parts: (a) distance measurements by Double Electron-Electron Resonance
(DEER), and (b) relaxation enhancement of nitroxide electron by lanthanides (pulse
EPR measurements).
5.8.5.1 Distance measurements (by DEER experiments)
The four pulse DEER experiment has become the most frequently used approach to
measure the nitroxide-nitroxide distances in the range between 1.6 and 8 nm. Recently
the same experiment has been performed on the Gd3+ ion as a detection spin and with a
nitroxide radical as a pumped species25, 29. The nitroxide-nitroxide distance and Gd3+-

Chapter 5
196
nitroxide distance at the surface of gold nanoparticle measured by DEER experiments
are shown in Table 5.1.
Table 5.1: Mean distance and the width of distance distribution obtained from the fit
of DEER data.
Gd and La at spin labelled AuNPs
NO-NO distance Gd3+-NO distance
r / nm Distribution width (r) / nm
r /nm Distribution width (r) / nm
0.0 % Gd3+ 2.40 0.53 - -
2 % Gd3+ 2.46 0.53 2.85 0.57
4 % Gd3+ - - 2.85 0.67
32 % La3+ 2.45 0.57 - -
The mean distance data are completely consistent and provide the averaged nitroxide-
nitroxide distance of approx. 2.44 nm and the Gd3+-nitroxide distance of 2.85 nm
(Table 5.1). Gd3+-nitroxide distance was found slightly larger than the nitroxide-
nitroxide distance because the DTPA ligand which chelated Gd3+ is bigger than the
nitroxide spin label (i.e. ligand 8).
5.8.5.2 Relaxation enhancement measurements
Relaxation enhancement (T1) of nitroxides by paramagnetic lanthanide ions at gold
nanoparticle surface was determined by fitting of inversion recovery traces. For Dy3+-
loaded spin labelled AuNPs, the relaxation enhancement depends on the amount of
Dy3+. The optimal enhancement contrast is achieved at 50-60 K (Figure 5.25). The
enhancement is one order of magnitude less than that observed previously for the
nitroxide and lanthanide labelled membrane inserting polypeptide. This unexpectedly
small relaxation enhancement of nitroxide by Dy3+ might be due to some underlying
relaxation mechanism at the surface of gold nanoparticles.

Chapter 5
197
20 40 60 80 1000
0.005
0.01
0.015
T(K)
T1
(s)
T1 vs. T (Dy)
Dy 4%
Dy 2%
Dy 1%
Figure 5.25: Relaxation time vs temperature curves for Dy3+-loaded spin labelled
AuNPs.
The relaxation enhancement for Gd3+-loaded spin labelled AuNPs was also found
similar in behaviour as for Dy3+ (Figure 5.26).

Chapter 5
198
20 40 60 80 1000
0.005
0.01
0.015
T(K)
T1
(s)
T1 vs. T (Gd)
Gd 4%
Gd 2%
Gd 1%
Figure 5.26: Relaxation time vs temperature curves for Gd3+-loaded spin labelled
AuNPs.
5.9 Conclusions
Water soluble nitroxide spin labelled AuNPs were prepared and then loaded with Dy3+
and Gd3+. For this model system, the distance measurement data by DEER
experiments were found in full agreement with the previous reported results29 for
model systems. But unfortunately, the relaxation enhancement studies of nitroxide by
lanthanides (Dy3+ and Gd3+) at the surface of gold nanoparticles were unexpected i.e.
no significant relaxation enhancement was observed. It might be due to the interaction
of nitroxide free electrons with the gold surface electrons.
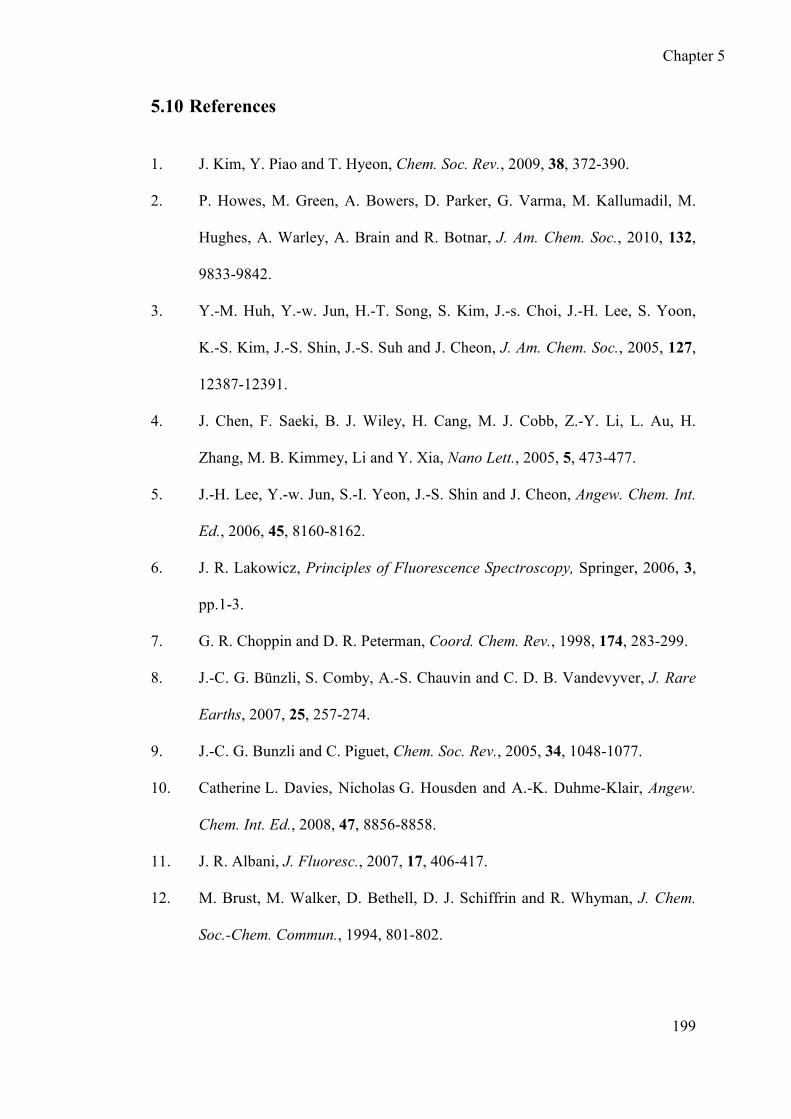
Chapter 5
199
5.10 References
1. J. Kim, Y. Piao and T. Hyeon, Chem. Soc. Rev., 2009, 38, 372-390.
2. P. Howes, M. Green, A. Bowers, D. Parker, G. Varma, M. Kallumadil, M.
Hughes, A. Warley, A. Brain and R. Botnar, J. Am. Chem. Soc., 2010, 132,
9833-9842.
3. Y.-M. Huh, Y.-w. Jun, H.-T. Song, S. Kim, J.-s. Choi, J.-H. Lee, S. Yoon,
K.-S. Kim, J.-S. Shin, J.-S. Suh and J. Cheon, J. Am. Chem. Soc., 2005, 127,
12387-12391.
4. J. Chen, F. Saeki, B. J. Wiley, H. Cang, M. J. Cobb, Z.-Y. Li, L. Au, H.
Zhang, M. B. Kimmey, Li and Y. Xia, Nano Lett., 2005, 5, 473-477.
5. J.-H. Lee, Y.-w. Jun, S.-I. Yeon, J.-S. Shin and J. Cheon, Angew. Chem. Int.
Ed., 2006, 45, 8160-8162.
6. J. R. Lakowicz, Principles of Fluorescence Spectroscopy, Springer, 2006, 3,
pp.1-3.
7. G. R. Choppin and D. R. Peterman, Coord. Chem. Rev., 1998, 174, 283-299.
8. J.-C. G. Bünzli, S. Comby, A.-S. Chauvin and C. D. B. Vandevyver, J. Rare
Earths, 2007, 25, 257-274.
9. J.-C. G. Bunzli and C. Piguet, Chem. Soc. Rev., 2005, 34, 1048-1077.
10. Catherine L. Davies, Nicholas G. Housden and A.-K. Duhme-Klair, Angew.
Chem. Int. Ed., 2008, 47, 8856-8858.
11. J. R. Albani, J. Fluoresc., 2007, 17, 406-417.
12. M. Brust, M. Walker, D. Bethell, D. J. Schiffrin and R. Whyman, J. Chem.
Soc.-Chem. Commun., 1994, 801-802.

Chapter 5
200
13. P. Ionita, A. Volkov, G. Jeschke and V. Chechik, Anal. Chem., 2007, 80, 95-
106.
14. P. Ionita, J. Wolowska, V. Chechik and A. Caragheorgheopol, J. Phys. Chem.
C, 2007, 111, 16717-16723.
15. T. Teranishi, S. Hasegawa, T. Shimizu and M. Miyake, Adv. Mater., 2001,
13, 1699-1701.
16. S. Langereis, Q. G. de Lussanet, M. H. P. van Genderen, W. H. Backes and
E. W. Meijer, Macromolecules, 2004, 37, 3084-3091.
17. W. Cheng, S. Dong and E. Wang, Angew. Chem. Int. Ed., 2003, 42, 449-452.
18. E. Dulkeith, A. C. Morteani, T. Niedereichholz, T. A. Klar, J. Feldmann, S.
A. Levi, F. C. J. M. van Veggel, D. N. Reinhoudt, M. Möller and D. I.
Gittins, Phys. Rev. Lett., 2002, 89, 203002.
19. A. Aguila and R. W. Murray, Langmuir, 2000, 16, 5949-5954.
20. J. R. Lakowicz, Principles of Fluorescence Spectroscopy, Springer, 2006, 3,
Ch. 8.
21. J. Massue, S. J. Quinn and T. Gunnlaugsson, J. Am. Chem. Soc., 2008, 130,
6900-6901.
22. A. Wokaun, H. P. Lutz, A. P. King, U. P. Wild and R. R. Ernst, J. Chem.
Phys., 1983, 79, 509-514.
23. S. Mayilo, M. A. Kloster, M. Wunderlich, A. Lutich, T. A. Klar, A. Nichtl,
K. Ku ̈rzinger, F. D. Stefani and J. Feldmann, Nano Lett., 2009, 9, 4558-4563.
24. O. Kulakovich, N. Strekal, A. Yaroshevich, S. Maskevich, S. Gaponenko, I.
Nabiev, U. Woggon and M. Artemyev, Nano Lett., 2002, 2, 1449-1452.
25. H. Jäger, A. Koch, V. Maus, H. W. Spiess and G. Jeschke, J. Magn. Reson.,
2008, 194, 254-263.
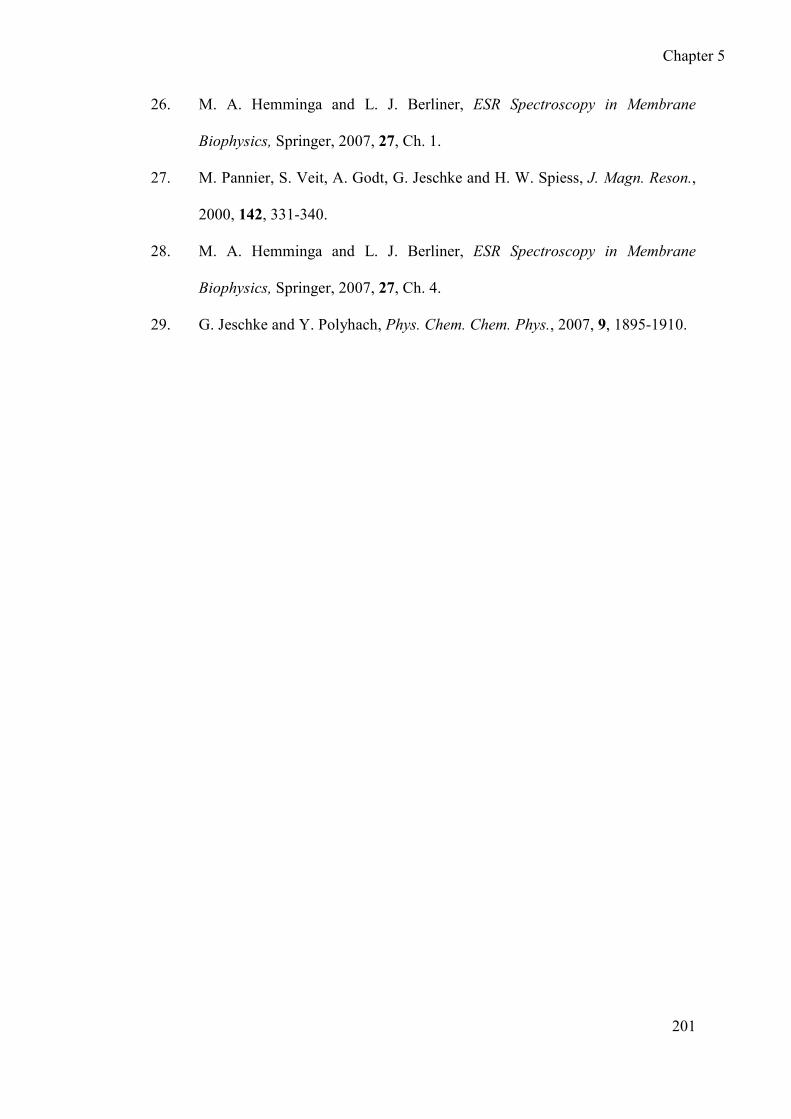
Chapter 5
201
26. M. A. Hemminga and L. J. Berliner, ESR Spectroscopy in Membrane
Biophysics, Springer, 2007, 27, Ch. 1.
27. M. Pannier, S. Veit, A. Godt, G. Jeschke and H. W. Spiess, J. Magn. Reson.,
2000, 142, 331-340.
28. M. A. Hemminga and L. J. Berliner, ESR Spectroscopy in Membrane
Biophysics, Springer, 2007, 27, Ch. 4.
29. G. Jeschke and Y. Polyhach, Phys. Chem. Chem. Phys., 2007, 9, 1895-1910.

Chapter 6
202
6 Chapter 6: Conclusions and Proposed Future Work
Chapter 6
203
Chapter 6: Conclusions and proposed future work
6.1 General conclusions
Gold nanoparticle based MRI contrast agents (CAs) were synthesized and
characterised. The relaxation measurements showed that gold nanoparticle based
CAs have slightly higher efficiency than the commercially available MRI contrast
agent i.e. Gd-DTPA.1 Due to promising multifunctionality features of gold
nanoparticles, applicability of these nanoparticle based contrast agents for MRI as
target specific agents was evaluated by attaching a recognition vector. The target-
specific studies of multifunctional gold nanoparticle based CAs were successful.
In order to explore the moderate increase in relaxivity, EPR spectroscopy was used
which confirmed that moderate increase in relaxivity was due to relatively fast
tumbling of nanoparticle-attached Gd-DTPA chelates. The EPR results diverted the
project to develop strategies for reducing mobility of the Gd-DTPA chelates at the
nanoparticle surface. The immobilisation of Gd-DTPA chelates was increased by
depositing layers of oppositely charged polyelectrolytes at the negatively charged
surface of Gd-DTPA@AuNPs. The polyelectrolyte layers reduced mobility, which
resulted in significant increase in relaxivity. The increase in ligand packing density
at nanoparticle surface by increasing the size of nanoparticles was an alternative
strategy which also influenced / increased the relaxivity significantly. Thus EPR
measurements confirmed the previously reported1-4 moderate increase in relaxivity
by gold nanoparticle based contrast agents. Apart from Gd-based contrast agents,
paramagnetic nitroxide radical based contrast agents were also prepared using gold
nanoparticles as templates.
Several nitroxide radicals were attached at the gold nanoparticles surface to get
nitroxide based ligand protected gold nanoparticles as MRI contrast agents. The
redox behaviour of these nitroxide based contrast agents was studied in vitro using
EPR spectroscopy. The EPR data showed that nitroxides at gold nanoparticle surface
Chapter 6
204
underwent chemical reduction slower as compared to free nitroxides which showed
better efficiency of gold nanoparticle based redox sensitive contrast agents than free
nitroxides. The relaxivity of nitroxide protected AuNPs was also found slightly
higher than for free nitroxides.
Gold nanoparticles protected by DTPA based ligands were also studied for some
other useful applications besides MRI contrast agents. They were studied as optical
imaging contrast agents after replacing Gd3+ with other lanthanides such as Tb3+ and
Eu3+. However, fluorescence measurements of Tb and Eu-loaded AuNPs did not
show any fluorescence, their fluorescence was quenched by gold nanoparticles. The
nitroxide labelling of DTPA ligand protected AuNPs and then loading with various
lanthanides (La3+, Dy3+ and Gd3+) provided the opportunity to test a useful (i.e.
double electron electron resonance) EPR methodology.
The real clinical applications of gold nanoparticle based MRI contrast agents may be
hampered due to several issues: e.g. their efficiency is not much higher than the
small molecules based CAs, AuNPs based CAs will have a much higher cost. But
the results regarding gold nanoparticle based contrast agents presented in this thesis
will definitely pave the way for multifunctionality studies using other nanomaterials,
supramolecular assemblies and other similar systems. For example, these results will
definitely help further studies of mesoporous silica based contrast agents5, which is
much cheaper than gold, easy to synthesize and might have much higher efficiency
than gold nanoparticle based CAs. However this work can be further extended to
explore many other aspects, e.g. quenching of fluorescence of Tb-loaded AuNPs,
very small increase in relaxivity of nitroxide protected AuNPs etc.
6.2 Proposed future work
As mentioned in the above section, the fluorescence of lanthanide-loaded AuNPs
was found to be quenched by AuNPs. This quenching can be avoided by
synthesising some new DTPA ligands with a long carbon tail as compared to DTPA
ligand 5 or 6. The long tail DTPA ligand will help to avoid the fluorescence
quenching of lanthanide chelates at gold nanoparticle surface and thus

Chapter 6
205
lanthanide-loaded gold nanoparticles can be studied as optical imaging contrast
agents (Figure 6.1).6
Au
N
O
O
O
N SNH
OO ON
O
O
OO
NO
OO
NO
O
N
OO
OO
S
Flourescence quenched
Flourescence
Tb3+
Tb3+
H2O
OH2
small carbon chain
long carbon chain
Figure 6.1:Tb-DTPA chelates at AuNPs surface with small and long carbon chain.
Secondly various methods for increasing efficiency (relaxivity as well as reducing
behaviour) of nitroxide protected gold nanoparticles can be explored. For example
after replacing the triphenylphosphine (PPh3) molecules with dithiobis
[succinimidylpropionate] (DSP) from triphenylphosphine protected gold
nanoparticle (PPh3@AuNPs), the DSP can be reacted with PAMAM dendrimers
(G0) along with amino-TEMPO to get nitroxide and PAMAM dendrimers protected
gold nanoparticles. PAMAM dendrimers molecules will restrict the tumbling of
nanoparticles attached nitroxides which will enhance the relaxivity. The insertion of
dendrimer molecules in between nitroxides at nanoparticles will also help to increase
the reduction period of nitroxides. Furthermore after attaching suitable biomolecules

Chapter 6
206
they can be in vitro and then in vivo studied for brain imaging as they might pass
through blood brain barrier.
In chapter five, the paramagnetic radicals (i.e. nitroxides) and lanthanide ions (Dy3+,
Gd3+, La3+) were attached at the surface of gold nanoparticles and these nanoparticles
were quite soluble in aqueous medium (i.e. water). DNP (dynamic nuclear
polarisation), which is based on Nuclear Overhauser Effect7 (discovered in 1953), is
the phenomenon of NMR signals enhancement by electronic spin polarisation. The
signal intensity of the nuclei under question can be enhanced significantly; for
example, theoretically 1H NMR signal intensity can be enhanced by a factor of 660.
The gold nanoparticles with stable radicals and lanthanides at their surface can be
utilised as model compounds for studying DNP phenomenon. The gold nanoparticles
having more than one radical at their surface may prove better signal enhancer by
electron spin polarisation phenomenon than monoradical. The relatively restricted
tumbling of radicals as compared to free radicals at nanoparticle surface could play a
significant role in DNP phenomenon.

Chapter 6
207
6.3 References
1. P.-J. Debouttière, S. Roux, F. Vocanson, C. Billotey, O. Beuf, A. Favre-
Réguillon, Y. Lin, S. Pellet-Rostaing, R. Lamartine, P. Perriat and O.
Tillement, Adv. Funct. Mater., 2006, 16, 2330-2339.
2. C. Alric, J. Taleb, G. L. Duc, C. Mandon, C. Billotey, A. L. Meur-Herland,
T. Brochard, F. Vocanson, M. Janier, P. Perriat, S. Roux and O. Tillement, J.
Am. Chem. Soc., 2008, 130, 5908-5915.
3. M. Marradi, D. Alcantara, J. M. d. l. Fuente, M. L. Garcia-Martin, S. Cerdan
and S. Penades, Chem. Comm., 2009, 3922-3924.
4. J.-A. Park, P. A. N. Reddy, H.-K. Kim, I.-S. Kim, G.-C. Kim, Y. Chang and
T.-J. Kim, Bioorg. Med. Chem. Lett., 2008, 18, 6135-6137.
5. K. M. L. Taylor, J. S. Kim, W. J. Rieter, H. An, W. Lin and W. Lin, J. Am.
Chem. Soc., 2008, 130, 2154-2155.
6. J. Massue, S. J. Quinn and T. Gunnlaugsson, J. Am. Chem. Soc., 2008, 130,
6900-6901.
7. A. P. M. Kentgens, J. Bart, P. J. M. van Bentum, A. Brinkmann, E. R. H. Van
Eck, J. G. E. Gardeniers, J. W. G. Janssen, P. Knijn, S. Vasa and M. H. W.
Verkuijlen, J. Chem. Phys., 2008, 128, 1-24.
Chapter 7
208
7 Chapter 7: Experimental

Chapter 7
209
Chapter 7: Experimental
7.1 Materials and chemicals
All chemicals were purchased from Sigma-Aldrich if not stated otherwise. All
solvents were purchased from Fisher Scientific International. All chemicals were
used as received without further purification unless stated otherwise. Bio-beads S-XI
(200-400 mesh) for gel permeation chromatography was purchased from Bio-Rad.
The Sephadex gel LH-20 was supplied by GE Healthcare.
Dithiobis(succinimidylpropionate) (DSP) was purchased from Apollo Scientific Ltd.
TLC analysis was performed on Merck Silica Gel 60 F245 aluminium backed silica
plates. Column chromatography was performed using silica gel 60 which was
purchased from BDH. The dialysis membranes with MWCO 500 and 12-14 kDa
were supplied by Spectrum Laboratories and Fischer Scientific, respectively.
7.2 Instrumentation / techniques
• NMR: 1H and 13C NMR spectra were recorded on JEOL ECX 270 MHz,
ECX 400 MHz and ECS 400 MHz machines. Values of chemical shifts for 1H NMR spectra are reported relative to internal standards i.e. CHCl3 in
CDCl3 (7.26 ppm), CH3OD in CD3OD (3.49 ppm) and HOD in D2O (4.79
ppm). Similarly, 13C NMR peaks are referenced to the solvent peaks i.e.
CDCl3 (77.36 ppm) and CD3OD (50.41 ppm). Spectral splitting parameters
are represented as: s, singlet; t, triplet; q, quartet; m, multiple; br, broad.
• MS: Mass spectra were recorded on a Bruker micro-TOF with LCQ ion trap
and ESI ion source.
• UV/Vis.: UV/Vis. spectra were acquired on a double beam Hitachi U-3000
spectrophotometer.
• IR: IR spectra were recorded on JASCO FT/IR-400 spectrometer.
• Fluorescence Emission Spectra: The fluorescence emission spectra were
acquired on Hitachi F-4500 Flourimeter.
Chapter 7
210
• EPR: The EPR spectra were recorded on Bruker EMX, ESP300E and JEOL
JES-RE 1X spectrometers.
• TGA: The TGA analysis of all samples was performed on STA625 Thermal
Analyzer.
• TEM: TEM analysis was carried out using FEI TECNI I2 electron
microscope.
• Elemental Analysis: Elemental analyses were carried out by Microanalysis
Service at Medac Ltd., (London).
• NMR Imaging: T1 weighted images were acquired on a spin echo based
RARE sequence on Bruker Avance II 600 MHz (14 T) NMR spectrometer
with the GREAT 40 gradient system. Imaging parameters were: time of
repetition (TR) 400.0 ms, time of echo (TE) 15.0 ms, the thickness of the
slice 2.0 mm, MTX (matrix size) = 128 × 128, FOV (field of view) = 2.5cm
× 2.5cm
• Relaxation Measurements: Relaxation measurements were carried out on
Bruker AMX 300 MHz spectrometer at room temperature (298 K)
• Pulsed EPR (DEER) Measurements: Double electron-electron resonance
measurements were carried on a Bruker EleXsys E680 X/W-band
spectrometer in collaboration with Prof. Gunnar Jeschke at ETH Zurich,
Switzerland.
Gold Nanoparticles Yield Calculations: The yield of AuNPs protected by
various (thiol based) ligands was calculated by assuming the 3 / 1 : Au to ligand
ratio.1

Chapter 7
211
7.3 Experimental part for chapter 2
7.3.1 Synthesis of DTPA based ligand 6
7.3.1.1 Alkylation of ethanolamine by t-butyl protected bromoacetate (1)
HONH2
HO
6
5
N
O
O
4
3
O
O+
1
NaHCO3
DMF2
1
BrO
O
2
Compound 1 was synthesized by following the literature procedure.2 To t-butyl
bromoacetate (13.5 g, 69.2 mmol) dissolved in DMF (50 mL), KHCO3 (7.68 g, 76.8
mmol) was added. The suspension was cooled to 0 oC and ethanolamine (0.92 mL,
15.16 mmol) was added over a period of 5 min. The reaction mixture was stirred for
30 min at 0 oC and for 22 h at room temperature. At the end of this period, diethyl
ether (75 mL) and saturated aq. NaHCO3 (50 mL) were added. The organic phase
was separated from aqueous phase and organic phase was washed with saturated aq.
NaHCO3 (50 mL). The aqueous phases were combined and extracted with diethyl
ether (75 mL) and organic phases were combined and washed with brine (75 mL).
The organic phase was dried with anhydrous Na2SO4, and evaporated to get
compound 1 as white solid. Yield 12.60 g (63 %). 1H NMR (CDCl3): δ (ppm) 1.38 (s, 18H, H
1), 2.84 (t, J 5.01 Hz, 2H, H5), 3.41 (s,
4H, H4), 3.48 (t, J 5.01 Hz, 2H, H6). 13C NMR (CDCl3): 28.01 (C
1), 56.53 (C5), 56.80 (C6), 59.20 (C4), 81.38 (C2),
171.31 (C3).
HR ESI-MS: m/z,[M + H] 1+, Calcd. for C14H28NO5: 290.1962, Found: 290.1958
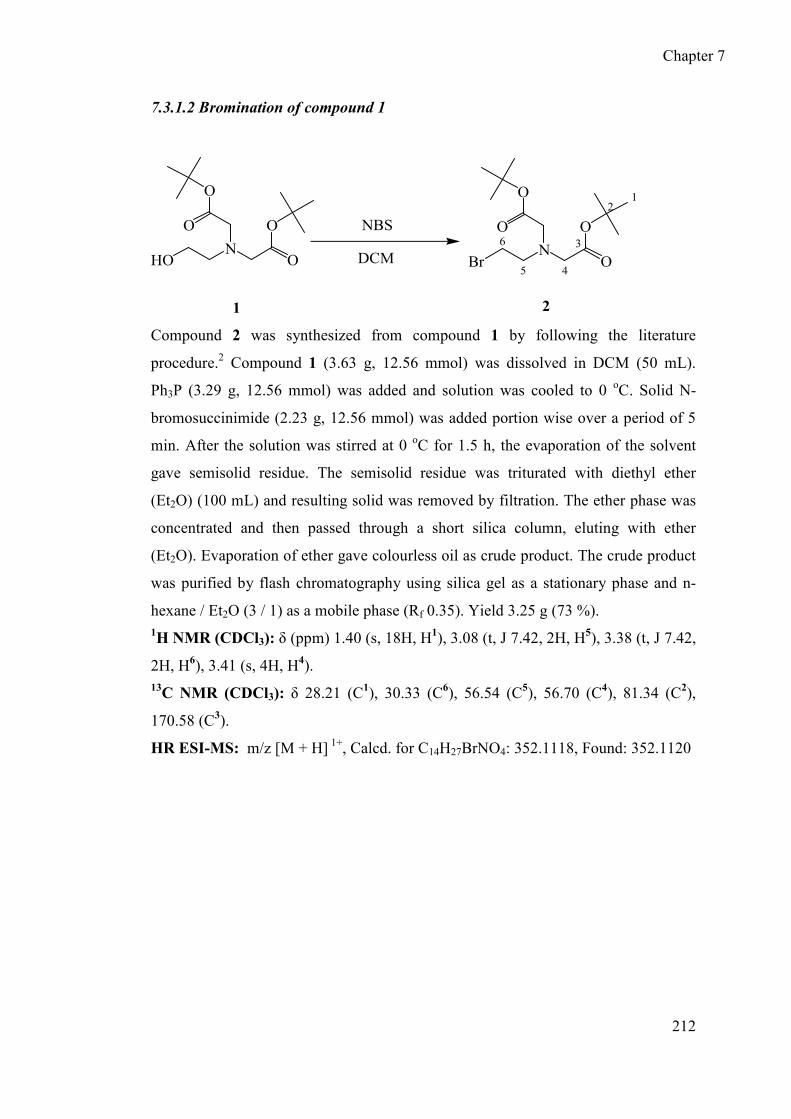
Chapter 7
212
7.3.1.2 Bromination of compound 1
2
NBS
DCMHON
O
O
O
O
1
Br
6
5
N
O
O
4
3
O
O
21
Compound 2 was synthesized from compound 1 by following the literature
procedure.2 Compound 1 (3.63 g, 12.56 mmol) was dissolved in DCM (50 mL).
Ph3P (3.29 g, 12.56 mmol) was added and solution was cooled to 0 oC. Solid N-
bromosuccinimide (2.23 g, 12.56 mmol) was added portion wise over a period of 5
min. After the solution was stirred at 0 oC for 1.5 h, the evaporation of the solvent
gave semisolid residue. The semisolid residue was triturated with diethyl ether
(Et2O) (100 mL) and resulting solid was removed by filtration. The ether phase was
concentrated and then passed through a short silica column, eluting with ether
(Et2O). Evaporation of ether gave colourless oil as crude product. The crude product
was purified by flash chromatography using silica gel as a stationary phase and n-
hexane / Et2O (3 / 1) as a mobile phase (Rf 0.35). Yield 3.25 g (73 %). 1H NMR (CDCl3): δ (ppm) 1.40 (s, 18H, H
1), 3.08 (t, J 7.42, 2H, H5), 3.38 (t, J 7.42,
2H, H6), 3.41 (s, 4H, H4). 13C NMR (CDCl3): δ 28.21 (C
1), 30.33 (C6), 56.54 (C5), 56.70 (C4), 81.34 (C2),
170.58 (C3).
HR ESI-MS: m/z [M + H] 1+, Calcd. for C14H27BrNO4: 352.1118, Found: 352.1120

Chapter 7
213
7.3.1.3 Alkylation of N-ε-CBZ-L-Lysine t-butyl ester hydrochloride by bromo
derivative 2
NH2O NH
OOO
. HCl BrN
O
O
O
O
pH ~ 8.048 h
2
N- -CBZ-L-Lysine t-butyl ester hydrochloride
N
17
O 16 NH15
14
13
12
11
10O 9
OO
18
8
7
6
5
N
N
4
O
O
O
O
3
O
OO
O 2
1
CH3CN / Buffer
3
ε
2
Compound 3 was synthesized according to literature procedure.3 N-ε-CBZ-L-Lysine
t-butyl ester hydrochloride (1.87 g, 5.01 mmol) was taken in a round bottom flask
containing acetonitrile (10 mL). Compound 2 (4.50 g, 12.09 mmol) was added
followed by phosphate buffer (2 M, 12 mL, pH 8.0) and the mixture was stirred for 2
h. After stirring, aqueous layer was replaced with fresh buffer solution and then
stirred again for 48 h. The organic layer was separated from the aqueous layer. The
aqueous layer was discarded and organic layer was concentrated to dryness by rotary
evaporation. The crude material was purified by flash chromatography using silica
gel as a stationary phase and EtOAc / n-hexane (1 / 2) as a mobile phase (Rf 0.51).
Yield 3.15 g (72 %).
Chapter 7
214
1H NMR (CDCl3): δ (ppm) 1.28-1.36 (m, 2H, H
12), 1.40 (s, 45H, H1), 1.44-1.65 (m,
4H, H11, H13), 2.56-2.82(m, 8H, H5
, H6), 3.15 (t, J 6.40 Hz, 2H, H14), 3.22 (t, J 7.32
Hz, 1H, H10), 3.40 (s, 8H, H4), 5.04 (s, 2H, H17), 5.12 (br, 1H, H15), 7.20-7.29 (m,
5H, Ar18-H ).
13C NMR (CDCl3): δ (ppm) 23.31 (C
12), 28.11 (C7), 28.25 (C1), 29.45 (C11), 40.81
(C14), 50.16 (C13), 53.53 (C5), 55.90 (C4), 60.34 (C6), 63.86 (C10), 66.36 (C17), 80.71
(C8), 80.75 (C2), 127.91, 128.05, 128.39, 136.72 (Ar), 156.73 (C16), 170.61 (C3),
172.69 (C9).
HR ESI-MS: m/z [M + H] 1+, Calcd. for C46H79N4O12: 879.5689, Found: 879.5684

Chapter 7
215
7.3.1.4 Deprotection of DTPA-analogue 3
NO NH
OOO
N
N
O
O
O
O
O
OO
O
NH2N15
14
13
12
11
109OO8
7
6
5
N
N
4
O
O
O
O
3
O
OO
O 2
1
4
H25% Pd /C
MeOH
3
Compound 4 was synthesized according to literature procedure.3 Compound 3 (1.0 g,
1.14 mmol) was taken in a 50.0 mL round bottom flask containing MeOH (25 mL).
The 5% Pd on C (100.0 mg) was added and reaction mixture was flushed with
nitrogen gas (3-4 times). The suspension was vigorously stirred for 4 h under
hydrogen atmosphere at room temperature. The residue was filtered using sintered
filter and evaporation of solvent gave a yellow coloured crude product. The crude

Chapter 7
216
product was purified by flash chromatography using MeOH with a few drops of
Et3N (Rf 0.28). Yield 0.525 g (62 %).
1H NMR (CDCl3): δ (ppm) 1.28-1.36 (m, 2H, H
12), 1.40 (s, 45H, H1), 1.46-1.68 (m,
4H, H11, H13), 2.64-2.82 (m, 8H, H5
, H6), 3.04 (t, J 7.13 Hz, 1H, H10), 3.22 (t, 6.58
Hz, 2H, H14), 3.40 (s, 8H, H4).
13C NMR (CDCl3): δ (ppm) 23.20 (C
12), 28.25 (C7), 28.35 (C1), 29.61 (C11), 32.00
(C13), 40.81 (C14), 50.60 (C5), 53.60 (C6), 56.10 (C4), 64.05 (C10), 80.90 (C8), 81.00
(C2), 170.78 (C3), 172.80 (C9).
HR ESI-MS: m/z [M + H] 1+, Calcd. for: C38H73N4O10 745.5321, Found: 745.5332
7.3.1.5 Coupling of DTPA-analogue 4 with dithiobutyric acid
NH2N
OON
N
O
O
O
O
O
OO
O
HOOC SS COOH
DCC + DMAPEtOAc
48 h
C SS16
15
14
C13 NNH12
11
10
9
87
19OO18
17
6
5
N
N
4
O
O
O
O
3
O
OO
O 2
O
1
NHN
O O
N
N
O
O
O
O
O
O O
OO
Dithiobutyric Acid
4
5
+
Chapter 7
217
Compound 5 was synthesized using a standard peptide (DCC / DMAP) coupling
method4. Compound 4 (0.453 g, 0.61 mmol) was taken in a 50 mL round bottom
flask containing EtOAc (10 mL). Dithiobutyric acid (0.066 g, 0.277 mmol) was
added and solution was cooled to 0 oC. Dicyclohexylcarbodiimide (DCC) (0.057 g,
0.277 mmol) and dimethylaminopyridine (DMAP) (0.034 g, 0.277 mmol) were
added as a mixture of solids and solution was stirred for 48 h at room temperature.
After stirring, the solid residues were removed by filtration and filtrate was
evaporated to get a highly viscous yellow coloured crude product. The crude
compound was purified by flash chromatography using silica gel as a stationary
phase and ethyl acetate/n-hexane (2/1) as a mobile phase (Rf 0.65). Yield 0.545 g
(53%). NMR spectrum assignment was done by comparison with similar compounds
reported in the literature.5
1H NMR (CDCl3): δ (ppm) 1.40 (s, 90H, H
1), 1.17-1.64 (m, 12H, H8, H9, H10), 1.90-
2.02 (m, 4H, H15), 2.26 (t, J 7.32 Hz, 2H, H14), 2.56-2.70 (m, 16H, H5, H6), 2.76 (t, J
7.47 Hz, 4H, H16), 3.23-3.16 (m, 6H, H7 , H11), 3.40 (s, 16H, H4).
13C NMR (CDCl3): δ (ppm) 19.81 (C
9), 21.07 (C15), 24.40 (C1), 24.52 (C17), 25.26
(C8), 25.68 (C10), 30.89 (C14), 34.28 (C16), 35.50 (C11), 46.39 (C5), 49.81 (C4), 52.16
(C6), 60.14 (C7), 76.93(C18), 77.06 (C2), 166.89 (C3), 168.24 (C19), 168.95 (C13).
HR ESI-MS: m/z [M + H]2+, Calcd. for C84H156N8O22S2: 846.5382, Found:
846.5379

Chapter 7
218
7.3.1.6 Deprotection of t-butyl ester groups of DTPA based ligand 5
C SS C NN
H
OON
N
O
O
O
O
O
OO
OO
NHN
O O
N
N
O
O
O
O
O
O O
OO
5
C SS14
13
12
C11 NNH10
9
8
7
6
5
OHO4
3
N
N
O
O
HO
HO
1
O
OHO
OHO
NHN
HO O
N
N
O
O
OH
OH
O
O OH
HOO
6
2
TFA / DCM : 1 / 1
Compound 6 was obtained by deprotection of t-butyl ester groups of compound 5
using a modified literature procedure.5 Compound 5 (117 mg, 0.069 mmol) was
taken in a 25 mL round bottom flask. Trifluoroacetic acid (TFA) (1.0 mL) was added
to the solution of compound 5 in dichloromethane (DCM) (1.5 mL). The reaction
mixture was stirred overnight at rt. After overnight stirring, DCM and TFA were
evaporated using rotary evaporator at rt. The crude product (compound 6) was
dissolved in water (10.0 mL), filtered and dialyzed using 500 MWCO dialysis tubing
against deionised H2O for 48 h. After dialysis, water was evaporated below 40 oC to
get a white product. Yield 60.0 mg (77 %).
1H NMR (D2O): δ (ppm) 1.17-1.66 (m, 12H, H
6, H7, H8), 1.77-1.82 (m, 4H, H13),
2.28 (t, J 7.01 Hz, 4H, H14), 2.66 (t, J 7.01 Hz, 4H, H12), 2.84-3.08 (m, 10H, H4, H5),
3.22-3.40 (m, 12H, H3, H9), 3.82 (s, 16H, H2).

Chapter 7
219
13C NMR (D2O): δ (ppm) 23.42 (C
7), 24.81 (C13), 27.82 (C6), 28.19 (C8), 34.35
(C12), 37.14 (C14), 38.92 (C9), 46.29 (C4), 52.89 (C3), 55.92 (C2), 63.26 (C5), 169.65
(C1), 175.09 (C15), 175.70 (C11).
HR ESI-MS: m/z [M-H] 2- Calcd. for C44H72N8O22S2: 546.2107, Found: 546.2103
7.3.1.7 Synthesis of AuNPs stabilised by DTPA based ligand 6
NHOHO
N
N
NO
HO
O
O OH
HO
SO
OOH
HN
O
OHN
N
N
OHO
O
OHO
HO
S
O
OHO
HN O OH
N
N
NOOH
O
OHOOH
SO
OHO
NH
O
HON
N
N
O OH
O
OOH
OH
S
O
O OH
N
OOH
NH
O
N
N
O
OO
OH
OH
OH
OH
SSR1 R1
O OHAuCl4(aq)
DTPA based ligand 6
R1 =
AuNPs stabilized by DTPA based ligand 6
AuNaBH4
Gold nanoparticles stabilized by DTPA based ligand 6 were prepared by
modification of a literature procedure.6 A 1.0 % w/w solution of hydrogen
tetrachloroauric acid trihydrate (HAuCl4. 3H2O) (4.12 mL, 0.1 mmol) was taken in a
25 mL round bottom flask. To this flask, DTPA based ligand 6 (60 mg, 0.1 mmol)
dissolved in deionised water (10.0 mL) was added. A freshly prepared aqueous
solution of NaBH4 (40 mg, 1.0 mmol) in deionised water (10.0 mL) was added
immediately after the addition of ligand 6 to the flask. The colour of the stirring
solution turned dark brown after the addition of sodium borohydride solution, which
confirmed the formation of gold nanoparticles. After stirring for 10 min, water was
evaporated below 40 oC using rotary evaporator. The excess ligand was removed by
GPC (Sephadex gel G-100) column using aq 0.1M NaCl as eluent. The AuNPs were
then dialysed against DI H2O using 12-14 kDa MWCO tubing for o / n, and then
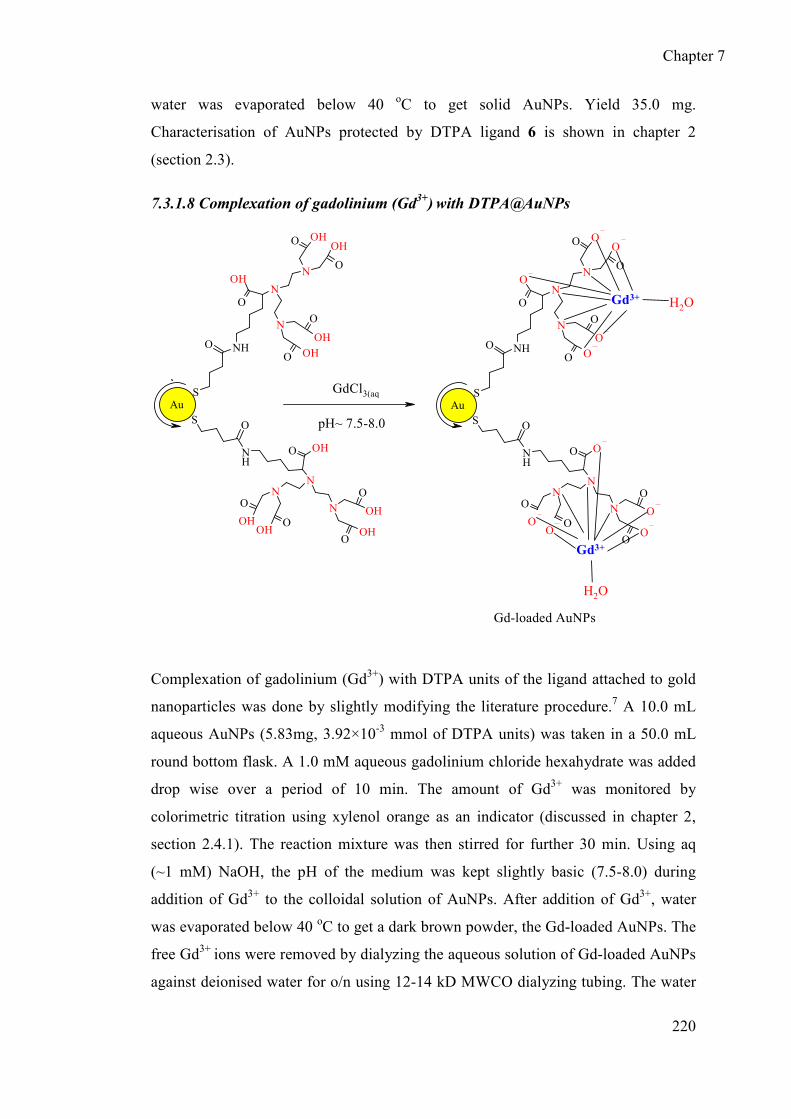
Chapter 7
220
water was evaporated below 40 oC to get solid AuNPs. Yield 35.0 mg.
Characterisation of AuNPs protected by DTPA ligand 6 is shown in chapter 2
(section 2.3).
7.3.1.8 Complexation of gadolinium (Gd3+) with DTPA@AuNPs
NH
O O
N
N
N O
O
O
OO O
S O
O
O
NH
O
ON
N
N
O O
O
O
O
O
S
OO O
NH
O OH
N
N
N O
OH
O
OOH OH
S O
O
OH
NH
O
OHN
N
N
O OH
O
O
OH
OH
S
OO OH
Au
Gd3+
Gd3+ H2O
H2O
Au
GdCl3(aq
pH~ 7.5-8.0
Gd-loaded AuNPs
Complexation of gadolinium (Gd3+) with DTPA units of the ligand attached to gold
nanoparticles was done by slightly modifying the literature procedure.7 A 10.0 mL
aqueous AuNPs (5.83mg, 3.92×10⁻³ mmol of DTPA units) was taken in a 50.0 mL
round bottom flask. A 1.0 mM aqueous gadolinium chloride hexahydrate was added
drop wise over a period of 10 min. The amount of Gd3+ was monitored by
colorimetric titration using xylenol orange as an indicator (discussed in chapter 2,
section 2.4.1). The reaction mixture was then stirred for further 30 min. Using aq
(~1 mM) NaOH, the pH of the medium was kept slightly basic (7.5-8.0) during
addition of Gd3+ to the colloidal solution of AuNPs. After addition of Gd3+, water
was evaporated below 40 oC to get a dark brown powder, the Gd-loaded AuNPs. The
free Gd3+ ions were removed by dialyzing the aqueous solution of Gd-loaded AuNPs
against deionised water for o/n using 12-14 kD MWCO dialyzing tubing. The water

Chapter 7
221
was evaporated below 40 oC using rotary evaporator to get solid Gd-loaded AuNPs.
Yield 6.12 mg. Characterisation of Gd-loaded AuNPs is given in chapter 2 (section
2.4.3).
7.3.1.9 Synthesis of Gd-DTPA complex
Gadolinium-diethylenetriaminepentaacetic acid (Gd-DTPA) complex was prepared
in an analogous procedure as described in section 7.3.1.8, from GdCl3 (45 mL, 5.0
mM) and DTPA (50 mL, 5.0 mM).Yield 0.100 g (81%).
HR ESI-MS: m/z [M - H]1-, Calcd. for C14H19GdN3O10: 547.0320, Found: 547.0336
7.3.2 Synthesis of biotin-terminated thiol (BTT)
Biotin-terminated thiol (BTT) was synthesized by a modified literature procedure.8
NHS-(PEO)4-biotin (1.17mg, 1.98×10⁻³ mmol) was taken in a 5.0 ml round bottom
flask. To this flask, 19.44 mM solution of cysteamine in DMSO (0.1 mL, 1.98×10⁻³
mmol) was added. The flask was put under vacuum on a Schlenk line, to avoid any
contact with air or moisture. Anhydrous DMSO (0.9 mL) and anhydrous DMF (1.0
mL) were then added carefully with pre-dried syringes. The reaction mixture was
stirred overnight under the blanket of nitrogen at room temperature. The unreacted
NHS-(PEO)4-biotin was removed by dialysing against deionised water using 500
MWCO dialysing membrane. Water was evaporated using rotary evaporator to get
purified BTT. Yield 1.03 mg (93 %).
HR ESI-MS: m/z [M+H] 1+ Calcd. for C24H47N4O7S2: 567.2557, Found: 567.2517
7.3.3 Attachment of biotin-terminated thiol to the AuNP surface
Biotin-terminated thiol (BTT) was attached to the AuNPs surface using a modified
literature procedure.9 Gd-loaded AuNPs (3.0 mg, 5.06×10⁻⁵ mmol) were taken in a
5.0 mL round bottom flask. To this flask, 1.58 mM solution of BTT (60.0 µL,
9.45×10⁻⁵ mmol) in DMSO/DMF (1/1) mixture was added. The reaction mixture was

Chapter 7
222
stirred for overnight at room temperature. The unreacted BTT was removed by
dialysis against deionised water for overnight using 12-14 kDa MWCO membrane,
followed by water evaporation using rotary evaporator to get solid BTT-labelled
AuNPs. Yield 2.05 mg (68 %).

Chapter 7
223
7.4 Experimental part for chapter 3
7.4.1 Vanadyl complexation with DTPA@AuNPs
Vanadyl (VO2+) was complexed with DTPA@AuNPs using a modified literature
procedure.10 The AuNPs stabilised by DTPA based ligand 6 (15.0 mg, 0.011 mmol
of DTPA units) were taken in a 25 mL round bottom flask containing deionised H2O
(5.0 mL). A 5.0 mM VOSO4 solution (0.75 mL, 3.71 × 10⁻³ mmol of VO2+) was
added drop wise to the stirred solution of AuNPs. After adding VOSO4 solution to
the AuNPs solution, the reaction mixture was stirred for further 10-15 min. Water
was evaporated using rotary evaporator at ca. 40 oC to get solid VO-DTPA@AuNPs.
Yield 11.35 mg.
NH
O O
N
N
N O
O
O
OO O
S O
O
O
NH
O
ON
N
N
O O
O
O
O
O
S
OO O
NH
O OH
N
N
N O
OH
O
OOH OH
S O
O
OH
NH
O
OHN
N
N
O OH
O
O
OH
OH
S
OO OH
Au Au
pH~ 7.5-8.0
VOSO4 (aq)
VO2+
VO2+

Chapter 7
224
7.4.2 Synthesis of VO-DTPA
Vanadyl (VO2+) chelate with DTPA was synthesised by an analogous procedure as
described in section 7.4.1 from 5.0 mM DTPA solution (5.0 mL, 0.025 mmol) and
freshly prepared 5.0 mM aq VOSO4 (4.0 mL, 0.02 mmol). Yield 7.25 mg (78 %).
7.4.3 Growth of AuNPs (~4.0 nm)
N
O
OH
NH
O
N
N
O
OO
OH
OH
OH
OH
S
R1
O
S R1
OS
R1O
S
R1
O
SR1
O
SR1
O
SR1
O
S
R1
O
DTPA based ligand 6
R1 =
AuNPs ~ 2.0 nmAuNPs ~ 4.0 nm
Au AuReflux
Excess Ligand
12h
Small (2.0 nm) AuNPs protected by DTPA ligand 6 were grown into large (~ 4.0
nm) AuNPs using a modified literature procedure.11-12 Freshly prepared crude small
AuNPs (50 mg, ~2.0 nm) dissolved in deionised H2O (25 mL) were taken in a 100.0
mL round bottom flask. To the aqueous solution of AuNPs, DMF (5.0 mL) was
added. The aqueous solution of crude AuNPs (containing excess of DTPA ligand 6)
was refluxed for ca. 12 h. After refluxing, the solution was concentrated to ~100 mL
by rotary evaporation. DMF was removed by dialysis against deionised H2O using
12-14 kDa MWCO dialysis tubing. Water was evaporated using rotary evaporator at
ca. 40 oC to get crude grown (4.0 nm) AuNPs. The crude grown (4.0 nm) AuNPs
were purified by gel permeation chromatography using Sephadex gel (G 100) as a
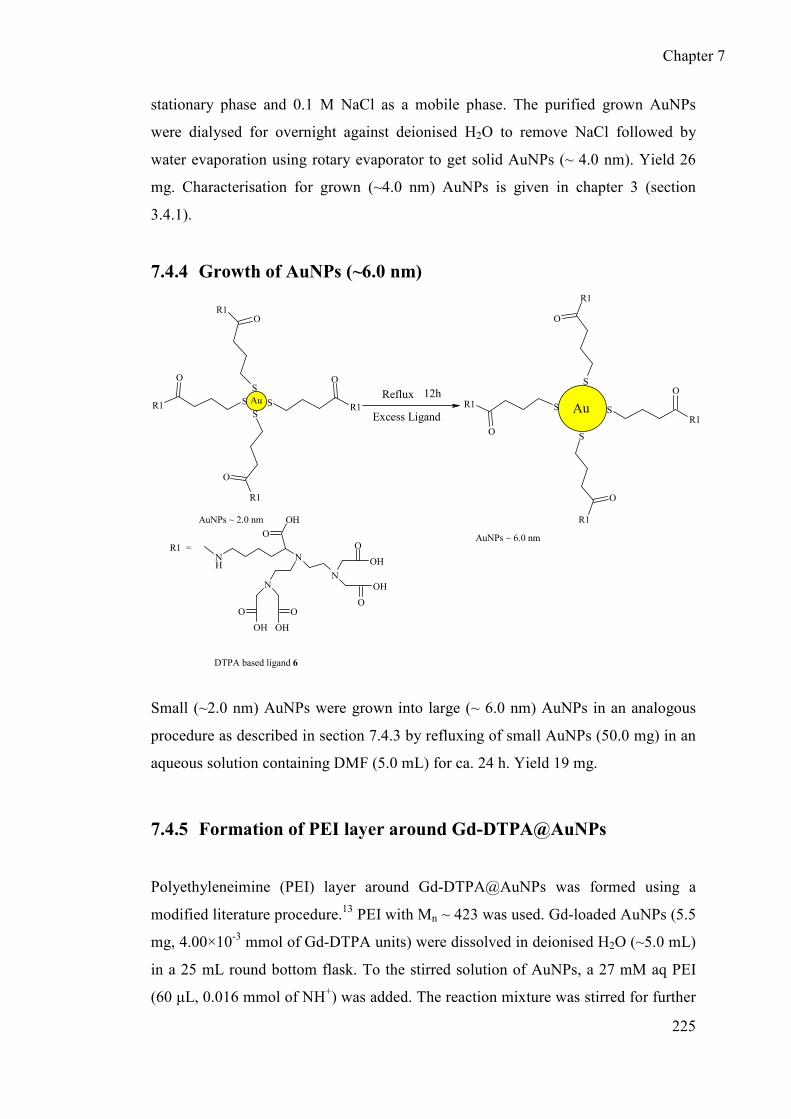
Chapter 7
225
stationary phase and 0.1 M NaCl as a mobile phase. The purified grown AuNPs
were dialysed for overnight against deionised H2O to remove NaCl followed by
water evaporation using rotary evaporator to get solid AuNPs (~ 4.0 nm). Yield 26
mg. Characterisation for grown (~4.0 nm) AuNPs is given in chapter 3 (section
3.4.1).
7.4.4 Growth of AuNPs (~6.0 nm)
N
O
OH
NH
O
N
N
O
OO
OH
OH
OH
OH
S
R1
O
S R1
OS
R1O
S
R1
O
SR1
O
SR1
O
SR1
O
S
R1
O
DTPA based ligand 6
R1 =
AuNPs ~ 2.0 nm
AuNPs ~ 6.0 nm
AuAu
Reflux
Excess Ligand
12h
Small (~2.0 nm) AuNPs were grown into large (~ 6.0 nm) AuNPs in an analogous
procedure as described in section 7.4.3 by refluxing of small AuNPs (50.0 mg) in an
aqueous solution containing DMF (5.0 mL) for ca. 24 h. Yield 19 mg.
7.4.5 Formation of PEI layer around Gd-DTPA@AuNPs
Polyethyleneimine (PEI) layer around Gd-DTPA@AuNPs was formed using a
modified literature procedure.13 PEI with Mn ~ 423 was used. Gd-loaded AuNPs (5.5
mg, 4.00×10⁻³ mmol of Gd-DTPA units) were dissolved in deionised H2O (~5.0 mL)
in a 25 mL round bottom flask. To the stirred solution of AuNPs, a 27 mM aq PEI
(60 µL, 0.016 mmol of NH+) was added. The reaction mixture was stirred for further

Chapter 7
226
10-15 min at rt. The excess of PEI molecules was removed by dialysis against
deionised H2O using 12-14 kDa dialysis tubing. Water was evaporated using rotary
evaporator below 40 oC to get solid PEI-protected AuNPs.
7.4.6 Formation of PAMAM-dendrimer layer around Gd-
DTPA@AuNPs
Poly (amidoamine) (PAMAM) layer around Gd-loaded AuNPs was formed by an
analogous procedure as described in section 7.4.5, from Gd-loaded AuNPs (5.5 mg,
4.00×10⁻³ mmol of Gd-DTPA units) and 55.0 mM aq PAMAM G0 (130.00 µL,
0.016 mmol of NH+) and 2.0 mM aq PAMAM G4 (108 µL, 0.016 mmol of NH+).
7.4.7 Layer by layer assembly of PEI (Mn~1300) and PAA
(Mn~1200)
Layer by layer (LBL) assembly of oppositely charged polyelectrolytes around
negatively charged Gd-loaded AuNPs was carried out using an analogous procedure
as described in section 7.4.5, from Gd-loaded AuNPs (10.0 mg, 6.69×10⁻³ mmol of
Gd-DTPA units), 5.0 mM aq PEI 1 with Mn ~ 1300 (180 µL, 0.026 mmol of NH+)
and 5.0 mM aq PAA 1 with Mn~1200 (235 µL, 0.026 mmol of COO- units). The
same procedure was followed to form polyelectrolyte self assembly using larger
polyelectrolytes i.e. PEI 2 (Mn~2000) and PAA 2 Mn~2100).
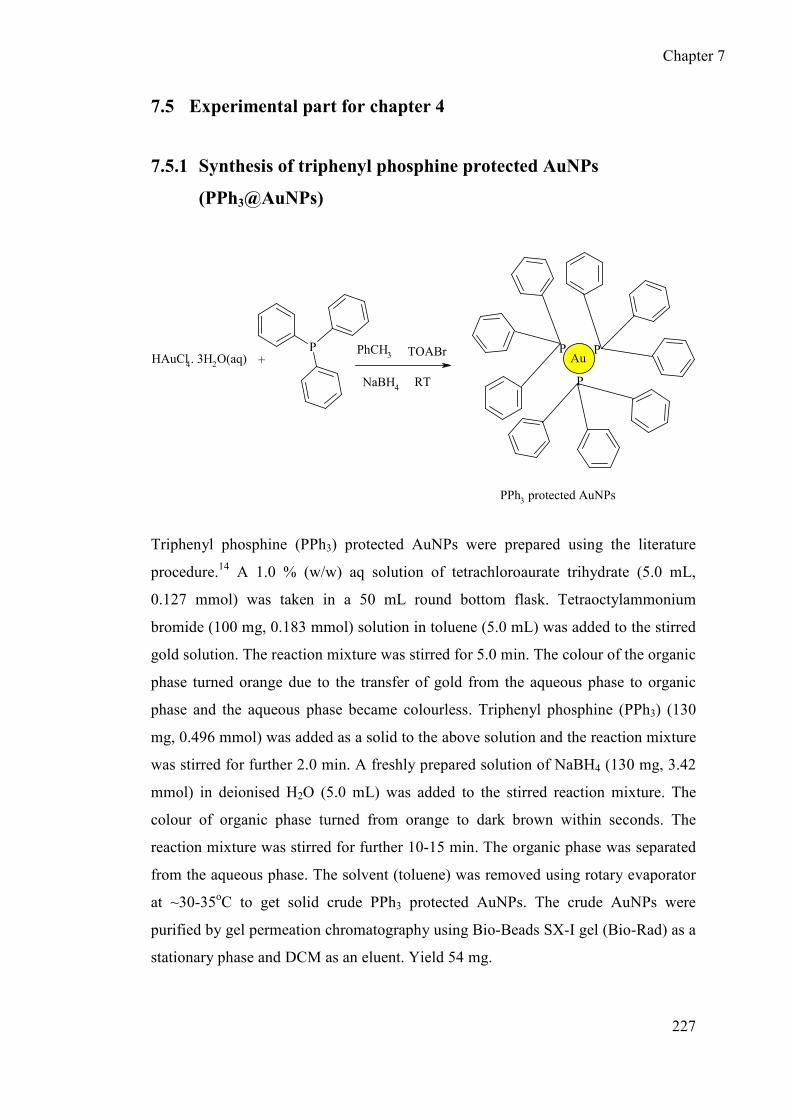
Chapter 7
227
7.5 Experimental part for chapter 4
7.5.1 Synthesis of triphenyl phosphine protected AuNPs
(PPh3@AuNPs)
P P P
P
HAuCl4. 3H2O(aq) +PhCH3
RTNaBH4
TOABr Au
PPh3 protected AuNPs
Triphenyl phosphine (PPh3) protected AuNPs were prepared using the literature
procedure.14 A 1.0 % (w/w) aq solution of tetrachloroaurate trihydrate (5.0 mL,
0.127 mmol) was taken in a 50 mL round bottom flask. Tetraoctylammonium
bromide (100 mg, 0.183 mmol) solution in toluene (5.0 mL) was added to the stirred
gold solution. The reaction mixture was stirred for 5.0 min. The colour of the organic
phase turned orange due to the transfer of gold from the aqueous phase to organic
phase and the aqueous phase became colourless. Triphenyl phosphine (PPh3) (130
mg, 0.496 mmol) was added as a solid to the above solution and the reaction mixture
was stirred for further 2.0 min. A freshly prepared solution of NaBH4 (130 mg, 3.42
mmol) in deionised H2O (5.0 mL) was added to the stirred reaction mixture. The
colour of organic phase turned from orange to dark brown within seconds. The
reaction mixture was stirred for further 10-15 min. The organic phase was separated
from the aqueous phase. The solvent (toluene) was removed using rotary evaporator
at ~30-35oC to get solid crude PPh3 protected AuNPs. The crude AuNPs were
purified by gel permeation chromatography using Bio-Beads SX-I gel (Bio-Rad) as a
stationary phase and DCM as an eluent. Yield 54 mg.

Chapter 7
228
7.5.2 Synthesis of AuNPs protected by nitroxide based ligand
SO
OH
N
O
NH
SO
NO
NH
S
O
N
O
NH
S
O
NO
NH
S
O
SO
OH
Au
Ph3P
Ph3P
Ph3P
Ph3P
DSP
Chloroform
AuPPh3
PPh3
Nitroxide Protected AuNPs
amino-TEMPO+
The gold nanoparticles protected by TEMPO based ligand were prepared using a
modified literature procedure.15 The PPh3 protected AuNPs (30.0 mg, 0.03 mmol of
PPh3) dissolved in chloroform (5.0 mL) were taken in a 25 mL round bottom flask.
The temperature of the gold solution was raised to ~50 oC. To the stirred solution,
dithiobis(succinimidylpropionate) (DSP) (124 mg, 0.31 mmol) solution in
chloroform (5.0 mL) was added and the reaction mixture was stirred for 1.0 min at
50 oC. After 1 min, 4-amino-TEMPO (210 mg, 1.22 mmol) solution in chloroform
(5.0 mL) was added. The reaction mixture was stirred at 50 oC for further 2 h. After
stirring, the chloroform was evaporated using rotary evaporator to get crude AuNPs
protected by TEMPO based ligand. The excess of free ligand molecules was
removed by gel permeation chromatography using Sephadex LH-20 as a stationary
phase and MeOH as an eluent. Yield 17.0 mg. Characterization of AuNPs protected
by TEMPO based ligand is given in chapter 4 (section 4.3.1).
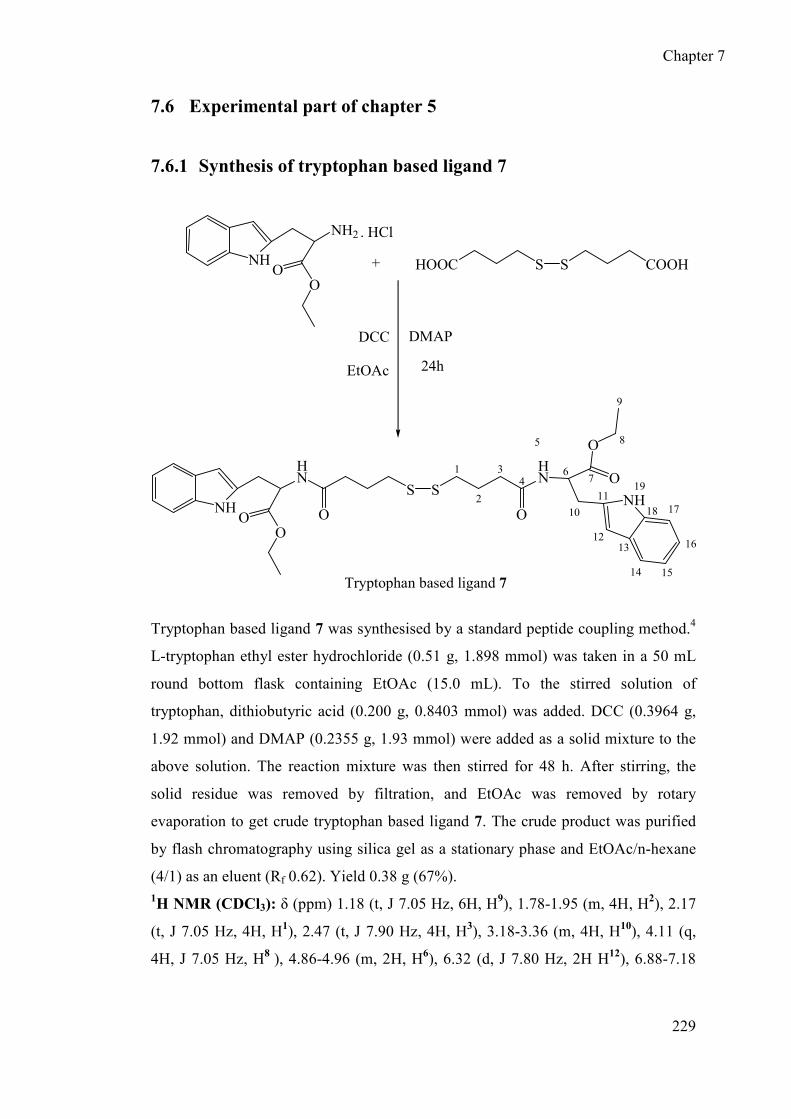
Chapter 7
229
7.6 Experimental part of chapter 5
7.6.1 Synthesis of tryptophan based ligand 7
NH
NH2
OO S S COOHHOOC
NH
HN
OO
11
13
15
16
1718
14
12
NH19
10
6HN
5
7
O 8
9
OS S
1
2
34
OO
+
DMAP
24h
Tryptophan based ligand 7
DCC
. HCl
EtOAc
Tryptophan based ligand 7 was synthesised by a standard peptide coupling method.4
L-tryptophan ethyl ester hydrochloride (0.51 g, 1.898 mmol) was taken in a 50 mL
round bottom flask containing EtOAc (15.0 mL). To the stirred solution of
tryptophan, dithiobutyric acid (0.200 g, 0.8403 mmol) was added. DCC (0.3964 g,
1.92 mmol) and DMAP (0.2355 g, 1.93 mmol) were added as a solid mixture to the
above solution. The reaction mixture was then stirred for 48 h. After stirring, the
solid residue was removed by filtration, and EtOAc was removed by rotary
evaporation to get crude tryptophan based ligand 7. The crude product was purified
by flash chromatography using silica gel as a stationary phase and EtOAc/n-hexane
(4/1) as an eluent (Rf 0.62). Yield 0.38 g (67%). 1H NMR (CDCl3): δ (ppm) 1.18 (t, J 7.05 Hz, 6H, H
9), 1.78-1.95 (m, 4H, H2), 2.17
(t, J 7.05 Hz, 4H, H1), 2.47 (t, J 7.90 Hz, 4H, H3), 3.18-3.36 (m, 4H, H10), 4.11 (q,
4H, J 7.05 Hz, H8 ), 4.86-4.96 (m, 2H, H6), 6.32 (d, J 7.80 Hz, 2H H12), 6.88-7.18

Chapter 7
230
(m, 4H, Ar-H15+16), 7.29 (d, J 7.42 Hz , 2H, Ar-H17), 7.50 (d, J 7.80 Hz , 2H, Ar-
H14), 8.95 (s+br, 2H, H5).
13C NMR (CDCl3): δ (ppm) 14.10 (C
9), 24.50 (C2), 25.20 (C3), 34.20 (C1), 52.80
(C10), 61.40 (C8), 109.60 (Ar-C), 111.60 (Ar-C), 118.30 (Ar-C), 119.20 (Ar-C),
121.90 (Ar-C), 123.10 (Ar-C), 127.60 (Ar-C), 136.10 (Ar-C), 171.90 (C4), 172.10
(C7).
HR ESI-MS: m/z [M + H] 1+, Calcd. for C34H43N4O6S2: 667.2619, Found: 667.2640
7.6.2 Synthesis of AuNPs stabilised by DTPA ligand 5
SSR1 R1
O O
NH
OO
N
NN
OO
OO
O
O
OO
NHOO
N
N
N
O
O
O
O O
O
S
O
O
O
NH
O
ON
N
N
O O
O
O
O
O
S
OO O
NH
O
O
NN
N
OO
O
O
O
O
S
O
OO
NH
O O
N
N
N O
O
O
OO
O
SO
O
O
HAuCl4.3H2O
NaBH4(aq)
DTPA based ligand 5
AuNPs stabilized by DTPA based ligand 5
R1 =
Au
AuNPs stabilised by DTPA ligand 5 were synthesised by a modified Brust’s biphasic
method.6 A 1.0 % (w/w) solution of hydrogen tetrachloroaurate trihydrate (5.0 mL,
0.127 mmol of Au) was taken in a 50 mL round bottom flask. Tetraoctylammonium
bromide (347 mg, 0.635 mmol) solution in toluene (12.0 mL) was added to the
stirred gold solution. The mixture was stirred for ca. 5.0 min until all Au (III)
precursor had transferred to the organic phase. Visually, the colour of the aqueous
phase turned from yellow to colourless, while the colour of the toluene phase became
red brown. A 10 % (w/w) solution of DTPA ligand 5 (107 mg, 0.0635 mmol) in

Chapter 7
231
toluene was then added to the reaction mixture. A freshly prepared solution of
NaBH4 (48 mg, 1.27 mmol) in deionised H2O (3.0 mL) was added 10 s after adding
the ligand. Au (III) was reduced to Au (0) within seconds; the reaction mixture was
stirred for further 10-15 min. The organic phase was separated from aqueous phase.
The organic phase (toluene) was evaporated below 40 oC using rotary evaporator to
give a dark brown residue, which was dissolved in a minimum amount of toluene
and purified by gel permeation chromatography using Bio-Beads SX-I gel (Bio-Rad)
as a stationary phase and toluene as an eluent. Yield 75 mg.
7.6.3 Ligand exchange of tryptophan based ligand 7 with AuNPs
N
NH
O
O
S
O
NH
O
O N
N
N
OO
O
O
O
O
S
OO
O
NH
OO
N
N
N
O
OO
OO
O
S
O
O
O
NH
OO
N
N
N
O
OO
OO
O
S
O
O
O
NH
O
ON
N
N
OO
O
O
O
O
S
O OO
NH
OO
N
NN
OO
O
O
S
O
OO
OO
Au
AuNPs stabilized by DTPA based ligand
Au
MeOH 30oC
TRP ligand 7
5
Tryptophan based ligand labelled AuNPs
The ligand exchange reaction with AuNPs protected by ligand 5 was carried out
using a modified literature procedure.16 AuNPs (10.0 mg, 4.73×10⁻³ mmol of DTPA
units) were taken in a 25 mL round bottom flask containing MeOH (10.0 mL). To
the stirred solution of AuNPs, a 1.0 mM solution of tryptophan ligand 7 in MeOH
(0.8 mL, 7.85 ×10⁻⁴ mmol) was added. The reaction mixture was stirred for
overnight at 30 oC. The solvent was evaporated using rotary evaporator, and the

Chapter 7
232
AuNPs labelled with tryptophan based ligand were purified by gel permeation
chromatography using Bio-Beads SX-I gel (Bio-Rad) as a stationary phase and DCM
as an eluent, followed by DCM evaporation using rotary evaporator to get solid
tryptophan ligand labelled AuNPs. Yield 7.50 mg.
7.6.4 Deprotection of t-butyl ester groups of DTPA based ligand 5
and tryptophan ligand 7 at AuNP surface
N
NH
O
O
S
O
NH
OO
N
N
N
O
OO
OO
O
S
O
O
O
NH
O
ON
N
N
O O
O
O
O
O
S
O OO
N
NH
OH
O
S
O
NH
OOH
N
N
N
O
OHO
OOH
OH
S
O
O
OH
NH
O
OHN
N
N
OOH
O
O
OH
OH
S
O OOH
Au Au
DCM / TFA : 2 / 1
o / n
Deprotection of t-butyl ester groups of DTPA ligand 5 and tryptophan ligand 7 at
AuNP surface was carried out using procedure described in section 7.3.1.6 from
AuNPs (10.0 mg) and DCM / TFA (2 mL / 1 mL, respectively) under the blanket of
N2 atmosphere. The dialysis was carried out against deionised H2O using 12-14 kDa
MWCO dialysis membrane. Yield 6.0 mg.
7.6.5 Lanthanide (Tb3+ and Eu3+) loading on AuNPs
The loading of lanthanides (Tb3+ and Eu3+) was done by an analogous procedure as
described in section 7.3.1.8 using tryptophan based ligand labelled AuNPs (10.0 mg,
5.30×10⁻³ mmol of DTPA units), a 5.0 mM TbCl3 (1.0 mL, 5.0×10⁻³ mmol) and a

Chapter 7
233
5.0 mM EuCl3 (1.0 mL, 5.0×10⁻³ mmol). Yield: Tryptophan labelled Tb-loaded
AuNPs 6.5 mg, Tryptophan labelled Eu-loaded AuNPs 7.01 mg.
7.6.6 Synthesis of Ln3+-DTPA Chelates
Lanthanide (Tb and Eu-DTPA) complexes were prepared by an analogous procedure
as described in section 7.3.1.8, from 5.0 mM aq DTPA (20.0 mL, 0.10 mmol) and
5.0 mM aq TbCl3 (18.0 mL, 0.09 mmol of Tb3+) and 5.0 mM aq EuCl3 (18.0 mL,
0.09 mmol of Eu3+) . Yield: Tb-DTPA 36.85 mg (78 %), Eu-DTPA 33.69 mg
(69.0 %).
Tb-DTPA: HR ESI-MS m/z [M - H] 1-, Calcd. for C14H19TbN3O10: 526.0329,
Found: 526.0326
Eu-DTPA: HR ESI-MS m/z [M - H] 1-, Calcd. for C14H19EuN3O10: 542.0278,
Found: 542.0302
N
O
O
N
N
O O
O
O
O
O
O
O
O
H
H
Ln3+ Tb3+ Eu3+= &
Ln3+
7.6.7 Ligand exchange of Tb-DTPA chelates@AuNPs with 3-
mercaptopropionic acid
Ligand exchange reaction was done by an analogous procedure as described in
section 7.6.3, from tryptophan labelled Tb-loaded-AuNPs (8.0 mg, 4.24×10⁻³ mmol

Chapter 7
234
of DTPA units) and a 100.00 mM aq 3-mercaptopropionic acid (4.0 mL, 0.4 mmol).
Yield 5.0 mg.
7.6.8 Treatment of tryptophan labelled Tb-loaded AuNPs with KI
and I2
The tryptophan labelled Tb-loaded AuNPs (5.0 mg) were taken in a 25 mL round
bottom flask. To this flask, a solution of iodine (40 mg) and potassium iodide (900
mg) in MeOH (20 mL) was added. The AuNPs were destroyed immediately after the
addition of iodine solution. The decomposition of the AuNPs was evident by their
colour change from dark brown to yellow.
7.6.9 Synthesis of TEMPO based ligand 8 (TEMPO based spin
label)
S
S
O
OH
O
OHN O
NO
S
S
O
O
NH
NH
N
NH2
O
DCC + DMAP
TEMPO based ligand 8
TEMPO based ligand 8 was synthesised using a standard coupling method.17 3,3-
Dithiodipropionic acid (0.105 g, 0.5 mmol) was taken in a 100 mL round bottom
flask containing 5.0 mL of THF. DCC (0.227 g, 1.0 mmol) dissolved in DCM (5.0
mL) was added to the stirred solution. Then solution of 4-amino-TEMPO (0.172 g,
1.0 mmol) in DCM (5.0 mL) was added followed by DMAP (10.0 mg, 0.08 mmol).
The reaction mixture was stirred for 72 h at room temperature. The mixture was then
filtered and washed with acidified water (2×50 mL, 40.0 mL water + 10.0 mL conc.

Chapter 7
235
HCl) and then immediately with 50 mL deionised H2O. The organic phase was dried
over anhydrous Na2SO4 and combined aqueous phases were extracted with DCM
(3×10 mL). Solvent was removed and the product was purified by flash
chromatography using silica gel as a stationary phase and DCM / MeOH (12 / 1) as
eluent (Rf 0.42). Yield 130 mg (50 %).
HR ESI-MS: m/z [M + H] 1+, Calcd. for C24H45N4O4S2: 517.2877, Found: 517.2861

Chapter 7
236
7.6.10 Labelling of AuNPs by TEMPO based spin label 8
NH
O
ON
N
N
O O
O
O
O
O
S
OO O
NH
O O
N
N
N O
O
O
OO
O
SO
O
O
NH
O
ON
N
N
O O
O
O
O
O
S
OO O
NH O O
N
N
N
O
O
O
OO
O
S
O
O
O
N O
S NH
O
Au Au
DMF
60 C, o / n
AuNPs protected by DTPA ligand 5 AuNPs labelled with TEMPO based spin label 8
The labelling of AuNPs protected by ligand 5 was done by ligand exchange method
as described in section 7.6.3 from AuNPs (50.0 mg, 0.027 mmol of DTPA ligand
molecules) and a 1.0 mM solution of spin label ligand 8 in DMF (4.5 mL, 4.43×10⁻³
mmol).Yield 34 mg.

Chapter 7
237
7.6.11 Deprotection of t-butyl ester groups of DTPA ligand 5 at
AuNP surface
NH
O
ON
N
N
O O
O
O
O
O
S
OO O
NH O O
N
N
N
O
O
O
OO
O
S
O
O
O
N O
S NH
O
NH
O
OHN
N
N
O OH
O
O
OH
OH
S
OO OH
NH O OH
N
N
N
O
OH
O
OOH
OH
S
O
O
OH
N O
S NH
O
Au Au DCM / TFA
N2
The AuNPs labelled with TEMPO based ligand 8 (10.0 mg) dissolved in DCM (2.0
mL) were taken in a 25 mL round bottom flask. The flask was closed with a septum
(suba seal) and put under inert atmosphere. Under an inert atmosphere, TFA (1.0
mL) was syringed in. The reaction mixture was stirred for 4 h under the blanket of
N2 atmosphere. After stirring, DCM/TFA was evaporated at room temperature using
rotary evaporator and the residual TFA was immediately quenched with 0.1 M
NaOH. Deprotected spin labelled AuNPs were dialysed against deionised H2O for
overnight and then purified by gel permeation chromatography using Sephadex gel
(G 100) as a stationary phase and deionised H2O as an eluent. Yield 6.5 mg.
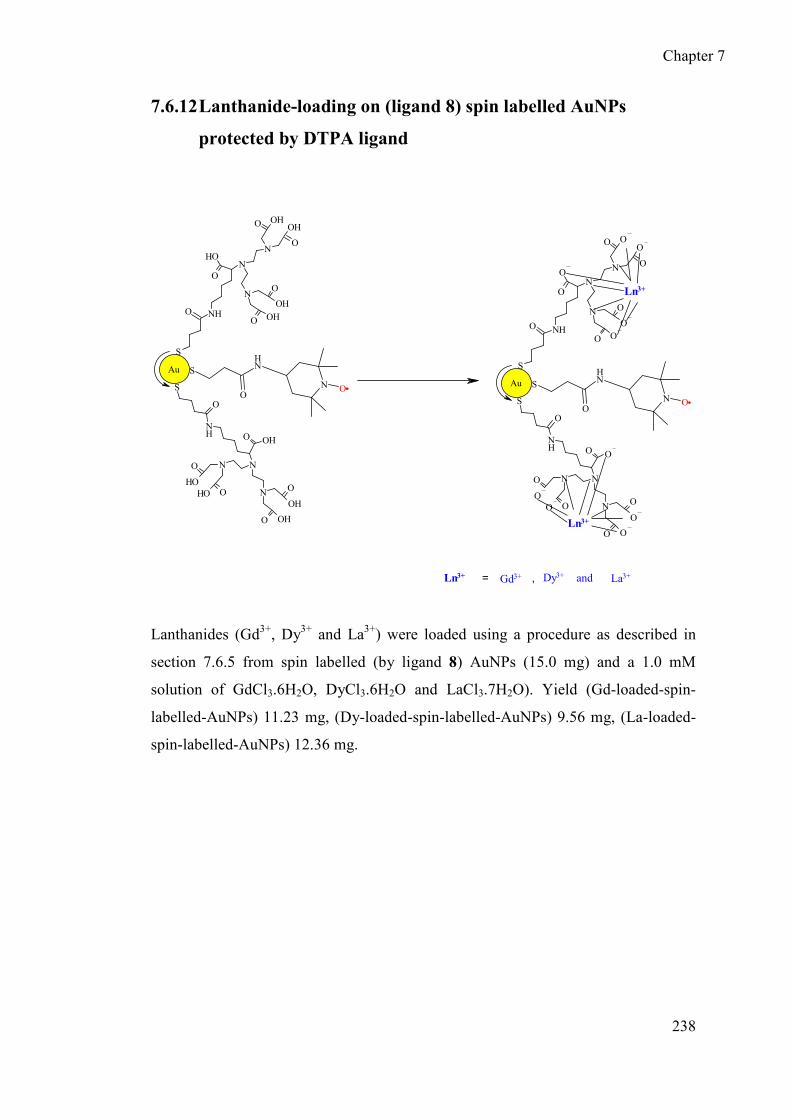
Chapter 7
238
7.6.12 Lanthanide-loading on (ligand 8) spin labelled AuNPs
protected by DTPA ligand
NH
O
OHN
N
N
O OH
O
O
OH
OH
S
OO OH
NH O OH
N
N
N
O
OH
O
OOH
OH
S
O
O
OH
N O
S NH
O
NH O O
N
N
N
O
O
O
OO
O
S
O
O
O
N O
S NH
O
NH
O
ON
N
N
O O
O
O
O
O
S
OO O
Au
Au
Gd3+Ln3+ Dy3+ La3+= and,
Ln3+
Ln3+
Lanthanides (Gd3+, Dy3+ and La3+) were loaded using a procedure as described in
section 7.6.5 from spin labelled (by ligand 8) AuNPs (15.0 mg) and a 1.0 mM
solution of GdCl3.6H2O, DyCl3.6H2O and LaCl3.7H2O). Yield (Gd-loaded-spin-
labelled-AuNPs) 11.23 mg, (Dy-loaded-spin-labelled-AuNPs) 9.56 mg, (La-loaded-
spin-labelled-AuNPs) 12.36 mg.

Chapter 7
239
7.7 References
1. V. Chechik and R. M. Crooks, Langmuir, 1999, 15, 6364-6369.
2. M. A. Williams and H. Rapoport, J. Org. Chem., 1993, 58, 1151-1158.
3. P. L. Anelli, F. Fedeli, O. Gazzotti, L. Lattuada, G. Lux and F. Rebasti,
Bioconjugate Chem., 1999, 10, 137-140.
4. D. C. Johnson Ii and T. S. Widlanski, Tetrahed. Lett., 2001, 42, 3677-3679.
5. S. Langereis, Q. G. de Lussanet, M. H. P. van Genderen, W. H. Backes and
E. W. Meijer, Macromolecules, 2004, 37, 3084-3091.
6. M. Brust, M. Walker, D. Bethell, D. J. Schiffrin and R. Whyman, J. Chem.
Soc.-Chem. Commun., 1994, 801-802.
7. P. J. Debouttiere, S. Roux, F. Vocanson, C. Billotey, O. Beuf, A. Favre-
Reguillon, Y. Lin, S. Pellet-Rostaing, R. Lamartine, P. Perriat and O.
Tillement, Adv. Funct. Mater., 2006, 16, 2330-2339.
8. M. Chen, L. Guo, R. Ravi and P. C. Searson, J. Phys. Chem. B, 2005, 110,
211-217.
9. A. K. Salem, M. Chen, J. Hayden, K. W. Leong and P. C. Searson, Nano
Lett., 2004, 4, 1163-1165.
10. E. C. Wiener, F. P. Auteri, J. W. Chen, M. W. Brechbiel, O. A. Gansow, D.
S. Schneider, R. L. Belford, R. B. Clarkson and P. C. Lauterbur, J. Am.
Chem. Soc., 1996, 118, 7774-7782.
11. M. M. Maye, W. Zheng, F. L. Leibowitz, N. K. Ly and C.-J. Zhong,
Langmuir, 1999, 16, 490-497.
12. T. Teranishi, S. Hasegawa, T. Shimizu and M. Miyake, Adv. Mater., 2001,
13, 1699-1701.

Chapter 7
240
13. W. Tong, C. Gao and H. Möhwald, Polym. Adv. Technol., 2008, 19, 817-823.
14. M. Conte, H. Miyamura, S. Kobayashi and V. Chechik, J. Am. Chem. Soc.,
2009, 131, 7189-7196.
15. S. Durocher, A. Rezaee, C. Hamm, C. Rangan, S. Mittler and B. Mutus, J.
Am. Chem. Soc., 2009, 131, 2475-2477.
16. P. Ionita, A. Caragheorgheopol, B. C. Gilbert and V. Chechik, Langmuir,
2004, 20, 11536-11544.
17. P. Ionita, J. Wolowska, V. Chechik and A. Caragheorgheopol, J. Phys. Chem.
C, 2007, 111, 16717-16723.