supporting information - royal society of chemistry · 1 supporting information dual-directional...
TRANSCRIPT

1
Supporting Information
Dual-Directional Alkyne-Terminated Macrocycles: In Route to Non-Aggregating
Molecular Platforms
Ali Husain, *[a]
Asaithampi Ganesan, [a]
Basma Ghazal, [a]
Mahmut Durmus,[b]
Xian-Fu Zhang,[c]
and Saad Makhseed*[a]
[a]Department of Chemistry, Kuwait University, P.O. Box 5969, Safat, 13060, Kuwait.
[b]Gebze Technical University, Department of Chemistry, 41400 Gebze-Kocaeli, Turkey.
[c]MPC Technologies, Hamilton, Ontario, Canada L8S 3H4.
* Corresponding authors email: [email protected]
Electronic Supplementary Material (ESI) for Organic Chemistry Frontiers.This journal is © the Partner Organisations 2019

2
Table of Contents Experimental section .................................................................................................. 3
NMR spectra .............................................................................................................................. 3
Mass spectra............................................................................................................................. 14
MALDI-TOF-MS. ....................................................................................................................... 14
ESI-MS Spectra. .......................................................................................................................... 16
Result and discussion ...............................................................................................24
Photophysical characterization .............................................................................................. 24
Ground state electronic absorption spectra of Pc1/AzaPc1 .................................................... 24
Aggregation studies ..................................................................................................................... 25
Fluorescence measurements ....................................................................................................... 27
Fluorescence quantum yields and lifetimes .............................................................................. 29
Singlet oxygen quantum yields .................................................................................................. 30
Photodegradation quantum yields ............................................................................................ 31
Excited triplet state ..................................................................................................................... 32
Single crystal X-ray diffraction studies of propargyl functionalized phthalocyanine
analogues and their precursors .............................................................................................. 35
Experimental ............................................................................................................................... 35
Discussion..................................................................................................................................... 35
References ................................................................................................................49

3
Experimental section
NMR spectra
Figure S1.1H-NMR spectrum of compound 1 in CDCl3 at 25 ℃.
Figure S2.13
C-NMR spectrum of compound 1 in CDCl3 at 25 ℃.

4
Figure S3.1H-NMR spectrum of compound 2 in DMSO-d6 at 25 ℃.
Figure S4.13
C-NMR spectrum of compound 2 in DMSO-d6 at 25 ℃.

5
Figure S5.1H-NMR spectrum of compound 3 in DMSO-d6 at 25 ℃.
Figure S6.13
C-NMR spectrum of compound 3 in DMSO-d6 at 25 ℃.
6
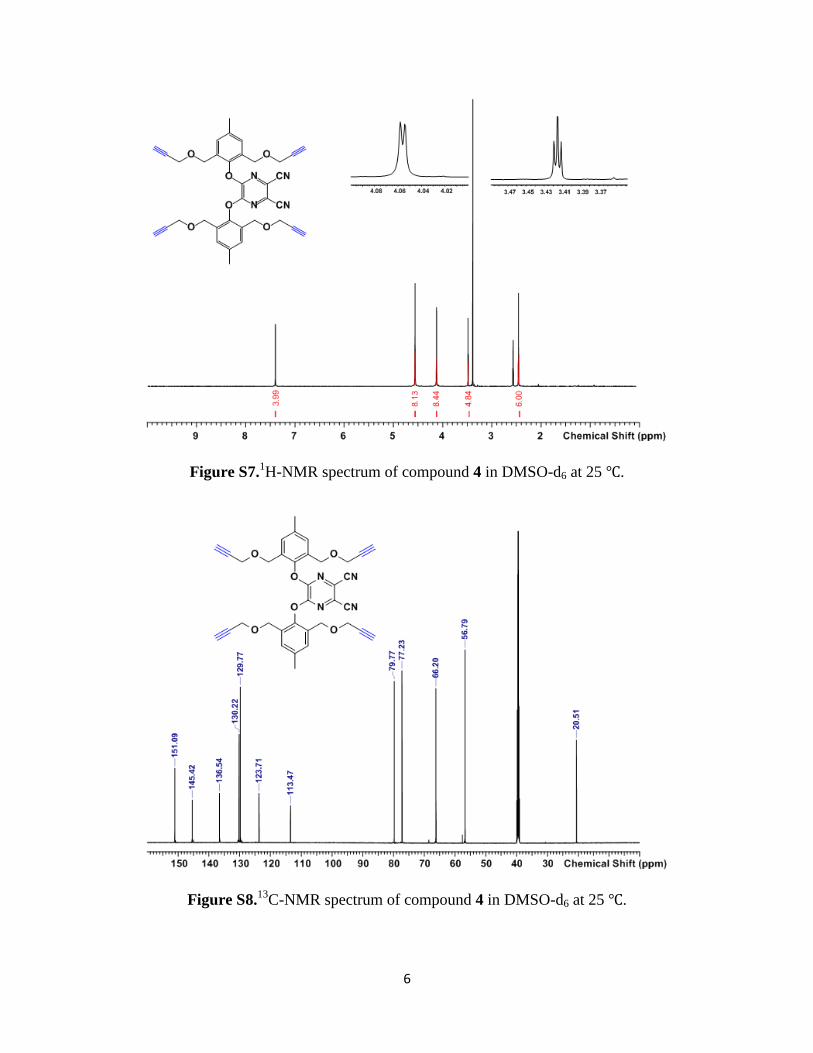
Figure S7.1H-NMR spectrum of compound 4 in DMSO-d6 at 25 ℃.
Figure S8.13
C-NMR spectrum of compound 4 in DMSO-d6 at 25 ℃.

7
Figure S9.1H-NMR spectrum of Pc1 in DMSO-d6 at 25 ℃.
Figure S10.13
C-NMR spectrum of Pc1 in DMSO-d6 at 25 ℃.

8
Figure S11.1H-NMR spectrum of AzaPc1 in DMSO-d6 at 75 ℃.
Figure S12.13
C-NMR spectrum of AzaPc1 in DMSO-d6 at 25 ℃.

9
Figure S13.1H-NMR spectrum of Pc2 in DMSO-d6 at 25 ℃.
Figure S14.13
C-NMR spectrum of Pc2 in DMSO-d6 at 25 ℃.

10
Figure S15.1H-NMR spectrum of AzaPc2 in DMSO-d6 at 25 ℃.
Figure S16.13
C-NMR spectrum of AzaPc2 in DMSO-d6 at 25 ℃.

11
Figure S17. 1H NMR spectrum of Pc1 (A) and AzaPc1 (B) in DMSO-d6 at three different
concentrations (13.5, 2.69 and 1.35 mM).

12
Figure S18. 1H NMR spectra of Pc1 (A) and AzaPc1 (B) in DMSO-d6, measured at variable
concentration ranging from 13.5 mM to 1.3 mM.

13
Figure S19. 1H NMR spectra of Pc1 (A) and AzaPc1 (B) measured at variable temperature (25-
95 ºC) in DMSO-d6.
14
Mass spectra
MALDI-TOF-MS.
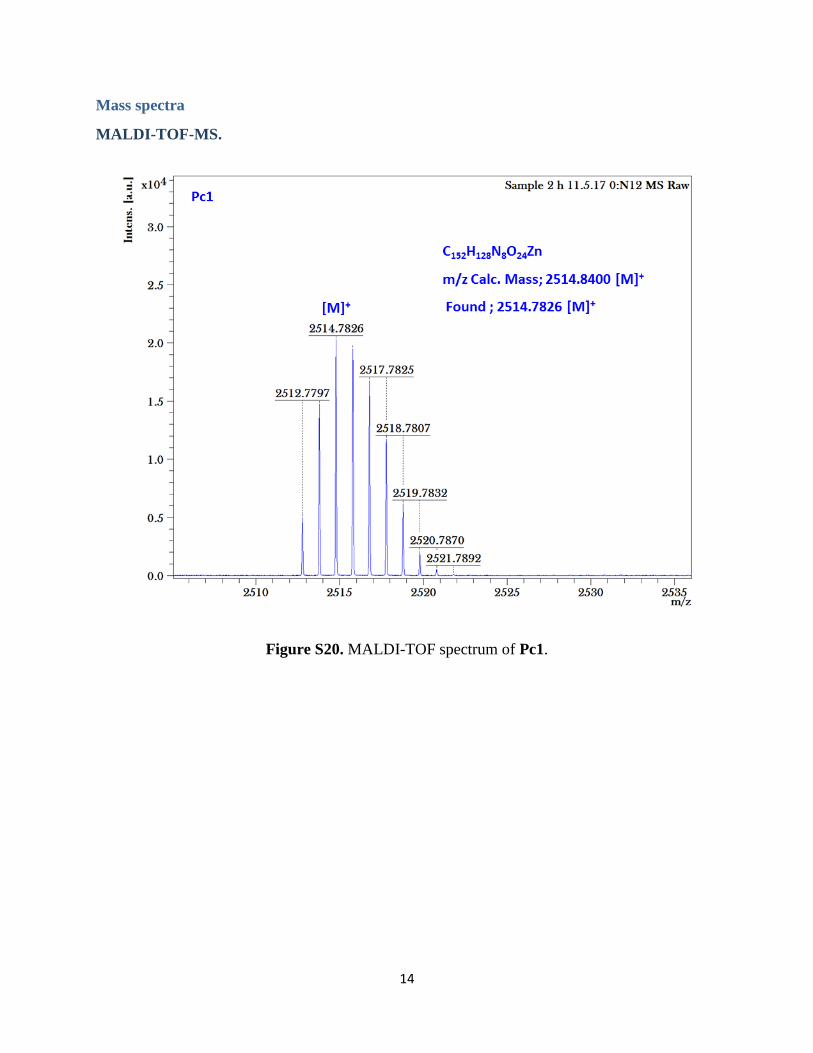
Figure S20. MALDI-TOF spectrum of Pc1.

15
Figure S21. MALDI-TOF spectrum of AzaPc1.

16
ESI-MS Spectra.
Figure S22. ESI-MS-QTOF spectrum of compound 1.
17
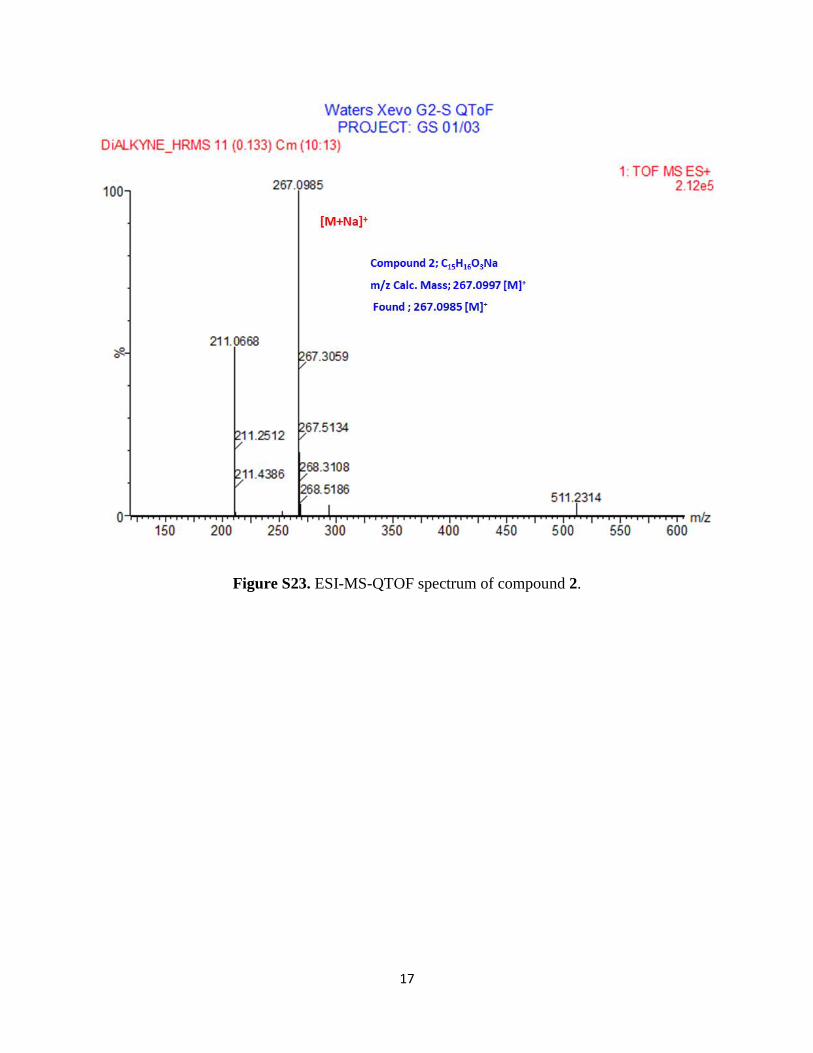
Figure S23. ESI-MS-QTOF spectrum of compound 2.

18
Figure S24. ESI-MS-QTOF spectrum of compound 3.

19
Figure S25. ESI-MS-QTOF spectrum of compound 4.

20
Figure S26. ESI-MS-QTOF spectrum of Pc2.

21
Figure S27. Deconvoluted HRMS (ESI) spectrum of Pc2.

22
Figure S28. ESI-MS-QTOF spectrum of AzaPc2.

23
Figure S29. Deconvoluted HRMS (ESI) spectrum of AzaPc2.
24
Result and discussion
Photophysical characterization
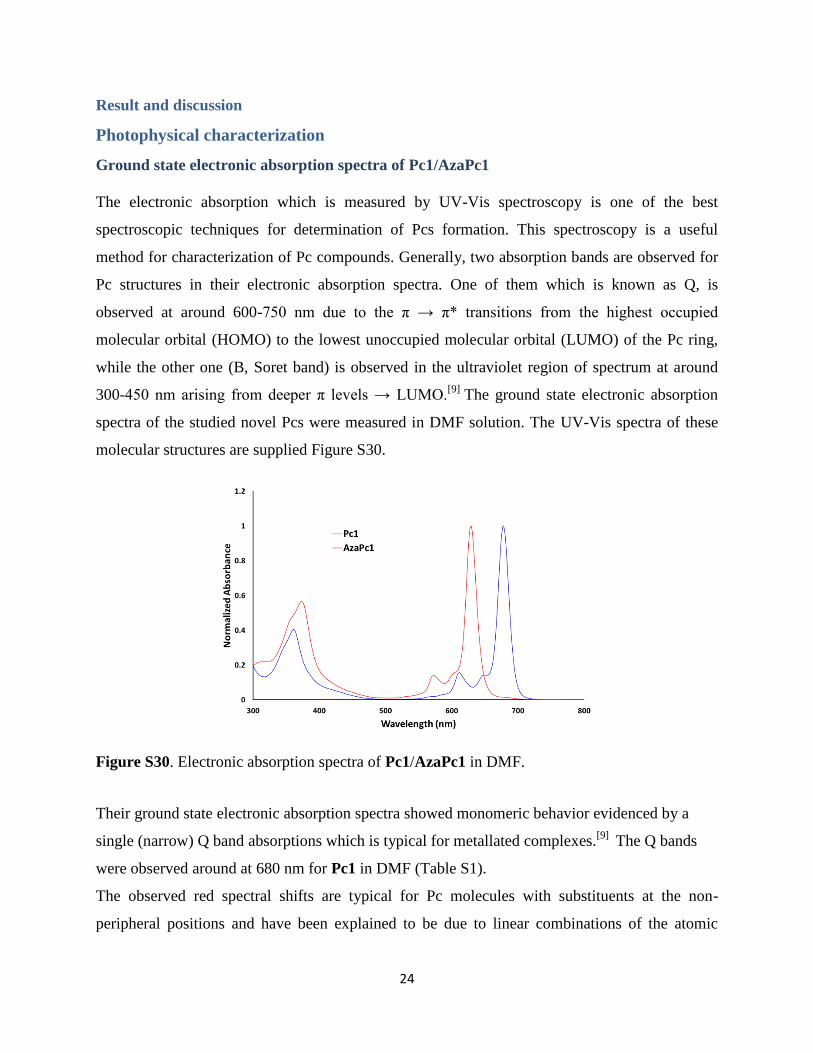
Ground state electronic absorption spectra of Pc1/AzaPc1
The electronic absorption which is measured by UV-Vis spectroscopy is one of the best
spectroscopic techniques for determination of Pcs formation. This spectroscopy is a useful
method for characterization of Pc compounds. Generally, two absorption bands are observed for
Pc structures in their electronic absorption spectra. One of them which is known as Q, is
observed at around 600-750 nm due to the π → π* transitions from the highest occupied
molecular orbital (HOMO) to the lowest unoccupied molecular orbital (LUMO) of the Pc ring,
while the other one (B, Soret band) is observed in the ultraviolet region of spectrum at around
300-450 nm arising from deeper π levels → LUMO.[9]
The ground state electronic absorption
spectra of the studied novel Pcs were measured in DMF solution. The UV-Vis spectra of these
molecular structures are supplied Figure S30.
Figure S30. Electronic absorption spectra of Pc1/AzaPc1 in DMF.
Their ground state electronic absorption spectra showed monomeric behavior evidenced by a
single (narrow) Q band absorptions which is typical for metallated complexes.[9]
The Q bands
were observed around at 680 nm for Pc1 in DMF (Table S1).
The observed red spectral shifts are typical for Pc molecules with substituents at the non-
peripheral positions and have been explained to be due to linear combinations of the atomic

25
orbitals (LCAO) coefficients at the non-peripheral positions of the HOMO being greater than
those at the peripheral positions.[10]
As a result, the HOMO level is destabilized more at the non-
peripheral site than it is at the peripheral one. Essentially, the energy gap (ΔE) between the
HOMO and LUMO becomes smaller, resulting in a bathochromic shift. The 49 nm blue shift for
AzaPc1 is caused by the additional nitrogen atoms instead of CH groups in the Pc macrocyclic
system. The B-bands are broad due to the superimposition of the B1 and B2 bands in the 340 to
380 nm region.
Aggregation studies
Macrocycle Pcs generate high aggregation tendencies due to the intermolecular interactions that
take place between their 18 π-electrons. Accordingly, this self-association process would
minimize their solubility in most solvent systems and therefore affects their spectroscopic,
photophysical, photochemical and electrochemical properties. Generally, aggregation is highly
dependent on the concentration, temperature, nature of the substituents and/or their position and
orientation with respect to the Pc skeleton, nature of the solvent media and the central metal ion
in the Pc-cores.[11]
Pc molecules can form two types of aggregates in dissolved system, i.e.; the
H-type and J-type, depending on the nature, position and/or orientation of the substituents. In
general, Pcs form H-type aggregates in solution, whereas the J-type aggregation was observed
rarely for these assemblies. The formation of J-type aggregates among the Pc structures is
significant since this type of aggregates is photoactive, while the H-type aggregates is not
appear.The aggregation properties for all Pc1/AzaPc1 were recorded in different organic
solvents, namely; DCM, chloroform, DMF, DMSO, ethanol, methanol, THF and toluene.
Interestingly, no aggregation for these assemblies was observed in all organic solvents used
(Figure S31).
Aggregation behaviors for Pc1/AzaPc1 were also investigated in DMF at different concentration
in order to establish a suitable concentration for further photophysical and photochemical
studies. The Beer-Lambert law was obeyed at concentrations ranging from 1.0 x 10⁻⁵
to 1.0 x 10-
6 M. Both these cyclic derivatives did not show any aggregation within this concentration range
(Figure S32).

26
Figure S31. Electronic absorption spectra of Pc1/AzaPc1 in different solvents.
Figure S32. Aggregation behavior of Pc1 (a), AzaPc1 (b), Pc2 (c) and AzaPc2 (d) in DMF at
different concentrations ranging from 1 to 9 µM; (Insets: Plot of absorbance versus concentration
and other plot is dependence of the extinction coefficient at λmax for Pc1, AzaPc1, Pc2 and AzaPc2.

27
Fluorescence measurements
The fluorescence behaviors of Pc1, AzaPc1, Pc2 and AzaPc2 were evaluated in DMF solutions.
Figure S33 shows absorption, fluorescence emission and excitation spectra of these complexes.
The resulted studies in DMF showed similar fluorescence behavior in DMF in which the
excitation spectra were similar to the absorption spectra and both were mirror images of the
fluorescence emission spectra for all studied complexes. The proximity of the wavelength of
each component of the Q-band absorption to the Q band maxima of the excitation spectra for
both zinc (II) complexes suggested that the nuclear configurations of the ground and excited
states are similar and not affected by excitation.
Figure S33. Absorption, excitation and emission spectra of Pc1 (a), AzaPc1 (b), Pc2 (c) and
AzaPc2 (d) in DMF. Excitation wavelength = 678 nm for Pc1, 681 nm for Pc2, 629 nm for
AzaPc1 and 631 nm for AzaPc2

28
The excitation wavelengths were observed at 678 nm for Pc1, 681 nm for Pc2, 629 nm for
AzaPc1 and 631 nm for AzaPc2 in DMF. The emission maxima were observed at around 683
for Pc1 and Pc2 and around 630 nm for AzaPc1 and AzaPc2. The observed Stokes’ shifts which
are differences between the excitation and emission wavelength maxima were found between 4
and 10 nm for zinc (II) complexes (Table S1). The observed Stokes’ shifts were found within the
region observed for typical zinc(II) phthalocyanine complexes.[12]
By following the same
procedure used for Pc1/AzaPc1 complexes, the fluorescence emission and excitation spectra of
the forming Pc2 and AzaPc2 complexes were depicted in Figure S33C and S33D, respectively.
The spectral features in terms of small Stock’s shift and the maintained mirror symmetry
between the emission and excitation peaks were achieved.

29
Fluorescence quantum yields and lifetimes
Fluorescence emission occurs when an orbital electron of a photosensitizer relaxes from its
singlet state to ground state upon emitting a photon of light. The fluorescence quantum yield
(F) gives the efficiency of the fluorescence process and this value is defined as the ratio of the
number of photons emitted to the number of photons absorbed. The fluorescence quantum yields
(F) were determined using established method described in literature.[4]
The F values of
Pc1/AzaPc1 were typical for those phthalocyanine compounds (Table S1). These values were
found as 0.16 for Pc1and 0.14 for AzaPc1 in DMF solvent system. However, the F values were
determined to be 0.1 for both Pc2 and AzaPc2 complexes which were found to be slightly lower
than their corresponding building blocks, Pc1 and AzaPc1.
Further, fluorescence lifetime (τF) refers to the average time for a molecule stays in its excited
state before returns to its ground state by emitting.[13]
In this study, the fluorescence lifetime
values of studied Pc1/AzaPc1 were determined by using time correlated single photon counting
(TCSPC) method. All time-resolved fluorescence studies were carried out in DMF and the
fluorescence decays of the macrocycles were concluded in mono exponential curves (Figure
S34). The fluorescence lifetime values were found as 3.30 ns for Pc1, 2.90 ns for Pc2, 2.46 ns
for AzaPc1 and 2.45 ns for AzaPc2 (Table S1).
Figure S34. Time correlated single photon counting (TCSPC) fluorescence decay curve of
Pc1/AzaPc1 in DMF.

30
Singlet oxygen quantum yields
Transferring of energy from the triplet state of a photosensitizer such as Pc to ground state
molecular oxygen leads to the production of singlet oxygen. There is a necessity of high
efficiency of energy transfer between the excited triplet state of photosensitizer and the ground
state of oxygen in order to generate large amounts of singlet oxygen, essential for PDT
applications. The singlet oxygen quantum yield () values give the amount of the generated
singlet oxygen. This value is an indication of the potential provided by the compounds as
photosensitizers in applications where singlet oxygen is required. The values for Pc1/AzaPc1
were determined in DMF by a chemical method using 1,3-diphenylisobenzofuran (DPBF) as a
quencher. The disappearance of DPBF at 414 nm was monitored using UV-Vis
spectrophotometer. Many factors can be responsible for the magnitude of the determined singlet
oxygen quantum yield including such as triplet excited state energy, ability of substituents and
solvents to quench the singlet oxygen, the triplet excited state lifetime and the efficiency of the
energy transfer between the triplet excited state and the ground state of oxygen. Any changing
did not observe in the Q band intensities of all cyclic complexes suggesting that all Pc1/AzaPc1
did not show any decomposition during singlet oxygen studies (Figure S35). Both macrocyclic
derivatives showed similar singlet oxygen generation with around 0.6. Both cyclic structures
are suggested suitable candidates as photosensitizers for cancer treatment by photodynamic
therapy method due to their high singlet oxygen production abilities.
Figure S35. Absorbance changes during the determination of singlet oxygen quantum yield of
Pc1/AzaPc1 in DMF. (Inset: Plot of DPBF absorbances versus irradiation time).

31
Photodegradation quantum yields
Photodegradation is used to specify the stability of compounds which is useful for determination
of the photosensitizing ability of the compounds as PDT agents. The stability of photosensitizers
under light irradiation is important for photochemical processes such as PDT because
photosensitizers need to survive for a specific period in the body. Photodegradation degree can
be detected by photodegradation quantum yield (d) and it depends on the structure, light
intensity, used solvent and the concentration.[4]
Photodegradation of the compounds under light
irradiation can be used to study their stability which is important for those molecules intended
for the application in photocatalytic reactions. The collapse of the absorption spectra without any
distortion of the shape confirms photodegradation not associated with phototransformation into
different forms of Pcs absorbing light in the visible region. The spectral changes for all
macrocyclic derivatives during light irradiation are confirmed photodegradation occurred
without photo transformation because only Q and B bands were decreased, and no new band
formation was observed (Figure S36). Pc and their macrocyclic analogs generate singlet oxygen
when they are illuminated by an appropriate light. The formed singlet oxygen is partially
degraded by the Pc/Pc-analogs via photooxidation reactions. Generally, photodegradation of the
Pcs/Pc-analogy compounds by light irradiation results in formation of the phthalamide residue.
The photodegradation behavior of Pc1 and AzaPc1 were determined in DMF. The d values of
these novel systems were found the order of 10−4
(Table S1) and these values are similar with
those Pcs containing different metals and substituents.[13]
Figure S36. Absorbance changes during the photodegradation study of Pc1/AzaPc1 in DMF
showing the decreasing of the absorption bands at 60 sec intervals (Inset: Plot of Q band
absorbance versus irradiation time).

32
Excited triplet state
The triplet-state life time (T), the quantum yield (ՓT) and the molar absorption coefficient (ΔεT-
T) were calculated for both of the studied complexes (Table S2). The T values were calculated to
be 1231 µs for Pc1 and 400 µs for AzaPc1, which are longer than the lifetimes previously
reported for standard ZnPc, and these values are long enough to allow the production of singlet
oxygen. This very long triplet lifetime could be attributed to the obstruction of solvent collision
by the multiple bulky phenoxyl units on the periphery. These large substituents in Pc1 result in
higher structural rigidity and thus offer more protection, which makes the T of Pc1 larger. On
the other hand, in air-saturated solutions, the measured τT values for both complexes decreased
dramatically to 1.2µs for Pc1 and to 1.9µs for AzaPc1compared to 0.30 s of ZnPc, and their
TAS spectra did not change noticeably, i.e., the shape and spectral position remained constant,
confirming the effective quenching of molecular oxygen by a physical process (T1 + O2 → S0 +
1O2), and consequently, the positive absorptions can confidently be attributed to T1-Tn triplet
absorptions (Figure S37). The formation of the triplet species (ՓT) by each of the two complexes
was evaluated, and they were found to be very close to their ՓΔ, values, as shown in Table S2,
suggesting an effective interaction between their triplet states and the molecular oxygen present
in the system, resulting in a high quantum yield of singlet oxygen (% of ՓΔ/ՓT ≈ 96 for Pc1 and
98 for AzaPc1). However, the total yields of both florescence and the triplet state of the two
macrocycles are comparable and are less than one, indicating the presence of internal conversion
(ՓIC = 1 - ՓF - ՓT). The LFP confirms the formation of T with a very high quantum yield and a
long life time from the studied complexes, which make them an important class of compounds
for many applications.

33
Figure S37. Left: time resolved T1-Tn transient absorption spectra of 20 µM compound Pc1(top)
and AzaPc1 (bottom) in nitrogen saturated DMF with OPO laser excitation (4 ns, 5 mJ) at686
and 637 nm, respectively. Right: The decay of T1 state and the concomitant rise of ground state
for 20 µM compound Pc1(top) and AzaPc1 (bottom)in nitrogen saturated DMF with OPO laser
excitation (4 ns, 5 mJ).
34
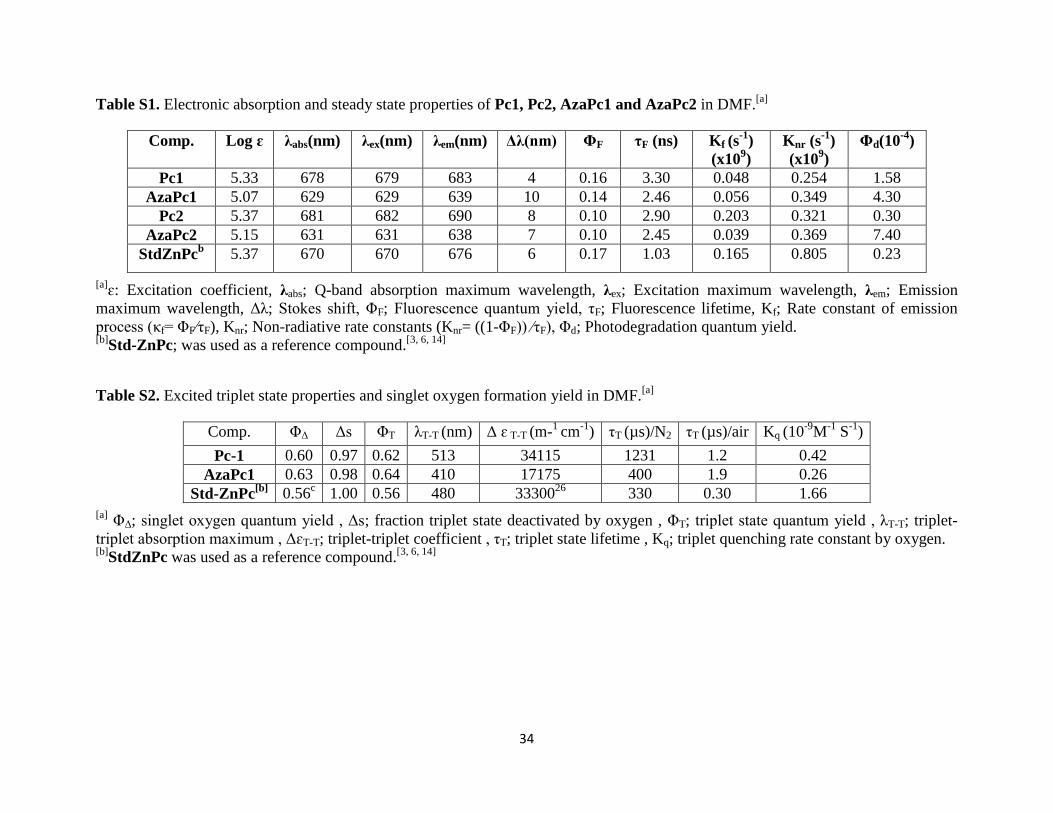
Table S1. Electronic absorption and steady state properties of Pc1, Pc2, AzaPc1 and AzaPc2 in DMF.[a]
Comp. Log ɛ λabs(nm) λex(nm) λem(nm) Δλ(nm) ΦF τF (ns) Kf (s-1
)
(x109)
Knr (s-1
)
(x109)
Φd(10-4
)
Pc1 5.33 678 679 683 4 0.16 3.30 0.048 0.254 1.58
AzaPc1 5.07 629 629 639 10 0.14 2.46 0.056 0.349 4.30
Pc2 5.37 681 682 690 8 0.10 2.90 0.203 0.321 0.30
AzaPc2 5.15 631 631 638 7 0.10 2.45 0.039 0.369 7.40
StdZnPcb 5.37 670 670 676 6 0.17 1.03 0.165 0.805 0.23
[a]ɛ: Excitation coefficient, λabs; Q-band absorption maximum wavelength, λex; Excitation maximum wavelength, λem; Emission
maximum wavelength, Δλ; Stokes shift, ΦF; Fluorescence quantum yield, τF; Fluorescence lifetime, Kf; Rate constant of emission
process (κf= ΦF⁄τF), Knr; Non-radiative rate constants (Knr= ((1-ΦF)) ⁄τF), Φd; Photodegradation quantum yield. [b]
Std-ZnPc; was used as a reference compound.[3, 6, 14]
Table S2. Excited triplet state properties and singlet oxygen formation yield in DMF.[a]
Comp. ΦΔ Δs ΦT λT-T (nm) Δ ɛ T-T (m-1
cm-1
) τT (µs)/N2 τT (µs)/air Kq (10-9
M-1
S-1
)
Pc-1 0.60 0.97 0.62 513 34115 1231 1.2 0.42
AzaPc1 0.63 0.98 0.64 410 17175 400 1.9 0.26
Std-ZnPc[b]
0.56c 1.00 0.56 480 33300
26 330 0.30 1.66
[a] ΦΔ; singlet oxygen quantum yield , Δs; fraction triplet state deactivated by oxygen , ΦT; triplet state quantum yield , λT-T; triplet-
triplet absorption maximum , ΔɛT-T; triplet-triplet coefficient , τT; triplet state lifetime , Kq; triplet quenching rate constant by oxygen. [b]
StdZnPc was used as a reference compound.[3, 6, 14]

35
Single crystal X-ray diffraction studies of propargyl functionalized phthalocyanine
analogues and their precursors
Experimental
The single crystal data collections were made either on Rigaku R-AXIS RAPID II diffractometer
by filtered Mo-K radiation or using Bruker X8 Prospector employing Cu-K radiation. In the
former case ‘Crystalclear’ software package was employed to generate hkl and p4p files. The
structures were then solved by direct methods using CrystalStructure crystallographic software
package[15]
except for refinement, which was performed using SHELXL-97 or SHELXL-
2017/1.[16]
The reflection frames obtained from Bruker diffractometer were integrated with
SAINT Software package using a narrow-frame algorithm. Finally, the structure was solved and
refined using the Bruker SHELXTL Software Package. The data was collected either at room
temperature or under liquid nitrogen (Oxford cryosystems).
Discussion
Crystal structures of di-propargyl-p-cresol (2)
The structure of propargyl functionalized p-cresol is confirmed further by single crystal X- ray
diffraction technique which is depicted in Figure S38. The crystal structure is in well agreement
with other (NMR, mass etc.) structural characterization. It is observed that in crystal network the
propargyl substituents are oriented opposite to each other and are placed above and below the
cresol plane as shown in Figure S38B.
Figure S38. Crystal structure propargyl functionalized p-cresol; (A) thermal ellipsoid and (B)
capped stick representation.

36
Crystal structures of propargyl substituted Pc-precursor (3) and AzaPc-precursors (4)
Phthalonitrile and pyrazine precursors having both di-substituted phenoxyl groups with terminal
acetylene units were analyzed by single crystal X-ray diffraction technique. The crystal structure
of both these precursors provides valuable information regarding the orientation of phenoxyl
units and terminal acetylenes with respect to the phthalonitrile/pyrazine planes. The structures of
phthalonitrile and pyrazine substrates with propargyl moieties, which are obtained from single
crystal diffraction analysis, are depicted in Figures S39 & S40 and their corresponding
crystallographic parameters are given in Table S3. The plane of the phenoxyl ring having the
terminal alkynyl groups are oriented almost perpendicular to the plane of the phenyl rings
containing the nitrile groups (the corresponding torsion angles are presented in Table S4. This is
due to the restricted rotation imposed on phenoxyl moieties by the bulky alkyne substituents
which are presented at the ortho positions of the phenyl groups. Such a blocked rotation caused
by the propargyl chains is sufficient for ensuring the non-aggregating feature for those Pc
systems which will be synthesized from these unique molecules by the metal mediated
cyclization. The terminal propargyl groups have sufficient chain length for flexible orientations
are projected randomly in their crystal network. Their packing is very efficient so that without
having any solvent co-crystalization, these crystals are stable enough for diffraction studies.
Figure S39. Crystal structure of 3obtained from diffraction data (A)-thermal ellipsoid
representation and (B)-capped stick representation. Color code: blue-nitrogen; gray-carbon; red
oxygen; and black-hydrogen.

37
Figure S40. Crystal structure of 4 obtained from diffraction data (A)-thermal ellipsoid
representation and (B)-capped stick representation. Color code: blue-nitrogen; gray-carbon; red
oxygen; and black-hydrogen.

38
Table S3. Summary on the nature and various crystallographic parameters of crystal samples of
precursors 3 and 4.
Crystal sample 3 4
Crystal data
Chemical formula C38H32N2O6 C36H30N4O6
Mr 612.65 614.64
Crystal system, space group Monoclinic, P21/n Monoclinic, P21/n
Temperature (K) 296 296
a, b, c (Å) 12.6219 (11), 16.3765 (13), 16.6547 (14) 12.8709 (4), 15.6947 (4), 16.5272 (5)
β (°) 100.607 (4) 92.507 (2)
V (Å3) 3383.7 (5) 3335.38 (17)
Z 4 4
Radiation type Cu Kα Cu Kα
µ (mm−1) 0.66 0.69
Crystal size (mm) 0.22 × 0.11 × 0.05 0.30 × 0.20 × 0.07
Data collection
Diffractometer Bruker X8 Prospector Bruker X8 Prospector
Absorption correction
Multi-scan Multi-scan
SADABS V2008/1 (Bruker) SADABS V2008/1 (Bruker)
Tmin, Tmax 0.60, 0.87 0.70, 0.96
No. of measured, independent
and observed [I> 2σ(I)]
reflections
23446, 5674, 4020 28049, 5828, 2669
Rint 0.058 0.154
(sin θ/λ)max (Å−1) 0.593 0.595
Refinement
R[F2> 2σ(F2)], wR(F2), S 0.083, 0.207, 1.13 0.071, 0.260, 1.00
No. of reflections 5674 5828
No. of parameters 427 417
No. of restraints 54 31
H-atom treatment Constrained Constrained
Δρmax, Δρmin (e Å−3) 0.24, −0.28 0.44, −0.26

39
Table S4. List of torsion angles corresponds to the phenoxyl with respect to the di-nitrile plane
in 3 and 4.
Atom list Torsion angle Atom list Torsion angle
Crystal: 3
C10-C9-O1-C7 C10-C9-O1-C7 C10-C9-O1-C7 C10-C9-O1-C7
C25-C24-O4-C6 C25-C24-O4-C6 C25-C24-O4-C6 C25-C24-O4-C6
Crystal: 4
C8-C7-O1-C5 C8-C7-O1-C5 C8-C7-O1-C5 C8-C7-O1-C5
C23-C22-O4-C6 C23-C22-O4-C6 C23-C22-O4-C6 C23-C22-O4-C6
Crystal structures of Pc1 and AzaPc1
The crystal structures of Pc1 and AzaPc1 are depicted in Figures S41-44 and their corresponding
crystallographic parameters are presented in Table S5. The asymmetric unit of Pc1 crystal
contains only half part of the phtahlocyanine due to internal symmetry of the molecule and the
complete structure could be obtained by symmetry expansion. In both Pc1 and AzaPc1 the zinc
(II) ion occupied at the top of the Pc/AzaPc plane and the phthalocyanine/azaphthalocyanine
macrocycles is observed to have a domed geometry. The Pc1 molecule in crystal network
exhibited positional disorder at the center and due to this disorder, the Zn (II) ion in Pc1 crystal
is found to be occupied both sides of the Pc plane with almost half occupancies each. In the case
of AzaPc1, one methanol molecules is coordinated from the apex position to the Zn (II) ion,
where as in Pc1 such axial ligation of solvent molecule is not observed. However, two terminal
alkynyl groups are occupied very close to the Zinc (II) ion of the Pc1so that appreciable Zn ← C
C-H coordination could be possible in its crystal. Due to positional disorder, this Zn ← C C-
H coordination is observed from both sides of the Pc unit and hence is seen to be propagate along
the crystal in columnar manner as demonstrated in Figure S45.
The crystal network of AzaPc1 contains methanol molecules as the space-filling solvents which
are co-crystallized along with the AzaPc molecules during crystal growth. The peak densities of
these solvent molecules were very weak and they are not properly refined anisotropically during
structural refinement. So these solvent molecules in AzaPc1 are only refined isotropically. In the
case of AzaPc1some electron density is present within the void places by the presence of co-
crystallized solvent molecules. Due to poor crystal quality these peaks could not be assigned to

40
the corresponding solvent atoms properly. Therefore, these unassigned solvent peaks were
removed from the final refinement using the SQUEEZE technique by PLATON.
Figure S41. Thermal ellipsoid representation of the asymmetric unit of Pc1 obtained from single
crystal diffraction. Color code: blue-nitrogen; gray-carbon; red-oxygen; pink- zinc and black-
hydrogen.
Figure S42. Thermal ellipsoid representation of AzaPc1 obtained from single crystal diffraction.
Color code: blue-nitrogen; gray-carbon; red-oxygen; pink- zinc and black-hydrogen.

41
Figure S43. Crystal structure of Pc1(A) top view and (B) side view. Color code: blue-nitrogen;
gray-carbon; red-oxygen; pink- zinc and black-hydrogen (due to positional disorder, the Zn ion
in this crystal is found to be occupied at both sides of the Pc plane with half occupancies.
However, one of such Zn ions has been hided in these figures for clarity).
Figure S44. Crystal structure of AzaPc1(A) top view and (B) side view. Color code: blue-
nitrogen; gray-carbon; red-oxygen; pink- zinc and black-hydrogen.

42
Table S5. Summary on the nature and various crystallographic parameters of crystal samples
Pc1 and AzaPc1.
Crystal sample AzaPc1 Pc1
Crystal data
Chemical formula C147H132N16O27Zn C152H128N8O24Zn
Mr 2620.06 2515.99
Crystal system, space group Monoclinic, P21/a Triclinic, P-1
Temperature (K) 150 150
a, b, c (Å) 23.940 (11), 28.050 (13), 23.991 (11) 12.8844 (13), 13.9073 (13), 20.6328 (19)
α, β, γ (°) 119.850 (8) 98.862 (7), 106.525 (7), 94.899 (7)
V (Å3) 13973 (11) 3469.4 (6)
Z 4 1
Radiation type Mo Kα Mo Kα
µ (mm−1) 0.25 0.25
Crystal size (mm) 0.22 × 0.19 × 0.03 0.21 × 0.12 × 0.09
Data collection
Diffractometer Rigaku R-AXIS RAPID Rigaku R-AXIS RAPID
Absorption correction
Multi-scan Multi-scan
ABSCOR (Rigaku, 1995) ABSCOR (Rigaku, 1995)
Tmin, Tmax 0.947, 0.993 0.950, 0.978
No. of measured, independent
and
observed [I> 2σ(I)] reflections
102734, 24158, 14696 27487, 12186, 6351
Rint 0.081 0.032
(sin θ/λ)max (Å−1) 0.596 0.595
Refinement
R[F2> 2σ(F2)], wR(F2), S 0.129, 0.365, 1.26 0.138, 0.420, 1.45
No. of parameters 1798 842
No. of restraints 431 241
H-atom treatment Independent and constrained Constrained
Δρmax, Δρmin (e Å−3) 2.86, −0.77 1.17, −0.76

43
Figure S45. The Zn ← C C-H coordination observed from both sides of the Pc unit and the
resulting columnar propagation of the macrocycles.
As in the case of their pyrazine and phthalonitrile precursors, the phenoxyl units containing the
propargyl units are oriented orthogonal with respect to the plane of Pc ring. These terminal
alkynes which are presented at the ortho positions of the phenoxyl moieties are mostly oriented
upward and downward from the macrocycle planes in a random arrangement. Figures S43 and
S44, which show both top view and side view of these crystal structures, provides a clear idea
about the terminal ethylene orientations with respect to macrocycle planes. Such an orthogonal
orientation of the phenoxyl units and the resulting positions of the terminal propargyl moieties

44
(up/down) with respect to the macrocycle planes as reveled from the crystal structures clearly
dismiss any possible face to face Pc aggregation among these Pc molecules. In both these
crystals the Zn-Zn distance is more than 10Å which is too far to cause the undesired J-type core
to core Pc self-aggregation. However, unlike their precursor molecules, the special disposition of
propargyl groups in Pc1 and AzaPc1 crystals are not exactly similar as the terminal alkynes are
more widely oriented in Pc1 than AzaPc1. This difference could be presumably due to the
difference in axial coordination, variations in crystallization conditions, etc.
The packing of both Pc1 and AzaPc1 molecules in their crystal is very and efficient by utilizing
intermolecular π-π interactions with adjacent Pcs. As demonstrated in Figure S46, all phenoxyl
moieties are in these crystals are oriented in face- to face manner with another phenoxyl unit of
neighboring Pcs. It is observed that the distance between such phenoxyl-phenoxyl face to face
orientations is within 4Å in most fragments which is well sufficient for intermolecular π-π
interactions. Such 2-dimensional π-π interactions between adjacent phenoxyl moieties provide
sufficient stability to these crystal samples.
Figure S46. Pattern of Pc1 and AzaPc1 molecules in their crystal network showing the
intermolecular π-π interactions through phenoxyl moieties; (A) AzaPc1 and (B) Pc1. The
terminal substituents and hydrogens are hided for clarity.

45
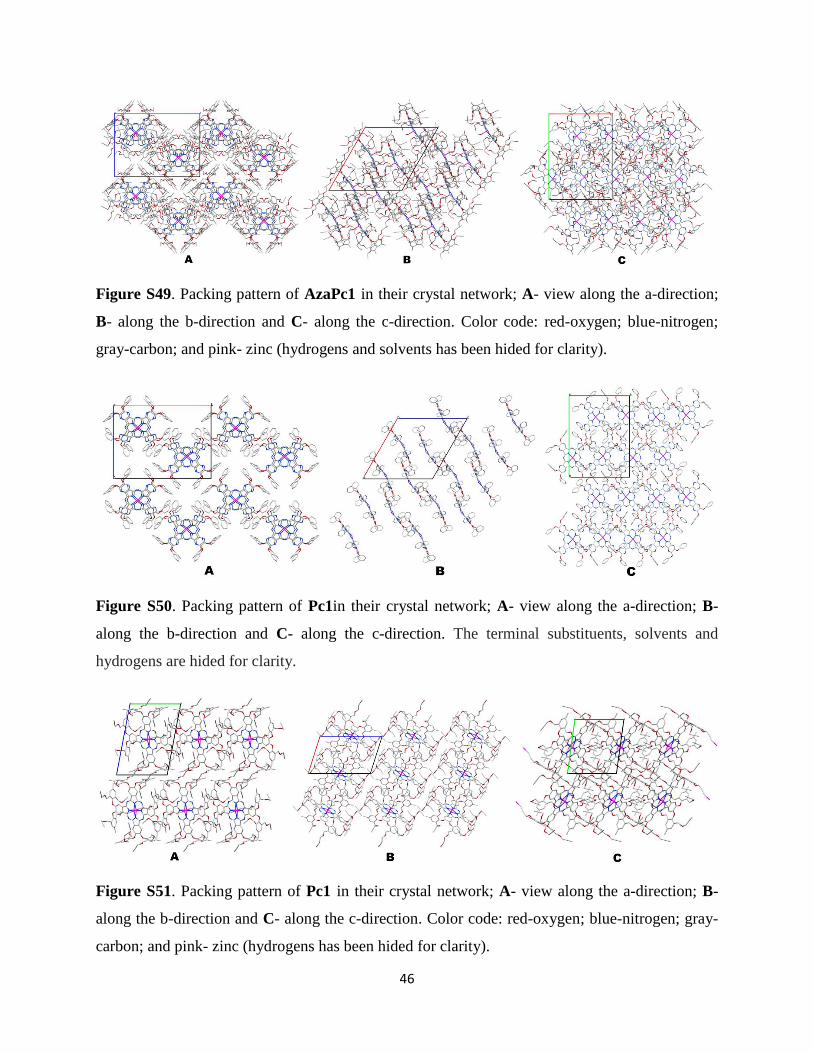
The unit cells of these phthalocyanine crystals are depicted in Figure S47 and the packing
sequence in Figure S48 (where the peripheral substituents are hided for clarity). In the case of
AzaPc, the arrangements of AzaPc1 molecules are in such a way that along a- and c-direction all
molecules in each row are arranged in the same manner and direction, whereas along b- direction
are arranged in zig-zag manner with adjacent AzaPcs are inverted to each other (Figures S48 and
S49). This is much clearly demonstrated in Figure S50 which shows the arrangements of AzaPc
core structure where all peripheral substituents are hided for clarity. At the same time, in the case
of Pc1 crystals, Pc molecules in each row along all 3 directions namely a-, b-, c-, are oriented in
same way as demonstrated in Figures S51 and S52.
Figure S47. The unit cell of (A) AzaPc1 and (B) Pc1crystals. Color code: red-oxygen; blue-
nitrogen; pink- Zinc; gray-carbon and black-hydrogen.
Figure S48. The packing of (A) AzaPc1 and (B) Pc1 molecules in their crystals. The terminal
substituents and hydrogen atoms are hided for clarity
46
Figure S49. Packing pattern of AzaPc1 in their crystal network; A- view along the a-direction;
B- along the b-direction and C- along the c-direction. Color code: red-oxygen; blue-nitrogen;
gray-carbon; and pink- zinc (hydrogens and solvents has been hided for clarity).
Figure S50. Packing pattern of Pc1in their crystal network; A- view along the a-direction; B-
along the b-direction and C- along the c-direction. The terminal substituents, solvents and
hydrogens are hided for clarity.
Figure S51. Packing pattern of Pc1 in their crystal network; A- view along the a-direction; B-
along the b-direction and C- along the c-direction. Color code: red-oxygen; blue-nitrogen; gray-
carbon; and pink- zinc (hydrogens has been hided for clarity).

47
Figure S52. Packing pattern of Pc1 in their crystal network; A- view along the a-direction; B-
along the b-direction and C- along the c-direction. The terminal substituents and hydrogen atoms
are hided for clarity.
In addition to the efficient 2-dimensional π-π interactions between adjacent phenoxyl moieties
among the Pc1 and AzaPc1 molecules, the crystals are also stabilized by van der waals
interactions between adjacent atoms. The possible short contact interactions (within the van der
waals range) observed in these crystals are depicted in Figure S53.
Figure S53. The molecules of (A) AzaPc1 and (B) Pc1 in their crystals showing their possible
short contacts interactions among the neighboring atoms within their network.
In conclusion, the crystal structures of hexadeca-propargyl functionalized zinc(II)
phthalocyanine (Pc1) and their corresponding azaphthalocyanine analogue (AzaPc1) have been
obtained from single crystal X-ray diffraction technique along with the structures of some

48
phthalonitrile and pyrazine precursor units having terminal propargyl moieties (3 and 4). Based
on the crystal structure it could be confirmed that for all these precursors, plane of the phenoxyl
ring having terminal alkyne groups are oriented perpendicular to the plane of the phenyl moiety
containing the nitrile groups. This is due to the restricted rotation imposed on phenoxyl moieties
by the bulky alkynyl substituents which are presented at the ortho positions of the phenyl groups.
This orthogonal orientation is observed in both precursor species irrespective of the number of
phenoxyl substitution. In both Pc1 and AzaPc1, the macrocycle systems are observed to have a
domed geometry with zinc (II) ion occupied at the top of the Pc/AzaPc plane. Similar to the case
of their precursors, the phenoxyl units containing the propargyl units are oriented orthogonal
with respect to the plane of Pc/AzaPc ring in both Pc1 and AzaPc1 and the terminal alkynes
moieties are oriented upward and downward from the Pc rim in a random arrangement. Such an
orthogonal orientation of the phenoxyl units and the resulting positions of the terminal propargyl
moieties (up/down) with respect to the Pc plane dismiss undesired face to face Pc/AzaPc
aggregation among these Pc/AzaPc molecules. At the same time, these crystals are characterized
by high degree of 2-dimensional π-π interactions between adjacent phenoxyl moieties of
Pc/AzaPc macrocycles which provide sufficient stability to these crystal samples.

49
References
[1] W. L. F. Armarego, D. D. Perrin, Butterworth Heinemann, Oxford; Boston, 1997.
[2] a) S. Fery-Forgues, D. Lavabre, Journal of Chemical Education 1999, 76, 1260; b) M. D.
Maree, T. Nyokong, K. Suhling, D. Phillips, Journal of Porphyrins and Phthalocyanines
2002, 06, 373-376.
[3] Y. Zorlu, F. Dumoulin, M. Durmuş, V. Ahsen, Tetrahedron 2010, 66, 3248-3258.
[4] M. Durmuş, Photochemical and Photophysical Characterization, Springer Dordrecht
Heidelberg London New York, 2012.
[5] W. Spiller, H. Kliesch, D. Wöhrle, S. Hackbarth, B. Röder, G. Schnurpfeil, Journal of
Porphyrins and Phthalocyanines 1998, 2, 145-158.
[6] I. Carmichael, G. L. Hug, Journal of Physical and Chemical Reference Data 1986, 15, 1-
250.
[7] S. M. Bishop, A. Beeby, A. W. Parker, M. S. C. Foley, D. Phillips, Journal of
Photochemistry and Photobiology A: Chemistry 1995, 90, 39-44.
[8] B. M. Trost, V. S. C. Yeh, H. Ito, N. Bremeyer, Organic Letters 2002, 4, 2621-2623.
[9] N. T. Stillman MJ, in: Leznoff CC, Lever ABP Phthalocyanines, Properties and
Applications, Vol. 1, VCH Publishers, 1989.
[10] a) H. Konami, M. Hatano, A. Tajiri, Chemical Physics Letters 1990, 166, 605-608; b) J.
Mack, M. J. Stillman, Journal of the American Chemical Society 1994, 116, 1292-1304.
[11] H. ENGELKAMP, R. J. M. NOLTE, Journal of Porphyrins and Phthalocyanines 2000,
04, 454-459.
[12] T. Nyokong, Coordination Chemistry Reviews 2007, 251, 1707-1722.
[13] M. Göksel, M. Durmuş, D. Atilla, Journal of Porphyrins and Phthalocyanines 2012, 16,
895-906.
[14] a) M. Durmuş, V. Ahsen, T. Nyokong, Journal of Photochemistry and Photobiology A:
Chemistry 2007, 186, 323-329; b) A. Ogunsipe, J.-Y. Chen, T. Nyokong, New Journal of
Chemistry 2004, 28, 822-827.
[15] R. Corporation, Tokyo 196-8666, Japan., 2000-2010.
[16] G.M., A64, 112-122. ed., Acta Cryst. , 2008.