supporting information for...s4 mixture of 20 g ethanol and 10 g water under continuous stirring for...
TRANSCRIPT

www.pnas.org/cgi/doi/10.1073/pnas.1813605115
S1
Supporting Information for
Single-atomic cobalt sites embedded in hierarchically ordered porous nitrogen-doped
carbon as a superior bifunctional electrocatalyst
Tingting Sun, Shu Zhao, Wenxing Chen, Dong Zhai, Juncai Dong, Yu Wang*, Shaolong Zhang,
Aijuan Han, Lin Gu, Rong Yu, Xiaodong Wen, Hanlin Ren, Lianbin Xu, Chen Chen, Qing Peng,
Dingsheng Wang*, and Yadong Li*
*Corresponding authors. [email protected] (Y.W.); [email protected] (D.W.);
and [email protected] (Y.L.)

S2
Table of Contents
1. Experiment section .................................................................................................................. S2-S6
2. DFT calculations ...................................................................................................................... S7-S8
3. References ...................................................................................................................................... S9
4. Supplementary Figures and Tables ................................................................................... S10-S37
1. Experimental Section
Chemicals. Triblock copolymer Pluronic F127 (Mw = 12.5K, PEO-PPO-PEO) was purchased from
Sigma-Aldrich Co. Vitamin B12 (VB12) and 2,2-bipyridine were purchased from Shanghai Aladdin
Biochemmical Technology Co., Ltd. Phenol (99%), sodium hydroxide (NaOH, 96%), formaldehyde
solution (37%), tetraethoxysilane (TEOS, 98%), potassium hydroxide (KOH, 98%), ammonia
solution (NH3·H2O, 28%), dicyandiamide (DCDA, 99%), and ethanol (99.7%) were obtained from
Sinopharm Chemical. Iron (III) chloride hexahydrate (FeCl3·6H2O, 97%), nickel (II) nitrate
hexahydrate (Ni(NO3)2·6H2O, 98%), commercial 20 wt% Pt/C catalyst, and Nafion D-521
dispersion (5% w/w in water and 1-propanol) were purchased from Alfa Aesar (China) Chemicals
Co., Ltd. Hydrofluoric acid (HF, 48-51%) was purchased from Acros Organics. Sulphuric acid
(H2SO4, 98%) was purchased from Beijing Chemical Reagents. The distilled water used in all
experiments was obtained through ion-exchange and filtration. All chemicals were used as received
without further purification.
Synthesis of silica colloidal crystal (opal). Silica opal was prepared by published methods (1).
Monodisperse silica spheres with a diameter of ca. 290 nm were initially prepared from hydrolysis of
TEOS. The spheres were then formed into close-packed lattices through a sedimentation process
over several months. This precipitate was then sintered at 120 °C for 2 days and then 750 °C for 4
hours, producing a robust opalescent piece that could be readily cut into smaller sections.
Synthesis of resol. Resol (Mw<500) was prepared by the method reported by Meng et al. previously
(2). Specifically, 10 g phenol was melt at 40-42 °C, then 2.13 g 20% NaOH aqueous solution was
added dropwise over 10 min under stirring. Next, 17.7 g formaldehyde solution was added dropwise
and the temperature was raised to 70 °C. The mixture was heated and stirred for 60 min and then
cooled to room temperature. After that, the pH of the solution was adjusted with 0.6 M HCl solution
to neutral (7.0). Water was then removed under vaccum below 50 °C. The synthesized resol was
dissolved in ethanol before use.
Synthesis of Co-SAS/HOPNC. To prepare the Co-SAS/HOPNC catalyst, Pluronic F127 (1.0 g) and
DCDA (1.0 g) were dispersed in ethanol (20 g) and deionized water (10 g) with magnetic stirring,

S3
followed by adding a resol ethanol solution (20 wt%, 5.0 g). Next, VB12 (0.8 g) was dissolved into
the above mixture and stirred at room temperature to produce a homogeneous pink solution.
Subsequently, silica template (1.0 g) was soaked into the prepared precursor for 2 hours, and then
kept at 50 °C in an electric oven for solvent evaporation for 8 h. After that, the impregnated
composites were carried out from the solution and heated at 100 °C overnight for thermosetting. The
pyrolysis process of the as-prepared composites was performed at 350 °C for 2 h and then 900 °C for
2 h in a tube furnace under Ar gas flowing with a ramping rate of 5 °C min-1
. Finally, the
Co-SAS/HOPNC was produced by acid etching with diluted HF aqueous solution for 24 h to remove
the silica opal. For comparative studies, a metal-free hierarchically ordered porous N-doped carbon
(HOPNC) catalyst was synthesized by the same fabrication procedure as that for the
Co-SAS/HOPNC but without adding VB12 in the precursor. The ordered macroporous N-doped
carbon with single atomic Co sites (Co-SAS/OMNC) sample was synthesized through the same
fabrication process as that for the Co-SAS/HOPNC but without adding F127 in the precursor. The
Co nanoparticles (NPs) on the hierarchically ordered porous N-doped carbon (Co-NPs/HOPNC)
sample was synthesized through the same preparation process as that for the Co-SAS/HOPNC but
with adding more VB12 (2.0 g) in the precursor.
Electrochemical Tests. The HER electrochemical experiments were performed by a CHI 660E
electrochemical workstation (Shanghai Chenhua Instrument Corp., China) in a three electrode cell
with a catalyst covered glassy carbon rotating disk working electrode (5 mm in diameter), a Ag/AgCl
(filled with 3.5 M KCl solution) reference electrode, and a graphite rod counter electrode. To prepare
the catalyst ink, 5 mg catalyst powder was dispersed in 1.50 mL of DMF solution containing 40 μL
of Nafion solution by sonication for at least 1 h. Then a certain volume of the catalyst ink was spread
on the surface of glassy carbon electrode with the nonprecious catalyst loading was 0.6 mg cm-2
and
the loading of 20 wt% Pt/C was 0.12 mg cm-2
and then dried under room temperature. For the Pt/C
catalyst with the mass loading of 0.12 mg cm-2
, the Pt loading is 24 μgPt cm-2
. For the
Co-SAS/HOPNC catalyst with the mass loading of 0.6 mg cm-2
, the Co loading is merely 2.9 μgCo
cm-2
based on the ICP-OES analysis. All the potentials were quoted against the reversible hydrogen
electrode (RHE). For the ORR catalytic performance test, O2-purged 0.1 M KOH or 0.1 M HClO4
was used as the electrolyte. The RDE measurements were carried out under the rotation rates ranging
from 400 to 2500 rpm at a scan rate of 5 mV·s-1
. For the HER catalytic performance test, Ar gas flow
was carried out through the electrolyte (0.5 M H2SO4 or 0.1 M KOH) during the electrochemical
measurements. Linear sweep voltammetry was measured at a scan rate of 5 mV s-1
with an electrode
rotation speed of 1600 rpm. Electrochemical impedance spectroscopy (EIS) analysis was performed
at -0.1 V vs. RHE in the frequency range from 10 kHz to 0.01 Hz using an amplitude of 5 mV.
Synthesis of Fe-SAS/HOPNC. 1.0 g F127 and 1.86 g 2,2-bipyridine were first dissolved in a

S4
mixture of 20 g ethanol and 10 g water under continuous stirring for 30 min. 5.0 g of resol ethanol
solution (20 wt%) was then added and stirred for another 30 min. Next, 0.45 g FeCl3·6H2O was
added into the solution under stirring. Subsequently, silica template (1.0 g) was soaked into the
prepared precursor for 2 hours, and then kept at 50 °C in an electric oven for solvent evaporation for
8 h. After that, the impregnated composites were carried out from the solution and heated at 100 °C
overnight for thermosetting. The resulting composites were then heated under Ar atmosphere at
350 °C for 2 h at a heating rate of 2 °C min-1
, and at 5 °C min-1
rising to 600 °C, followed by a 2 h
soak for further carbonation. Finally, the freestanding Fe-SAS/HOPNC was obtained by removing
the silica opal with a 5 wt% HF solution (24 h).
Synthesis of Ni-SAS/HOPNC. 1.0 g F127 and 1.5 g DCDA were first dissolved in a mixture of 20 g
ethanol and 10 g water under continuous stirring for 30 min. 5.0 g of resol ethanol solution (20 wt%)
was then added and stirred for another 30 min. Next, 0.32 g Ni(NO3)2·6H2O was added into the
solution under stirring. Subsequently, silica template (1.0 g) was soaked into the prepared precursor
for 2 hours, and then kept at 50 °C in an electric oven for solvent evaporation for 8 h. After that, the
impregnated composites were carried out from the solution and heated at 100 °C overnight for
thermosetting. The resulting composites were then heated under Ar atmosphere at 350 °C for 2 h at a
heating rate of 2 °C min-1
, and at 5 °C min-1
rising to 600 °C, followed by a 2 h soak for further
carbonation. Finally, the freestanding Ni-SAS/HOPNC was obtained by removing the silica opal
with a 5 wt% HF solution (24 h).
Physicochemical characterization. Powder X-ray diffraction patterns of samples were recorded
using a Rigaku RU-200b X-ray powder diffractometer (XRD) with Cu Kα radiation (λ = 1.5406 Å).
TEM images were performed on a Hitachi H-800 transmission electron microscope. The
high-resolution TEM (HR-TEM), high-angle annular dark-field scanning transmission electron
microscopy (HAADF-STEM) images and elemental mapping were recorded on a JEOL-2100F
FETEM with electron acceleration energy of 200 kV. The scanning electron microscope (SEM) was
carried out by a JSM-6700F SEM. Photoemission spectroscopy experiments (XPS) were performed
at the Catalysis and Surface Science End station at the BL11U beamline of National Synchrotron
Radiation Laboratory (NSRL) in Hefei, China. Elemental analysis of Co in the solid samples was
detected by an Optima 7300 DV inductively coupled plasma atomic emission spectrometer
(ICP-AES).
XAFS measurement and analysis. Ex situ and in situ XAFS spectra at the Co K-edge (7709 eV)
was measured at BL14W1 station in Shanghai Synchrotron Radiation Facility (SSRF). The Co
K-edge XAFS data were recorded in a fluorescence mode. Co foil, CoO, and Co3O4 were used as
references. All spectra were collected in ambient conditions.
The acquired EXAFS data were processed according to the standard procedures using the ATHENA

S5
module implemented in the IFEFFIT software packages. The k3-weighted EXAFS spectra were
obtained by subtracting the post-edge background from the overall absorption and then normalizing
with respect to the edge-jump step. Subsequently, k3-weighted χ(k) data of Co K-edge were Fourier
transformed to real (R) space using a hanning windows (dk=1.0 Å-1
) to separate the EXAFS
contributions from different coordination shells. To obtain the quantitative structural parameters
around central atoms, least-squares curve parameter fitting was performed using the ARTEMIS
module of IFEFFIT software packages.
The following EXAFS equation was used:
)](2sin[])(
2exp[]2exp[
)()(
22
2
2
0kk
kk
kk
jj
j
jj
j
jj
RR
kR
FSN
S02 is the amplitude reduction factor, Fj(k) is the effective curved-wave backscattering amplitude, Nj
is the number of neighbors in the jth
atomic shell, Rj is the distance between the X-ray absorbing
central atom and the atoms in the jth
atomic shell (backscatterer), λ is the mean free path in Å, ϕ j(k)
is the phase shift (including the phase shift for each shell and the total central atom phase shift), σj is
the Debye-Waller parameter of the jth
atomic shell (variation of distances around the average Rj).
The functions Fj(k), λ and ϕ j(k) were calculated with the ab initio code FEFF8.2. The additional
details for EXAFS simulations are given below.
The coordination numbers of model samples were fixed as the nominal values. The obtained
was fixed in the subsequent fitting. While the internal atomic distances R, Debye-Waller factor σ2,
and the edge-energy shift ΔE0 were allowed to run freely.
For in situ spectroscopic experiments, a homemade electrochemical cell was used and the spectra
were collected using a solid-state detector. A catalyst-coated carbon fiber paper
(Co-SAS/HOPNC/CFP) working electrode served as the X-ray window for synchrotron radiation,
and multistep potential control was used for the in situ measurements.
Calculation of electron transfer numbers (n) and kinetic currents (Jk) for ORR. The n and Jk
involved in the typical ORR process were calculated on the basis of the Koutecky-Levich equation:
=
+
=
+
B = 0.62nFCo(Do)2/3
v-1/6
where J is the measured current density, Jk and Jd are the kinetic-limiting and diffusion-limiting
current densities, ω is the rotation speed in rpm, n is the electron transfer number, F is the Faraday
constant (96485 C mol-1
), Do is the diffusion coefficient of oxygen in the electrolyte (1.9 × 10⁻⁵
cm2
s-1
), v is the kinetic viscosity of the electrolyte (0.01 cm2 s
-1), and Co is the bulk concentration of
oxygen (1.2 × 10⁻⁶
mol cm-3
).
S6
Calculation of turnover frequency (TOF) for HER. To calculate the turnover frequency (TOF)
per cobalt site on the Co-SAS/HOPNC catalyst, we used the following formula:
TOF =
The upper limit of the number of active sites was calculated based on the hypothesis that all cobalt
atoms in the Co-SAS/HOPNC catalyst formed active Co-N4 centers and all of them were accessible
to the electrolyte. The real number of active and accessible cobalt sites should be considerably lower
than the calculated value. The cobalt content of Co-SAS/HOPNC revealed by the ICP-OES
measurement was 0.49 wt%. Accordingly, the upper limit of active site density is
0.60
6.022
= 3.0 sites
The total number of hydrogen turn overs was calculated from the current density according to (3, 4):
# H2 = (j
)(
)(
)(
)(
) = 3.12
per
For example, at an overpotential of 100 mV, the HER current density is 3.95 mA cm-2
, and the TOF
of the Co-SAS/HOPNC was calculated to be
TOF =
= 0.41 s-1
The TOF of the Co-SAS/HOPNC at the overpotential of 200 mV was calculated to be
TOF =
= 3.8 s-1
The cobalt content of Co-SAS/OMNC revealed by the ICP-OES measurement was 0.42 wt%.
Accordingly, the upper limit of active site density is
0.60
6.022
= 2.57 sites
Similarly, the TOF of the Co-SAS/OMNC at the overpotential of 200 mV was calculated to be
TOF =
= 1.03 s
-1

S7
2. DFT calculations
All theoretical calculations were performed using density functional theory (DFT), as implemented
in the Vienna ab initio simulation package (VASP) (5, 6). The electron exchange and correlation
energy was treated within the generalized gradient approximation in the Perdew-Burke-Ernzerhof
functional (GGA-PBE) (7). The valence orbitals of Co (3d, 4s), C (2s, 2p), N (2s, 2p) and H (1s)
were described by plane-wave basis sets with cutoff energies of 400 eV. The k-point sampling was
obtained from the Monkhorst-Pack scheme with a (2 × 2 × 1) mesh. The convergence criteria for the
electronic self-consistent iteration and force were set to 10–4
eV and 0.03 eV Å-1
, respectively. For
evaluating the energy barriers, all transition states were located using the climbing image nudged
elastic band (CI-NEB) method (8-10).
The two-dimensional system was modeled with a 6 × 6 supercell consisted of 72 carbon sites
separated by a vacuum region of 15 Å along the direction normal to the sheet plane to avoid strong
interactions between two adjacent layers. Two neighboring carbon atoms were removed to anchor a
Co atom, and four of carbon atoms were replaced by N atom, forming the Co-N4-C configuration
(See Fig. S28). A p (2 × 2) four-atomic-layer slab model of fcc Co (111) surface was used to simulate
the electrocatalytic reactivity of Co nanoparticle. The vacuum gap was set as 15 Å and the top two
layers were relaxed. The charge density differences were evaluated using the formula Δρ = ρA + B -
ρA - ρB., where ρX is the electron density of X.
For ORR calculation, the four electron pathway by which the ORR occurs under base condition are
generally reported to proceed according to the following steps (11):
(1) * + O2 (g) + H2O (l) + e− → *OOH + OH
−
(2) *OOH + e− → *O + OH
−
(3) *O + H2O (l) + e− → *OH + OH
−
(4) *OH + e−
→ OH− + *
where the asterisk (*) indicates an active site.
We used Nørskov et al.’s computational hydrogen electrode model to calculate the free energy
diagrams for ORR (12). The reaction free energy (G) can be calculated by the formula:
G = ΔH−TΔS−qU,
where ΔH is the reaction enthalpy of an elementary step in ORR and is estimated by the reaction
energy (ΔE) from DFT calculations with zero-point energy (ZPE) correction; TΔS is the change in
entropy contribution to the free energy; U is the applied potential; q is the charge transfer in each
elementary step. Zero-pint energy (ZPE) and entropy contribution (T*S) for adsorbed species and
gaseous molecules (H2O and H2) were obtained using harmonic approximation and ideal gas
approximation, respectively, at the standard condition. The calculated ZPE and T*S are listed in
Tables S7 and S8. The free energy of H2O (l) was derived from the equation G(H2O, l) = G(H2O, g)

S8
+ RTln(p/p0), where R is the ideal gas constant, T = 298.15 K, p = 0.035 bar, and p0 = 1 bar.
The free energy of OH– was derived from the following equations:
G(OH–) = G(H2O, l) – G(H
+)
G(H+) = 0.5G(H2) – kBTln10×pH
where kB is the Boltzmann’s constant, T = 298.15 K, and pH = 13.
The free energy of O2 was obtained from the reaction O2 (g) + 2H2 (g) → 2H2O (l), with a known
free energy decrease of 4.92 eV.
For HER calculation, the hydrogen adsorption energies were calculated according to the equation:
ΔEH = E(H/substrate) - [E(substrate) + 1/2 E(H2)]
where E(H/substrate), E(substrate) and E(H2) represent the total energy of substrate with adsorbed
hydrogen atom, the total energy of the clean substrate and the energy of H2 molecule in the gas phase,
respectively. The Gibbs free energy of hydrogen adsorption can be calculated by the equation:
ΔGH = ΔEH + ΔEZPE + ΔHH - TΔSH
where ΔEH, ΔEZPE, ΔHH and ΔSH denote the adsorption energy, zero point energy change, enthalpy
change from 0 to 298 K, and entropy change between the adsorbed state and the gas phase,
respectively. Since the energy contribution from the configurational and vibrational entropy in the
hydrogen-adsorbed substrate could be neglected, ΔSH was determined by ΔSH = -1/2S , where S
is the entropy of molecule hydrogen in the gas phase at standard conditions (13).

S9
3. References
1. Zakhidov AA, et al. (1998) Carbon structures with three-dimensional periodicity at optical
wavelengths. Science 282:897–901.
2. Meng Y, et al. (2005) Ordered mesoporous polymers and homologous carbon frameworks:
Amphiphilic surfactant templating and direct transformation. Angew Chem Int Ed Engl
44:7053–7059.
3. Liang HW, et al. (2015) Molecular metal-Nx centres in porous carbon for electrocatalytic
hydrogen evolution. Nat Commun 6:7992.
4. Kibsgaard J, Jaramillo TF (2014) Molybdenum phosphosulfide: An active, acid-stable,
earth-abundant catalyst for the hydrogen evolution reaction. Angew Chem Int Ed Engl
53:14433–14437.
5. Kresse G, Furthmüller J (1996) Efficiency of ab-initio total energy calculations for metals and
semiconductors using a plane-wave basis set. Comp Mater Sci 6:15–50.
6. Kresse G, Furthmüller J (1996) Efficient iterative schemes for ab initio total-energy
calculations using a plane-wave basis set. Phys Rev B 54:11169–11186.
7. Perdew JP, Burke K, Ernzerhof M (1996) Generalized gradient approximation made simple.
Phys Rev Lett 77:3865–3868.
8. Hinnemann B, et al. (2005) Biomimetic hydrogen evolution: MoS2 nanoparticles as catalyst
for hydrogen evolution. J Am Chem Soc 127:5308–5309.
9. Jónsson H, Mills G, Jacobsen KW (1998) Classical and quantum dynamics in condensed phase
simulations. Nudged Elastic Band Method for Finding Minimum Energy Paths of Transitions,
eds Berne B, Ciccoti G, Coker DF (World Scientific, Hackensack, NJ), pp 385–404.
10. Henkelman G, Uberuaga BP, Jónsson H (2000) A climbing image nudged elastic band method
for finding saddle points and minimum energy paths. J Chem Phys 113:9901–9904.
11. Jiao Y, Zheng Y, Jaroniec M, Qiao SZ (2015) Design of electrocatalysts for oxygen- and
hydrogen-involving energy conversion reactions. Chem Soc Rev 44:2060–2086.
12. Nørskov JK, et al. (2004) Origin of the overpotential for oxygen reduction at a fuel-cell
cathode. J Phys Chem B 108:17886–17892.
13. Henkelman G, Jónsson H (2000) Improved tangent estimate in the nudged elastic band method
for finding minimum energy paths and saddle points. J Chem Phys 113:9978–9985.

S10
4. Supplementary Figures and Tables
Fig. S1. SEM image of the Co-SAS/HOPNC.
Fig. S2. (A) SAED pattern of Co-SAS/HOPNC. (B) XRD patterns of Co-SAS/HOPNC with Co
(JCPDS No. 15-0806, black vertical line) as reference.

S11
Fig. S3. (A) C 1s and (B) N 1s XPS spectra of Co-SAS/HOPNC.
Fig. S4. The corresponding EXAFS fitting curves of Co foil.

S12
Fig. S5. (A) SEM and (B) TEM images of HOPNC.
Fig. S6. (A) SEM and (B) TEM images of Co-SAS/OMNC.
S13
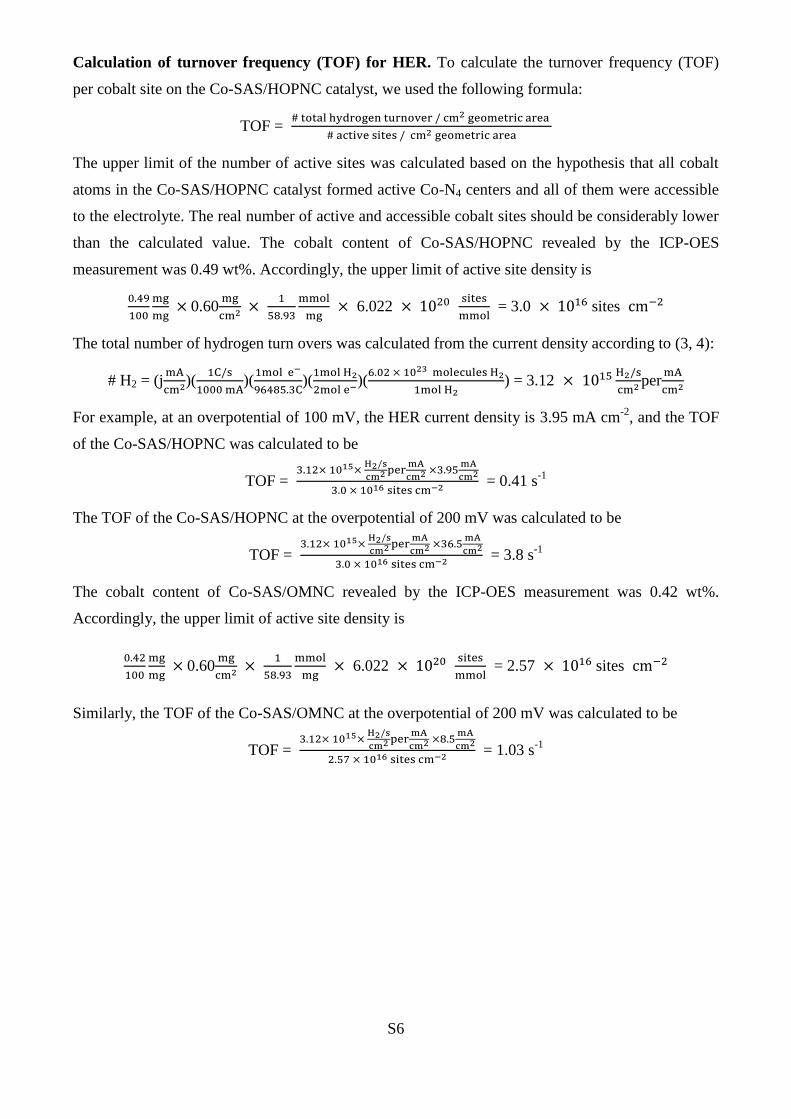
Fig. S7. HAADF-STEM image of Co-SAS/OMNC and corresponding element maps showing the
distribution of C (blue), N (orange), and Co (green).
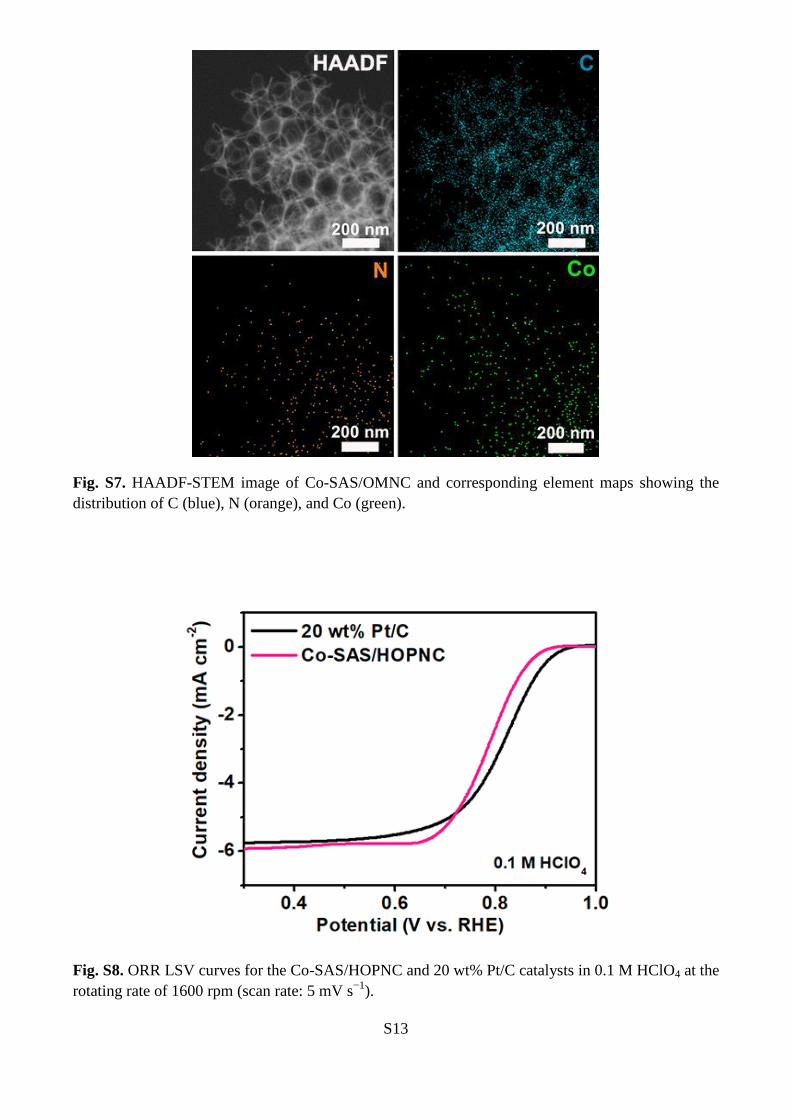
Fig. S8. ORR LSV curves for the Co-SAS/HOPNC and 20 wt% Pt/C catalysts in 0.1 M HClO4 at the
rotating rate of 1600 rpm (scan rate: 5 mV s−1
).
S14
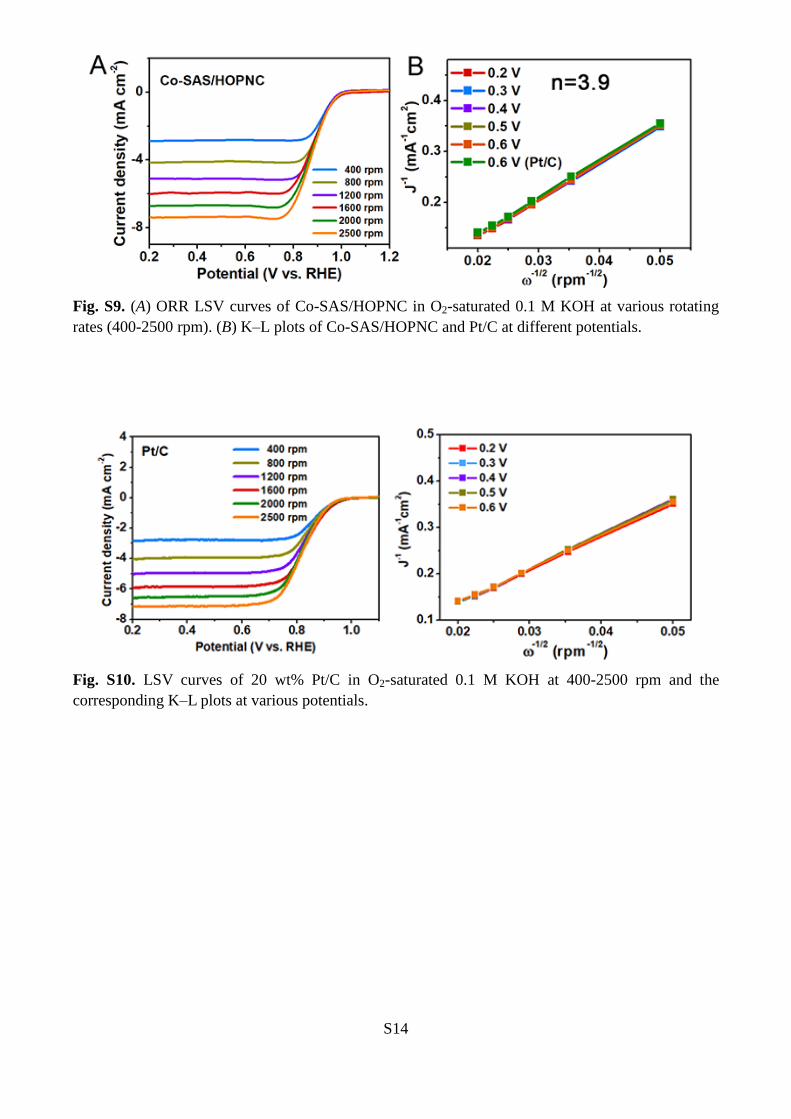
Fig. S9. (A) ORR LSV curves of Co-SAS/HOPNC in O2-saturated 0.1 M KOH at various rotating
rates (400-2500 rpm). (B) K–L plots of Co-SAS/HOPNC and Pt/C at different potentials.
Fig. S10. LSV curves of 20 wt% Pt/C in O2-saturated 0.1 M KOH at 400-2500 rpm and the
corresponding K–L plots at various potentials.
S15
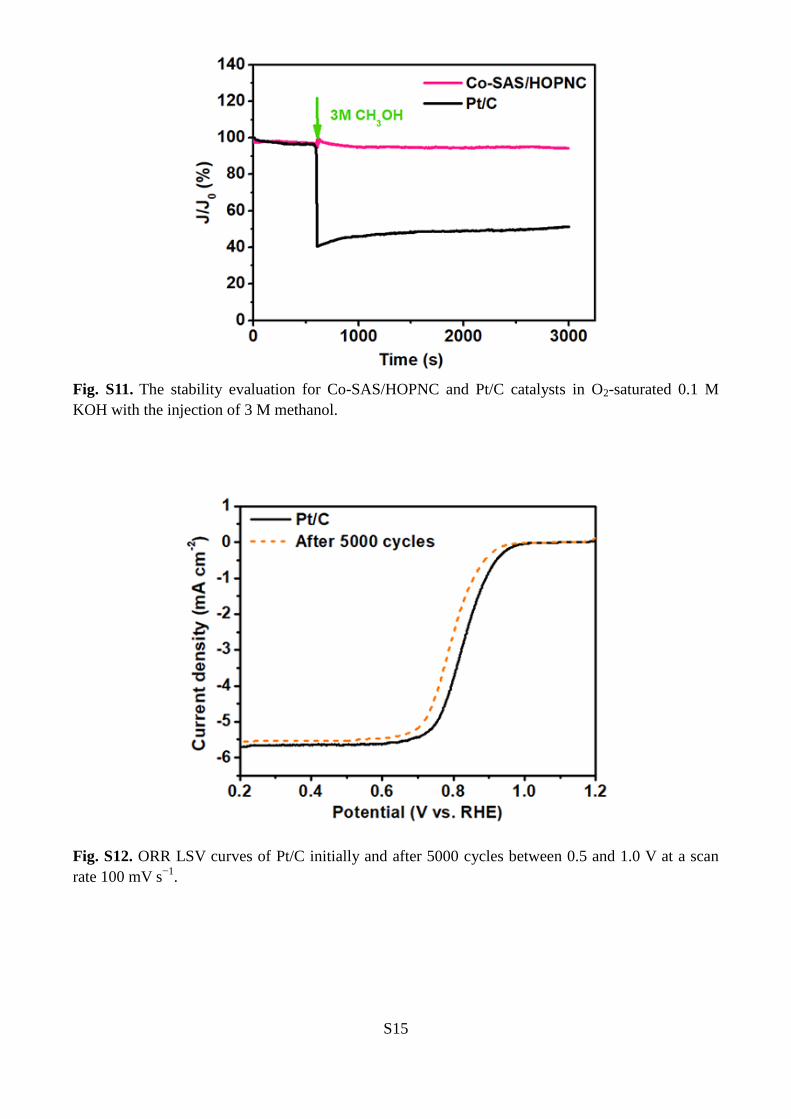
Fig. S11. The stability evaluation for Co-SAS/HOPNC and Pt/C catalysts in O2-saturated 0.1 M
KOH with the injection of 3 M methanol.
Fig. S12. ORR LSV curves of Pt/C initially and after 5000 cycles between 0.5 and 1.0 V at a scan
rate 100 mV s−1
.

S16
Fig. S13. AC HAADF-STEM image of Co-SAS/HOPNC after 5000 CV cycles in 0.1 M KOH for
ORR.
Fig. S14. HER polarization curves for the Co-SAS/HOPNC and 20 wt% Pt/C in 0.1 M KOH at the
rotating rate of 1600 rpm (scan rate: 5 mV s−1
).
S17
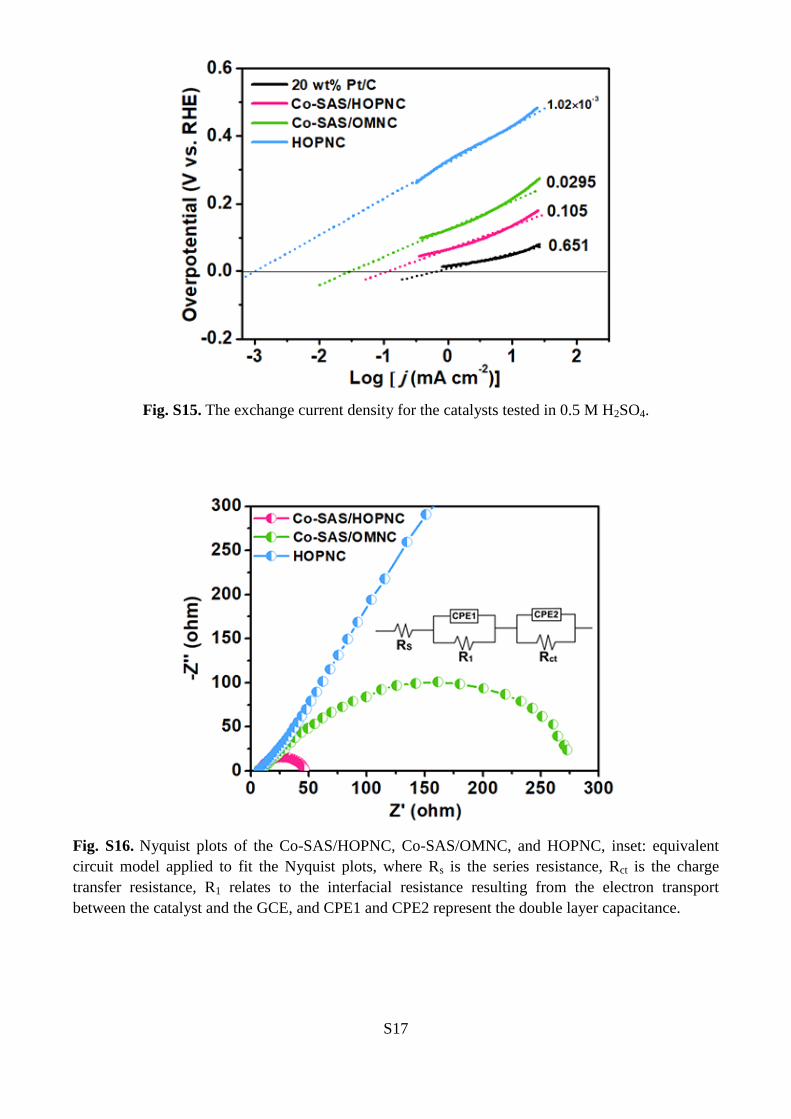
Fig. S15. The exchange current density for the catalysts tested in 0.5 M H2SO4.
Fig. S16. Nyquist plots of the Co-SAS/HOPNC, Co-SAS/OMNC, and HOPNC, inset: equivalent
circuit model applied to fit the Nyquist plots, where Rs is the series resistance, Rct is the charge
transfer resistance, R1 relates to the interfacial resistance resulting from the electron transport
between the catalyst and the GCE, and CPE1 and CPE2 represent the double layer capacitance.
S18
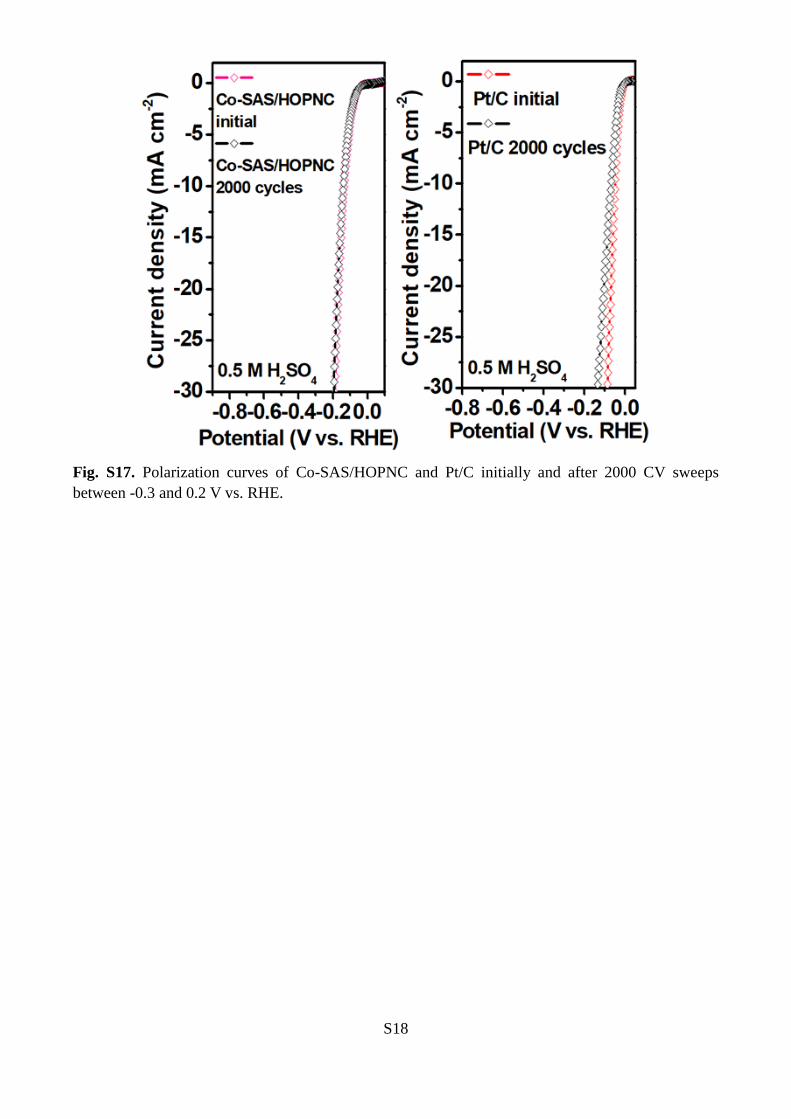
Fig. S17. Polarization curves of Co-SAS/HOPNC and Pt/C initially and after 2000 CV sweeps
between -0.3 and 0.2 V vs. RHE.
S19
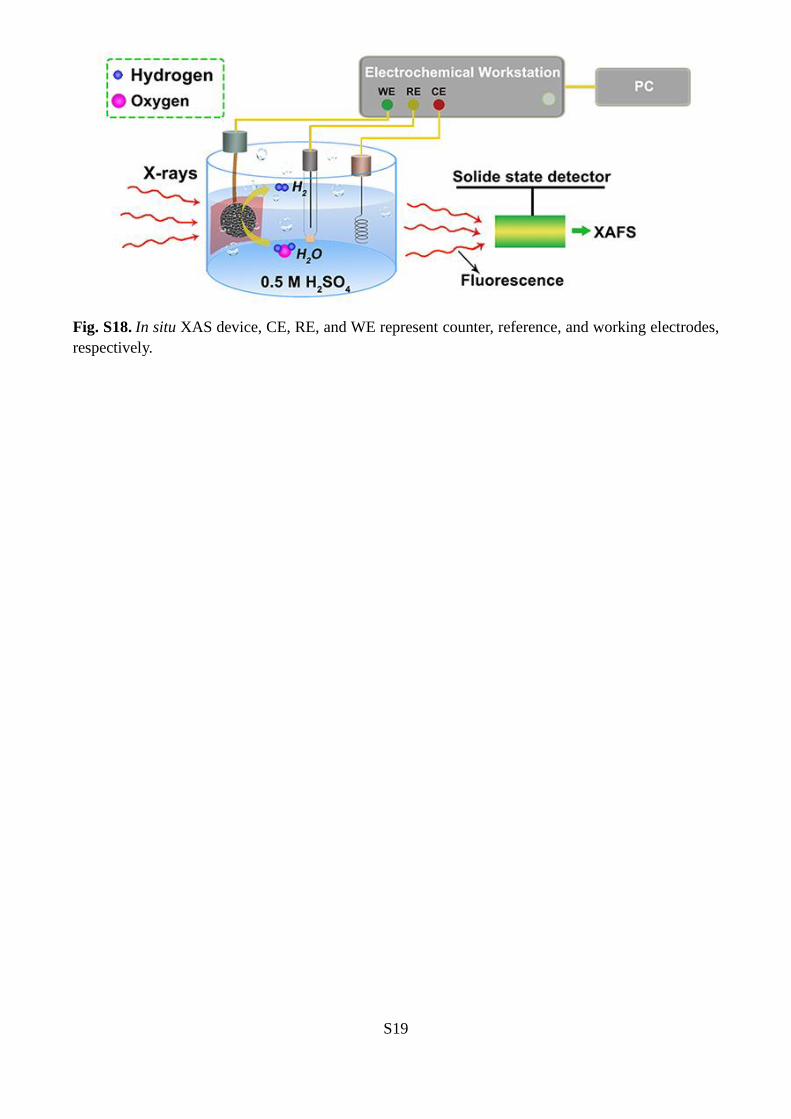
Fig. S18. In situ XAS device, CE, RE, and WE represent counter, reference, and working electrodes,
respectively.

S20
Fig. S19. (A) SEM, (B) TEM, (C) STEM images, and (D) electron diffraction pattern of
Co-SAS/HOPNC after 2000 CV cycles in 0.5 M H2SO4 for HER. We found that the
Co-SAS/HOPNC still maintained ordered porous structure. Small particles of Co species are not
observed.

S21
Fig. S20. HAADF-STEM image of Co-SAS/HOPNC after 2000 CV cycles in 0.5 M H2SO4 for HER
and corresponding element maps showing the distribution of C (blue), N (orange), and N (green).

S22
Fig. S21. AC HAADF-STEM image of Co-SAS/HOPNC after 2000 CV cycles in 0.5 M H2SO4 for
HER. The image revealed that the Co species still kept on the N-doped carbon in the form of
Co-SAs, which were identified by isolated bright dots marked with green circles.
Fig. S22. Fourier transform (FT) of the Co K-edge of Co-SAS/HOPNC after 2000 CV cycles in 0.5
M H2SO4 for HER, inset is the corresponding EXAFS in k-space.
S23
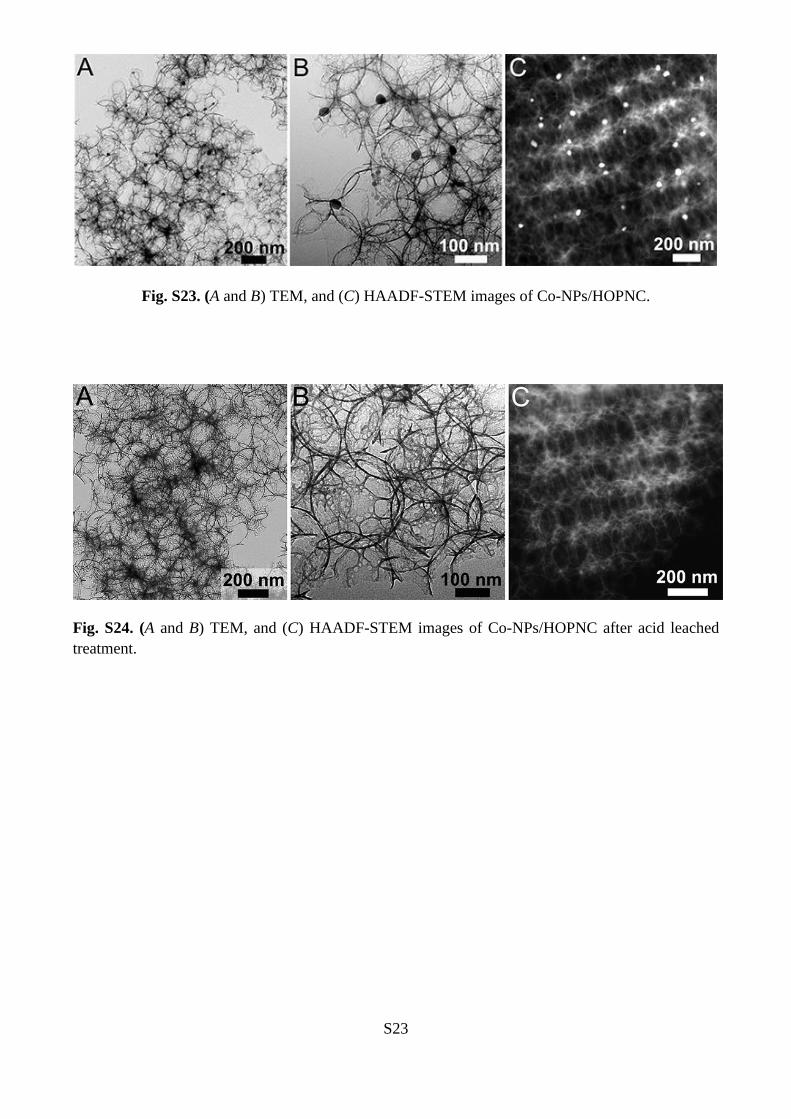
Fig. S23. (A and B) TEM, and (C) HAADF-STEM images of Co-NPs/HOPNC.
Fig. S24. (A and B) TEM, and (C) HAADF-STEM images of Co-NPs/HOPNC after acid leached
treatment.

S24
Fig. S25. AC HAADF-STEM image of Co-NPs/HOPNC after acid leaching.
Fig. S26. XRD patterns of (A) Co-NPs/HOPNC and (B) after acid-leached Co-NPs/HOPNC with Co
(JCPDS No. 15-0806, black vertical line) and Co2C (JCPDS No. 65-8206, red vertical line) as
references.

S25
Fig. S27. (A) ORR and (B) HER polarization curves of as-prepared and acid-leached
Co-NPs/HOPNC.
Fig. S28. Computational models of (A) Co-N4-C, (B) N4-C, and (C) Co-NPs (C: gray, N: blue, Co:
orange)
Fig. S29. Optimized structures of H adsorption on (A) Co-N4-C, (B) N4-C, and (C) Co-NPs (C: gray,
N: blue, Co: orange, H: white).

S26
Fig. S30. TEM images of (A) Fe-SAS/HOPNC, and (B) Ni-SAS/HOPNC.
Fig. S31. XRD patterns of (A) Fe-SAS/HOPNC, and (B) Ni-SAS/HOPNC.

S27
Fig. S32. (A) XANES spectra at the Fe K-edge of Fe-SAS/HOPNC, FeO, Fe2O3 sample and Fe foil.
(B) The corresponding EXAFS fitting curves of Fe-SAS/HOPNC at k space. (C) The corresponding
EXAFS fitting curves of Fe-SAS/HOPNC at r space, inset: schematic model of Fe-SAS/HOPNC: Fe
(red), N (blue), and C (gray).
S28
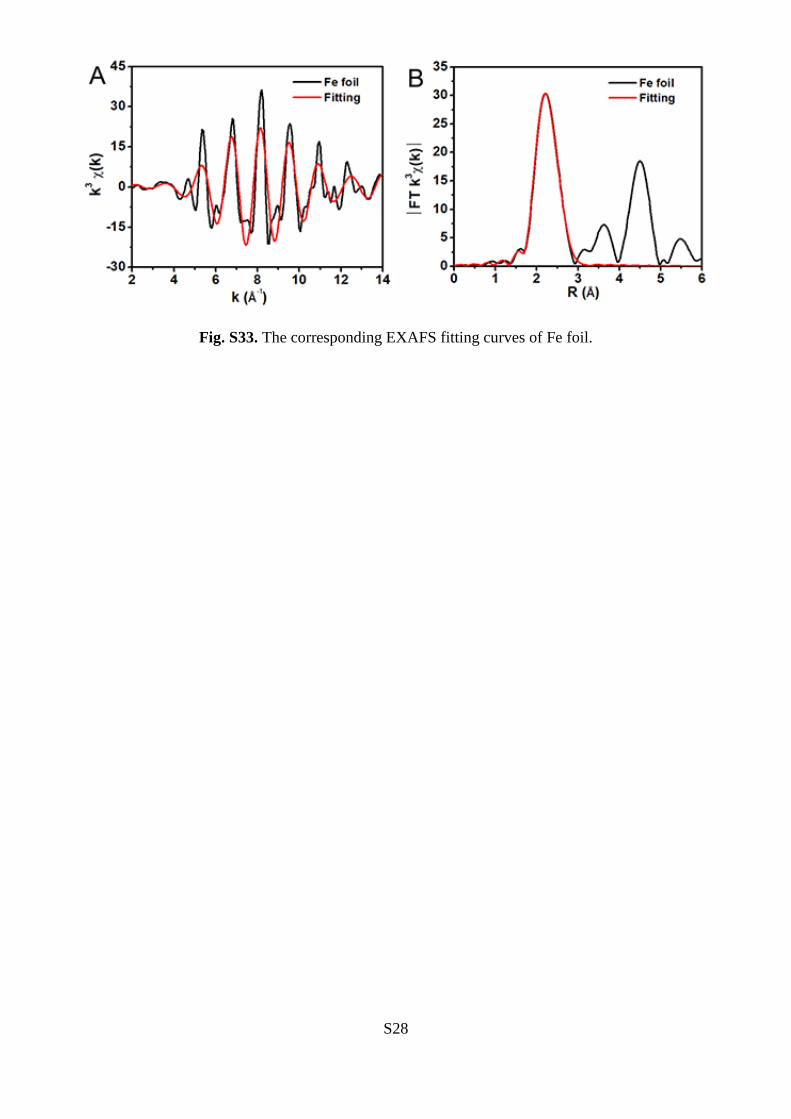
Fig. S33. The corresponding EXAFS fitting curves of Fe foil.

S29
Fig. S34. (A) XANES spectra at the Ni K-edge of Ni-SAS/HOPNC, NiO, and Ni foil. (B) The
corresponding EXAFS fitting curves of Ni-SAS/HOPNC at k space. (C) The corresponding EXAFS
fitting curves of Ni-SAS/HOPNC at r space, inset: schematic model of Ni-SAS/HOPNC: Ni (green),
N (blue), and C (gray).

S30
Fig. S35. The corresponding EXAFS fitting curves of Ni foil.

S31
Table S1 ICP-OES analysis results of the as-synthesized catalysts.
Catalyst Co (wt%) Fe (wt%) Ni (wt%)
Co-SAS/HOPNC 0.49
Fe-SAS/HOPNC 0.89
Ni-SAS/HOPNC 1.02
Table S2 Structural parameters extracted from the Co K-edge EXAFS fitting. (S02=0.76).
S02
is the amplitude reduction factor; CN is the coordination number; R is interatomic distance (the
bond length between central atoms and surrounding coordination atoms); σ2 is Debye-Waller factor
(a measure of thermal and static disorder in absorber-scatterer distances); ΔE0 is edge-energy shift
(the difference between the zero kinetic energy value of the sample and that of the theoretical model).
R factor is used to value the goodness of the fitting.
* This value was fixed during EXAFS fitting, based on the known structure of Co foil.
Error bounds that characterize the structural parameters obtained by EXAFS spectroscopy were
estimated as N ± 20%; R ± 1%; σ2 ± 20%; ΔE0 ± 20%.
Co-SAS/HOPNC (FT range: 2.0-11.0 Å-1
; fitting range: 1.3-2.9 Å)
Co foil (FT range: 2.0-11.0 Å-1
; fitting range: 0.7-2.1 Å)
Sample Scattering
pair CN R(Å) σ
2(10
-3Å
2) ΔE0(eV) R factor
Co-SAS/HOPNC Co-N/C 4.1 1.96 8.9 -3.3 0.0082
Co foil Co-Co 12* 2.50 6.5 7.7 0.0013

S32
Table S3 Comparison of the electrocatalytic ORR activity of Co-SAS/HOPNC with other
representative non-noble-metal ORR electrocatalysts recently reported in the literatures.
Catalyst Electrolyte Loading
(mg cm-2
)
E1/2
(V vs. RHE) Reference
Co-SAS/HOPNC 0.1 M KOH 0.6 0.892 This work
Co-ISAS/p-CN 0.1 M KOH N.A. 0.838 Adv. Mater. 2018,
1706508.
Co@Co3O4/NC-1 0.1 M KOH 0.21 0.80
Angew. Chem. Int.
Ed. 2016, 55,
4087-4091.
NPMC-1000 0.1 M KOH 0.15 0.85 Nat. Nanotechnol.
2015, 10, 444.
S,N-Fe/N/CCNT 0.1 M KOH 0.6 0.85 Angew. Chem. Int.
Ed. 2017, 56, 610.
C-MOF-C2-900 0.1 M KOH N.A. 0.82 Adv. Mater. 2018,
30, 1705431.
Fe@C-FeNC 0.1 M KOH 0.7 0.899
J. Am. Chem. Soc.
2016, 138,
3570-3578.
CNT/PC 0.1 M KOH 0.8 0.88 J. Am. Chem. Soc.
2016, 138, 15046.
CoP NCs 0.1 M KOH 0.28 0.7 Nano Lett. 2015, 15,
7616.
D-AC@2Mn-4Co 0.1 M KOH 0.08 0.792 Adv. Mater. 2016,
28, 8771.
Fe@Aza-PON 0.1 M KOH N.A. 0.839
J. Am. Chem. Soc.
2018, 140,
1737-1742.
Co−N/CNFs 0.1 M KOH 0.1 0.82 ACS Catal. 2017, 7,
6864-6871.
Fe3C@N-CNT 0.1 M KOH 0.25 0.85
Energy Environ.
Sci. 2016, 9,
3092-3096.
S33
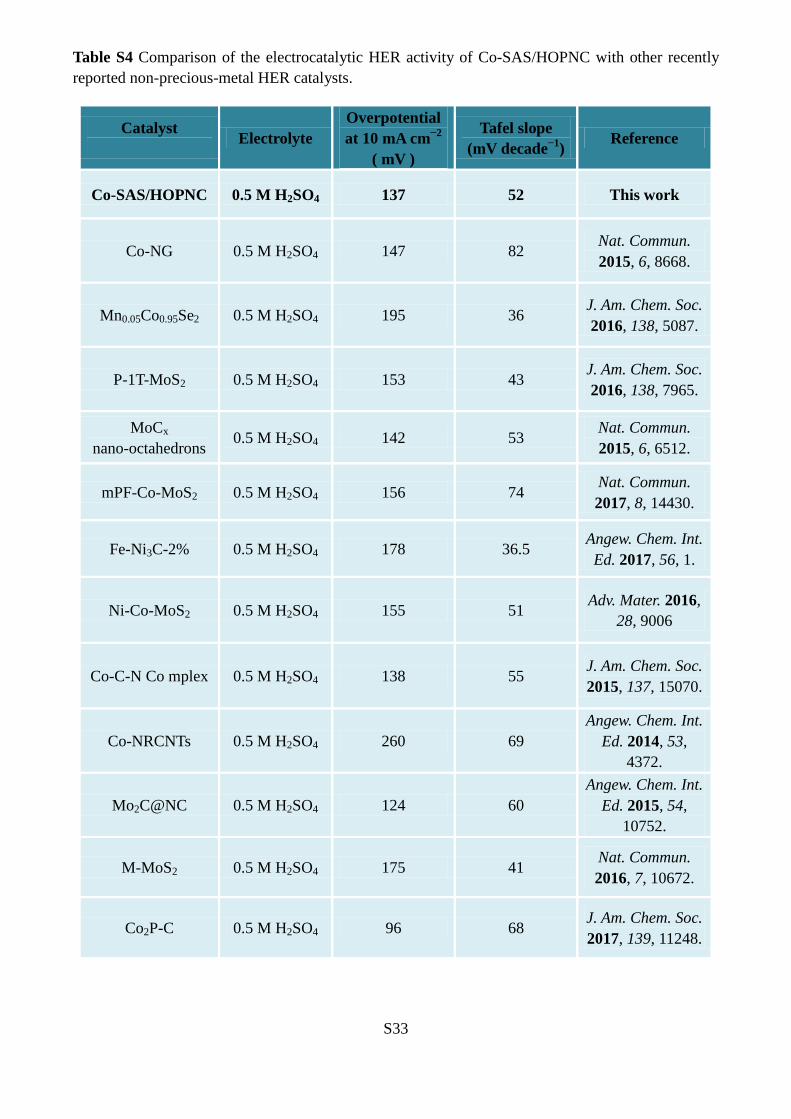
Table S4 Comparison of the electrocatalytic HER activity of Co-SAS/HOPNC with other recently
reported non-precious-metal HER catalysts.
Catalyst
Electrolyte
Overpotential
at 10 mA cm−2
( mV )
Tafel slope
(mV decade−1
) Reference
Co-SAS/HOPNC 0.5 M H2SO4 137 52 This work
Co-NG 0.5 M H2SO4 147 82 Nat. Commun.
2015, 6, 8668.
Mn0.05Co0.95Se2 0.5 M H2SO4 195 36 J. Am. Chem. Soc.
2016, 138, 5087.
P-1T-MoS2 0.5 M H2SO4 153 43 J. Am. Chem. Soc.
2016, 138, 7965.
MoCx
nano-octahedrons 0.5 M H2SO4 142 53
Nat. Commun.
2015, 6, 6512.
mPF-Co-MoS2 0.5 M H2SO4 156 74 Nat. Commun.
2017, 8, 14430.
Fe-Ni3C-2% 0.5 M H2SO4 178 36.5 Angew. Chem. Int.
Ed. 2017, 56, 1.
Ni-Co-MoS2 0.5 M H2SO4 155 51 Adv. Mater. 2016,
28, 9006
Co-C-N Co mplex 0.5 M H2SO4 138 55 J. Am. Chem. Soc.
2015, 137, 15070.
Co-NRCNTs 0.5 M H2SO4 260 69
Angew. Chem. Int.
Ed. 2014, 53,
4372.
Mo2C@NC 0.5 M H2SO4 124 60
Angew. Chem. Int.
Ed. 2015, 54,
10752.
M-MoS2 0.5 M H2SO4 175 41 Nat. Commun.
2016, 7, 10672.
Co2P-C 0.5 M H2SO4 96 68 J. Am. Chem. Soc.
2017, 139, 11248.
S34
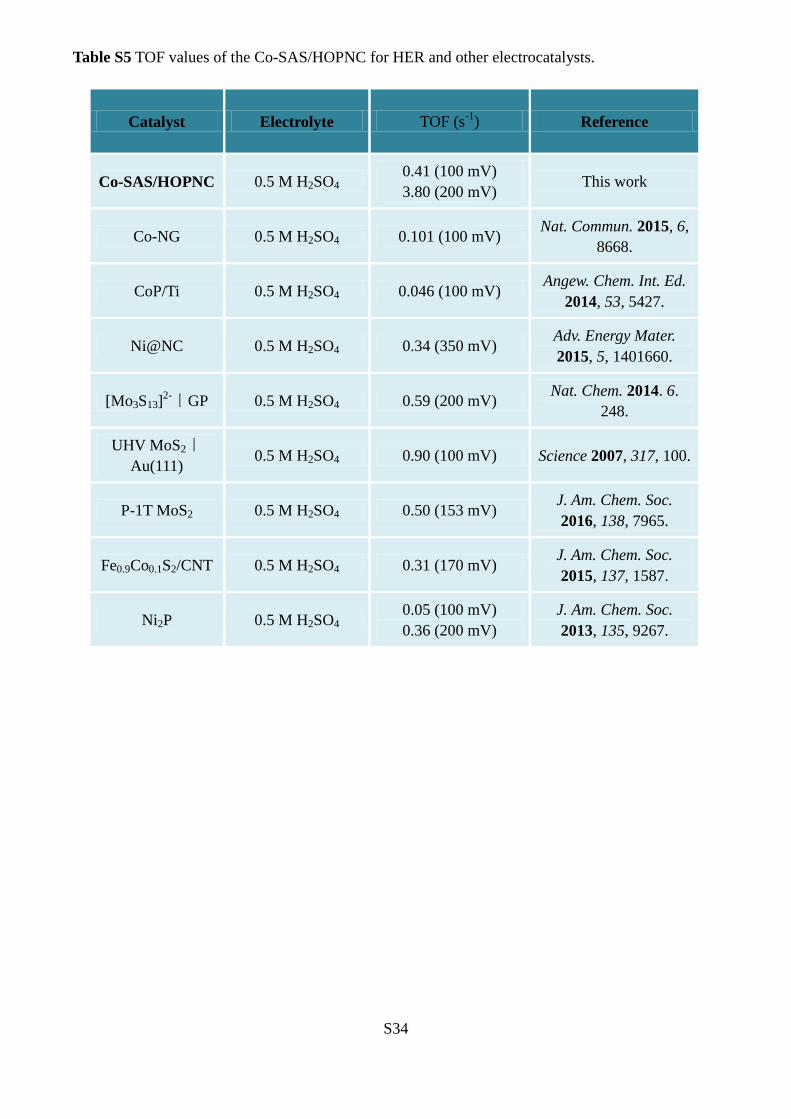
Table S5 TOF values of the Co-SAS/HOPNC for HER and other electrocatalysts.
Catalyst Electrolyte TOF (s-1
) Reference
Co-SAS/HOPNC 0.5 M H2SO4 0.41 (100 mV)
3.80 (200 mV) This work
Co-NG 0.5 M H2SO4 0.101 (100 mV) Nat. Commun. 2015, 6,
8668.
CoP/Ti 0.5 M H2SO4 0.046 (100 mV) Angew. Chem. Int. Ed.
2014, 53, 5427.
Ni@NC 0.5 M H2SO4 0.34 (350 mV) Adv. Energy Mater.
2015, 5, 1401660.
[Mo3S13]2-|GP 0.5 M H2SO4 0.59 (200 mV)
Nat. Chem. 2014. 6.
248.
UHV MoS2|
Au(111) 0.5 M H2SO4 0.90 (100 mV) Science 2007, 317, 100.
P-1T MoS2 0.5 M H2SO4 0.50 (153 mV) J. Am. Chem. Soc.
2016, 138, 7965.
Fe0.9Co0.1S2/CNT 0.5 M H2SO4 0.31 (170 mV) J. Am. Chem. Soc.
2015, 137, 1587.
Ni2P 0.5 M H2SO4 0.05 (100 mV)
0.36 (200 mV)
J. Am. Chem. Soc.
2013, 135, 9267.

S35
Table S6 Adsorption energies (eV) of different intermediates during ORR on Co-N4 and Co (111),
which were calculated using clean active sites, gaseous H2O, and H2 as reference.
Table S7 Zero point energies (ZPE) and entropy contribution (TS) for different intermediates on
Co-N4 site (T=298K).
Co-N4 Co (111)
O 2.46 -0.11
OH 0.90 -0.05
OOH 3.83 2.87
HO* O* HOO*
ZPE (eV) 0.34 0.06 0.44
TS (eV) 0.13 0.08 0.20

S36
Table S8 Zero point energies (ZPE) and entropy contribution (TS) for different intermediates on Co
(111) (T=298K).
Table S9 Structural parameters extracted from the Fe K-edge EXAFS fitting. (S02=0.76).
S02 is the amplitude reduction factor; CN is the coordination number; R is interatomic distance (the
bond length between central atoms and surrounding coordination atoms); σ2 is Debye-Waller factor
(a measure of thermal and static disorder in absorber-scatterer distances); ΔE0 is edge-energy shift
(the difference between the zero kinetic energy value of the sample and that of the theoretical model).
R factor is used to value the goodness of the fitting.
* This value was fixed during EXAFS fitting, based on the known structure of Fe foil.
Error bounds that characterize the structural parameters obtained by EXAFS spectroscopy were
estimated as N ± 20%; R ± 1%; σ2 ± 20%; ΔE0 ± 20%.
Fe-SAS/HOPNC (FT range: 2.0-11.5 Å-1
; fitting range: 0.8-2.0 Å)
Fe foil (FT range: 2.0-12.4Å-1
; fitting range: 1.4-3.0 Å)
HO* O* HOO*
ZPE (eV) 0.35 0.07 0.37
T*S (eV) 0.07 0.04 0.23
Sample Scattering
pair CN R(Å) σ
2(10
-3Å
2) ΔE0(eV) R factor
Fe-SAS/HOPNC Fe-N/C 4.1 1.95 6.7 -1.5 0.005
Fe foil
Fe-Fe1 8* 2.45 4.2
2.0 0.003
Fe-Fe2 6* 2.86 5.4

S37
Table S10 Structural parameters extracted from the Ni K-edge EXAFS fitting. (S02=0.76).
S02 is the amplitude reduction factor; CN is the coordination number; R is interatomic distance (the
bond length between central atoms and surrounding coordination atoms); σ2 is Debye-Waller factor
(a measure of thermal and static disorder in absorber-scatterer distances); ΔE0 is edge-energy shift
(the difference between the zero kinetic energy value of the sample and that of the theoretical model).
R factor is used to value the goodness of the fitting.
* This value was fixed during EXAFS fitting, based on the known structure of Ni foil.
Error bounds that characterize the structural parameters obtained by EXAFS spectroscopy were
estimated as N ± 20%; R ± 1%; σ2 ± 20%; ΔE0 ± 20%.
Ni-SAS/HOPNC (FT range: 2.0-10.5 Å-1
; fitting range: 0.5-2.0 Å)
Ni foil (FT range: 2.0-14.0 Å-1
; fitting range: 1.4-3.0 Å)
Sample Scattering
pair CN R(Å) σ
2(10
-3Å
2) ΔE0(eV) R factor
Ni-SAS/HOPNC Ni-N/C 3.9 1.93 5.5 -1.0 0.003
Ni foil Ni-Ni 12* 2.47 4.8 2.5 0.002