supported by res-h/c modelling for industry 2 nd project meeting london, 10 march 2009 luuk...
TRANSCRIPT
Supported by
www.res-h-policy.eu
RES-H/C modelling for industry
2nd Project Meeting
London, 10 March 2009
Luuk BeurskensEnergy research Centre of the Netherlands (ECN)

www.res-h-policy.eu 2
RES-H/C modelling for industry
Contents
• Industry point of view for RES-H/C• A closer look at temperature levels in industry• Back-up solution: estimating energy per temperature level• Constraints limiting the maximum potential• Conclusions
www.res-h-policy.eu 3
RES-H/C modelling for industry
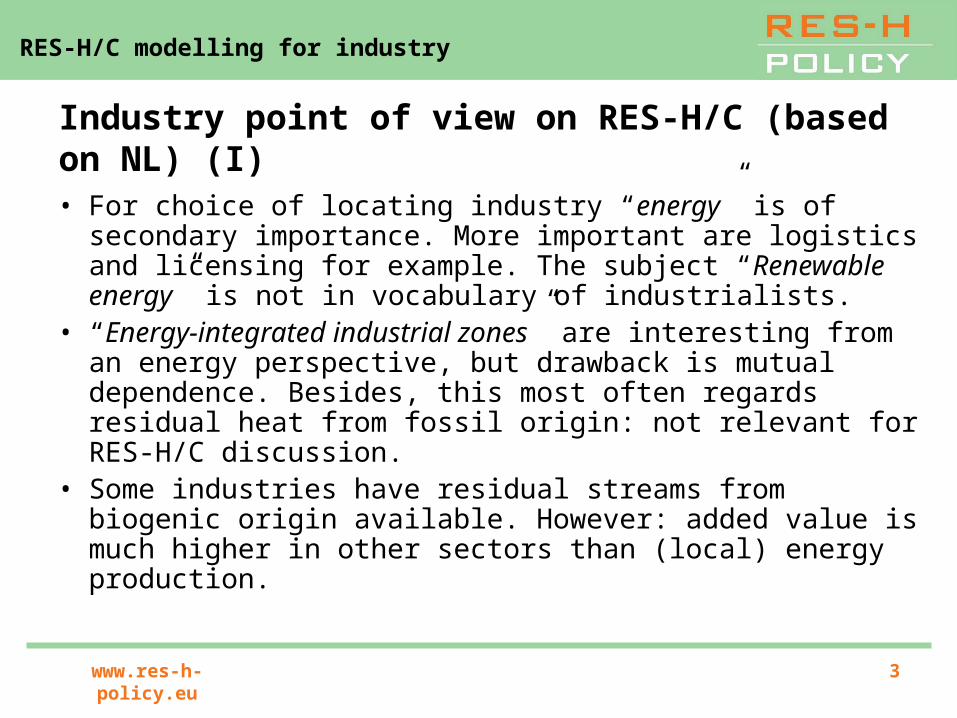
Industry point of view on RES-H/C (based on NL) (I)
• For choice of locating industry “energy” is of secondary importance. More important are logistics and licensing for example. The subject “Renewable energy” is not in vocabulary of industrialists.
• “Energy-integrated industrial zones” are interesting from an energy perspective, but drawback is mutual dependence. Besides, this most often regards residual heat from fossil origin: not relevant for RES-H/C discussion.
• Some industries have residual streams from biogenic origin available. However: added value is much higher in other sectors than (local) energy production.
www.res-h-policy.eu 4
RES-H/C modelling for industry
Industry point of view on RES-H/C (based on NL) (II)
• Preliminary conclusion:
• Renewable energy has a very bad starting position in the industry sector
www.res-h-policy.eu 5
RES-H/C modelling for industry
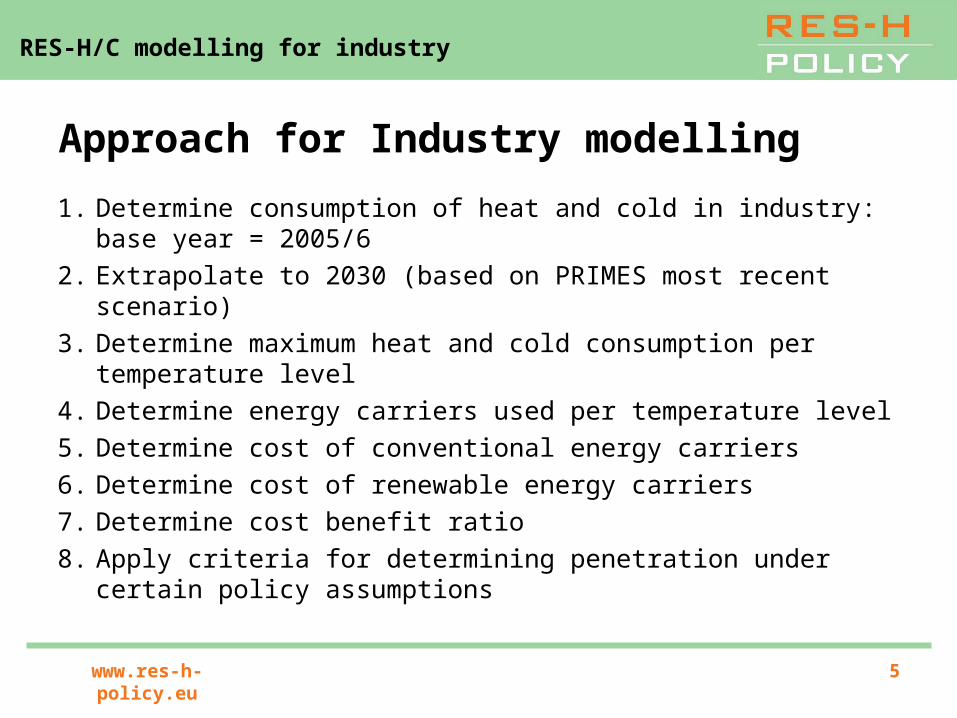
Approach for Industry modelling
1. Determine consumption of heat and cold in industry: base year = 2005/6
2. Extrapolate to 2030 (based on PRIMES most recent scenario)
3. Determine maximum heat and cold consumption per temperature level
4. Determine energy carriers used per temperature level
5. Determine cost of conventional energy carriers
6. Determine cost of renewable energy carriers
7. Determine cost benefit ratio
8. Apply criteria for determining penetration under certain policy assumptions
www.res-h-policy.eu 6
RES-H/C modelling for industry
Approach for Industry modelling
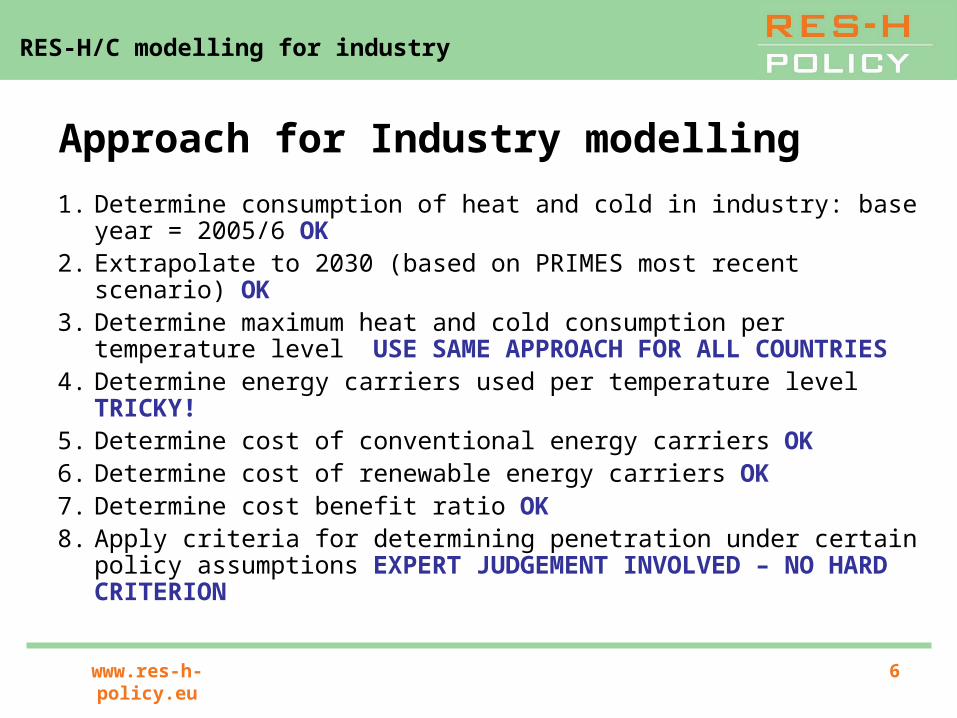
1. Determine consumption of heat and cold in industry: base year = 2005/6 OK
2. Extrapolate to 2030 (based on PRIMES most recent scenario) OK3. Determine maximum heat and cold consumption per temperature
level USE SAME APPROACH FOR ALL COUNTRIES4. Determine energy carriers used per temperature level TRICKY!5. Determine cost of conventional energy carriers OK6. Determine cost of renewable energy carriers OK7. Determine cost benefit ratio OK8. Apply criteria for determining penetration under certain policy
assumptions EXPERT JUDGEMENT INVOLVED – NO HARD CRITERION
www.res-h-policy.eu 7
RES-H/C modelling for industry
A closer look at temperature levels in industry (I)
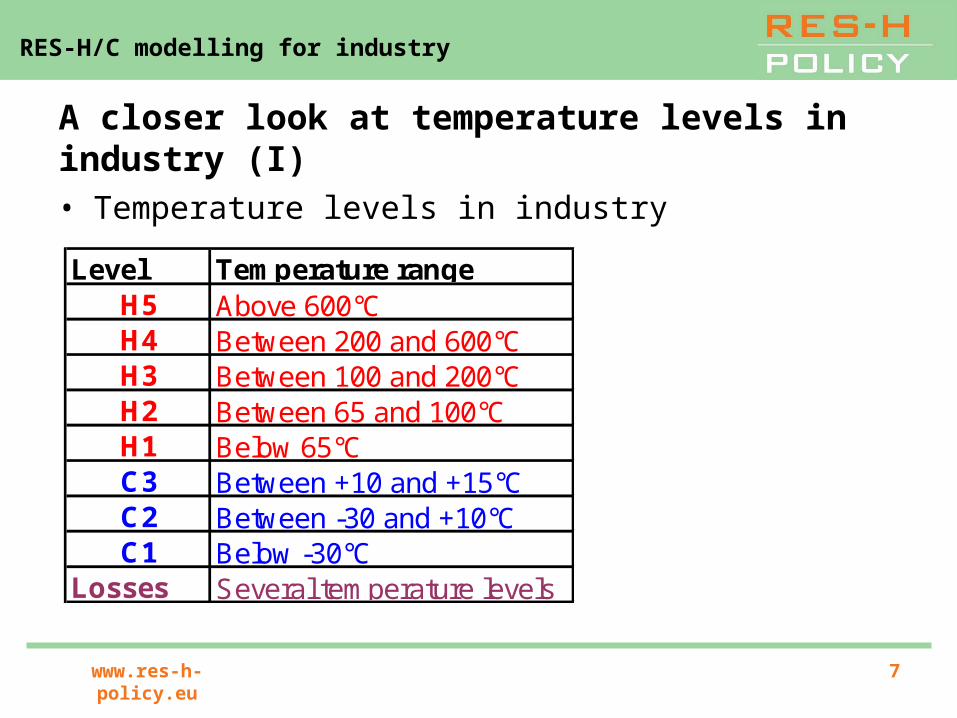
• Temperature levels in industry
Level Temperature rangeH5 Above 600°CH4 Between 200 and 600°CH3 Between 100 and 200°CH2 Between 65 and 100°CH1 Below 65°CC3 Between +10 and +15°CC2 Between -30 and +10°CC1 Below -30°C
Losses Several temperature levels
www.res-h-policy.eu 8
RES-H/C modelling for industry
A closer look at temperature levels in industry (II)
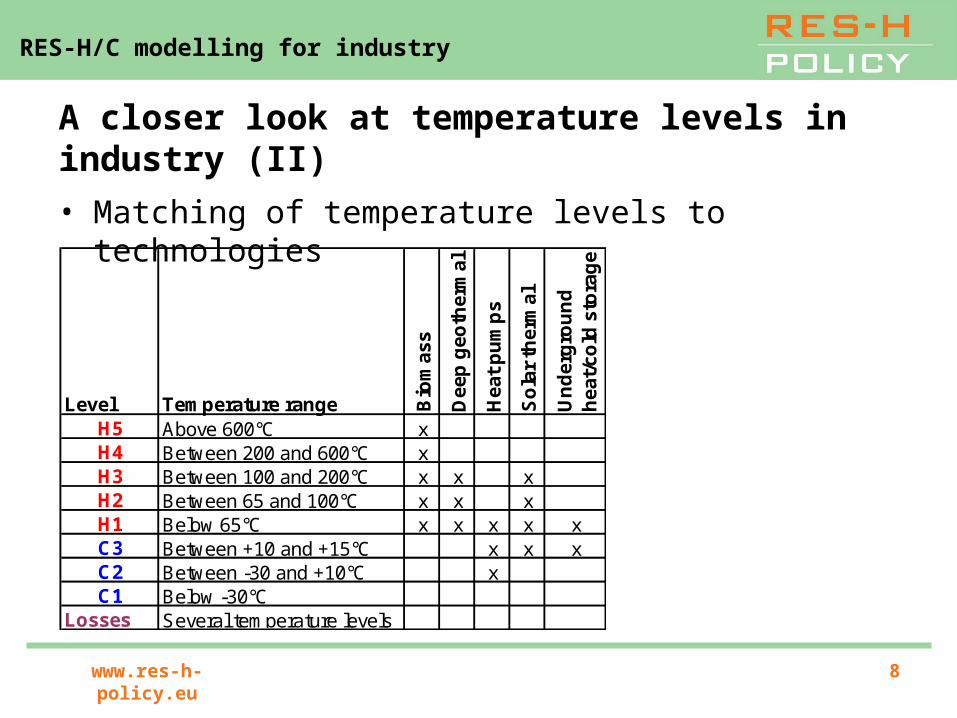
• Matching of temperature levels to technologies
Level Temperature range Bio
mas
s
Dee
p g
eoth
erm
al
Hea
t p
um
ps
So
lar
ther
mal
Un
der
gro
un
dh
eat/
cold
sto
rag
e
H5 Above 600°C xH4 Between 200 and 600°C xH3 Between 100 and 200°C x x xH2 Between 65 and 100°C x x xH1 Below 65°C x x x x xC3 Between +10 and +15°C x x xC2 Between -30 and +10°C xC1 Below -30°C
Losses Several temperature levels

www.res-h-policy.eu 9
RES-H/C modelling for industry
Back-up solution: estimating energy per temperature level• Data from a uniform and mutual consistent source:
Odyssee Indicators, http://www.odyssee-indicators.org• Information for all 27 EU Member States• Information on energy use in 14 industry sectors• Additional assumptions needed for:
─ Share of heat in total energy use─ EU-wide uniform temperature levels per industry sector─ Allocate conventional energy carriers to temperature level
• >> this exercise has been performed for all countries

www.res-h-policy.eu 10
RES-H/C modelling for industry
Austria (draft data, Mtoe)
Indicator Temperature range Indu
stry
Man
ufac
turin
g In
dust
ries
Che
mic
al In
dust
ry
Prim
ary
Met
als
Ste
el In
dust
ry
Non
Fer
rous
Met
als
Non
Met
allic
Min
eral
s
Cem
ent I
ndus
try
Gla
ss In
dust
ry
Woo
d In
dust
ry
Pap
er P
rintin
g In
dust
ry
Pul
p A
nd P
aper
Indu
stry
Foo
d In
dust
ry
Tex
tile
And
Lea
ther
Indu
stry
Mac
hine
ry
Fab
ricat
ed M
etal
s
Tra
nspo
rt E
quip
men
t
Oth
er In
dust
ries
Rub
ber
And
Pla
stic
s
To
tal
H5 Above 600°C 0,2 0,0 0,2 0,6 0,6 0,5 0,7 n.a. n.a. 0,0 0,0 n.a. 0,0 0,0 0,0 n.a. 0,0 0,0 n.a. 17%H4 Between 200 and 600°C 0,1 0,0 0,2 0,2 0,2 0,2 0,3 n.a. n.a. 0,0 0,0 n.a. 0,0 0,0 0,0 n.a. 0,0 0,0 n.a. 8%H3 Between 100 and 200°C 0,3 0,3 0,2 0,1 0,1 0,1 0,1 n.a. n.a. 0,3 0,8 n.a. 0,3 0,2 0,2 n.a. 0,2 0,2 n.a. 21%H2 Between 65 and 100°C 0,4 0,7 0,1 0,1 0,1 0,1 0,1 n.a. n.a. 0,2 0,5 n.a. 0,8 0,7 0,5 n.a. 0,5 0,4 n.a. 33%H1 Below 65°C 0,1 0,3 0,0 0,0 0,0 0,0 0,0 n.a. n.a. 0,1 0,2 n.a. 0,2 0,1 0,2 n.a. 0,2 0,2 n.a. 9%C3 Between +10 and +15°C 0,0 0,1 0,0 0,0 0,0 0,0 0,0 n.a. n.a. 0,0 0,0 n.a. 0,1 0,0 0,1 n.a. 0,1 0,1 n.a. 4%C2 Between -30 and +10°C 0,0 0,0 0,0 0,0 0,0 0,0 0,0 n.a. n.a. 0,0 0,0 n.a. 0,2 0,0 0,0 n.a. 0,0 0,0 n.a. 1%C1 Below -30°C 0,0 0,0 0,1 0,0 0,0 0,0 0,0 n.a. n.a. 0,0 0,0 n.a. 0,0 0,0 0,0 n.a. 0,0 0,0 n.a. 1%Losses Several temperature levels 0,1 0,0 0,0 0,1 0,1 0,1 0,1 n.a. n.a. 0,1 0,2 n.a. 0,1 0,1 0,0 n.a. 0,0 0,0 n.a. 6%
Total 1,2 1,4 0,8 1,1 1,2 0,9 1,4 n.a. n.a. 0,6 1,5 n.a. 1,5 1,2 1,1 n.a. 1,1 0,9 n.a. 100%

www.res-h-policy.eu 11
RES-H/C modelling for industry
Greece (draft data, Mtoe)
Indicator Temperature range Indu
stry
Man
ufac
turin
g In
dust
ries
Che
mic
al In
dust
ry
Prim
ary
Met
als
Ste
el In
dust
ry
Non
Fer
rous
Met
als
Non
Met
allic
Min
eral
s
Cem
ent I
ndus
try
Gla
ss In
dust
ry
Woo
d In
dust
ry
Pap
er P
rintin
g In
dust
ry
Pul
p A
nd P
aper
Indu
stry
Foo
d In
dust
ry
Tex
tile
And
Lea
ther
Indu
stry
Mac
hine
ry
Fab
ricat
ed M
etal
s
Tra
nspo
rt E
quip
men
t
Oth
er In
dust
ries
Rub
ber
And
Pla
stic
s
To
tal
H5 Above 600°C 0,1 0,0 0,1 0,2 0,1 0,2 0,4 0,5 n.a. n.a. 0,0 n.a. 0,0 0,0 0,0 n.a. n.a. 0,0 n.a. 20%H4 Between 200 and 600°C 0,1 0,0 0,2 0,1 0,0 0,1 0,2 0,2 n.a. n.a. 0,0 n.a. 0,0 0,0 0,0 n.a. n.a. 0,0 n.a. 10%H3 Between 100 and 200°C 0,2 0,2 0,1 0,0 0,0 0,0 0,1 0,1 n.a. n.a. 0,4 n.a. 0,2 0,1 0,1 n.a. n.a. 0,2 n.a. 19%H2 Between 65 and 100°C 0,2 0,4 0,1 0,0 0,0 0,0 0,1 0,1 n.a. n.a. 0,2 n.a. 0,5 0,4 0,2 n.a. n.a. 0,5 n.a. 31%H1 Below 65°C 0,1 0,2 0,0 0,0 0,0 0,0 0,0 0,0 n.a. n.a. 0,1 n.a. 0,1 0,1 0,1 n.a. n.a. 0,2 n.a. 8%C3 Between +10 and +15°C 0,0 0,1 0,0 0,0 0,0 0,0 0,0 0,0 n.a. n.a. 0,0 n.a. 0,0 0,0 0,0 n.a. n.a. 0,1 n.a. 3%C2 Between -30 and +10°C 0,0 0,0 0,0 0,0 0,0 0,0 0,0 0,0 n.a. n.a. 0,0 n.a. 0,1 0,0 0,0 n.a. n.a. 0,0 n.a. 1%C1 Below -30°C 0,0 0,0 0,1 0,0 0,0 0,0 0,0 0,0 n.a. n.a. 0,0 n.a. 0,0 0,0 0,0 n.a. n.a. 0,0 n.a. 1%Losses Several temperature levels 0,0 0,0 0,0 0,0 0,0 0,0 0,1 0,1 n.a. n.a. 0,1 n.a. 0,0 0,1 0,0 n.a. n.a. 0,0 n.a. 6%
Total 0,7 0,9 0,6 0,4 0,2 0,4 0,8 1,1 n.a. n.a. 0,8 n.a. 0,9 0,7 0,4 n.a. n.a. 1,0 n.a. 100%

www.res-h-policy.eu 12
RES-H/C modelling for industry
Lithuania (draft data, Mtoe)
Indicator Temperature range Indu
stry
Man
ufac
turin
g In
dust
ries
Che
mic
al In
dust
ry
Prim
ary
Met
als
Ste
el In
dust
ry
Non
Fer
rous
Met
als
Non
Met
allic
Min
eral
s
Cem
ent I
ndus
try
Gla
ss In
dust
ry
Woo
d In
dust
ry
Pap
er P
rintin
g In
dust
ry
Pul
p A
nd P
aper
Indu
stry
Foo
d In
dust
ry
Tex
tile
And
Lea
ther
Indu
stry
Mac
hine
ry
Fab
ricat
ed M
etal
s
Tra
nspo
rt E
quip
men
t
Oth
er In
dust
ries
Rub
ber
And
Pla
stic
s
To
tal
H5 Above 600°C 0,0 0,0 0,0 0,0 0,0 n.a. 0,1 n.a. n.a. 0,0 0,0 n.a. 0,0 0,0 0,0 0,0 0,0 0,0 n.a. 6%H4 Between 200 and 600°C 0,0 0,0 0,0 0,0 0,0 n.a. 0,0 n.a. n.a. 0,0 0,0 n.a. 0,0 0,0 0,0 0,0 0,0 0,0 n.a. 4%H3 Between 100 and 200°C 0,0 0,0 0,0 0,0 0,0 n.a. 0,0 n.a. n.a. 0,0 0,1 n.a. 0,0 0,0 0,0 0,0 0,0 0,0 n.a. 24%H2 Between 65 and 100°C 0,1 0,1 0,0 0,0 0,0 n.a. 0,0 n.a. n.a. 0,0 0,0 n.a. 0,1 0,1 0,1 0,1 0,1 0,0 n.a. 41%H1 Below 65°C 0,0 0,0 0,0 0,0 0,0 n.a. 0,0 n.a. n.a. 0,0 0,0 n.a. 0,0 0,0 0,0 0,0 0,0 0,0 n.a. 13%C3 Between +10 and +15°C 0,0 0,0 0,0 0,0 0,0 n.a. 0,0 n.a. n.a. 0,0 0,0 n.a. 0,0 0,0 0,0 0,0 0,0 0,0 n.a. 5%C2 Between -30 and +10°C 0,0 0,0 0,0 0,0 0,0 n.a. 0,0 n.a. n.a. 0,0 0,0 n.a. 0,0 0,0 0,0 0,0 0,0 0,0 n.a. 2%C1 Below -30°C 0,0 0,0 0,0 0,0 0,0 n.a. 0,0 n.a. n.a. 0,0 0,0 n.a. 0,0 0,0 0,0 0,0 0,0 0,0 n.a. 1%Losses Several temperature levels 0,0 0,0 0,0 0,0 0,0 n.a. 0,0 n.a. n.a. 0,0 0,0 n.a. 0,0 0,0 0,0 0,0 0,0 0,0 n.a. 5%
Total 0,2 0,2 0,1 0,0 0,0 n.a. 0,2 n.a. n.a. 0,1 0,2 n.a. 0,2 0,2 0,2 0,1 0,1 0,1 n.a. 100%

www.res-h-policy.eu 13
RES-H/C modelling for industry
Netherlands (draft data, Mtoe)
Indicator Temperature range Indu
stry
Man
ufac
turin
g In
dust
ries
Che
mic
al In
dust
ry
Prim
ary
Met
als
Ste
el In
dust
ry
Non
Fer
rous
Met
als
Non
Met
allic
Min
eral
s
Cem
ent I
ndus
try
Gla
ss In
dust
ry
Woo
d In
dust
ry
Pap
er P
rintin
g In
dust
ry
Pul
p A
nd P
aper
Indu
stry
Foo
d In
dust
ry
Tex
tile
And
Lea
ther
Indu
stry
Mac
hine
ry
Fab
ricat
ed M
etal
s
Tra
nspo
rt E
quip
men
t
Oth
er In
dust
ries
Rub
ber
And
Pla
stic
s
To
tal
H5 Above 600°C 0,4 0,0 0,4 1,1 1,4 0,1 1,3 n.a. 1,5 0,0 0,0 0,0 0,0 0,0 0,0 0,0 0,0 0,0 0,0 17%H4 Between 200 and 600°C 0,2 0,0 0,6 0,5 0,6 0,0 0,5 n.a. 0,6 0,0 0,0 0,0 0,0 0,0 0,0 0,0 0,0 0,0 0,0 8%H3 Between 100 and 200°C 0,6 0,6 0,4 0,2 0,3 0,0 0,3 n.a. 0,3 0,3 1,3 0,3 0,6 0,5 0,4 0,4 0,4 0,3 0,6 21%H2 Between 65 and 100°C 0,9 1,5 0,2 0,2 0,3 0,0 0,3 n.a. 0,3 0,2 0,8 1,0 1,4 1,6 1,1 1,1 1,1 0,8 0,4 34%H1 Below 65°C 0,2 0,6 0,0 0,0 0,0 0,0 0,0 n.a. 0,0 0,1 0,3 0,2 0,3 0,3 0,4 0,4 0,4 0,3 0,1 9%C3 Between +10 and +15°C 0,1 0,3 0,0 0,0 0,0 0,0 0,0 n.a. 0,0 0,0 0,0 0,0 0,1 0,0 0,2 0,2 0,2 0,2 0,0 3%C2 Between -30 and +10°C 0,0 0,0 0,1 0,0 0,0 0,0 0,0 n.a. 0,0 0,0 0,0 0,0 0,3 0,0 0,0 0,0 0,0 0,0 0,0 1%C1 Below -30°C 0,0 0,0 0,2 0,0 0,0 0,0 0,0 n.a. 0,0 0,0 0,0 0,0 0,0 0,0 0,0 0,0 0,0 0,0 0,0 1%Losses Several temperature levels 0,2 0,0 0,1 0,2 0,3 0,0 0,3 n.a. 0,3 0,1 0,3 0,2 0,1 0,3 0,0 0,0 0,0 0,0 0,1 6%
Total 2,5 3,0 2,1 2,3 2,8 0,2 2,6 n.a. 3,1 0,7 2,5 1,7 2,8 2,7 2,2 2,2 2,1 1,5 1,2 100%
www.res-h-policy.eu 14
RES-H/C modelling for industry
Poland (draft data, Mtoe)
Indicator Temperature range Indu
stry
Man
ufac
turin
g In
dust
ries
Che
mic
al In
dust
ry
Prim
ary
Met
als
Ste
el In
dust
ry
Non
Fer
rous
Met
als
Non
Met
allic
Min
eral
s
Cem
ent I
ndus
try
Gla
ss In
dust
ry
Woo
d In
dust
ry
Pap
er P
rintin
g In
dust
ry
Pul
p A
nd P
aper
Indu
stry
Foo
d In
dust
ry
Tex
tile
And
Lea
ther
Indu
stry
Mac
hine
ry
Fab
ricat
ed M
etal
s
Tra
nspo
rt E
quip
men
t
Oth
er In
dust
ries
Rub
ber
And
Pla
stic
s
To
tal
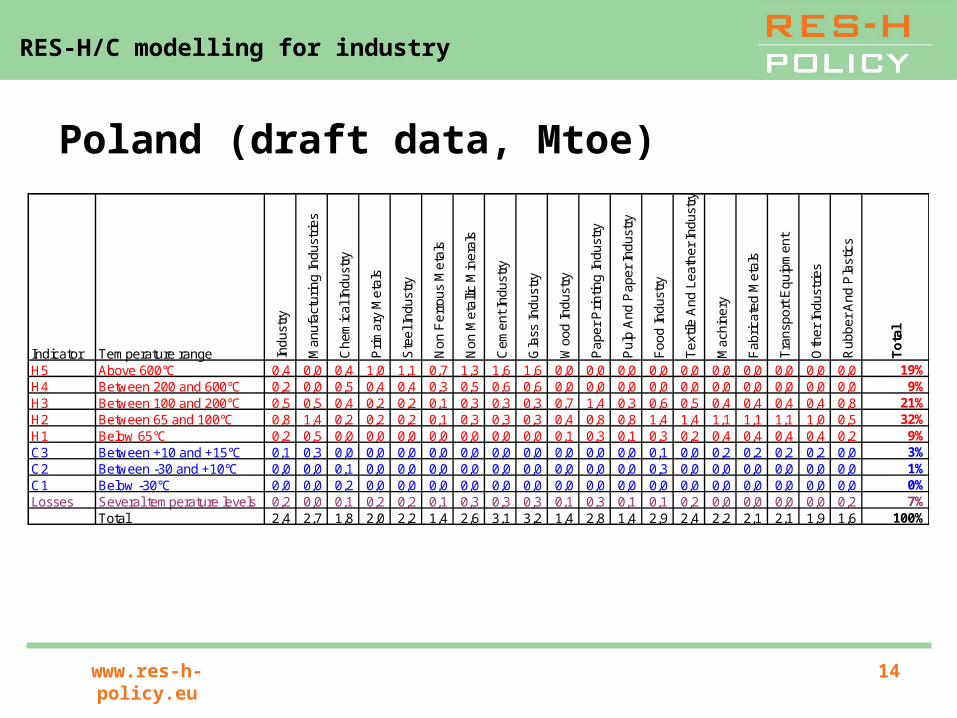
H5 Above 600°C 0,4 0,0 0,4 1,0 1,1 0,7 1,3 1,6 1,6 0,0 0,0 0,0 0,0 0,0 0,0 0,0 0,0 0,0 0,0 19%H4 Between 200 and 600°C 0,2 0,0 0,5 0,4 0,4 0,3 0,5 0,6 0,6 0,0 0,0 0,0 0,0 0,0 0,0 0,0 0,0 0,0 0,0 9%H3 Between 100 and 200°C 0,5 0,5 0,4 0,2 0,2 0,1 0,3 0,3 0,3 0,7 1,4 0,3 0,6 0,5 0,4 0,4 0,4 0,4 0,8 21%H2 Between 65 and 100°C 0,8 1,4 0,2 0,2 0,2 0,1 0,3 0,3 0,3 0,4 0,8 0,8 1,4 1,4 1,1 1,1 1,1 1,0 0,5 32%H1 Below 65°C 0,2 0,5 0,0 0,0 0,0 0,0 0,0 0,0 0,0 0,1 0,3 0,1 0,3 0,2 0,4 0,4 0,4 0,4 0,2 9%C3 Between +10 and +15°C 0,1 0,3 0,0 0,0 0,0 0,0 0,0 0,0 0,0 0,0 0,0 0,0 0,1 0,0 0,2 0,2 0,2 0,2 0,0 3%C2 Between -30 and +10°C 0,0 0,0 0,1 0,0 0,0 0,0 0,0 0,0 0,0 0,0 0,0 0,0 0,3 0,0 0,0 0,0 0,0 0,0 0,0 1%C1 Below -30°C 0,0 0,0 0,2 0,0 0,0 0,0 0,0 0,0 0,0 0,0 0,0 0,0 0,0 0,0 0,0 0,0 0,0 0,0 0,0 0%Losses Several temperature levels 0,2 0,0 0,1 0,2 0,2 0,1 0,3 0,3 0,3 0,1 0,3 0,1 0,1 0,2 0,0 0,0 0,0 0,0 0,2 7%
Total 2,4 2,7 1,8 2,0 2,2 1,4 2,6 3,1 3,2 1,4 2,8 1,4 2,9 2,4 2,2 2,1 2,1 1,9 1,6 100%
www.res-h-policy.eu 15
RES-H/C modelling for industry
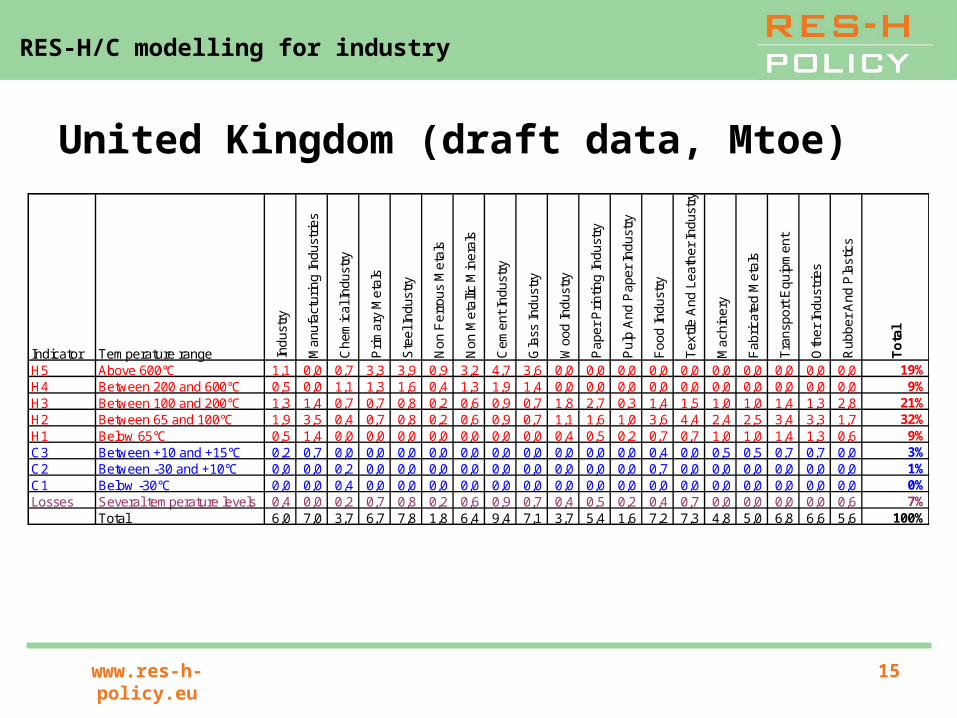
United Kingdom (draft data, Mtoe)
Indicator Temperature range Indu
stry
Man
ufac
turin
g In
dust
ries
Che
mic
al In
dust
ry
Prim
ary
Met
als
Ste
el In
dust
ry
Non
Fer
rous
Met
als
Non
Met
allic
Min
eral
s
Cem
ent I
ndus
try
Gla
ss In
dust
ry
Woo
d In
dust
ry
Pap
er P
rintin
g In
dust
ry
Pul
p A
nd P
aper
Indu
stry
Foo
d In
dust
ry
Tex
tile
And
Lea
ther
Indu
stry
Mac
hine
ry
Fab
ricat
ed M
etal
s
Tra
nspo
rt E
quip
men
t
Oth
er In
dust
ries
Rub
ber
And
Pla
stic
s
To
tal
H5 Above 600°C 1,1 0,0 0,7 3,3 3,9 0,9 3,2 4,7 3,6 0,0 0,0 0,0 0,0 0,0 0,0 0,0 0,0 0,0 0,0 19%H4 Between 200 and 600°C 0,5 0,0 1,1 1,3 1,6 0,4 1,3 1,9 1,4 0,0 0,0 0,0 0,0 0,0 0,0 0,0 0,0 0,0 0,0 9%H3 Between 100 and 200°C 1,3 1,4 0,7 0,7 0,8 0,2 0,6 0,9 0,7 1,8 2,7 0,3 1,4 1,5 1,0 1,0 1,4 1,3 2,8 21%H2 Between 65 and 100°C 1,9 3,5 0,4 0,7 0,8 0,2 0,6 0,9 0,7 1,1 1,6 1,0 3,6 4,4 2,4 2,5 3,4 3,3 1,7 32%H1 Below 65°C 0,5 1,4 0,0 0,0 0,0 0,0 0,0 0,0 0,0 0,4 0,5 0,2 0,7 0,7 1,0 1,0 1,4 1,3 0,6 9%C3 Between +10 and +15°C 0,2 0,7 0,0 0,0 0,0 0,0 0,0 0,0 0,0 0,0 0,0 0,0 0,4 0,0 0,5 0,5 0,7 0,7 0,0 3%C2 Between -30 and +10°C 0,0 0,0 0,2 0,0 0,0 0,0 0,0 0,0 0,0 0,0 0,0 0,0 0,7 0,0 0,0 0,0 0,0 0,0 0,0 1%C1 Below -30°C 0,0 0,0 0,4 0,0 0,0 0,0 0,0 0,0 0,0 0,0 0,0 0,0 0,0 0,0 0,0 0,0 0,0 0,0 0,0 0%Losses Several temperature levels 0,4 0,0 0,2 0,7 0,8 0,2 0,6 0,9 0,7 0,4 0,5 0,2 0,4 0,7 0,0 0,0 0,0 0,0 0,6 7%
Total 6,0 7,0 3,7 6,7 7,8 1,8 6,4 9,4 7,1 3,7 5,4 1,6 7,2 7,3 4,8 5,0 6,8 6,6 5,6 100%
www.res-h-policy.eu 16
RES-H/C modelling for industry
Constraints limiting the maximum potential
• Once the total energy demand per temperature level are known, these can be matched to the technologies suitable for that level.
• However, other circumstances limit the realisable potential for RES-H/C technologies in industry:─ Sector-specific requirements─ Non-financial barriers─ Power and capacity requirements─ The existing energy technologies in place (wait for natural
moment for replacement)─ Cost-benefit ratio─ Etc.

www.res-h-policy.eu 17
RES-H/C modelling for industry
Conclusions
• RES-H/C and industry are not natural allies • RES-H/C technologies perform best at their own,
technology-specific, temperature level• By applying generic assumptions, data from the
Odyssee Indicator project allow to estimate energy demand in industry subdivided into temperature level
• Assumption: fuels used in each temperature level have same distribution as in overall industry mix
• Additional, country-specific assumptions on suitability of RES-H/C options, further limit the potential

www.res-h-policy.eu 18
RES-H/C modelling for industry
Thank you for your attention