support for a comprehensive background check requirement ... background check... · support for a...
TRANSCRIPT
Journal of Urban Health: Bulletin of the New York Academy of Medicinedoi:10.1007/s11524-013-9842-7* 2013 The New York Academy of Medicine
Support for a Comprehensive Background CheckRequirement and Expanded Denial Criteriafor Firearm Transfers: Findings from the FirearmsLicensee Survey
Garen J. Wintemute
ABSTRACT Federal and state policies on eligibility to purchase and possess firearms andbackground check requirements for firearm transfers are undergoing intensive reviewand, in some cases, modification. Our objective in this third report from the FirearmsLicensee Survey (FLS) is to assess support among federally licensed firearms retailers(gun dealers and pawnbrokers) for a background check requirement on all firearmtransfers and selected criteria for denying the purchase of handguns based on criminalconvictions, alcohol abuse, and serious mental illness. The FLS was conducted by mailduring June–August, 2011 on a random sample of 1,601 licensed dealers andpawnbrokers in 43 states who were believed to sell at least 50 firearms annually. Theresponse rate was 36.9 %, typical of establishment surveys using such methods. Mostrespondents (55.4 %) endorsed a comprehensive background check requirement;37.5 % strongly favored it. Support was more common and stronger amongpawnbrokers than dealers and among respondents who believed that “it is too easyfor criminals to get guns.” Support was positively associated with many establishmentcharacteristics, including sales of inexpensive handguns, sales that were denied when thepurchasers failed background checks, and sales of firearms that were later subjected toownership tracing, and were negatively associated with sales at gun shows. Support forthree existing and nine potential criteria for denial of handgun purchase involvingcriminal activity, alcohol abuse, and mental illness exceeded 90 % in six cases and fellbelow 2/3 in one. Support again increased with sales of inexpensive handguns anddenied sales and decreased with sales of tactical (assault-type) rifles. In this survey,which was conducted prior to mass shootings in Aurora, Colorado; Oak Creek,Wisconsin; Newtown, Connecticut; and elsewhere, licensed firearm sellers exhibitedmoderate support for a comprehensive background check requirement and very strongsupport for additional criteria for denial of handgun purchases. In both cases, supportwas associated with the intensity of respondents’ exposure to illegal activities.
KEYWORDS Firearms, Crime, Violence, Alcohol, Firearms policy, Federal firearmslicensees
INTRODUCTION
Firearm violence “poses a serious threat to the safety andwelfare of the American public,”1
with mortality rates that have remained essentially unchanged for more than a decade.2,3
Wintemute is with the School of Medicine, University of California, Davis, 2315 Stockton Blvd,Sacramento, CA 95817, USA.
Correspondence: Garen J. Wintemute, School of Medicine, University of California, Davis, 2315Stockton Blvd, Sacramento, CA 95817, USA. (E-mail: [email protected])
Electronic supplementary material The online version of this article (doi:10.1007/s11524-013-9842-7)contains supplementary material, which is available to authorized users.
There were an estimated 467,321 firearm-related violent crimes in the USA in 2011, a26 % increase since 2008.4 Fear of becoming an unintended victim of gunfireintended for someone else is widespread and alters the pattern of life in entirecommunities.5–7
As one means of preventing firearm violence, federal statute prohibits thepurchase and possession of firearms by persons convicted of any felony or a“misdemeanor crime of domestic violence,” anyone who is “an unlawful user of oraddicted to any controlled substance,” has been “adjudicated as a mental defective”or “committed to any mental institution,” and others.8 (For simplicity’s sake,“purchase” and “sale” will be used here to refer to acquisitions and transfers of alltypes.) Recent Supreme Court decisions have affirmed that any individual right topurchase and possess firearms is subject to restriction,9,10 but there is no agreementon what those restrictions should be.
To identify prohibited persons as they attempt to acquire firearms, the BradyHandgun Violence Prevention Act requires that a background check be performedfor purchases from federal firearms licensees (FFLs) such as firearms dealers andpawnbrokers. In 2010, federal and state agencies conducted 10.4 million back-ground checks; more than 150,000 purchases were denied when background checksfound the buyers to be prohibited persons.11
While background checks and denials appear to reduce risk for subsequentviolent and firearm-related crime among those whose purchases are denied,12–14 theBrady Act has been found have no effect on rates of firearm homicide.15 The Act’srequirements, however, do not apply to firearm transfers by unlicensed privateparties. These account for some 40 % of firearm acquisitions overall in the USA16
and at least 80 % of acquisitions made with criminal intent.17–19 In addition, federaldenial criteria are limited in scope, and identifiable subgroups of persons who legallypurchase firearms under those criteria are at greatly increased risk for committingsubsequent crimes.19–21
States have acted to address these gaps in federal regulation. Six states havelongstanding policies requiring background checks for all firearm purchases,including private party sales, and 10 others have required checks for all handgunsales or sales at gun shows.22 In 2013, four of these 10 states (Colorado,Connecticut, Maryland, and New York) and Delaware have enacted comprehensivebackground check requirements. Many states have at one time or another enactedadditional criteria for denial of purchase, such as alcohol abuse and convictions forviolent misdemeanors.22
In 2011, we conducted the Firearms Licensee Survey, an establishment survey ofFFLs, in part to assess their support for a comprehensive background check policyand selected current and potential criteria for denial of purchase.23,24 Our targetpopulation was the owners, managers, or other senior executives of FFLs that wereactively engaged in retail firearm sales. This population has uniquely detailedknowledge of the operations of retail firearm commerce and would be directlyinvolved in implementing any such policies.
Our primary hypothesis was that respondents would support a comprehensivebackground check policy and all suggested denial criteria. Our secondary hypothesiswas that support would increase with respondents’ exposure to illegal activity involvingthe purchase and use of firearms: attempted illegal transactions, including surrogate or“straw” purchases and off-the-books purchases; denied sales; and sales of firearms thatwere later recovered by law enforcement agencies and subjected to ownership tracing,generally following use in a crime.
WINTEMUTE
METHODS
The design and execution of the survey have been described in detail in this journal23 andelsewhere;24 those descriptions are summarized here. We use “retailer” only to refer toan individual person.
Identifying the Study PopulationWe used the February 2011 FFL roster25 to identify 55,020 retail licensees: dealersand gunsmiths (Type 01 licenses), and pawnbrokers (Type 02 licenses). We restrictedstudy eligibility to the 9,720 retail licensees who sold an estimated 50 or morefirearms annually, based on data supplied by the Federal Bureau of Investigation (seesupplementary material). These data were not available for seven states. A randomsample of 1,601 licensees in the 43 remaining states, stratified by license type, wasdrawn using PROC SURVEYSELECT in SAS software.26 The sample size waschosen to provide 95 % confidence intervals of ±3 % when equal proportions ofrespondents provided alternate responses to questions with two possible answersand the response rate was 60 %.27
Questionnaire DesignWe followed validated recommendations by Dillman and colleagues in designing thequestionnaire (see supplementary material).27,28 Where feasible, questions wereconstructed to facilitate comparisons to previous survey research.29,30
The question on comprehensive background checks was preceded by this briefintroduction: “When you sell a gun as a licensed retailer, the buyer usually must gothrough a background check. In most states, this background check requirementdoes not apply to gun sales by private individuals. Some retailers believe this is aproblem, because prohibited persons can easily buy guns if there is no backgroundcheck.” Subjects were then asked, “How strongly would you favor or opposerequiring that gun sales by private individuals include background checks?” Fiveresponse options ranged from “strongly favor” to “strongly oppose.”
The questionnaire next presented a list of seven crimes (aggravated assault,involving a lethal weapon or serious injury; armed robbery; possession of equipmentfor illegal drug use; assault and battery, not involving a lethal weapon or seriousinjury; assault and battery on an intimate partner: domestic violence; resisting arrest;publicly displaying a firearm in a threatening manner) and asked subjects in eachcase to “indicate whether you think persons who have been convicted of the crimeSHOULD or SHOULD NOT be able to purchase handguns.” Finally, subjects werepresented with 5 “conditions involving alcohol, drugs, and mental illness” andasked to respond as just described.
As reported previously,23,24 subjects provided demographics and their generalattitudes about firearms and working in the firearms industry. They gave detailedinformation about their business practices, including the number and types offirearms sold (assault-type rifles were described as “tactical or modern sporting”rifles); sales at gun shows and over the Internet; and sales to women, lawenforcement officers, and purchasers who bought multiple firearms in a shortperiod of time. They specified how frequently they received requests for assistance intracing a firearm and the percentage of their sales that were denied following abackground check. They reported how often they experienced attempts to buyfirearms illegally, through surrogate (straw) purchases and purchases withoutbackground checks, and whether firearms had been stolen from their business
COMPREHENSIVE BACKGROUND CHECKS AND EXPANDED DENIAL CRITERIA
inventory. Finally, they estimated the percentage of licensed retailers who“knowingly participate in illegal gun sales” and gave recommended terms ofincarceration for an individual who purchased, and a licensed retailer whoknowingly sold, 50 firearms as part of a “gun trafficking operation.”
Survey ImplementationWe conducted the survey by mail, again following validated procedures recom-mended by Dillman and colleagues,27 beginning June 16, 2011 (see supplementarymaterial). This time of slower business activity31 was chosen to improve theresponse rate.
The survey protocol required up to three questionnaire mailings; we included a $3cash incentive in the first. We sent personalized letters to the chief executive orregulatory officer of the 25 corporations with more than one licensee in our sample,requesting that they authorize store managers to participate.
Data management and statistical analysisWe determined response and refusal rates and questionnaire completeness usingguidelines set by the American Association for Public Opinion Research.32 Theresponse rate was the percentage of subjects in the sample who returned filled-outquestionnaires. Complete questionnaires provided answers to 980 % of questions,partial questionnaires to 50–80 %, and break-off questionnaires to G50 %.
All licensees in the sample were categorized by general business structure: thelicensee was an individual named person; the licensee was a corporation, and onlyone establishment owned by that corporation appeared in the sample (corporate/single site); the licensee was a corporation, and multiple establishments owned bythat corporation appeared in the sample (corporate/multisite). Respondents knownnot to be owners, managers, or other senior executives (n=21) or of undeterminedstatus (n=27) were excluded from the analysis. A categorical variable summarizingthe number of new denial criteria endorsed by respondents was specified as all 9, 7–8, ≤6.
We used binary and ordinal logistic regression, expressing results as Odds Ratios(ORs) with 95 % Confidence Intervals (CIs), to model associations betweenoutcome and explanatory variables. For multivariable models, variables with pG0.20 in bivariate regression were entered into an initial model, with elimination inorder of decreasing p until remaining variables had p≤0.10. The threshold forstatistical significance was pG0.05. Analyses were performed using SAS 9.1.3 forWindows.26
The UC Davis institutional review board approved this project.
RESULTS
The response rate was 36.9 % (591 of 1,601). Of the returned questionnaires,96.3 % were complete and 3.7 % were partial. Response rates for dealers andpawnbrokers were similar: 37.2 and 36.3 %, respectively, p=0.75. The response ratefor employees of corporate/multisite licensees (19.7 %) was less than half that foremployees of corporate/single site licensees (41.1 %) or licensees who were namedindividual persons (40.5 %), pG0.0001. Further detail on response rated is reportedelsewhere.23,24 Completion rates for questions on background checks and denialcriteria were ≥97 %.
WINTEMUTE
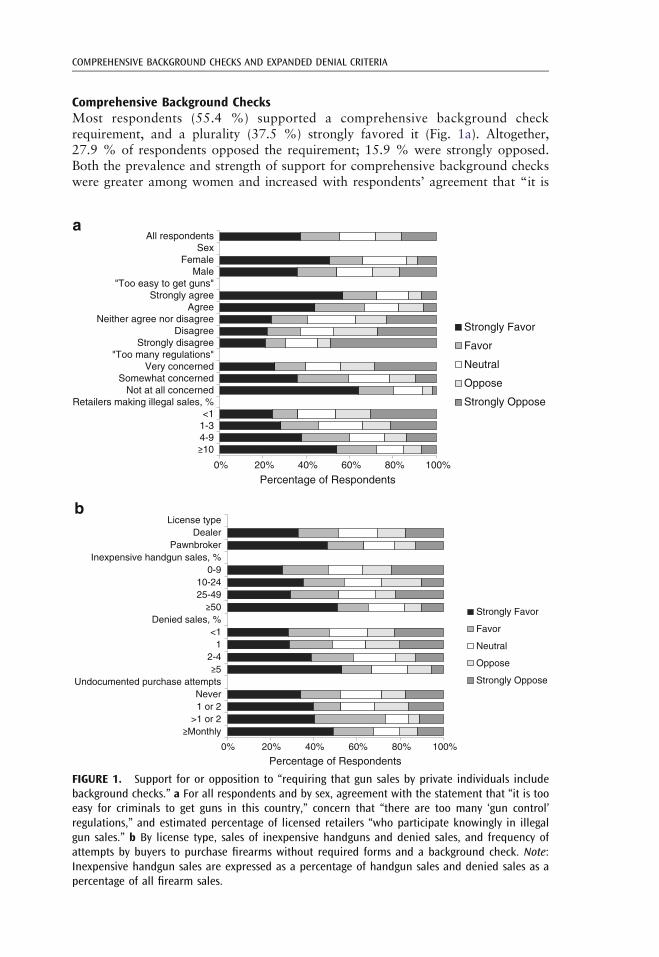
Comprehensive Background ChecksMost respondents (55.4 %) supported a comprehensive background checkrequirement, and a plurality (37.5 %) strongly favored it (Fig. 1a). Altogether,27.9 % of respondents opposed the requirement; 15.9 % were strongly opposed.Both the prevalence and strength of support for comprehensive background checkswere greater among women and increased with respondents’ agreement that “it is
0% 20% 40% 60% 80% 100%
104-91-3<1
Retailers making illegal sales, %Not at all concerned
Somewhat concernedVery concerned
"Too many regulations"Strongly disagree
DisagreeNeither agree nor disagree
AgreeStrongly agree
"Too easy to get guns"Male
FemaleSex
All respondents
Percentage of Respondents
Strongly Favor
Favor
Neutral
Oppose
Strongly Oppose
a
0% 20% 40% 60% 80% 100%
Monthly>1 or 2
1 or 2Never
Undocumented purchase attempts5
2-41
<1Denied sales, %
5025-4910-24
0-9Inexpensive handgun sales, %
PawnbrokerDealer
License type
Percentage of Respondents
Strongly Favor
Favor
Neutral
Oppose
Strongly Oppose
b
FIGURE 1. Support for or opposition to “requiring that gun sales by private individuals includebackground checks.” a For all respondents and by sex, agreement with the statement that “it is tooeasy for criminals to get guns in this country,” concern that “there are too many ‘gun control’regulations,” and estimated percentage of licensed retailers “who participate knowingly in illegalgun sales.” b By license type, sales of inexpensive handguns and denied sales, and frequency ofattempts by buyers to purchase firearms without required forms and a background check. Note:Inexpensive handgun sales are expressed as a percentage of handgun sales and denied sales as apercentage of all firearm sales.
COMPREHENSIVE BACKGROUND CHECKS AND EXPANDED DENIAL CRITERIA
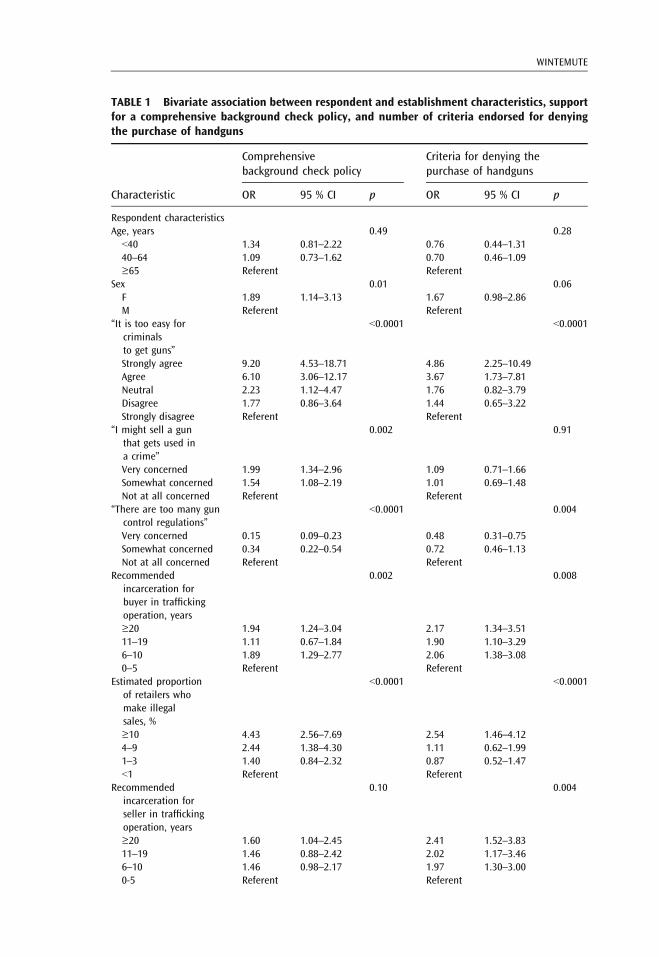
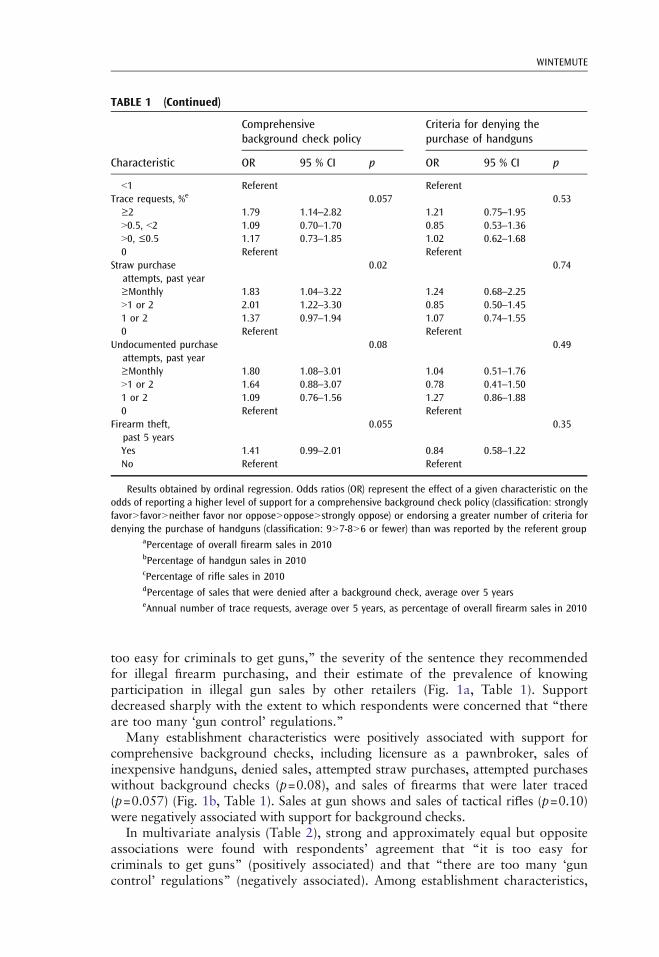
TABLE 1 Bivariate association between respondent and establishment characteristics, supportfor a comprehensive background check policy, and number of criteria endorsed for denyingthe purchase of handguns
Characteristic
Comprehensivebackground check policy
Criteria for denying thepurchase of handguns
OR 95 % CI p OR 95 % CI p
Respondent characteristicsAge, years 0.49 0.28G40 1.34 0.81–2.22 0.76 0.44–1.3140–64 1.09 0.73–1.62 0.70 0.46–1.09≥65 Referent Referent
Sex 0.01 0.06F 1.89 1.14–3.13 1.67 0.98–2.86M Referent Referent
“It is too easy forcriminalsto get guns”
G0.0001 G0.0001
Strongly agree 9.20 4.53–18.71 4.86 2.25–10.49Agree 6.10 3.06–12.17 3.67 1.73–7.81Neutral 2.23 1.12–4.47 1.76 0.82–3.79Disagree 1.77 0.86–3.64 1.44 0.65–3.22Strongly disagree Referent Referent
“I might sell a gunthat gets used ina crime”
0.002 0.91
Very concerned 1.99 1.34–2.96 1.09 0.71–1.66Somewhat concerned 1.54 1.08–2.19 1.01 0.69–1.48Not at all concerned Referent Referent
“There are too many guncontrol regulations”
G0.0001 0.004
Very concerned 0.15 0.09–0.23 0.48 0.31–0.75Somewhat concerned 0.34 0.22–0.54 0.72 0.46–1.13Not at all concerned Referent Referent
Recommendedincarceration forbuyer in traffickingoperation, years
0.002 0.008
≥20 1.94 1.24–3.04 2.17 1.34–3.5111–19 1.11 0.67–1.84 1.90 1.10–3.296–10 1.89 1.29–2.77 2.06 1.38–3.080–5 Referent Referent
Estimated proportionof retailers whomake illegalsales, %
G0.0001 G0.0001
≥10 4.43 2.56–7.69 2.54 1.46–4.124–9 2.44 1.38–4.30 1.11 0.62–1.991–3 1.40 0.84–2.32 0.87 0.52–1.47G1 Referent Referent
Recommendedincarceration forseller in traffickingoperation, years
0.10 0.004
≥20 1.60 1.04–2.45 2.41 1.52–3.8311–19 1.46 0.88–2.42 2.02 1.17–3.466–10 1.46 0.98–2.17 1.97 1.30–3.000-5 Referent Referent
WINTEMUTE
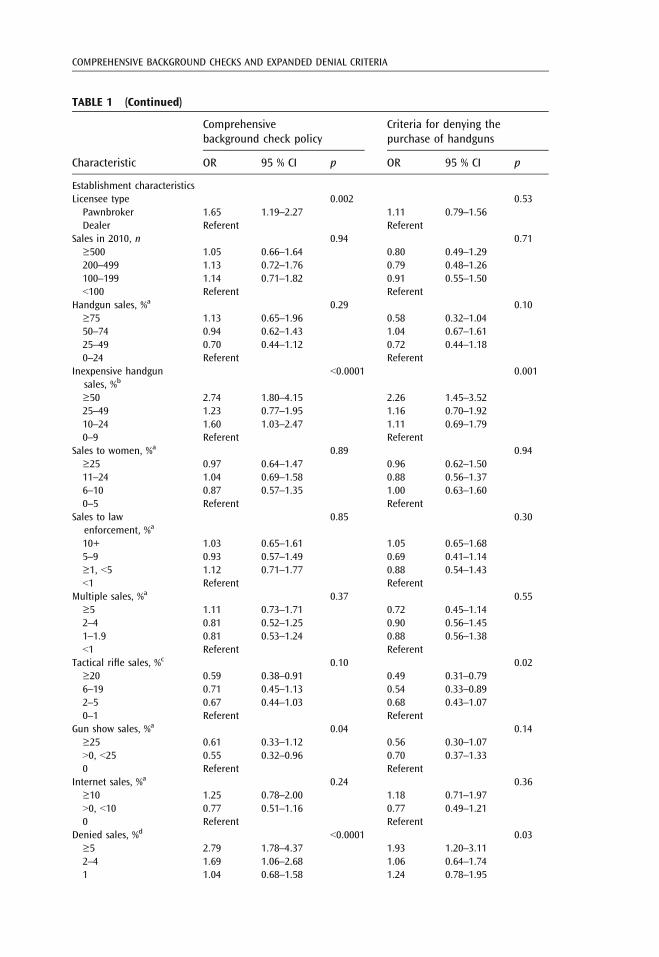
TABLE 1 (Continued)
Characteristic
Comprehensivebackground check policy
Criteria for denying thepurchase of handguns
OR 95 % CI p OR 95 % CI p
Establishment characteristicsLicensee type 0.002 0.53Pawnbroker 1.65 1.19–2.27 1.11 0.79–1.56Dealer Referent Referent
Sales in 2010, n 0.94 0.71≥500 1.05 0.66–1.64 0.80 0.49–1.29200–499 1.13 0.72–1.76 0.79 0.48–1.26100–199 1.14 0.71–1.82 0.91 0.55–1.50G100 Referent Referent
Handgun sales, %a 0.29 0.10≥75 1.13 0.65–1.96 0.58 0.32–1.0450–74 0.94 0.62–1.43 1.04 0.67–1.6125–49 0.70 0.44–1.12 0.72 0.44–1.180–24 Referent Referent
Inexpensive handgunsales, %b
G0.0001 0.001
≥50 2.74 1.80–4.15 2.26 1.45–3.5225–49 1.23 0.77–1.95 1.16 0.70–1.9210–24 1.60 1.03–2.47 1.11 0.69–1.790–9 Referent Referent
Sales to women, %a 0.89 0.94≥25 0.97 0.64–1.47 0.96 0.62–1.5011–24 1.04 0.69–1.58 0.88 0.56–1.376–10 0.87 0.57–1.35 1.00 0.63–1.600–5 Referent Referent
Sales to lawenforcement, %a
0.85 0.30
10+ 1.03 0.65–1.61 1.05 0.65–1.685–9 0.93 0.57–1.49 0.69 0.41–1.14≥1, G5 1.12 0.71–1.77 0.88 0.54–1.43G1 Referent Referent
Multiple sales, %a 0.37 0.55≥5 1.11 0.73–1.71 0.72 0.45–1.142–4 0.81 0.52–1.25 0.90 0.56–1.451–1.9 0.81 0.53–1.24 0.88 0.56–1.38G1 Referent Referent
Tactical rifle sales, %c 0.10 0.02≥20 0.59 0.38–0.91 0.49 0.31–0.796–19 0.71 0.45–1.13 0.54 0.33–0.892–5 0.67 0.44–1.03 0.68 0.43–1.070–1 Referent Referent
Gun show sales, %a 0.04 0.14≥25 0.61 0.33–1.12 0.56 0.30–1.0790, G25 0.55 0.32–0.96 0.70 0.37–1.330 Referent Referent
Internet sales, %a 0.24 0.36≥10 1.25 0.78–2.00 1.18 0.71–1.9790, G10 0.77 0.51–1.16 0.77 0.49–1.210 Referent Referent
Denied sales, %d G0.0001 0.03≥5 2.79 1.78–4.37 1.93 1.20–3.112–4 1.69 1.06–2.68 1.06 0.64–1.741 1.04 0.68–1.58 1.24 0.78–1.95
COMPREHENSIVE BACKGROUND CHECKS AND EXPANDED DENIAL CRITERIA
too easy for criminals to get guns,” the severity of the sentence they recommendedfor illegal firearm purchasing, and their estimate of the prevalence of knowingparticipation in illegal gun sales by other retailers (Fig. 1a, Table 1). Supportdecreased sharply with the extent to which respondents were concerned that “thereare too many ‘gun control’ regulations.”
Many establishment characteristics were positively associated with support forcomprehensive background checks, including licensure as a pawnbroker, sales ofinexpensive handguns, denied sales, attempted straw purchases, attempted purchaseswithout background checks (p=0.08), and sales of firearms that were later traced(p=0.057) (Fig. 1b, Table 1). Sales at gun shows and sales of tactical rifles (p=0.10)were negatively associated with support for background checks.
In multivariate analysis (Table 2), strong and approximately equal but oppositeassociations were found with respondents’ agreement that “it is too easy forcriminals to get guns” (positively associated) and that “there are too many ‘guncontrol’ regulations” (negatively associated). Among establishment characteristics,
TABLE 1 (Continued)
Characteristic
Comprehensivebackground check policy
Criteria for denying thepurchase of handguns
OR 95 % CI p OR 95 % CI p
G1 Referent ReferentTrace requests, %e 0.057 0.53≥2 1.79 1.14–2.82 1.21 0.75–1.9590.5, G2 1.09 0.70–1.70 0.85 0.53–1.3690, ≤0.5 1.17 0.73–1.85 1.02 0.62–1.680 Referent Referent
Straw purchaseattempts, past year
0.02 0.74
≥Monthly 1.83 1.04–3.22 1.24 0.68–2.2591 or 2 2.01 1.22–3.30 0.85 0.50–1.451 or 2 1.37 0.97–1.94 1.07 0.74–1.550 Referent Referent
Undocumented purchaseattempts, past year
0.08 0.49
≥Monthly 1.80 1.08–3.01 1.04 0.51–1.7691 or 2 1.64 0.88–3.07 0.78 0.41–1.501 or 2 1.09 0.76–1.56 1.27 0.86–1.880 Referent Referent
Firearm theft,past 5 years
0.055 0.35
Yes 1.41 0.99–2.01 0.84 0.58–1.22No Referent Referent
Results obtained by ordinal regression. Odds ratios (OR) represent the effect of a given characteristic on theodds of reporting a higher level of support for a comprehensive background check policy (classification: stronglyfavor9favor9neither favor nor oppose9oppose9strongly oppose) or endorsing a greater number of criteria fordenying the purchase of handguns (classification: 997-896 or fewer) than was reported by the referent group
aPercentage of overall firearm sales in 2010bPercentage of handgun sales in 2010cPercentage of rifle sales in 2010dPercentage of sales that were denied after a background check, average over 5 yearseAnnual number of trace requests, average over 5 years, as percentage of overall firearm sales in 2010
WINTEMUTE
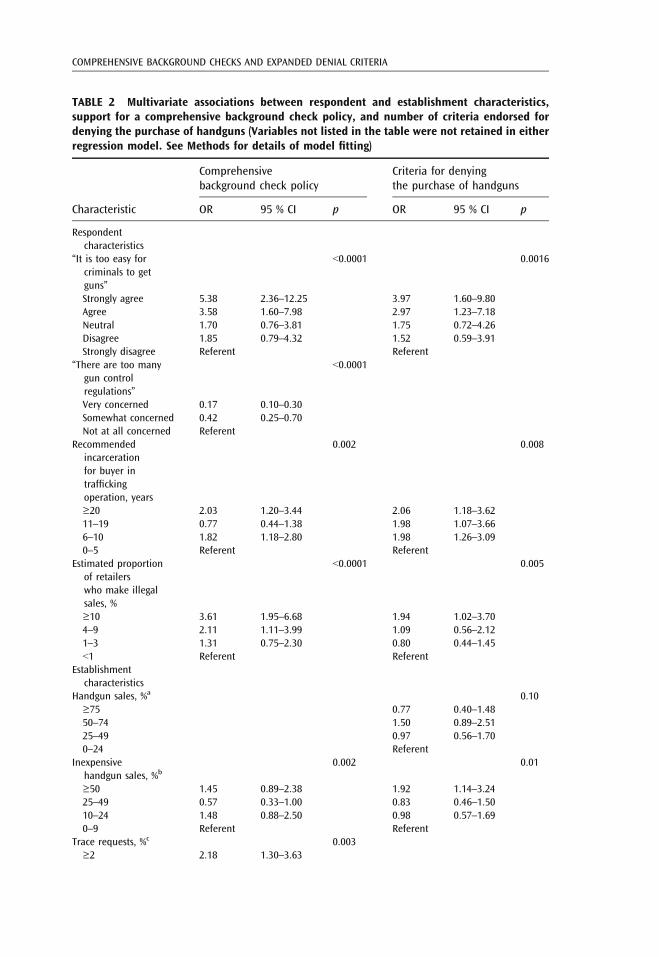
TABLE 2 Multivariate associations between respondent and establishment characteristics,support for a comprehensive background check policy, and number of criteria endorsed fordenying the purchase of handguns (Variables not listed in the table were not retained in eitherregression model. See Methods for details of model fitting)
Characteristic
Comprehensivebackground check policy
Criteria for denyingthe purchase of handguns
OR 95 % CI p OR 95 % CI p
Respondentcharacteristics
“It is too easy forcriminals to getguns”
G0.0001 0.0016
Strongly agree 5.38 2.36–12.25 3.97 1.60–9.80Agree 3.58 1.60–7.98 2.97 1.23–7.18Neutral 1.70 0.76–3.81 1.75 0.72–4.26Disagree 1.85 0.79–4.32 1.52 0.59–3.91Strongly disagree Referent Referent
“There are too manygun controlregulations”
G0.0001
Very concerned 0.17 0.10–0.30Somewhat concerned 0.42 0.25–0.70Not at all concerned Referent
Recommendedincarcerationfor buyer intraffickingoperation, years
0.002 0.008
≥20 2.03 1.20–3.44 2.06 1.18–3.6211–19 0.77 0.44–1.38 1.98 1.07–3.666–10 1.82 1.18–2.80 1.98 1.26–3.090–5 Referent Referent
Estimated proportionof retailerswho make illegalsales, %
G0.0001 0.005
≥10 3.61 1.95–6.68 1.94 1.02–3.704–9 2.11 1.11–3.99 1.09 0.56–2.121–3 1.31 0.75–2.30 0.80 0.44–1.45G1 Referent Referent
Establishmentcharacteristics
Handgun sales, %a 0.10≥75 0.77 0.40–1.4850–74 1.50 0.89–2.5125–49 0.97 0.56–1.700–24 Referent
Inexpensivehandgun sales, %b
0.002 0.01
≥50 1.45 0.89–2.38 1.92 1.14–3.2425–49 0.57 0.33–1.00 0.83 0.46–1.5010–24 1.48 0.88–2.50 0.98 0.57–1.690–9 Referent Referent
Trace requests, %c 0.003≥2 2.18 1.30–3.63
COMPREHENSIVE BACKGROUND CHECKS AND EXPANDED DENIAL CRITERIA
only sales of inexpensive handguns and sales of firearms that were later tracedremained statistically significant.
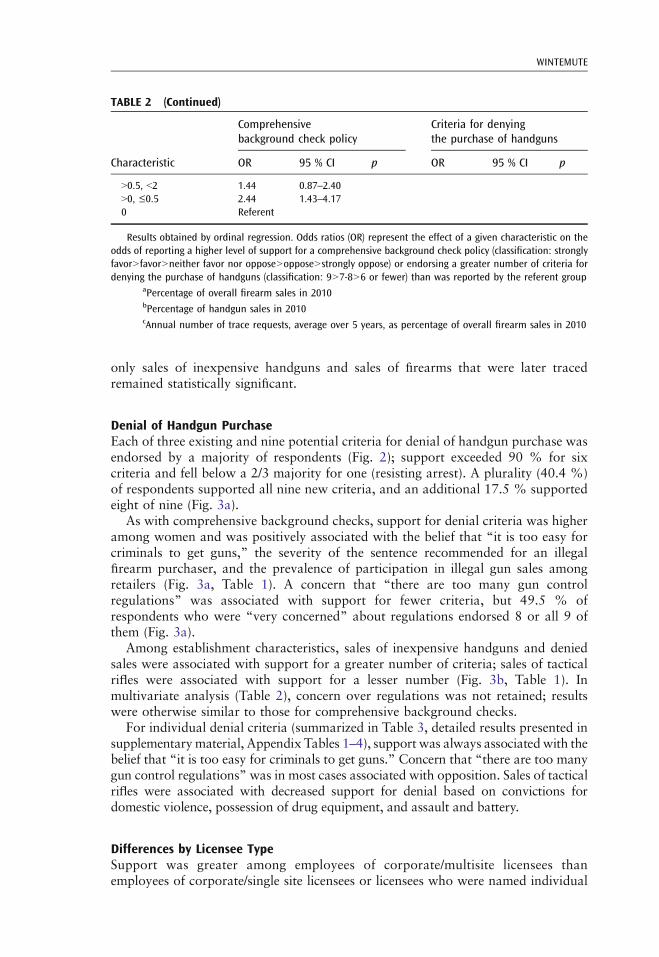
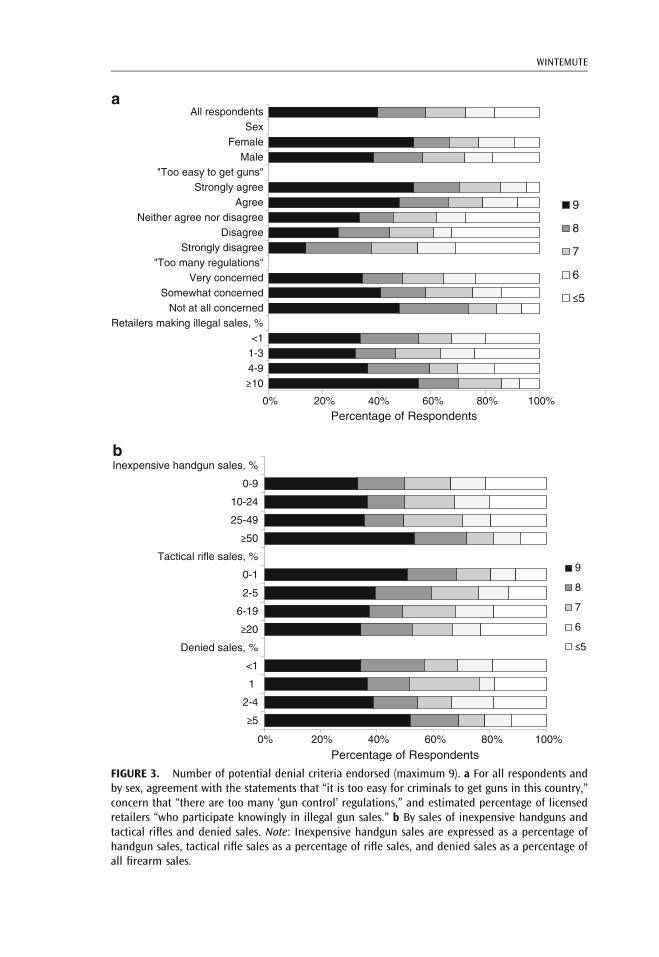
Denial of Handgun PurchaseEach of three existing and nine potential criteria for denial of handgun purchase wasendorsed by a majority of respondents (Fig. 2); support exceeded 90 % for sixcriteria and fell below a 2/3 majority for one (resisting arrest). A plurality (40.4 %)of respondents supported all nine new criteria, and an additional 17.5 % supportedeight of nine (Fig. 3a).
As with comprehensive background checks, support for denial criteria was higheramong women and was positively associated with the belief that “it is too easy forcriminals to get guns,” the severity of the sentence recommended for an illegalfirearm purchaser, and the prevalence of participation in illegal gun sales amongretailers (Fig. 3a, Table 1). A concern that “there are too many gun controlregulations” was associated with support for fewer criteria, but 49.5 % ofrespondents who were “very concerned” about regulations endorsed 8 or all 9 ofthem (Fig. 3a).
Among establishment characteristics, sales of inexpensive handguns and deniedsales were associated with support for a greater number of criteria; sales of tacticalrifles were associated with support for a lesser number (Fig. 3b, Table 1). Inmultivariate analysis (Table 2), concern over regulations was not retained; resultswere otherwise similar to those for comprehensive background checks.
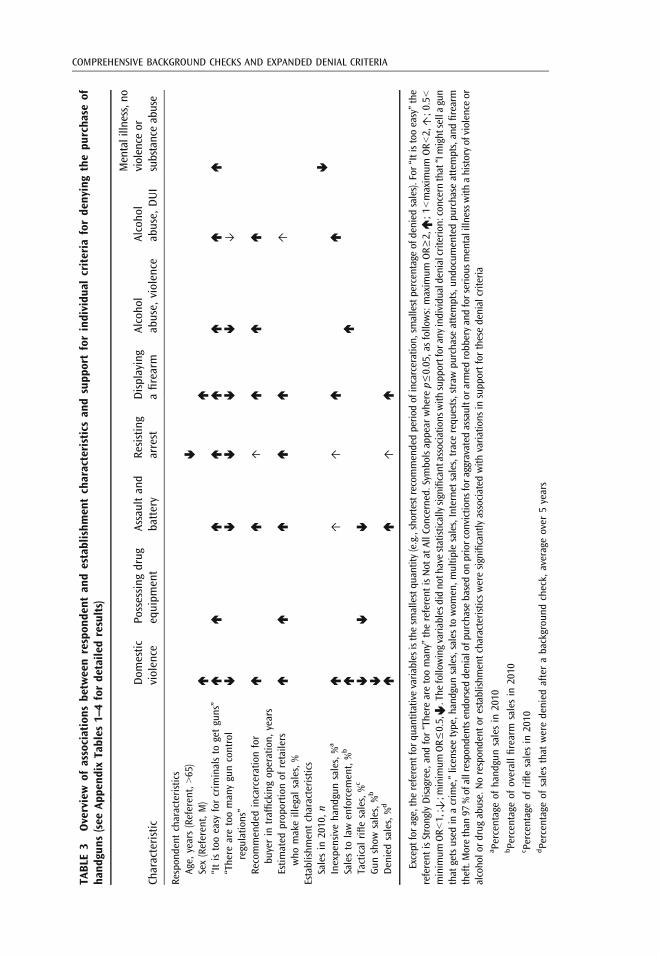
For individual denial criteria (summarized in Table 3, detailed results presented insupplementarymaterial, Appendix Tables 1–4), support was always associatedwith thebelief that “it is too easy for criminals to get guns.” Concern that “there are too manygun control regulations” was in most cases associated with opposition. Sales of tacticalrifles were associated with decreased support for denial based on convictions fordomestic violence, possession of drug equipment, and assault and battery.
Differences by Licensee TypeSupport was greater among employees of corporate/multisite licensees thanemployees of corporate/single site licensees or licensees who were named individual
TABLE 2 (Continued)
Characteristic
Comprehensivebackground check policy
Criteria for denyingthe purchase of handguns
OR 95 % CI p OR 95 % CI p
90.5, G2 1.44 0.87–2.4090, ≤0.5 2.44 1.43–4.170 Referent
Results obtained by ordinal regression. Odds ratios (OR) represent the effect of a given characteristic on theodds of reporting a higher level of support for a comprehensive background check policy (classification: stronglyfavor9favor9neither favor nor oppose9oppose9strongly oppose) or endorsing a greater number of criteria fordenying the purchase of handguns (classification: 997-896 or fewer) than was reported by the referent group
aPercentage of overall firearm sales in 2010bPercentage of handgun sales in 2010cAnnual number of trace requests, average over 5 years, as percentage of overall firearm sales in 2010
WINTEMUTE
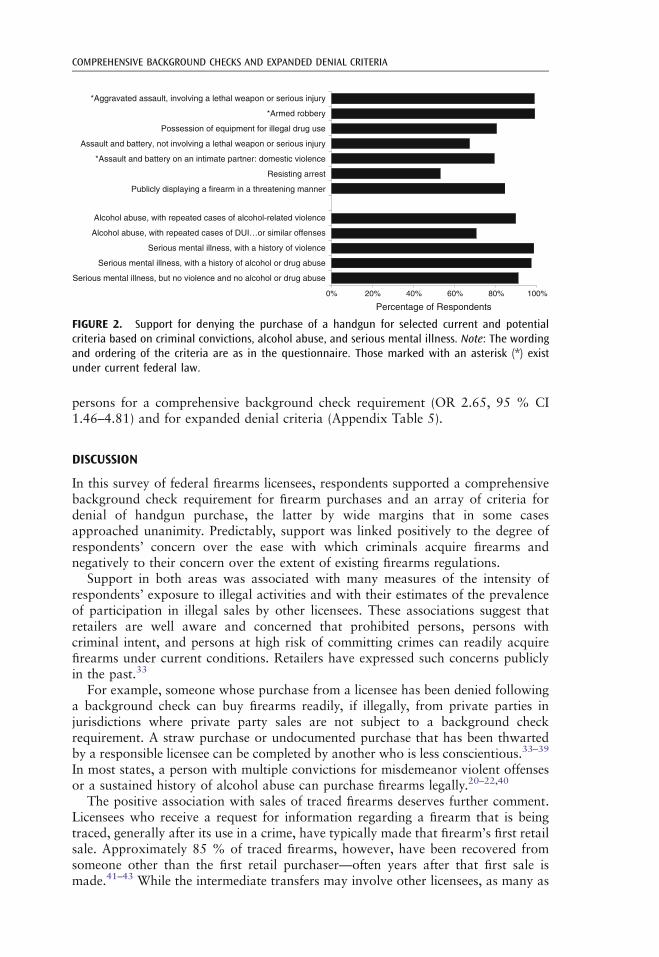
persons for a comprehensive background check requirement (OR 2.65, 95 % CI1.46–4.81) and for expanded denial criteria (Appendix Table 5).
DISCUSSION
In this survey of federal firearms licensees, respondents supported a comprehensivebackground check requirement for firearm purchases and an array of criteria fordenial of handgun purchase, the latter by wide margins that in some casesapproached unanimity. Predictably, support was linked positively to the degree ofrespondents’ concern over the ease with which criminals acquire firearms andnegatively to their concern over the extent of existing firearms regulations.
Support in both areas was associated with many measures of the intensity ofrespondents’ exposure to illegal activities and with their estimates of the prevalenceof participation in illegal sales by other licensees. These associations suggest thatretailers are well aware and concerned that prohibited persons, persons withcriminal intent, and persons at high risk of committing crimes can readily acquirefirearms under current conditions. Retailers have expressed such concerns publiclyin the past.33
For example, someone whose purchase from a licensee has been denied followinga background check can buy firearms readily, if illegally, from private parties injurisdictions where private party sales are not subject to a background checkrequirement. A straw purchase or undocumented purchase that has been thwartedby a responsible licensee can be completed by another who is less conscientious.33–39
In most states, a person with multiple convictions for misdemeanor violent offensesor a sustained history of alcohol abuse can purchase firearms legally.20–22,40
The positive association with sales of traced firearms deserves further comment.Licensees who receive a request for information regarding a firearm that is beingtraced, generally after its use in a crime, have typically made that firearm’s first retailsale. Approximately 85 % of traced firearms, however, have been recovered fromsomeone other than the first retail purchaser—often years after that first sale ismade.41–43 While the intermediate transfers may involve other licensees, as many as
0% 20% 40% 60% 80% 100%
Serious mental illness, but no violence and no alcohol or drug abuse
Serious mental illness, with a history of alcohol or drug abuse
Serious mental illness, with a history of violence
Alcohol abuse, with repeated cases of DUI…or similar offenses
Alcohol abuse, with repeated cases of alcohol-related violence
Publicly displaying a firearm in a threatening manner
Resisting arrest
*Assault and battery on an intimate partner: domestic violence
Assault and battery, not involving a lethal weapon or serious injury
Possession of equipment for illegal drug use
*Armed robbery
*Aggravated assault, involving a lethal weapon or serious injury
Percentage of Respondents
FIGURE 2. Support for denying the purchase of a handgun for selected current and potentialcriteria based on criminal convictions, alcohol abuse, and serious mental illness. Note: The wordingand ordering of the criteria are as in the questionnaire. Those marked with an asterisk (*) existunder current federal law.
COMPREHENSIVE BACKGROUND CHECKS AND EXPANDED DENIAL CRITERIA
0% 20% 40% 60% 80% 100%
4-91-3<1
Retailers making illegal sales, %Not at all concerned
Somewhat concernedVery concerned
"Too many regulations"Strongly disagree
DisagreeNeither agree nor disagree
AgreeStrongly agree
"Too easy to get guns"Male
FemaleSex
All respondents
Percentage of Respondents
9
8
7
6
10
5
a
0% 20% 40% 60% 80% 100%
5
2-4
1
<1
Denied sales, %
20
6-19
2-5
0-1
Tactical rifle sales, %
50
25-49
10-24
0-9
Inexpensive handgun sales, %
Percentage of Respondents
9
8
7
6
5
b
FIGURE 3. Number of potential denial criteria endorsed (maximum 9). a For all respondents andby sex, agreement with the statements that “it is too easy for criminals to get guns in this country,”concern that “there are too many ‘gun control’ regulations,” and estimated percentage of licensedretailers “who participate knowingly in illegal gun sales.” b By sales of inexpensive handguns andtactical rifles and denied sales. Note: Inexpensive handgun sales are expressed as a percentage ofhandgun sales, tactical rifle sales as a percentage of rifle sales, and denied sales as a percentage ofall firearm sales.
WINTEMUTE
TABLE
3Overview
ofassociations
betw
eenrespon
dent
andestablishm
entcharacteristicsan
dsupp
ortforindividu
alcriteria
forde
nyingthepu
rcha
seof
hand
guns
(see
Appe
ndix
Tables
1–4forde
taile
dresults)
Characteristic
Dom
estic
violence
Possessing
drug
equipm
ent
Assaultand
battery
Resisting
arrest
Displaying
afirearm
Alcoho
labuse,
violence
Alcoho
labuse,
DUI
Mentalillness,no
violence
orsubstanceabuse
Respon
dent
characteristics
Age,
years(Referent,965)
Sex(Referent,M)
“Itistooeasy
forcrim
inalsto
getguns”
“There
aretoomanyguncontrol
regulatio
ns”
Recommendedincarcerationfor
buyerin
traffickingop
eration,
years
Estim
ated
prop
ortio
nof
retailers
who
makeillegal
sales,%
Establishm
entcharacteristics
Salesin
2010,n
Inexpensivehand
gunsales,%a
Salesto
lawenforcem
ent,%b
Tactical
riflesales,%c
Gunshow
sales,%b
Deniedsales,%d
Except
forage,thereferent
forqu
antitativevariablesisthesm
allestqu
antity(e.g.,shortestrecommendedperiod
ofincarceration,
smallestpercentage
ofdenied
sales).
For“Itistooeasy”the
referent
isStronglyDisagree,andfor“There
aretoomany”
thereferent
isNot
atAllCon
cerned.Sym
bolsappear
where
p≤0.05,asfollows:maxim
umOR≥2,
;1Gmaxim
umORG2,
;0.5G
minim
umORG1,;
;minim
umOR≤0.5,
.The
followingvariablesd
idno
thavestatisticallysignificantassociations
with
supp
ortfor
anyindividu
aldenialcriterion
:con
cern
that“Imightsellagun
that
getsused
inacrim
e,”licenseetype,h
andgun
sales,salesto
wom
en,m
ultip
lesales,Internet
sales,tracerequ
ests,straw
purchase
attempts,un
documentedpu
rchase
attempts,andfirearm
theft.Morethan
97%ofallrespond
entsendorsed
denialofpu
rchase
basedon
priorcon
victions
fora
ggravatedassaultora
rmed
robb
eryandforserious
mentalilln
essw
ithahistoryofviolence
oralcoho
lordrug
abuse.Norespon
dent
orestablishm
entcharacteristicsweresignificantlyassociated
with
variations
insupp
ortfor
thesedenialcriteria
a Percentageof
hand
gunsalesin
2010
bPercentage
ofoverallfirearm
salesin
2010
c Percentageof
riflesalesin
2010
dPercentage
ofsalesthat
weredenied
afterabackgrou
ndcheck,
averageover
5years
COMPREHENSIVE BACKGROUND CHECKS AND EXPANDED DENIAL CRITERIA
40 % of all firearm transfers involve only private parties.16 Retailers who sell manytraced firearms are likely to be aware of these facts and may believe that subsequenttransfers of firearms they sell should be subject to the same safeguards that appliedto the sales they made.
Sales of large and especially disproportionate numbers of traced firearms identifya retailer as an important point source of firearms used in crime,44–47 and theinference has been drawn that some such retailers are at best negligent and at worstcorrupt. The true situation is clearly more complex.
The association with sales of inexpensive handguns may also arise from licensees’professional knowledge, as such handguns appear with disproportionate frequencyamong traced firearms, particularly when firearm trafficking is suggested.41,44,48–50
In this study population, increasing sales of these handguns are associated withincreasing frequencies of attempted straw purchases and undocumented pur-chases.24
The reason for the inverse association between sales of tactical rifles andsupport for comprehensive background checks and some denial criteria isunclear. These firearms are generally believed to pose a special risk to thepublic’s health and safety and are the target of special regulation. It may be thatretailers who frequently sell high-risk firearms are also opposed to restrictions onfirearm purchases by high-risk individuals. This remains a subject for furtherexploration.
The findings here are generally consonant with those of prior surveyresearch29,30,51 and opinion polling52–54 involving firearm owners, includingmembers of the National Rifle Association. These studies have found levels ofsupport for comprehensive background checks ranging from 75 to 85 %, includingamong firearm owners. The more moderate level of support among our surveyrespondents may reflect both their concerns about processing additional backgroundchecks, particularly if the fees they are allowed to charge are inadequate, and thefact that the survey was conducted prior to recent widely publicized mass shootings.Support for additional denial criteria has been high whenever it has been measured.
Such policies are feasible and effective where they have been enacted. California,for example, denies the purchase and possession of all firearms to persons who havebeen convicted of misdemeanor offenses involving firearms or violence and requiresa background check for essentially all firearm transfers. Even with these additionalrequirements in place, approximately 600,000 firearms were sold in California in2011;55 the firearms industry considers the state a “lucrative” market.56 Denyinghandgun purchases by violent misdemeanants in California reduced their risk ofarrest for violent or firearm-related crimes by at least 23 %.12
LimitationsOverall study limitations were reviewed in detail previously in this journal.23 Werestricted the study population to licensees with estimated sales above a specificthreshold, and licensees from seven states were excluded because the necessary data werenot available. Our results cannot be generalized to the entire licensee population. Theresponse rate was comparable to that achieved by others using similar methods forestablishment surveys, including the developer of those methods.57,58 There was aneffort to interfere with the execution of the survey by the National Rifle Association andthe National Shooting Sports Foundation, but this appeared to have little if any effect.23
It is nonetheless possible that subjects who opposed the policy options that were thesubject of the survey were less likely than others to respond. Conversely, the lower
WINTEMUTE
response rate among employees of corporate/multisite licensees, who expressed muchhigher levels of support for each policy option, suggests that on balance our resultsunderestimate the level of support for these policies in our study population. Ourquestions on denial criteria were specific to handguns; support for denial of purchases ofrifles and shotguns might be lower.
ACKNOWLEDGMENTS
We are especially grateful to the retailers who participated in the survey, many ofwhom provided additional helpful comments. Barbara Claire, Vanessa McHenry,and Mona Wright provided expert technical assistance throughout the project. Dr.Tom Smith served as a consultant for the development of the survey questionnaireand gave extensive input. Jeri Bonavia, Kristen Rand, and Josh Sugarmann providedhelpful reviews of a draft questionnaire. The Firearm Licensee Survey was supportedin part by a grant from The California Wellness Foundation, grant number 2010-067. Initial planning was also supported in part by a grant from the JoyceFoundation, grant number 09-31277.
REFERENCES
1. Institute of Medicine, National Research Council. Priorities for research to reduce thethreat of firearm-related violence. Washington, DC: The National Academies Press, 2013.
2. Hoyert DL, Xu J. Deaths: preliminary data for 2011.Natl Vital Stat Rep. 2012; 61(6): 1–65.3. Web-based Injury Statistics Query and Reporting System (WISQARS). National Center for
Injury Prevention and Control, Centers for Disease Control and Prevention. http://www.cdc.gov/injury/wisqars/index.html. Accessed October 25, 2012.
4. NCVS Victimization Analysis Tool (NVAT). Bureau of Justice Statistics; 2012. http://www.bjs.gov/index.cfm?ty=nvat. Accessed March 13, 2013.
5. Wintemute GJ, Claire BE, McHenry VS, Wright MA. Epidemiology and clinical aspectsof stray bullet shootings in the United States. J Trauma Acute Care Surg. 2012; 73(1):215–223.
6. Kotlowitz A. There are no children here. New York, NY: Doubleday; 1991.7. Kozol J. Amazing grace. New York, NY: HarperPerennial; 1996.8. 18 USC §922(d).9. District of Columbia v Heller, 128, 2783 (SCt 2008).
10. McDonald v City of Chicago, 130, 3020 (SCt 2010).11. Frandsen RJ, Naglich D, Lauver GA. Background checks for firearm transfers, 2010—Sta-
tistical Tables. Washington, DC: Bureau of Justice Statistics; 2013. NCJ 23822612. Wintemute GJ, Wright MA, Drake CM, Beaumont JJ. Subsequent criminal activity
among violent misdemeanants who seek to purchase handguns: risk factors andeffectiveness of denying handgun purchase. JAMA. 2001; 285(8): 1019–1026.
13. WrightMA,Wintemute GJ, Rivara FA. Effectiveness of denial of handgun purchase to personsbelieved to be at high risk for firearm violence. Am J Public Health. 1999; 89(1): 88–90.
14. Webster DW, Vernick JS, McGinty EE, Alcorn T. Preventing the diversion of guns tocriminals through effective firearm sales laws. In: Webster DW, Vernick JS, eds. Reducinggun violence in America: informing policy with evidence and analysis. Baltimore, MD:The Johns Hopkins University Press; 2013: 109–121.
15. Ludwig JA, Cook PJ. Homicide and suicide rates associated with implementation of theBrady Handgun Violence Prevention Act. JAMA. 2000; 284(5): 585–591.
16. Cook PJ, Ludwig J. Guns in America: results of a comprehensive national survey onfirearms ownership and use. Washington, DC: The Police Foundation; 1996.
COMPREHENSIVE BACKGROUND CHECKS AND EXPANDED DENIAL CRITERIA
17. Harlow CW. Firearm use by offenders. Washington, DC: Bureau of Justice Statistics;2001. NCJ 189369
18. Scalia J. Federal firearm offenders, 1992–98. Washington, DC: Bureau of JusticeStatistics; 2000. NCJ 180795
19. Vittes KA, Vernick JS, Webster DW. Legal status and source of offenders’ firearms instates with the least stringent criteria for gun ownership. Inj Prev. 2013; 19(1): 26–31.
20. Wintemute GJ, Drake CM, Beaumont JJ, Wright MA, Parham CA. Prior misdemeanorconvictions as a risk factor for later violent and firearm-related criminal activity amongauthorized purchasers of handguns. JAMA. 1998; 280(24): 2083–2087.
21. Wright MA, Wintemute GJ. Felonious or violent criminal activity that prohibits gunownership among prior purchasers of handguns: incidence and risk factors. J Trauma.2010; 69(4): 948–955.
22. Bureau of Justice Statistics. Survey of state procedures related to firearm sales, 2005.Washington, DC: Bureau of Justice Statistics; 2006. NCJ 214645
23. Wintemute GJ. Characteristics of federally licensed firearms retailers and retailestablishments in the United States: initial findings from the Firearms Licensee Survey. JUrban Health. 2012; 90(1): 1–26.
24. Wintemute GJ. Frequency of and responses to illegal activity related to commerce infirearms: findings from the Firearms Licensee Survey. Published online ahead of print byInj Prev, March 11, 2013. doi:10.1136/injuryprev-2012-040715
25. Bureau of Alcohol, Tobacco, Firearms and Explosives. Downloadable lists of FederalFirearms Licensees (FFLs). http://www.atf.gov/about/foia/ffl-list.html. Accessed October26, 2012.
26. SAS for Windows [computer program]. Version 9.1.3. Cary, NC: SAS Institute; 2003.27. Dillman D, Smith J. Internet, mail, and mixed-mode surveys: the tailored design method.
3rd edition ed. Hoboken, NJ: Wiley; 2009.28. Dillman DA, Gertseva A, Mahon-Haft T. Achieving usability in establishment surveys
through the application of visual design principles. J Off Stat. 2005; 21(2): 183–214.29. Smith TW. Public attitudes towards the regulation of firearms. Chicago, IL: NORC/
University of Chicago; 2007.30. Teret SP, Webster DW, Vernick JS, et al. Support for new policies to regulate firearms:
results of two national surveys. N Engl J Med. 1998; 339(12): 813–818.31. Federal Bureau of Investigation. Total NICS background checks. http://www.fbi.gov/about-us/
cjis/nics/reports/04032012_1998_2012_monthly_yearly_totals.pdf. Accessed November, 2010.32. The American Association for Public Opinion Research. Standard definitions: final
dispositions of case codes and outcome rates for surveys. 7th edition. AAPOR; 2011.33. Wintemute GJ. Inside gun shows: what goes on when everybody thinks nobody’s
watching. Sacramento, CA: Violence Prevention Research Program; 2009.34. Bureau of Alcohol, Tobacco and Firearms. Following the gun: enforcing federal laws against
firearms traffickers. Washington, DC: Bureau of Alcohol, Tobacco and Firearms; 2000.35. Braga AA, Kennedy DM. The illicit acquisition of firearms by youth and juveniles. J Crim
Justice. 2001; 29(2): 379–388.36. Braga AA, Wintemute GJ, Pierce GL, Cook PJ, Ridgeway G. Interpreting the empirical
evidence on illegal gun market dynamics. J Urban Health. 2012; 89(5): 779–793.37. Sorenson SB, Vittes K. Buying a handgun for someone else: firearm dealer willingness to
sell. Inj Prev. 2003; 9(2): 147–150.38. Wintemute GJ. Disproportionate sales of crime guns among licensed handgun retailers in
the United States: a case–control study. Inj Prev. 2009; 15(5): 291–299.39. Wintemute GJ. Firearm retailers’ willingness to participate in an illegal gun purchase. J
Urban Health. 2010; 87(5): 865–878.40. Webster DW, Vernick JS. Keeping firearms from drug and alcohol abusers. Inj Prev. 2009;
15(6): 425–427.
WINTEMUTE
41. Bureau of Alcohol, Tobacco and Firearms. Crime gun trace analysis reports: the illegalyouth firearms market in 27 communities. Washington, DC: Bureau of Alcohol, Tobaccoand Firearms, 1999.
42. Cook PJ, Braga AA. Comprehensive firearms tracing: strategic and investigative uses ofnew data on firearms markets. Ariz Law Rev. 2001; 43(Summer): 277.
43. Wintemute GJ, Romero MP, Wright MA, Grassel KM. The life cycle of crime guns: adescription based on guns recovered from young people in California. Ann Emerg Med.2004; 43(6): 733–742.
44. Wintemute GJ, Cook PJ, Wright MA. Risk factors among handgun retailers for frequentand disproportionate sales of guns used in violent and firearm related crimes. Inj Prev.2005; 11(6): 357–363.
45. Bureau of Alcohol, Tobacco and Firearms. Commerce in firearms in the United States.Washington, DC: Bureau of Alcohol, Tobacco and Firearms; 2000.
46. Braga AA, Cook PJ, Kennedy DM, Moore MH. The illegal supply of firearms. In: TonryM, ed. Crime and justice: a review of research. Vol 29. Chicago, IL: The University ofChicago Press; 2002: 319–352.
47. Pierce GL, Braga AA, Hyatt RRJ, Koper CS. Characteristics and dynamics of illegalfirearms markets: implications for a supply-side enforcement strategy. Justice Q. 2004;21(2): 391–422.
48. Wright MA, Wintemute GJ, Webster DW. Factors affecting a recently-purchasedhandgun’s risk for use in crime under circumstances that suggest gun trafficking. JUrban Health. 2010; 87(3): 352–364.
49. Koper CS. Crime gun risk factors: buyer, seller, firearm, and transaction characteristicsassociated with gun trafficking and criminal gun use. Philadelphia, PA: Jerry Lee Centerof Criminology; 2007.
50. Wintemute GJ. Ring of fire: the handgun makers of Southern California. Sacramento,CA: Violence Prevention Research Program; 1994.
51. Barry CL, McGinty EE, Vernick JS, Webster DW. After Newtown—public opinion ongun policy and mental illness. N Engl J Med. 2013;368(12):1077–1081.
52. Global L. Gun owners poll. New York, NY: Mayors Against Illegal Guns; 2012.53. American Viewpoint/Momentum Analysis. Results from a national survey of 1003
registered voters. New York, NY: Mayors Against Illegal Guns; 2011.54. Greenland Quinlan Rosner Research, The Tarrance Group.Americans support common sense
measures to cut down on illegal guns. New York, NY: Mayors Against Illegal Guns; 200855. California Department of Justice. Dealers record of sale transactions. Available at: http://oag.
ca.gov/sites/all/files/pdfs/firearms/forms/dros_chart.pdf? Accessed January 6, 2013.56. Anonymous. California market still lucrative. The New Firearms Business. 2007;14(6):5.57. Paxson MC, Dillman DA, Tarnai J. Improving response to business mail surveys. In: Cox
BG, Binder DA, Chinnappa BN, et al., eds. Business survey methods. New York, NY:Wiley; 1995: 303–315.
58. Kriauciunas A, Parmigiani A, Rivera-Santos M. Leaving our comfort zone: integratingestablished practices with unique adaptations to conduct survey-based strategy researchin nontraditional contexts. Strat Mgmt J. 2011; 32(9): 994–1010.
COMPREHENSIVE BACKGROUND CHECKS AND EXPANDED DENIAL CRITERIA