support by multilateral and bilateral development partners ... · 24.08.2015 · for infrastructure...
TRANSCRIPT

September 2015
OFFICIAL DEVELOPMENT FINANCE FOR INFRASTRUCTURE SUPPORT BY MULTILATERAL AND BILATERAL DEVELOPMENT PARTNERS OECD REPORT TO G20 FINANCE MINISTERS AND CENTRAL BANK GOVERNORS
Contacts: Ms. Kaori Miyamoto, OECD Development Co-operation
Directorate [Tel: +33 1 45 24 90 09 | [email protected]]
or Mr. André Laboul, Deputy-Director, OECD Directorate for Financial
and Enterprise Affairs [Tel: +33 1 45 24 91 27 | [email protected]].
DRAFT DRAFT

2
This analytical report is circulated under the responsibility of the Secretary-General of the OECD. The opinions expressed and arguments employed herein do not necessarily reflect the official views of OECD member countries or of the G20.
This report was submitted to the G20 IIWG meeting in Berlin on 20-21 August 2015, and is now transmitted to the September meeting of the G20 Finance Ministers and Central Bank Governors.
This document and any map included herein are without prejudice to the status of or sovereignty over any territory, to the delimitation of international frontiers and boundaries and to the name of any territory, city or area. © OECD 2015. Applications for permission to reproduce or translate all or part of this material should be made to: [email protected].
3
TABLE OF CONTENTS
ABSTRACT .................................................................................................................................................... 5
ABBREVIATIONS ......................................................................................................................................... 6
BACKGROUND AND INTRODUCTION .................................................................................................... 8
I. OVERVIEW OF INFRASTRUCTURE FINANCE .................................................................................. 10
1. Current Investments and Projected Gaps in Infrastructure .................................................................... 10 2. Overall Development Partner Finance for Infrastructure....................................................................... 11 3. Regional, Income Level, Recipient Country and Sectoral Distributions ............................................... 15
II. ENABLING ENVIRONMENT FOR PRIVATE SECTOR PARTICIPATION IN
INFRASTRUCTURE .................................................................................................................................... 19
1. Overview of the Enabling Environment for Infrastructure .................................................................... 19 2. Categories of the Enabling Environment ............................................................................................... 20 3. ODF for the Enabling Environment ....................................................................................................... 24
III. SUPPORT TO THE PRIVATE SECTOR .............................................................................................. 25
1. Development Finance Institutions and International Financial Institutions .......................................... 25 2. Initiatives Supporting Private Finance Mobilisation to infrastructure ................................................... 30 3. Export Credits ........................................................................................................................................ 31
IV. SUPPORT TO GREEN INFRASTRUCTURE ...................................................................................... 34
V. EMERGING COUNTRIES AND INSTITUTIONS PROVIDING DEVELOPMENT CO-
OPERATION FOR INFRASTRUCTURE ................................................................................................... 39
1. People’s Republic of China ................................................................................................................... 39 2. India ....................................................................................................................................................... 40 3. Turkey .................................................................................................................................................... 41 4. Arab Development Partners ................................................................................................................... 42 5. Asian Infrastructure Investment Bank and New Development Bank .................................................... 43
VI. END REMARKS .................................................................................................................................... 44
ANNEX: CASE STUDIES OF LEVERAGING PRIVATE INVESTMENT FOR INFRASTRUCTURE 45
I. The Gigawatt Solar Plant in Rwanda ..................................................................................................... 45 II. Dakar-Diamniadio Toll Highway Project ............................................................................................. 46
TECHNICAL NOTES................................................................................................................................... 49
Section I. Overview of Infrastructure Finance ........................................................................................... 49 Section II. Enabling Environment for Private Sector Participation in Infrastructure (Figure 11) ............. 52 Section III. Support to the Private Sector .................................................................................................. 53 Section IV. Support to Green Infrastructure .............................................................................................. 55 Section V. Emerging Countries Providing Development Co-operation for Infrastructure ........................ 57
BIBLIOGRAPHY ......................................................................................................................................... 58

4
Tables
Table 1. Examples of ECA infrastructure projects in LICs, 2012-2013 .............................................. 33
Figures
Figure 1. Current investments and projected investment gaps ......................................................... 10 Figure 2. Developing Country Infrastructure by Source of Finance ................................................ 11 Figure 3. Total ODF to Infrastructure, 2013 ..................................................................................... 12 Figure 4. ODF to Infrastructure, 2013 .............................................................................................. 13 Figure 5. Share of ODF for infrastructure in total sector-allocable ODF, 2013 ............................... 14 Figure 6. Regional Distribution of ODF for Infrastructure and Population ..................................... 15 Figure 7. Distribution of ODF to Infrastructure among income groups, 2013 ................................. 16 Figure 8. ODF to Infrastructure: Top recipients, 2013 ..................................................................... 16 Figure 9. Sectoral Allocation of ODF for Infrastructure, 2013 ........................................................ 18 Figure 10. Diagram of Development Partner Support to the
Enabling Environment for Infrastructure ........................................................................... 20 Figure 11. ODF to the Enabling Environment for infrastructure, 2013 .............................................. 24 Figure 12. ODF to Infrastructure from Development Finance Institutions, 2013 ............................... 27 Figure 13. Income Level Distribution of ODF by DFI/IFIs to the Private Sector
for Infrastructure, 2013 ..................................................................................................... 28 Figure 14. ODF for Infrastructure: Top DFIs/IFIs recipients, 2013 ................................................... 28 Figure 15. Sectoral distribution of ODF to infrastructure from DFIs/IFIs, 2013................................ 29 Figure 16. Shares of ODF to green infrastructure by development partner, 2013 .............................. 36 Figure 17. Share of ODF to green infrastructure by recipient country, 2013 ..................................... 37 Figure 18. ODF Disbursed and Received by Emerging Providers ..................................................... 42
Boxes
Box 1. Examples of Infrastructure Projects ............................................................................................... 17 Box 2. Examples of Projects Supporting the Enabling Environment for General Investment Climate..... 22 Box 3. PPIAF and Examples of Projects Supporting the Enabling Environment
for Infrastructure Sectors .............................................................................................................. 23

5
ABSTRACT
The main objective of this study is to offer an overall picture of support by multilateral and bilateral
development partners to development country infrastructure. By presenting an overview of the scale,
distribution, and modality of development co-operation for infrastructure, the report is expected to
contribute to discussions and further research in international fora on how to fill the financing gap,
particularly by mobilising the private sector. However, the report does not generally make assessments
against development objectives nor provide policy recommendations.
The methodology mainly involved analysing the OECD Development Assistance Committee
(DAC)’s Creditor Reporting System data on Official Development Finance (ODF) for the infrastructure
sectors (water and sanitation, transport, energy, and communications). Desk research was also conducted
on gaps in infrastructure financing as well as support by major development partners that do not report to
the DAC at the activity level.
Key findings for 2013 include the following:
Total infrastructure investments in developing countries amounted to roughly USD 1 trillion a
year, of which more than half was financed by developing country governments and a third by
the private sector.
Official development partners generally financed 6-7% of infrastructure investments, which
amounted to about USD 60 billion.
Of the development partner financing, 46% was from bilaterals and 54% from multilaterals.
Among development partners, China, India, Turkey and Arab partners provided about 13% of
total official support for infrastructure through south-south development co-operation.
Among those reporting to the DAC, the top 10 development partners, which included
multilaterals, G7 countries and Korea, provided over 80% of ODF to infrastructure.
Asia received half of ODF for infrastructure, Africa 28%, Americas 12% and Europe 10%.
Lower Middle Income Countries received 43% of ODF to infrastructure, Upper Middle Income
Countries 33%, and Low Income Countries 24%.
Transport received 45% of ODF to infrastructure, followed by energy at 32%, water & sanitation
at 19%, and communications at 4%.
Support for green infrastructure was 37% of ODF to infrastructure.
USD 34 billion was provided by development partners to support the enabling environment, both
within infrastructure sectors and beyond for the general investment climate.
Development Finance Institutions provided equity and loans of USD 5.9 billion to the private
sector for infrastructure, mostly in UMICs.
Development partners are also supporting Project Preparation Facilities, Project Facilitations
Platforms and Blended Finance operations to leverage private investment for infrastructure.
End remarks. This report presents comprehensive and generally harmonised data on financing for
infrastructure by official development partners, mostly based on annual disbursements. By giving an
overview of infrastructure financing comparable with annual expenditures or financing requirements for
infrastructure, the expectation is to facilitate discussions on a more effective use of scarce public funds in
filling the large infrastructure gap, which is crucial for developing countries to achieve sustainable
development.

6
ABBREVIATIONS
AfDB African Development Bank
AFESD Arab Fund for Economic and Social Development
AIIB Asian Infrastructure Investment Bank
AsDB Asian Development Bank
BADEA Arab Bank for Economic Development in Africa
CDC CDC Group
COFIDES Compañía Española de Financiación del Desarrollo
DAC Development Assistance Committee
DEG Deutsche Investitions- und Entwicklungsgesellschaft mbH
DFI Development Finance Institution
DWG Development Working Group
EBRD European Bank for Reconstruction and Development
ECA Export Credit Agency
ECG Export Credit Group
EDFI European Development Finance Institutions
EIB European Investment Bank
EU European Union
FMO Dutch Entrepreneurial Development Bank
G20 Group of Twenty
GNI Gross National Income
GHG Greenhouse gases
IADB Inter-American Development Bank
IFC International Finance Corporation
IFI International Finance Institution
IFU Danish Investment Fund for Developing Countries
IIWG Investment and Infrastructure Working Group
IsDB Islamic Development Bank
LICs Low Income Countries
LMIC Lower Middle Income Country
MDB Multilateral Development Bank
NDB New Development Bank
Norfund Norwegian Investment Fund for Developing Countries
OECD Organisation for Economic Co-operation and Development
ODA Official Development Assistance
ODF Official Development Finance
OFID OPEC Fund for International Development
OOF Other Official Flows
OPIC Overseas Private Investment Corporation
PFI Policy Framework for Investment
PPIAF Public-Private Infrastructure Advisory Facility
PIDG Private Infrastructure Development Group
PPP Public Private Partnership
PROPARCO Promotion et Participation pour la Coopération économique
SDGs Sustainable Development Goals
SIMEST Società italiana per le imprese all'estero
SOE State-owned enterprise

7
TIKA Turkish Development Co-operation Agency
UK United Kingdom
UMIC Upper Middle Income Country
USA United States of America
USAID United States Agency for International Development
USD United States Dollar
WBG World Bank Group

8
BACKGROUND AND INTRODUCTION
1. Infrastructure, such as water and sanitation, transport, energy and communications, is
fundamental in achieving economic growth, poverty reduction and human development (Mwase and Yang,
2012; Agénor and Moreno-Dodson, 2006; Straub, 2008). This is all the more relevant as production
systems are increasingly taking place across continents, which requires scaling up infrastructure to connect
developing countries with global value chains that could spur their economic growth. However, with
developing country populations expected to grow continuously in the decades ahead — and with high rates
of urbanisation — there is wide recognition that current resources are insufficient to fill the infrastructure
investment gaps of these countries.
2. Furthermore, the challenge will not only be supplying quantity, but also ensuring quality, as the
threats posed by climate change necessitate the integration and promotion of low-carbon and
climate-resilient technologies. This aspect is being highlighted in the drafting of the upcoming United
Nation’s Sustainable Developing Goals (SDGs) which point to the need of providing infrastructure that
generates economic growth and human well-being, while mitigating and adapting to climate change.
Ambitious goals are expected to be set that will require significant efforts from all relevant stakeholders,
notably governments, development partners and the private sector.
3. In particular, with investment needs in infrastructure at the scale of trillions in the decades ahead,
mobilising private resources represents an important avenue to finance the investment gap. Although
expenditures from the public sector will remain key, private participation has the potential to maximise
available resources as well as provide expertise and innovation for development. At the same time, given
the intrinsic risks of infrastructure investments, tighter global financial regulation, and poor enabling
environment in developing countries, innovative strategies need to be devised in order to boost the
contribution of the private sector.
4. The Group of Twenty (G20) is therefore increasingly paying attention to leveraging more
resources to finance infrastructure, including for developing countries, through the Investment and
Infrastructure Working Group (IIWG) and the Development Working Group (DWG). Both groups have
been exploring modalities to foster investment by addressing bottlenecks at the upstream and downstream
levels. The IIWG has particularly focused on identifying strategies to leverage the significant resources of
institutional investors, such as pension funds and sovereign wealth funds. The Turkish Presidency in 2015
is notably working on the enabling environment for private sector participation in infrastructure through
the DWG, with a special focus on Low Income Developing Countries. Moreover, to reduce investment
bottlenecks, the G20 Australian presidency in 2014 created the new Global Infrastructure Hub to act as a
platform for mobilising public and private finance for infrastructure, including in developing countries.
5. To contribute to these global efforts, this report1 maps and describes the activities of major
development partners in financing infrastructure2 of developing countries, namely Official Development
Assistance (ODA)-eligible recipient countries. While it gives a general overview of their infrastructure
financing, it also focuses on their development co-operation that concern mobilising private sector sources.
The report includes data on the 50 major development partners that report to the Organisation for
Economic Co-operation and Development (OECD) Development Assistance Committee (DAC) at the
1. It updates the OECD Working Paper, Official Support for Private Sector Participation in Developing Country
Infrastructure issued in July 2014 (see Miyamoto and Biousse 2014).
2. Infrastructure refers to the sectors 140 (water & sanitation), 210 (transport & storage), 220 (communications), and 230
(energy generation and supply) in the DAC Creditor Reporting System. See Technical Note Section I.A.

9
activity level and in a harmonised manner as well as estimates of emerging economies that are playing a
key role in financing infrastructure of other developing countries. The data mainly focuses on Official
Development Finance3 (ODF) of 2013 by bilateral and multilateral
4 development partners, mostly in
disbursements rather than commitments5.
6. Section I provides an overview of investment needs, expenditures and financing gaps of
developing country infrastructure, as well as total amounts and distributions of ODF for infrastructure.
Section II describes development co-operation related to the enabling environment for private sector
participation in infrastructure. Section III is on support to the private sector for infrastructure from
Development Finance Institutions (DFIs)/ International Financial Institutions (IFIs). It also includes some
relevant data on Export Credit Agencies (ECAs) although they are not part of development finance.
Section IV focuses on the contribution of development partners to low-carbon and climate-resilient
infrastructure. Section V gives a snapshot of some emerging economies providing development co-
operation for infrastructure. Section VI concludes with some end remarks.
3. Official Development Finance consists of the sum of ODA and developmental Other Official Flows (OOF), i.e.
concessional and non-concessional resources from bilateral and multilateral sources. Thus it only includes non-export-
credit OOF. Since a large share of lending operations by MDBs is non-concessional (hence not ODA), ODF better
represents the reality of support to infrastructure.
4. Multilateral development partners include the EU, a DAC member with its own sources of financing and budgetary
authority, although it has a sui generis legal nature.
5. See Technical Note Section I.B.

10
I. OVERVIEW OF INFRASTRUCTURE FINANCE
1. Current Investments and Projected Gaps in Infrastructure
Projected infrastructure needs require 2-3 times current investments, which are at USD 1 trillion per
year.
7. Developing countries are facing difficulties in meeting their infrastructure needs as investment
requirements are high and expected to increase further in the years ahead. Current infrastructure financing
in developing countries is estimated to be roughly under United States Dollar (USD) 1 trillion per year
(UNCTAD 2014). This figure includes financing from developing country governments, development
partners and the private sector, both domestic and international. When disaggregated, approximately a third
of the expenditures are for transport and energy, respectively, with the remaining third more or less equally
split between water and sanitation and communications. However, to meet the upcoming SDGs, two to
three times these amounts will be required annually up to 2030. Figure 1 presents the current level of
annual financing and the projected investment gaps according to each infrastructure sector6. It shows that
investment would need to increase particularly in energy.
Figure 1. Current Investments and Projected Gaps in Infrastructure
Source: Estimates based on UNCTAD (2014) World Investment Report (See Technical Note, Section I.C.)
Only 6-7% of infrastructure financing in developing countries comes from development partners.
8. In terms of sources of finance, estimates indicate that in total, more than half of infrastructure
finance is paid by developing country governments themselves. About a third of financing also comes from
the private sector. The share of development partners collectively, on the other hand, is actually much
lower at around 6-7% of the total. However, these proportions vary widely depending on the economic
development of the recipient country and the specific characteristics of each infrastructure sector. For
example, large and emerging economies rely much less on development partners than Low-Income
Countries (LICs) which are more aid dependent (see Sy and Rakotondrazaka 2015). This means that the
6. This estimate excludes the investment required for climate change mitigation and adaptation.
160
150
300
260
155
260
260
530
0 100 200 300 400 500 600 700 800 900
Communications
Water and sanitation
Transport
Energy
USD Billion
Current Annual Investments Projected Annual Investment Gaps (2015-2030)
11
importance of support by development partners in LICs would be greater than in middle income countries
or large emerging economies.
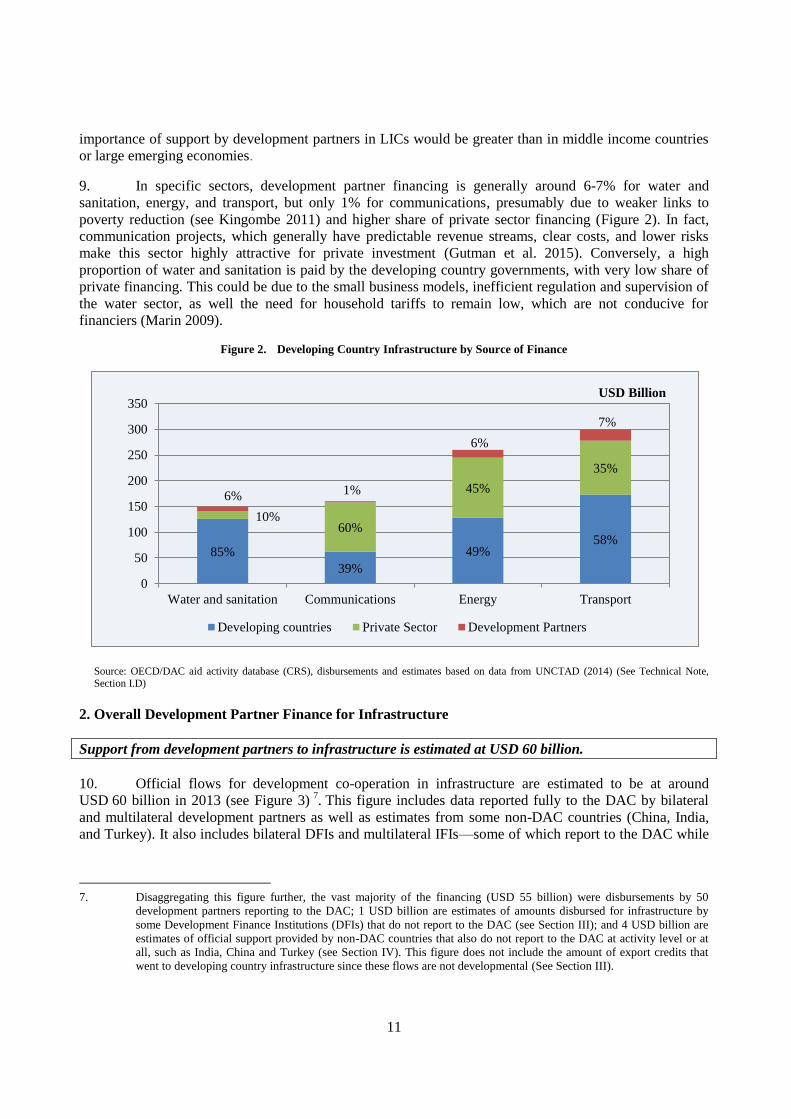
9. In specific sectors, development partner financing is generally around 6-7% for water and
sanitation, energy, and transport, but only 1% for communications, presumably due to weaker links to
poverty reduction (see Kingombe 2011) and higher share of private sector financing (Figure 2). In fact,
communication projects, which generally have predictable revenue streams, clear costs, and lower risks
make this sector highly attractive for private investment (Gutman et al. 2015). Conversely, a high
proportion of water and sanitation is paid by the developing country governments, with very low share of
private financing. This could be due to the small business models, inefficient regulation and supervision of
the water sector, as well the need for household tariffs to remain low, which are not conducive for
financiers (Marin 2009).
Figure 2. Developing Country Infrastructure by Source of Finance
Source: OECD/DAC aid activity database (CRS), disbursements and estimates based on data from UNCTAD (2014) (See Technical Note, Section I.D)
2. Overall Development Partner Finance for Infrastructure
Support from development partners to infrastructure is estimated at USD 60 billion.
10. Official flows for development co-operation in infrastructure are estimated to be at around
USD 60 billion in 2013 (see Figure 3) 7
. This figure includes data reported fully to the DAC by bilateral
and multilateral development partners as well as estimates from some non-DAC countries (China, India,
and Turkey). It also includes bilateral DFIs and multilateral IFIs—some of which report to the DAC while
7. Disaggregating this figure further, the vast majority of the financing (USD 55 billion) were disbursements by 50
development partners reporting to the DAC; 1 USD billion are estimates of amounts disbursed for infrastructure by
some Development Finance Institutions (DFIs) that do not report to the DAC (see Section III); and 4 USD billion are
estimates of official support provided by non-DAC countries that also do not report to the DAC at activity level or at
all, such as India, China and Turkey (see Section IV). This figure does not include the amount of export credits that
went to developing country infrastructure since these flows are not developmental (See Section III).
85%
39%
49% 58%
10% 60%
45%
35%
6% 1%
6%
7%
0
50
100
150
200
250
300
350
Water and sanitation Communications Energy Transport
USD Billion
Developing countries Private Sector Development Partners

12
others do not. Based on the reporting and estimates, calculations show that 46% of official flows to
infrastructure came from bilateral development partners and 54% from multilaterals.
Figure 3. Total Official Support for Development Co-operation in Infrastructure by Development Partners, 2013
Source: OECD/DAC aid activity database (CRS), disbursements and estimates (See Technical Note, Section I.E.)
ODF to infrastructure has been growing considerably, reaching about a third of all ODF to all sectors.
11. To provide a more detailed analysis of the characteristics of official support for development
co-operation in infrastructure, the following part will exclusively consider ODF by the 50 development
partners reporting to the DAC at the activity level8, which totalled USD 55 billion in 2013. In terms of
trends, the data show that disbursements for infrastructure have been growing considerably in the last
years, both in absolute and relative terms, confirming its increasing importance in development
co-operation. More specifically, ODF for infrastructure increased at a compounded annual growth rate of
13% in the period 2008-2013. In addition, the share of infrastructure within ODF to all sectors9 also grew
from 24% to 29%.
12. Regarding development partners, the main providers of ODF to infrastructure in 2013 were
multilaterals, several G7 countries and Korea. The World Bank Group (WBG), which includes the
International Finance Corporation (IFC), was by far the largest development partner, reaching almost
USD 12 billion (Figure 4). Japan, Asian Development Bank (AsDB) and European Union (EU) institutions
also disbursed significant amounts, ranging from USD 5 to 7 billion. Overall, ODF to infrastructure was
concentrated among a few development partners, with the top 10 providing over 80% of the total.
13. Of the USD 55 billion ODF to infrastructure reported to the DAC, slightly more than half (53%)
was Official Development Assistance (ODA) and 47% was non-concessional financing. Disaggregated
8. This is because the harmonised reporting to the CRS provides a level of granularity that allows for a more detailed
analysis whereas data from other sources does not.
9. This includes other sectors such as health, education, agriculture, and so on. However, contributions that are not
targeted to a specific sector, e.g. balance-of-payments support, debt relief, emergency aid -called “non-sector
allocable”- are not considered.
non-DAC countries
DAC countries
DFIs IFIs
MDBs and Int. Org.
Arab
Banks and Funds
Bilateral
Multilateral
Emerging providers 13%
Direct support to the private sector 10%
USD 60 Billion
46%
54%

13
into instruments, 73% was provided in the form of loans, while grants made up 26%, and equity
investments were 1%. Bilaterals collectively extended most of their financing as ODA since they have a
commitment towards reaching a 0.7% ODA/ Gross National Income (GNI) ratio, although Korea, Canada,
the Netherlands, and Austria disbursed more at non-concessional terms. On the other hand, the
multilaterals—which naturally do not have an ODA/GNI ratio target—financed infrastructure mostly at
non-concessional terms, particularly the European Bank for Reconstruction and Development (EBRD)10
.
Figure 4. ODF to Infrastructure by Development Partners, 2013
Source: OECD/DAC aid activity database (CRS), disbursements and estimates (See Technical Note, Section I.F.).
Note: WBG data include actual disbursements of IBRD and IDA as well as estimates of IFC disbursements to infrastructure. Estimates of
disbursements for infrastructure from bilateral DFIs of Austria, Belgium, Denmark Finland, France, Germany, Italy, Netherlands, Norway, Portugal, Sweden, Switzerland, UK, and USA included in total ODF to infrastructure.
10. EBRD amounts include exclusively disbursements to ODA-eligible countries. However, if other countries, such as
Russia and some Eastern European countries were taken into account, total disbursements to infrastructure would reach
roughly EUR 2.1 billion.
11.7
6.6 5.6
5.2 3.2 3.1
2.8
2.6 2.5
2.3 1.6
1.2
1.2 0.9
0.8 0.8
0.6 0.4 0.3 0.3
0.3 0.3 0.2
0.2
0.2 0.1
0,1 0.1 0.1
0.1 0.1 0,1 0.1
0,0 2,0 4,0 6,0 8,0 10,0 12,0
WBGJapanAsDB
EU InstitutionsUnited States
KoreaIADB
GermanyAfDB
FranceIslamic Development Bank
CanadaEBRD
United KingdomNetherlands
Arab FundOFID
AustraliaUnited Arab Emirates
SwedenNorway
SpainKuwait
DenmarkSwitzerland
BelgiumAustriaFinland
Climate Investment FundsBADEA
ItalyCouncil of Europe Dev. Bank
New Zealand
Concessional Non-Concessional

14
Arab partners, some regional development banks, and Japan place high priority on infrastructure.
14. Many development partners had high shares of support for infrastructure among all sectors,
indicating that infrastructure represents a priority in their development co-operation. In particular, several
Arab development partners, AsDB, African Development Bank (AfDB), and Japan disbursed more than
half of their ODF to infrastructure (Figure 5).
Figure 5. Share of Infrastructure in all ODF Sectors, 2013
Source: OECD/DAC aid activity database (CRS), disbursements and estimates (See Technical Note, Section I.F.). Data for Islamic Development Bank (IsDB) is in commitments.
Note: WBG data include IFC estimated disbursements to infrastructure. Estimated disbursements for infrastructure from bilateral DFIs of
Belgium, Denmark, Italy, Netherlands, and Spain included in total ODF to infrastructure.
23%
25%
25%
26%
29%
30%
31%
34%
35%
40%
41%
46%
47%
59%
60%
66%
68%
70%
76%
85%
0% 10% 20% 30% 40% 50% 60% 70% 80% 90% 100%
Canada
Germany
Spain
IADB
Nordic Dev.Fund
EBRD
France
WBG
EU Institutions
UNECE
Korea
Climate Investment Funds
Kuwait
Japan
OFID
AfDB
BADEA
AsDB
Islamic Development Bank
Arab Fund

15
3. Regional, Income Level, Recipient Country and Sectoral Distributions
While Asia was the largest recipient region of ODF to infrastructure, it received proportionally less than
its share of population among developing countries.
15. Regional distribution of ODF for infrastructure in 2013 shows that half went to Asia and about a
third (30%) to Africa11
. Americas and Europe received significantly less at 14% and 9%, respectively (see
Figure 6). Between the bilaterals and multilaterals, the former focused heavily towards Asia and Africa
while the latter provided funding more evenly across the regions. In fact, the vast majority ODF for
infrastructure to the Americas and to Europe came from multilateral development partners, including the
EU. It is important to note, however, that if regional distribution of ODF to infrastructure is compared to
each region’s share of population among developing countries, Asia actually received proportionally less
(i.e. 50% ODF vs. 68% population) whereas Africa, America and Europe received more (See Figure 6).
Figure 6. Regional Distribution of ODF for Infrastructure and Population, 2013
Source: OECD/DAC aid activity database (CRS), commitments
While LICs were the smallest recipient as a group, they received proportionally more than their share of
population among developing countries.
16. In terms of income groups, the largest share of support was disbursed to Lower Middle Income
Countries (LMICs) at 43%, followed by Upper Middle Income Countries (UMICs) at 33% (see Figure 7).
LICs received the least at 24% of total ODF to infrastructure. However, LICs actually received more than
their share of the total population of developing countries, which was 17%, while UMICs received less as
their share of population was 41% and LMICs was more or less proportional. In other words, just
examining the shares of ODF by region or income level does not enable straightforward assessments on
whether the distributions are adequate or not. There may be other measures to compare with, such as the
degree of financing gaps by region and income group that could be explored as well.
11. Regions have been defined from the following region groups in the DAC Creditor Reporting System: “Asia” includes
10007 (Asia), 10008 (Far East Asia), 10009 (South & Central Asia), 10011 (Middle East), 10012 (Oceania);
“Americas” includes 10004 (America), 10005 (North & Central America), 10006 (South America); “Africa” includes
10001 (Africa), 10002 (North of Sahara), 10003 (South of Sahara), and Europe includes 10010 (Europe).

16
Figure 7. Income-Level Distribution of ODF for Infrastructure and Population, 2013
Source: OECD/DAC aid activity database (CRS), commitments.
Top recipients were mostly large emerging LMICs and UMICs.
17. In examining the country breakdown, top recipients were mostly large emerging LMICs and
UMICs, which received a mixture of concessional and non-concessional finance (see Figure 8). Among
these countries, China, Indonesia, Brazil, Kazakhstan, Mexico and South Africa received more
non-concessional finance, while Vietnam had higher proportions of ODA. India, Turkey and Morocco had
similar shares of concessional and non-concessional finance. The focus on these countries might be due to
a combination of country investment needs, stable political environment and capacity of the countries to
absorb and manage the financing. Some examples of country specific infrastructure projects are included in
Box 1.
Figure 8. ODF to Infrastructure: Top Recipients, 2013
Source: OECD/DAC aid activity database (CRS), actual and estimated disbursements.
Note: Estimated ODF disbursements from IFC and IsDB are included for each recipient country. ODF disbursements to each recipient country
from bilateral DFIs of Belgium, the Netherlands, Italy, Spain, as well as OOF disbursements for Denmark’s DFI are not included. (see Technical Note, Section I.F.).
LICs
17%
LICs
24%
LMICs
42%
LMICs
43%
UMICs
41%
UMICs
33%
0% 10% 20% 30% 40% 50% 60% 70% 80% 90% 100%
Po
pu
lati
on
By I
nco
me
Gro
up
%
Dis
trib
uti
on
By I
nco
me
Gro
up
%
1.2
1.3
1.4
2.0
2.3
2.4
2.5
3.0
3.7
4.4
Bangladesh (LIC)
South Africa (UMIC)
Kazakhstan (UMIC)
Brazil (UMIC)
Morocco (LMIC)
Indonesia (LMIC)
Turkey (UMIC)
China (UMIC)
Viet Nam (LMIC)
India (LMIC)
Concessional
Non-Concessional
USD Billion

17
Box 1. Examples of Infrastructure Projects
Kazakhstan Section of Western Europe-Western China International Transit Corridor
The WBG, AsDB, Japan, EBRD, and Islamic Development Bank (IsDB) are co-financing the reconstruction of the
2 800 km Kazakhstan section of the Western Europe - Western China’s international transit corridor. In addition to the
reconstruction, project management consultants have been dispatched to assist the Committee for Roads within the Ministry of
Transport and Communications in the management of activities, including the supervision of all safeguards and fiduciary
aspects and the preparation of a road safety improvement plan. With an estimated project cost of USD 6.5 billion, it is
expected to be completed in 2018 (WBG 2012).
Mozambique’s Rehabilitation of Hydropower Stations
The rehabilitation of hydropower stations in Mavuzi and Chicamba aims to secure the electric supply of Mozambique in
a cost efficient way by replacing generators, modernising control, safety and command systems, and supplying new
transformers. One of the expected outcomes includes a 13% annual production increase of electricity, allowing the nation to
better meet the continuous increase of electric demand (AFD 2014). Project costs totaled EUR 99 million, of which
EUR 36 million was provided as a grant by Sweden, EUR 50 was provided by France in the form of a concessional loan, and a
EUR 18 million non-concessional loan by Germany (Sweden MFA 2013).
Turkey’s Broadband Roll-Out Eastern Regions
The European Investment Bank (EIB) has financed broadband telecommunication services in six Eastern regions of
Turkey through the provision of a EUR 200 million loan to Turk Telecom, out of a total project cost of EUR 470 million. A
guarantee agreement was also signed by a consortium of banks led by Societe Generale. The upgraded access network, with
copper and fibre based technologies, will increase Turk Telekom’s broadband penetration with the provision of high speed
services to a wider extent in rural areas (EIB 2012).
Bangladesh’s Karnaphuli Water Supply Project
The Karnaphuli Water Supply Project aims to provide safer water to the inhabitants of Chittagong. This is in line with
Bangladesh’s Sixth Five Year Plan, which has set the objective of ensuring safer water supply and the reduction of diarrhea
and other waterborne diseases by 2015. Thus improvements are being made to the water supply facilities to increase access to
an additional 650 000 people. The main activities of the project consist of setting up a water treatment plant, constructing one
water intake plant, installing 38 kilometers of transmission pipeline and 505 kilometers of distribution pipeline. The
Government of Bangladesh is financing USD 124 million while Japan is providing USD 462 million (JICA 2013).
Panama’s Canal Expansion Programme
The Inter-American Development Bank (IADB) provided a USD 400 million loan to the Government of Panama (GoP)
to partially finance its USD 5 billion expansion programme of the Panama Canal. The expansion involves the construction of a
new set of locks, which can handle twice as much cargo using 7% less water, and the deepening and widening of channels to
facilitate the transit of large vessels which will increase trade (IADB 2015a).
Almost half of infrastructure ODF is directed towards transport and a third to the energy sector.
18. In terms of sector allocation, Figure 9(a) shows that roughly half (45%) ODF to infrastructure
went to transport in 2013. This was followed by energy at about a third (32%), with the rest mainly
channelled to water and sanitation (19%). ODF to communications amounted to only 4% of the total
amount, which corresponds to the low share of development partner financing among the different types of
financial stakeholders shown in Figure 2. Within energy, renewable energy sources, such as hydro, wind,
solar, geothermal and biomass projects, represented almost two thirds of total (64%) financing for power
generation, whereas non-renewables made up 36%.
18
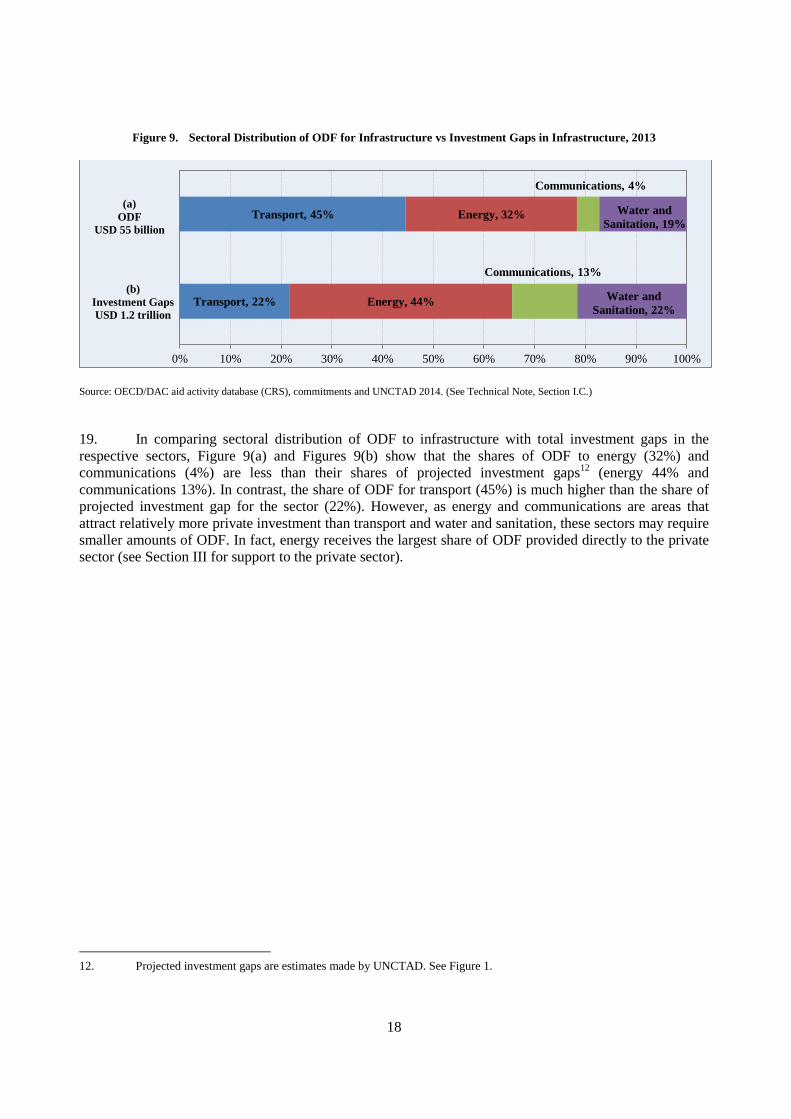
Figure 9. Sectoral Distribution of ODF for Infrastructure vs Investment Gaps in Infrastructure, 2013
Source: OECD/DAC aid activity database (CRS), commitments and UNCTAD 2014. (See Technical Note, Section I.C.)
19. In comparing sectoral distribution of ODF to infrastructure with total investment gaps in the
respective sectors, Figure 9(a) and Figures 9(b) show that the shares of ODF to energy (32%) and
communications (4%) are less than their shares of projected investment gaps12
(energy 44% and
communications 13%). In contrast, the share of ODF for transport (45%) is much higher than the share of
projected investment gap for the sector (22%). However, as energy and communications are areas that
attract relatively more private investment than transport and water and sanitation, these sectors may require
smaller amounts of ODF. In fact, energy receives the largest share of ODF provided directly to the private
sector (see Section III for support to the private sector).
12. Projected investment gaps are estimates made by UNCTAD. See Figure 1.
Transport, 22%
Transport, 45%
Energy, 44%
Energy, 32%
Communications, 13%
Communications, 4%
Water and
Sanitation, 22%
Water and
Sanitation, 19%
0% 10% 20% 30% 40% 50% 60% 70% 80% 90% 100%
(b)
Investment Gaps
USD 1.2 trillion
(a)
ODF
USD 55 billion

19
II. ENABLING ENVIRONMENT FOR
PRIVATE SECTOR PARTICIPATION IN INFRASTRUCTURE
1. Overview of the Enabling Environment for Infrastructure
Development partners support the enabling environment, both for the general investment climate
and within infrastructure sectors.
20. The enabling environment for infrastructure is the set of policies, rules, institutions and services
facilitating private sector participation in infrastructure development. The upstream aspects generally deal
with policy support and capacity building of government officials and other civil servants. On the other
hand, the downstream dimension relate to the development, financing and implementation of bankable
projects, particularly through provision of financial products and advisory services.
21. In recent years, the policy discourse on developing country infrastructure has increasingly
focused on creating the enabling environment to mobilise private finance. In this context, several initiatives
have emerged to assess the enabling environment, such as the WBG’s Doing Business Indicators, the
World Economic Forum’s Global Competitiveness Index and The Economist Intelligence Unit’s
Infrascope. The G20 is also working on this topic, collaborating closely with the OECD on understanding
the role institutional investors in financing the infrastructure gap (see Box 2). In addition, the G20 DWG is
in the process of developing a set of indicators for assessing the enabling environment for infrastructure.
Box 2 – Long-Term Investment by Institutional Investors
Long-term institutional investors—such as pension funds, insurance companies, and mutual funds—could be an important source
of finance for infrastructure as they hold significant resources, estimated at USD 85 trillion in assets in 2012 (Della Croce and
Yermo, 2013). At the same time, their investment in infrastructure is limited, particularly in developing countries. However, given
stock markets volatility and low-interest rates, infrastructure projects could provide institutional investors with long-term inflation-
protected returns. For this reason and to meet the growing financing needs for infrastructure, development partners are increasingly
looking towards tapping into these sources of finance.
The OECD has collaborated extensively with the G20 through the G20/OECD Task Force on Institutional Investors and Long-term
Financing on understanding the policy dimensions of these investors. As a result of this collaboration, the G20/OECD High-Level
Principles on Long-Term Investment Financing by Institutional Investors were presented and endorsed in St Petersburg in
September 2013. The Principles represent a reference tool that aim to help policy makers design a policy and regulatory framework
which encourages long-term investment from institutional investors, including for infrastructure.
22. In order to examine support by development partners to the enabling environment in
infrastructure, this report uses the OECD Policy Framework for Investment (PFI) as a reference tool (see
OECD 2015a). The PFI is a checklist to guide policy and institutional reforms that could improve the
enabling environment to facilitate private investment. Drawing from its infrastructure chapter, this report
identifies two overarching categories, namely: (i) the general investment climate and (ii) the investment
climate within infrastructure sectors. In further breaking down the categories, (i) includes areas such as
Investment Openness and Predictability, Public Governance and Financial Sector, which are outside the
infrastructure sectors. As for (ii), it includes policy, regulation and management within the specific
infrastructure sectors of water and sanitation, transport, energy, and communications (see Figure 10). This
excludes “hard infrastructure”, i.e., financing construction and provision of hardware. The following
section will provide descriptions of the activities by development partners in supporting the enabling
environment according to the categories explained above.

20
Figure 10. Diagram of Development Partner Support to the Enabling Environment for Infrastructure
2. Categories of the Enabling Environment
A. General Investment Climate
23. General investment climate is the part of the enabling environment that directly or indirectly
affects investment in all the infrastructure sectors. It includes the following sub-categories: (i) Investment
Policy Openness and Predictability; (ii) Financial Sector; and (iii) Public Governance.
(i) Investment Policy Openness and Predictability
24. Development partners provide significant assistance to developing countries to devise and
establish policy and regulatory frameworks that are conducive for investment, particularly around dispute
settlement mechanisms and rules that protect investor rights. The rationale behind these interventions is
that private participation in infrastructure requires stable market-based policy frameworks anchored in the
rule of law (OECD 2015a). Furthermore, once favourable investment regimes are in place, investors expect
that undue public interference and changes in regulatory configurations will not affect the capacity of the
investment to deliver a steady and low-risk return. This is a crucial aspect for prospective investors as
infrastructure investments involve long-term payback periods.
25. Development co-operation related to investment openness focuses on assisting host governments
in reducing barriers to competition, such as: streamlining business registration procedures; implementing
sound labour law regimes; and strengthening the corporate governance of state-owned enterprises (SOEs).
To enhance predictability in the investment climate, assistance to legal and judicial development has been
provided, which encompass: improving contract enforcement; developing legal and technical frameworks
for the administration of property rights; increasing efficiency and fairness in commercial dispute
resolutions; and creating alternative dispute settlement mechanisms. Furthermore, development partners
provide direct support to the private sector to boost productivity and to build capacity in business
management.
ENABLING ENVIRONMENT
ODF to Infrastructure Sector
- Water - Transport - Energy - Communications
General Investment Climate
Infrastructure Sectors
Hardware and construction
Policy, Regulation and Management
Investment Openness and Predictability
Public Governance Financial
Sector

21
(ii) Financial Sector
26. A vibrant and sound financial market is fundamental in facilitating investments in infrastructure.
In particular, for the smooth functioning of the economy, a financial regulatory system with efficient and
independent agencies that enables financial institutions and intermediaries to support infrastructure projects
is needed. However, high investment costs for construction, underdeveloped local capital markets and the
lack of the capacity and scale of financing or managing complex and capital-intensive projects make local
financial institutions in many developing countries—particularly LICs—unsuitable investors.
27. Development partners thus try to contribute to the improvement of the financial sector at both the
upstream and downstream levels. At the upstream level, support is provided for capacity building in
national policy and regulatory reform, with the aim of developing sound capital markets as well as banking
and insurance supervisory agencies. At the downstream level, development partners are helping reinforce
financial institutions in supporting and managing projects, including in infrastructure. This involves the
adoption of sound risk management practices as well as advanced technology and payment systems.
Assistance is also provided at the transaction level for infrastructure investment facilities as well as
banking institutions that on-lend to infrastructure project developers. Many of these are small- and
medium-sized companies in the field of energy efficiency or renewable energy.
(iii) Public Governance
28. Poor public governance due to lack of administrative capacity and resources can be detrimental
for the enabling environment. For example, deficiencies in project identification and preparation, awarding
processes, and budget and fiscal monitoring by procurement bodies and PPP units, can reduce prospects for
investment (Schmidt-Traub and Sachs 2015). This is all the more applicable for PPPs carried out via
complex financial arrangements between local governmental authorities and private sector actors that
require significant administrative and technical capacity. Furthermore, corruption can undermine the
effective functioning of public administration by obstructing the efficient allocation of public finance for
infrastructure, particularly with regards to procurement and other awarding processes.
29. Therefore, public governance has been one of the main areas addressed by development partners.
Assistance involved enhancing public administrative capacity or procedures that directly or indirectly
affect the preparation and smooth operation of infrastructure projects. They have been offered at both the
national and sub-national levels, often in establishing transparent and competitive procurement processes
as well as budgeting and public financial management. They aim to ensure efficient and effective service
delivery, often through promoting private participation in infrastructure through the use of PPPs. Other
types of assistance concern implementing anti-corruption reforms or creating anti-corruption commissions
and other oversight bodies to promote good governance and accountability.

22
Box 2. Examples of Projects Supporting the Enabling Environment for General Investment Climate
Investment Openness and Predictability: Building a Reliable Investment Climate in Kenya
The United Kingdom (UK) is providing 14 million British Pounds to help improve the environment for businesses and
economic development in Kenya. To date, the project has supported the Government of Kenya in launching a new Business
Environment Delivery Unit to streamline the issuing of construction permits and business licenses. The Kenya National
Electronic Single Window System has also been established to speed up clearance of exports and imports. Furthermore, the
UK has helped strengthen the capacity of the PPP Unit and the Competition Authority of Kenya. As a result, national PPP
regulations have been approved by Parliament and the investment policy has been updated to facilitate increased Foreign
Direct Investment into Kenya (DFID 2013).
Financial Sector: Serbia’s Sustainable Energy Direct Financing Facility
In Serbia, the EBRD has provided a EUR 10 million loan to Komercijalna Banka for on-lending to private and
municipal borrowers through the Western Balkans Sustainable Energy Direct Financing Facility (Melohina 2014). The aim
of the loan is to support energy efficiency projects in commercial building and industrial sectors, as well as small renewable
energy and energy conservation projects in companies and municipal buildings. With this financing, the EBRD aims to raise
awareness on the benefits of energy conservation and to help overcome existing market barriers to sustainable energy
investments through the provision of longer-term funding (EBRD 2013).
Public Governance: Philippines’ Strengthening Public Private Partnership Programme
The goal of this technical assistance programme is to boost private sector participation and investment in infrastructure
in the Philippines through capacity building of the PPP systems. Specifically, consultants were dispatched to the PPP Center
of the National Economic and Development Authority to: strengthen PPP legal and regulatory frameworks; institutionalise
best practices in project appraisal, risk assessment, and bidding processes; and help create a modern, web-based PPP
management information system. The programme also established a facility to prepare bankable PPP projects for
competitive bidding. As of 2012, nine PPP projects have been approved. The total budget of USD 51 million is
grant-financed by AsDB, Australia, and Canada (AsDB 2012).
B. Enabling Environment within Infrastructure Sectors
30. In addition to bottlenecks in the general investment climate, impediments within the four
infrastructure sectors of water, transport, energy, and communications may also hinder private investment.
With high entry costs and considerable public interest, infrastructure industries have a natural tendency to
degenerate into monopolies or concentrated markets with low levels of competition. Some sectors face
more obstacles than others. For instance, energy and communications are able to attract more private sector
participation as they are excludable goods where fees can be easily charged (Spratt and Collins 2012).
Conversely, the water sector is not conducive for private financing since - as a fundamental good for
livelihood - public interest is high and price has to be low (Marin 2009). In consequence, national policy
and regulatory frameworks need to take the particular features of the infrastructure market into
consideration to attract private sector participation.
31. Main measures include liberalising infrastructure industries and subjecting the related markets to
appropriate commercial pressures (OECD 2015). Higher competition should be coupled with prices that
balance attractive cost-recovery mechanisms for the private sector while serving the public interest in
developing quality infrastructure at reasonable prices (ibid.). Furthermore, particularly for public utilities
such as electricity, gas, water and sewage, the establishment of independent regulatory agencies is crucial
for undertaking appropriate tariff-setting and supervisory oversight.
32. In this context, development partners have supported institutional capacity building within the
infrastructure sectors to enhance market access and competition, which could directly boost incentives for
private investment. Examples include supporting municipalities to build capacity in sustainable use and
management of water resources, including developing an updated and more appropriate tariff system in
order to improve cost recovery, while also maintaining affordability. Other projects have supported the

23
reform of public enterprises in the telecommunications, transport, and energy sectors, by strengthening
regulatory authorities, financial and operational restructuring of SOEs, and facilitating the government’s
divestiture from public enterprises. Moreover, some programmes are aimed at ensuring a transparent
national or sub-national regulatory framework and better inter-ministerial co-ordination for enhanced
competition within the particular sector (see Box 3 for examples of projects).
Box 3. PPIAF and Examples of Projects Supporting the Enabling Environment for Infrastructure Sectors
Public-Private Infrastructure Advisory Facility (PPIAF)
PPIAF is a trust fund financed by bilateral and multilateral development partners and hosted at the World Bank to help
developing country governments create the enabling environment conducive for PPPs in infrastructure. The sectors targeted
by the fund are energy, water and sanitation, transportation, telecommunications and irrigation. Two thirds of its funds are
directed to LICs and half to Africa. PPIAF activities mainly consist of upstream technical assistance in support of policies,
laws, regulations, and institutions, even though the fund also provides project preparation services to facilitate private
participation in specific transactions. Its operations are structured around three strategic pillars (i.e. universal access, climate
change, facilitating urbanisation) and four cross-cutting themes (i.e. sub-national finance, fragile states, regional integration,
and capacity building). Examples of projects supported by PPIAF include the Dakar-Diamniadio Toll Highway Project
where the fund supported the establishment and implementation of the legal and institutional framework in the transport
sector in Senegal (see Annex Case II).
Costa Rica’s Sustainable Urban Mobility for Greater San Jose Metropolitan Area
The objective of this project is to support the Government of Costa Rica in their goal towards becoming carbon neutral
by 2021 through the production of studies and the implementation of policies to reduce greenhouse gases (GHG) in the
Greater San Jose Metropolitan area. This includes research on the impact of increased bike lanes, developing strategies to
implement transport and land use policies, particularly to reduce vehicle use and CO2 emissions (IADB 2015b). The total
cost of this project is USD 3 million, with IADB providing USD 2 million and additional financing of USD 1 million
provided by the Global Environment Facility (GEF 2014).
Mediterranean Region New Approaches to Telecommunications Policy
The EU has provided assistance to regulatory authorities across 10 North African and Middle Eastern countries through
the New Approaches to Telecommunications Policy (NATP) Programme. It aims to help host countries liberalise their
telecommunication markets and to align with EU regulation. Therefore, it assists regulatory authorities in the host countries
with the legislative and institutional design of telecommunication policy through workshops, study visits and conferences.
The NATP has established the Euro-Mediterranean Regulators Group (EMERG), a platform to facilitate co-operation among
the telecommunication regulators and to share best practices for a more harmonised and predictable regulatory environment.
A total of EUR 7 million for the Programme was provided in the form of grants (EC 2004, EC 2005, EC 2009).
Tanzania’s Integrated Water, Sanitation and Hygiene Programme (iWASH)
The iWASH Programme aims to improve water supply, sanitation, and hygiene services in rural areas and small towns
in Tanzania, targeting the public and private sectors, as well as communities. By working with the Ministry of Water and
Irrigation and regional authorities, iWASH seeks to improve policy and regulations to expand service delivery and treatment.
It also helps to set appropriate tariffs that recover costs while addressing affordability and access issues. Furthermore, the
Programme encourages the provision of infrastructure hardware by local businesses and empowers communities to improve
their access to the services. The USD 15 million Programme is funded by United States Agency for International
Development (USAID), with complementary support from the Water and Development Alliance partnership between
USAID and The Coca Cola Company (USAID 2012, 2013).
China ’s Energy Policy and Energy Efficiency
This project supported key institutions in creating energy policies at the national and subnational levels to increase
financial resources and energy efficiency. With a USD 10 million grant, it dispatched German experts working in business,
policy, research and consultancy to assist Chinese partners in the sustainable utilisation of energy in China’s industrial
sector. The project helped develop new energy consumption standards for energy-intensive industrial sectors and brought
together coal production plants to facilitate more efficient use and processing of by-products. It also carried out training for
energy auditors and energy managers at the State Grid Corporation of China so that they can provide advice independently
within and for the company in the future (GIZ 2015).

24
3. ODF for the Enabling Environment
Financing for the enabling environment amounted to USD 34 billion in 2013, mostly towards the
general investment climate.
33. By using the PFI as a benchmark, development partners that report to the DAC contributed
significant ODF to the enabling environment, reaching roughly USD 34 billion in 201313
, which was
somewhat less than ODF spent for physical infrastructure (USD 42 billion). About two thirds of this
amount (62%) was directed to help improve the general investment climate –the financial sector (31%),
public governance (24%), and investment policy openness and predictability (7%)–which are not part of
ODF for infrastructure (see Figure 10). Slightly more than a third (38%) was directed to support policy
development and capacity building of the infrastructure sectors. Within the four infrastructure sectors, the
distribution was more or less similar to that of the overall infrastructure ODF (i.e. high for energy and
transport, low for communications and water and sanitation).
Figure 11. ODF to the Enabling Environment for Infrastructure, 2013
Source: OECD/DAC aid activity database (CRS), commitments.
34. Top development partners contributing ODF to the enabling environment in absolute amounts
were also generally the same as for overall infrastructure ODF shown in Figure 4. However, among these,
IADB, the UK, EBRD, WBG, Germany and the United States of America (USA) devoted high shares14
for
the enabling environment. This is in contrast with those that allocated high shares for infrastructure in
general, e.g. Arab development partners, AsDB and AfDB (see Figure 5), which devoted significantly
more resources to the hardware of infrastructure instead of the enabling environment. As for the regional,
income-level and country distributions of the enabling environment, these were also not remarkably
different from the allocation of the overall ODF for infrastructure. One notable point, however, is that the
financial sector of UMICs received a relatively high share of support compared to other income-levels,
which is presumably due to their comparatively developed capital markets and financial institutions as well
as better prospects in raising private financing.
13. See Technical Notes, Section II.A for DAC CRS purpose codes designated as enabling environment for infrastructure
and Section II.B for IsDB and IFC enabling environment estimates.
14. See Technical Note, Section II. C for calculation of share of ODF to enabling environment for infrastructure.
Investment Openness and Predictability
7%
Financial Sector 31%
Public Governance
24%
Infrastructure Sectors
38%

25
III. SUPPORT TO THE PRIVATE SECTOR
1. Development Finance Institutions and International Financial Institutions
A. Characteristics of DFIs and IFIs
DFIs/IFIs provide equity, loans, guarantees and technical assistance to the private sector to
mobilise resources for infrastructure.
35. In addition to assisting governments, development partners directly support the private sector to
mobilise financial resources for infrastructure. This assistance is mainly provided by DFIs and multilateral
IFIs which offer financial or technical support to the private sector for activities with a developmental
purpose. Given the rising need to mobilise private resources for development, the interest towards
DFIs/IFIs has been growing – a trend being accentuated in the aftermath of the global financial crisis.
36. Institutionally, bilateral DFIs can be fully or partly owned by national governments, located
under ministries charged with development co-operation, bilateral aid agencies or, more rarely,
non-development ministries. Alternatively, some of them are autonomous from the government. Examples
of bilateral DFIs are CDC Group of UK (CDC), German Investment and Development Corporation (DEG),
Netherlands Development Finance Company (FMO), Overseas Private Investment Corporation (OPIC) of
USA, and Promotion et Participation pour la Coopération économique (PROPARCO) of France. Some
DFIs are mandated to support national companies, while others target developing country private sector.
37. For multilateral IFIs, private sector operations are generally undertaken by: specific departments,
divisions or arms (e.g. AfDB, AsDB, IADB); legally and financially independent institutions within
overarching organisations (e.g. IFC, Multilateral Investment Guarantee Agency); or by various
departments as part of mainstreaming support to the private sector (EBRD). In addition to DFIs/IFIs,
several countries have created special programmes within existing institutions providing similar types of
support to the private sector: e.g. Canada’s Public-Private Partnerships for Development within the
Department of Foreign Affairs, Trade and Development, Japan’s Private Sector Investment Finance within
Japan International Co-operation Agency.
38. DFIs/IFIs generally mitigate risks, real or perceived, of private-led investment for development
undertaken at commercial or quasi-commercial terms. In fact, an analysis of the risk profile of
infrastructure investments shows that mobilisation of private finance for infrastructure is particularly
exposed to significant risks, both project specific and related to the general investment climate of the
country (see Section II). In spite of lower competition than with other types of investment assets - partially
due to the scale and public goods nature - infrastructure projects are characterised by large sunk costs,
exposure to regulatory changes, limited product diversification and long-term payback periods on capital
investments that can significantly impact operating incomes (Rothballer 2011). For these reasons,
obtaining sufficient private financing is a challenge, particularly for the construction phase which is
associated with high completion risks.
39. In particular, DFI/IFIs try to compensate for the lack of financial resources and remove
investment bottlenecks through advisory services (e.g. project preparation facilities), co-financing
(e.g. equity and debt), and risk mitigation finance (e.g. guarantees). The support provided is therefore
catalytic insofar as these institutions contribute to the development, financing and implementation of
infrastructure projects with private sector participation. By offering project preparation services, DFIs/IFIs
help private partners in devising bankable projects that are able to generate risk-adjusted returns as well as
positive development impact. Furthermore, they reassure private investors by directly investing in

26
infrastructure through equity participation, while simultaneously providing robust expertise throughout the
whole project cycle. DFIs/IFIs have higher levels of liquidity than commercial banks due to large amounts
of paid-in capital, tax exemptions on dividends and corporate profit, AAA institutional credit rating and an
implicit state guarantee (te Welde and Warner 2007).
Hard evidence of DFI/IFI additionality is scarce, mainly due to confidentiality of commercial
activities.
40. To examine DFI/IFI additionality, several impact dimensions need to be taken into consideration.
They include: project design (i.e. development of bankable projects by providing technical assistance);
mobilisation of private finance; demonstration effect (i.e. evidence-base created for enticing further
investment in the sector); and policy change (i.e. design and implementation of investment climate reforms
through support) (Spratt and Ryan-Collins 2012). However, research points out that hard evidence to
assess additionality is scarce, although overall, available data point to DFIs/IFIs generating more financial
additionality in poorer countries and/or in sectors that are less commercially viable (ibid.). This is possibly
due to the private sector’s reluctance to invest in these countries and sectors without DFI/IFI support.
41. This lack of evidence can be attributed to the particular nature of DFIs/IFIs as institutions dealing
with projects with commercial dimensions. In fact, supporting the private sector and their commercial
activities quite often entails levels of confidentiality that reduce the information flow related to the
projects, although some DFIs/IFIs are more transparent than others. Issues of transparency can be even
more problematic as an increasingly common practice of certain DFIs/IFIs is to support financial
intermediaries, such as private equity funds, in turn investing in infrastructure projects (Geary 2015).
While this practice has the advantage of directing financing to investment vehicles that have robust
experience in participating in infrastructure development, obtaining information on the impact of the
project is even harder as the chain of intermediation is extended.
B. ODF for Infrastructure by DFIs and IFIs
DFIs/IFIs disbursed an estimated 5.9 USD billion to the private sector for infrastructure.
42. In 2013, total ODF directly disbursed to the private sector for infrastructure by DFIs/IFIs is
estimated at 5.9 USD billion15
. Of this amount, the IFIs disbursed around 71% – led unrivalled by IFC
which provided USD 1.9 billion, followed by IADB, EBRD, and AsDB (see Figure 11). Major bilateral
DFIs included FMO, DEG, and PROPARCO.
15. See Technical Notes, Section III for estimates of disbursements for infrastructure from DFI’s/IFI’s that do not report a
sectoral breakdown to the DAC or do not report at all.

27
Figure 12. ODF to Infrastructure from Development Finance Institutions, 2013
Source: OECD DAC aid activity database (CRS), disbursements and estimates (See Technical Notes, Section III)
Significant DFI/IFI financing for infrastructure is directed towards UMICs and energy, which raises
the question of additionality.
43. According to data by DFIs/IFIs that report to the DAC, in 2013, the Americas received the largest
share of total ODF (35%), followed by Asia with a comparable amount (33%). Africa (14%) and Europe
(18%) received the remaining third. If the overall regional distribution of ODF for infrastructure (see
Figure 6) is taken as a benchmark, the data show that DFIs/IFIs have focused more on the Americas and to
some extent Europe and less on Asia and Africa.
44. In terms of income groups, it is noteworthy that a vast majority (66%) of the projects were in
UMICs and only 7% in LICs (see Figure 13). Such a concentration on UMICs is presumably due to the
better enabling environment and returns for private investment in countries with higher economic
performance. The top recipient countries of DFI/IFI support to infrastructure included China, Turkey, India
and Brazil (see Figure 14)— which are large emerging economies and have the highest levels of private
sector participation in infrastructure in the developing world (Kasper and Jett 2014). This raises the
question of additionality of official support for development co-operation (i.e. whether the private
investment would not have happened if it were not for the support) since the scale and the performance of
financial and economic sectors are relatively developed in these countries.
1,913
776
709
668
439
354
304
248
211
114
45
41
25
21
14
12
7
7
2
0
0 500 1000 1500 2000
World Bank (IFC)
IADB
EBRD
AsDB
Netherlands (FMO)
AfDB
Germany (DEG)
France (PROPARCO)
United Kingdom (CDC)
Spain (COFIDES)
USA (OPIC)
Belgium (BIO)
Norway (Norfund)
Austria (OeEB)
Denmark (IFU)
Finland (Finnfund)
Italy (SIMEST)
Switzerland (Sifem)
Sweden (Swedfund)
Portugal (SOFID)
USD Million

28
Figure 13. Income Level Distribution of ODF by DFI/IFIs to the Private Sector for Infrastructure, 2013
Source: OECD/DAC aid activity database (CRS), commitments
Note: Includes data on IFC, IADB, EBRD, AsDB, AfDB, DEG, CDC, OPIC, Norfund, FinnFund, Swedfund, and SOFID. See Technical Note Section III.B.
Figure 14. ODF for Infrastructure: Top DFIs/IFIs recipients, 2013
Source: OECD/DAC aid activity database (CRS), disbursements and estimates (See Technical Notes).
Notes: Includes receipts from IFC, IADB, EBRD, AsDB, AfDB, DEG, CDC, OPIC, Norfund, FinnFund, Swedfund, and SOFID. See Technical Note Section III.B.
45. In terms of sectoral distribution, over half (56%) of support by DFIs/IFIs went to energy,
followed by transport at 27%, water and sanitation at 9% and communication 8%. A comparison with the
overall distribution of ODF for infrastructure (see Figure 9a) shows that DFIs/IFIs focus more on energy
and less on transport and water and sanitation. Again, as energy is a sector where the private investment is
relatively high (See Figure 2 in Section 1), the question of additionality of DFIs/IFIs in trying to leverage
from this sector at the aggregate level may arise. At the same time, this significant focus on energy could
LICs
7%
LMICs
27%
UMICs
66%
557
380
372
337
334
216
189
166
145
139
0 100 200 300 400 500 600
China (UMIC)
Turkey (UMIC)
India (LMIC)
Panama (UMIC)
South Africa (UMIC)
Chile (UMIC)
Colombia (UMIC)
Brazil (UMIC)
Kazakhstan (UMIC)
Cote d'Ivoire (LMIC)

29
be justified since the need of financing in this sector is higher than the others in order to meet the SDGs in
2030 (see Figure 1 in Section I). Furthermore, of ODF allocated by DFIs/IFIs to power generation, a large
majority (83%) was provided for renewable energy projects. The data suggest that DFIs/IFIs focused more
on renewables than development co-operation agencies supporting infrastructure (see Section I).
Figure 15. Sectoral Distribution of ODF to Infrastructure from DFIs/IFIs, 2013
Source: OECD/DAC aid activity database (CRS), commitments.
Note: Includes data on IFC, IADB, EBRD, AsDB, AfDB, DEG, CDC, OPIC, Norfund, FinnFund, Swedfund, and SOFID. See Technical Note Section III.B.
C. Mobilising private sector finance through DFIs/IFIs
46. Determining how much is mobilised from the private sector is often a complex exercise.
Specifically on measuring financial support of DFIs/IFIs, the DAC is currently carrying out work to
develop a methodology to measure the amounts mobilised from the private sector through ODF
interventions. The results of this work, expected to become available by the end of 2015, will entail setting
up a database to record the leveraging effect of private-sector instruments, which hitherto has not been
reliably or uniformly measured in international statistical systems. The standardisation will encourage
more visibility and transparency regarding the use of these instruments, which in turn will permit evidence-
based analyses of their leveraging potential, and greater understanding about how the use of instruments
can be optimised (OECD 2014a).
47. As part of this work, a survey was conducted to measure private sector financing mobilised
between 2012 and 2014 as a result of ODF interventions through syndicated loans, guarantees and shares
in collective investment vehicles (CIVs)16
. While the data remain to be completed by a few institutions,
preliminary results of this survey suggest that these instruments mobilised on average USD 5.6 billion
annually for infrastructure from the private sector (see Figure 16)17
. This amount has been mainly
mobilised through guarantees (USD 2.5 billion) and syndicated loans (USD 2.6 billion) with shares in
CIVs mobilising a smaller portion (USD 0.5 billion). The distributions of financing mobilised from the
16. Surveys on other leveraging instruments such as direct equities, mezzanine finance, credit lines, concessional loans and
grants will be carried out subsequently.
17. As the set of DFIs/IFI and the related data in this Survey is not the same as the ones used for the analysis in sub-section
B above, the findings are not comparable.
Communications 8%
Energy 51%
Transport 32%
Water and Sanitation
9%

30
private sector for infrastructure follow a very similar pattern with those of DFIs/IFIs, i.e. highest in Asia
and America, UMICs and energy.
Figure 16. Private Finance Mobilised by DFI/IFIs for Infrastructure, 2012-2014 (annual average)
Source: 2015 OECD DAC Survey on Amounts Mobilised from the Private Sector by Official Development Finance Interventions
48. However, DFI/IFI interventions are sometimes coupled with support to the public sector by other
development partners for policy reforms, which are vital in the decision making of the private sector to
invest (see Annex). Therefore, attributing mobilisation of private resources only to DFIs/IFIs and specific
instruments may be debatable. Furthermore, evidence shows that mobilising effect of their intervention
may be limited in some circumstances. For instance, in the Dakar-Diamniadio Toll Highway project in
Senegal (See Annex: Case II) DFIs provided 26% of project funding and mobilised 17% from the private
sector (ratio of 1:0.7). In the Gigawatt Solar Power Plant in Rwanda (See Annex: Case I) the ratio is even
lower with DFIs providing 91% of project funding and only mobilising 9% from the private sector (ratio of
1:0.1). For this reason, further examination of cases, including in Asia and the Americas, would provide
more insight, as several factors may account for varying levels of private participation in infrastructure.
2. Initiatives Supporting Private Finance Mobilisation to infrastructure
Project Preparation Facilities, Project Facilitation Platforms and Blended Finance operations are
measures used by development partners to attract private investment for infrastructure.
49. A number of initiatives which aim at mobilising private finance for infrastructure are gaining
traction. The objective of these initiatives from the public sector is to tap into resources of the private
sector by: (i) facilitating the design of bankable projects; (ii) creating platforms for deal matching of
projects between public and private financers; and (iii) providing finance for blending operations. The
following describes each category.
Project Preparation Facilities (PPFs) are generally grant-financed instruments created to streamline
the preparation of infrastructure projects thus increasing their quantity and their quality. It is
estimated that the cost of PPFs for complex PPPs in infrastructure is between 5% and 10% of total
project costs (MDB working group on infrastructure, 2011). PPFs can be multiregional and
Shares in
CIVs
USD
0.5 billion
Syndicated Loans
USD
2.6 billion
Guarantees
USD
2.5 billion
USD 5.6 Billion Mobilised From the Private Sector

31
multisectoral or focus on specific regions and sectors, normally hosted by multilaterals, although
some bilaterals create their own PPFs to support their domestic companies. Examples are the Asia
Pacific PPF (hosted by the AsDB); the NEPAD Infrastructure PPF (hosted by the African Union)
and the Infrastructure PPF (hosted by the EBRD).
Project Facilitation Platforms aim at bringing together financiers, host countries, aid agencies and
DFIs/IFIs, with the view to facilitate structuring and co-financing of infrastructure projects by
harnessing capital and expertise from both the public and the private sectors. These platforms are
generally hosted by MDBs and intergovernmental institutions. They include the G20 Global
Infrastructure Hub, the World Bank’s Global Infrastructure Facility, and the newly created World
Economic Forum/OECD Sustainable Development Investment Partnership. Some platforms do not
provide direct financial support to projects, while others do, such as the AfDB’s Africa 50
Infrastructure Fund.
Blended Finance is defined as the complementary use of grants (or grant-equivalent instruments)
and non-grant financing from private and/or public sources to provide financing on terms that
would make projects financially viable and/or financial sustainable (Mustapha et al. 2014). By
injecting grant financing to commercial projects, the aim of blended finance is to create favorable
conditions that crowd-in private investment. Blending facilities may combine grants from aid
agencies with long-term financing in the form of loans or equity by DFIs and private financers (see
Box 4). Some blended finance instruments include output-base aid (OBA), which is the provision
of grant-subsidies tied to the compliance with the delivery of specific services such as electricity
and water and sanitation for poor people (Miyamoto and Biousse 2014; Mustapha et al. 2014).
Box 4. Blending Operations of the European Union with DFIs/IFIs
The European Union has developed several tools for financing infrastructure in association with DFIs/IFIs, including the regional
investment blending facilities and several trust funds (e.g. Bêkou Trust Fund for Central African Republic). EU blending consists
of mixing grants from the European Commission with debt and equity from European DFIs/IFIs. Since 2007, EU provided
EUR 2 billion of grants to blending facilities that leveraged total of EUR 43 billion from public and private sources. The majority
of projects were in energy, transport and water and sanitation. For 2014-2020, the EU is planning to increase the blending
operations to leverage up to EUR 100 billion from additional public and private sources.
3. Export Credits
ECA commitments for infrastructure in LICs was at USD 924 million.
50. The majority of DAC countries have ECAs—often supervised by the Trade or Finance
Ministries— that support exports of domestic enterprises through credit, insurance and guarantee.
However, as ECAs do not usually have development-related objectives, their financing to developing
country infrastructure is not part of ODF amounts considered in this report. At the same time, their
activities significantly impact developing country infrastructure. For example, ECAs support domestic
enterprises to export to developing countries wind turbines, power plant machineries, water pipe systems,
telecommunication equipment, and so on (see Table 1).
51. ECAs are different from DFIs as their main objective is to support exports of domestic
companies instead of development and they do not generally engage in project design. However, the
distinction between the two types of institutions is blurred when bilateral DFIs mainly support their

32
domestic enterprises with credits and guarantees. Therefore, in order to maximise development impact and
to ensure policy coherence for development - which OECD countries have committed to18
- the division of
role and co-ordination between DFIs and ECAs in financing developing country infrastructure could be
further examined19
.
52. Data collected by the OECD Trade Committee's Working Party on Export Credits and Credit
Guarantees (ECG) shows that in 2013, USD 924 million was committed by bilateral DAC countries for
infrastructure in LICs, excluding non-fixed assets such as aircrafts, ships, vehicles, etc. Data on
disbursements are not available, but they are usually lower than commitments. To put this in perspective,
the USD 924 million ECA commitments for infrastructure in LICs was equivalent to 12% of bilateral DAC
country ODF commitments to infrastructure for LICs in 2013. Individual project commitments varied
widely, ranging from USD 3 million to USD 360 million.
53. ECA activities involving LICs are subject to an agreement on sustainable lending practices. This
is in addition to the Arrangement on Officially Supported Export Credits that provide a framework for a
level playing field among ECA operations globally20
. The Sustainable Lending guidelines stipulate that
export credits for public buyers and publicly guaranteed buyers in LICs should generate net positive
economic returns, foster sustainable development by avoiding unproductive expenditures, preserve debt
sustainability and support good governance and transparency (OECD, 2008). The adherence to these
principles by members of the ECG is monitored biannually by its Secretariat.
54. In addition, members of the ECG are discussing a phase out of ECA financing for coal plants as
part of a larger effort to end public financing for fossil fuels and high carbon projects. According to data
compiled by the Natural Resources Defense Council, ECAs from OECD countries were responsible for
58% of public support, or roughly USD 5 billion per year, for coal plant projects globally between 2007
and 2013 (NGO Briefing 2014 ). For over a year, the OECD has attempted to reach an agreement on the
phase out of export credits for coal plants, facing opposition from several countries experiencing industry
pressure to resist limits on coal finance. The ECG aims to reach an accord before the UN Conference on
Climate Change in December 2015.
18. OECD Declaration on Policy Coherence for Development (2008). See
http://www.oecd.org/pcd/ministerialdeclarationonpolicycoherencefordevelopment.htm.
19. See European International Contractors’ background paper on “Modernising the definition of ODA” of March 2014,
available at http://eic-federation.eu/media/uploads/newsletter/2014_3_mar/eic_background_paper_oecd-
dac_modernising-oda-definition.pdf.
20. Arrangement on Export Credits please see: http://www.oecd.org/tad/xcred/arrangement.htm.

33
Table 1. Examples of ECA Infrastructure Projects in LICs, 2012-2013 (Commitments)
Reporting
Country
Buyer
Country
Project Name Project Description Sector
USA Honduras Cerro De Hula Wind Farm
(Phase 2)
wind turbines, ancillary services -
Engineering and Procurement
Contract
Energy
Finland Zambia NECL Power Plant delivery and erection of generating
sets to a heavy fuel oil power plant
Energy
Belgium Sri Lanka Expanding Etislata Sri
Lanka Network
telecom equipment Communications
France Ghana Substation Reliability and
Enhancement Project
(Phase 1)
Upgrade and enhancement of
operational reliability of Ghana Grid
Company’s equipment by replacing
obsolete and faulty components at 9
substations
Energy
Portugal Mozambique Road N260 Road
Rehabilitation Project
road rehabilitations project Transport
Spain Sri Lanka Grater Ratnapura Water
Supply Scheme
water treatment plant of 27000
m3/day of capacity including water
pipes system, engineering, tanks,
vehicles and machinery
Water and
Sanitation
UK Sri Lanka Regional Bridge
Programme (Phase 2)
design, build, fabricate, supply, install
and commission up to 104 bridges of
varying types
Transport
Turkey Ghana Akim Oda, Akwatia and
Winneba Water Supply
Project
water intake structures, treatment
plant, pumping stations, transmission
line, storage unit and the network to
transfer water to final user
Water and
Sanitation
Sweden Ghana Airtel (Ghana) Network
Expansion 2013
deliveries and installation of
telecommunications equipment
Communications
Austria Kenya Kindaruma Power Station
2012
electromechanical equipment,
hydropower plant
Energy
Germany Bangladesh Ashuganj South 450 MW
Combined Cycle Power
Plant
power stations burning fossil fuels Energy
Denmark Mozambique Electrification in
Mozambique
installation of high voltage power
lines and transformer stations
Energy

34
IV. SUPPORT TO GREEN INFRASTRUCTURE
Thirty-seven percent of ODF to infrastructure is for mitigating GHG emissions and adapting to a
changing climate.
55. Over the next decade, developing countries face the challenge of reducing poverty while
responding to the growing threat of climate change. This means that a transition to a greener development
trajectory is necessary in order to ensure that future development is sustainable. However, when compared
to business as usual, the incremental cost of delivering mitigation and adaptation infrastructure from 2015
to 2030 is estimated to be relatively low, i.e. in the order of 5% of the investment requirements for new and
upgraded infrastructure (GCEC 2014).
56. In order to meet this additional cost, significant changes in the way investment is made in
infrastructure will be required. Here, while development partners can only finance a fraction of
infrastructure needs - including the transition to green growth - they can play an important role. This
includes supporting the ‘greening’ of existing and new infrastructure, creating enabling conditions to
mobilise private sector investment in green infrastructure21
, and de-risking green investment at the
transaction level (see Box 5).
57. To better understand the climate-related activities of development partners, the DAC has worked
over a number of years to capture climate-related development co-operation in its statistical system. If one
examines bilateral ODA22
(concessional finance), there is a general trend towards a ‘greening’ of
infrastructure in recent years. This is evident as the share of bilateral ODA to green infrastructure in all
ODA to infrastructure increased seven percentage points between 2010 and 2013. Overall, slightly more
than a third (37%) of bilateral and multilateral ODF to infrastructure was green23
. Breaking this down, the
vast majority (78%) of projects aimed to reduce GHG emissions (i.e. climate change mitigation), and only
a small portion of financing (18%) was for adaptation or for both mitigation and adaptation (4%).
58. In terms of sector allocation of absolute amounts, there was more financing for green energy than
green transport, despite the higher ODF for transport overall. In examining the share of green infrastructure
within the respective sectors, 57% of ODF to energy was green, which mostly concerned renewable energy
(see Figure 15). In contrast, only 30% of financing for transport could be considered green, mostly
supporting railway development projects and sustainable urban transport systems (e.g. metro projects).
Within ODF for water and sanitation, 30% was green, mainly consisting of large projects that addressed
climate change adaptation, including flood and drought management and disaster risk reduction.
21. This paper defines green infrastructure as projects within infrastructure sectors that aim to either mitigate GHG
emissions and/or support adaptation to a changing climate. Infrastructure investment that also addresses other
environmental objectives such as reducing pollution, minimizing impacts on biodiversity and addressing resource
utilization have not been included here due to the availability and coverage of existing data.
22. Coverage of bilateral non-concessional data is incomplete. See Technical Notes Section IV.A.
23. Financing for green infrastructure in 2013 consists of ODA commitments from bilateral development partners and
ODF commitments from multilateral institutions. See Technical Notes Section IV.A. and B.

35
Figure 15: Share of Green Infrastructure by Sector, 2013
Source: OECD/DAC aid activity database (CRS), commitments.
Note: Figure only includes the institutions reporting climate data to the DAC. See Technical Notes Section IV A. and B.
59. Similar to the pattern shown for overall ODF for infrastructure, G7 countries and multilateral
agencies committed the largest absolute amounts in financing for green infrastructure in 2013. However, if
the share of green infrastructure within ODF for infrastructure is taken into account, the picture is different
(see Chart 16). Bilateral development partners have higher shares of green infrastructure than multilaterals,
reaching about 50% of their total ODF for infrastructure. Some of the smaller bilateral development
partners have relatively greener portfolios. For example, Iceland, Portugal, Spain and Poland have spent
between 73% and 100% of their ODF for infrastructure on green projects. In particular, Iceland and
Portugal financed projects promoting the use of renewable energy, particularly in geothermal resources and
solar power, respectively, while the large majority of Spain’s financing was allocated towards water and
sanitation. Overall, multilaterals —except for the Climate Investment Funds and the Global Environment
Facility—have particularly low shares of green infrastructure, reaching on average 25% of their ODF for
infrastructure. For instance, AfDB and EU institutions, which are top development partners for overall
infrastructure, have relatively low shares of green infrastructure ranging from 5% to 14%.
57%
30%
30%
3%
0% 10% 20% 30% 40% 50% 60% 70% 80% 90% 100%
Energy
Transport
Water and Sanitation
Communications
Green Non-Green

36
Figure 16. Shares of ODF to Green Infrastructure by Development Partner, 2013
Source: OECD/DAC aid activity database (CRS), commitments.
Note: Figure only includes the institutions reporting climate data to the DAC. See Technical Notes Section IV A. and B.
60. The regional distribution of green infrastructure in absolute amounts was more or less similar to
the overall ODF for infrastructure in 2013. However, of their respective ODF to infrastructure, Asia (44%)
and Americas (39%) had the largest proportion of green infrastructure while Africa (30%) and Europe had
the smallest (27%). Across income groups, the share of financing for green infrastructure out of their
respective ODF to infrastructure was more or less similar, between 32% and 39%.
100%
100%
96%
94%
75%
73%
64%
64%
63%
57%
54%
54%
53%
48%
47%
45%
44%
39%
37%
37%
36%
36%
35%
32%
28%
26%
26%
25%
24%
24%
22%
21%
14%
6%
5%
0% 10% 20% 30% 40% 50% 60% 70% 80% 90% 100%
Climate Investment Funds (CIF)
Iceland
Portugal
Spain
GEF
Poland
Belgium
Germany
Japan
Netherlands
Denmark
France
Canada
Slovenia
Austria
EBRD
Norway
New Zealand
Sweden
United States
Italy
Czech Republic
United Arab Emirates
WBG
Finland
Luxembourg
Switzerland
United Kingdom
AsDB
IADB
Australia
Korea
EU Institutions
Ireland
AfDBGreen
Non-Green

37
61. Within green infrastructure, 24% of ODF for green infrastructure was related to climate change
adaptation in LICs with the share decreasing to 19% in LMICs and to 10% in UMICs. In other words,
lower income groups tend to have higher shares of climate change adaptation finance than higher income
groups. This reflects widespread recognition that lower income groups are more vulnerable to climate risks
(WBG 2013a) due to several reasons: (i) locations in geographical zones with high climate risks; (ii) higher
reliance on agriculture (Fankhauser and McDermott 2014); and (iii) lack of institutional capacity and
financial availability to deal with climate change adaptation (Tol and Yohe, 2007, Brooks et al., 2005, Barr
et al., 2010 in Fankhauser and McDermott 2013). On the other hand, the average share related to climate
change mitigation over all green infrastructure increases with the income-level, i.e. 71% in LICs, 79% in
LMICs, and 88% in UMICs. This pattern can be explained by the fact that developing countries with
higher income are larger GHG emitters from energy and transport (Edenhofer et al., 2014).
62. Some of the top ten recipients of overall infrastructure (see Figure 8) were also top recipients of
green infrastructure in absolute terms. However, small recipients of overall infrastructure, in particular
small island states as well as Chile, Uzbekistan, and Equatorial Guinea, had high shares of green
infrastructure within their respective ODF to infrastructure (see Figure 17). Conversely, most of the top
recipient countries of overall ODF for infrastructure had relatively small proportions of green infrastructure
within their respective receipts of ODF to infrastructure, with the exception of South Africa, Kazakhstan,
and India.
Figure 17. Share of ODF to Green Infrastructure by Recipient Country, 2013
Source: OECD/DAC aid activity database (CRS), commitments.
Note: Figure only receipts from institutions reporting climate data to the DAC. See Technical Notes Section IV A. and B.
100%
99%
99%
99%
99%
98%
96%
95%
95%
91%
90%
89%
87%
86%
86%
0% 20% 40% 60% 80% 100%
Chile
Antigua and Barbuda
Saint Vincent and the Grenadines
Uzbekistan
Equatorial Guinea
Grenada
Guinea-Bissau
Bhutan
Belarus
Thailand
FYR Macedonia
Mauritius
Turkmenistan
Tonga
SamoaGreen
Non-Green

38
Box 5: Examples of Finance for Green Infrastructure
Bangladesh’s Coastal Embankments Improvement Project
The Coastal Embankments Improvement Project is building infrastructure required to protect coastal communities in Bangladesh
from frequent storm surges expected as a result of climate change. Project activities include: upgrading 600 kilometers of
embankments in six coastal districts; building cyclone shelters; and strengthen early warning systems in the target communities. It
is expected to protect 760 000 people directly and provide wider benefits to 8.5 million people through agriculture development
and employment. The project cost is estimated at USD 400 million, of which USD 375 million is a concessional loan from the
World Bank and USD 25 million is a grant from the Climate Investment Funds (WBG 2013b).
Istanbul’s Metro Extension
The French Agency for Development (AFD) is working with the Metropolitan Municipality of Istanbul to integrate the city’s
metro into its wider public transport system as a way of increasing mobility and reducing GHGs. The project will extend a metro
line by an additional five kilometres to connect to a new multimodal station, which will form the hub for rail, tram and metro lines.
The project is estimated to cost EUR 524 million, of which AFD has contributed a loan of EUR 45 million. As metro systems have
a lower carbon footprint per unit distance travelled when compared with other forms of urban transport, such as personal cars or
buses, the project will reduce significant amount of CO2 (AFD 2013).
Ouarzazate Solar Power Plant in Morocco
The Ouarzazate solar power plant in Morocco is one of the world’s largest plants using concentrated solar power technology. The
first phase of this PPP project with the Morocco Agency for Solar Energy (MASEN) cost around USD 800 million. It was
supported through loans from WBG, EIB, AFD, AfDB, KfW, and Climate Investment Funds, among others. The final plant will
have a capacity of 500MW and is expected to avoid 240,000 tonnes of CO2 per year (WBG 2011).
Climate Proofing Community Infrastructure in Samoa
This project builds on the reconstruction efforts of the Government of Samoa after Cyclone Evan by protecting community
infrastructure and assets from future extreme weather events. It is funded by a USD 12 million grant to Samoa from the Global
Environment Facility (GEF), implemented through the United Nations Development Program. The project is also expected to
integrate climate change adaptation considerations into sector plans and to strengthen government and local institutions to
implement and monitor adaptation efforts (UNDP 2014).
63. Overall, as only 37% of ODF to infrastructure is allocated to low-carbon and climate-resilient
projects, there is more scope for development partners to support developing countries in the transition
towards green growth. In particular, further efforts towards greening the transport sector can be made in
view of the rapid urbanisation of developing countries. Since ODF can contribute only a small portion of
the financing gap in infrastructure, it is crucial that development partners maximise their support towards
making development sustainable through financing greener infrastructure.

39
V. EMERGING COUNTRIES AND INSTITUTIONS PROVIDING
DEVELOPMENT CO-OPERATION FOR INFRASTRUCTURE
Emerging economies such as China, India, Turkey, and Arab partners are estimated to account for
13% of development co-operation for infrastructure.
64. As shown in Section I, several large emerging economies are receiving significant support for
infrastructure from development partners (see Figure 8). At the same time, some of these, such as China,
India, Turkey and Arab countries are becoming important partners in providing considerable resources to
infrastructure of other developing countries. In fact, the estimated total amount of bilateral and multilateral
development co-operation provided by these development partners combined in 2013 was USD 7.8 billion
or 13% of total official support for development co-operation in infrastructure.
65. Therefore, in order to provide a more comprehensive picture of development co-operation for
infrastructure, this Section captures the support of these countries through bilateral and multilateral
channels. However, except for those reported by the Arab partners, the figures provided are estimates
based on data from the respective country’s official documents or other sources, and thus are not entirely
comparable with DAC data. Furthermore, this Section introduces two emerging MDBs, i.e. the Asian
Infrastructure Investment Bank (AIIB) and the New Development Bank (NDB) that have been established
to mainly finance infrastructure in developing countries.
1. People’s Republic of China
66. China assists other developing countries within the framework of South-South co-operation,
which emphasises respect for national sovereignty as well as solidarity and equality among partners
(Tortora, 2011). The country has significantly expanded its development co-operation over the past years,
with annual disbursements for all sectors estimated at USD 4.8 billion in 2013, according to the official
figures of the People’s Republic of China State Council Information Office (SCIO) (SCIO 2014). Africa
and Asia have been the two largest recipient regions of China’s overall development co-operation.
67. The composition of China’s development co-operation has undergone a major shift in recent
years, with concessional loans now making up the majority of China’s aid financing, growing from 29% in
2009 to 56% on average in 2010-2012. At the same time, the share of zero-interest loans decreased from
30% to 8% and the share of grants also decreased from 41% to 36% in the same period.
(SCIO 2011, 2014).
68. Economic infrastructure remains a core component of China’s development co-operation.
Disbursements to infrastructure have been increasing, reaching average annual flows of USD 2.2 billion in
the period 2010-2012, or about 45% of total Chinese development co-operation (SCIO 2014), although this
excludes water and sanitation, which is included under public facilities 24
. Between 2010 and 2012, China
completed 185 large and medium sized infrastructure projects25
, mostly financed through grants and
zero-interest loans by Ex-Im Bank26
. China Development Bank also provides significant financing to
developing countries, but it is not for development purposes, and details are unavailable.
24. Author’s calculations based on SCIO 2014. See Technical Notes for details.
25. This is a calculation based on SCIO 2014, and includes the number of projects in water and sanitation.
26 Communication by Chinese Government to the DAC Secretariat of 24 August 2015.

40
69. Infrastructure projects have particularly been directed towards low-income African countries
(Gutman, J. et al. 2015, Kaplinsky 2013, Foster and Briceño-Garmendia 2009, ICA 2013). Examples of
large infrastructure projects include the Bui Hydropower Station in Ghana, financed through a
concessional loan of USD 270 million and a commercial loan of USD 292 million by China’s Ex-Im Bank.
Another project is the construction of the Thika Highway connecting Kenya's capital Nairobi to its
economic hub Thika, to which Ex-Im Bank provided USD 100 million (AfDB 2012).
70. China is also a major recipient country of ODF for infrastructure from other development
partners. In fact, in 2013, it was the third largest recipient at roughly 3 USD billion (see Figure 8 in Section
1 and Figure 18 below). The vast majority of this financing (86%) was non-concessional loans, mainly
from AsDB, WBG, Korea and Germany. Half the total was targeted to transport, while a quarter was for
water and sanitation. China was also the largest recipient of DFI/IFI finance for infrastructure in 2013 (see
Figure 12).
2. India
71. India has also become one of the major development partners in South-South co-operation. Its
strategy is to harness the country’s comparative advantage in technology, industrial agriculture, education,
and communications to support projects that may be overlooked by traditional and other emerging
development partners (Taraporevala and Mullen 2013). The approach is also in line with its foreign policy
stance of non-interference in the internal affairs of partner countries, thereby limiting the attachment of
policy conditions to its co-operation (OECD 2012b).
72. India’s main instruments in development co-operation include grant-in-aid projects, loans,
technical assistance, and lines of credit (LoCs). The Development Partnership Administration, created in
the Ministry of External Affairs in January 2012, manages India’s grant-in-aid, loans, and training
programmes for developing countries. These programmes are primarily directed towards its neighbouring
countries, mainly Bangladesh, Bhutan, Nepal, Myanmar, and Sri Lanka. Furthermore, LoCs with a
development objective raised from capital markets by the Exim Bank of India, an ECA, are becoming
increasingly important for development co-operation, in addition to promoting India’s international trade
with other countries. Launched as part of the 2004 Indian Development and Economic Assistance Scheme
(IDEAS), Exim Bank LoCs are overseen by the Ministry of Finance.
73. India’s development co-operation for infrastructure is considerable, estimated at USD 1.3 billion
for 2014. This amount is from both the budget of the Development Partnership Administration at
USD 1 billion and LoCs provided by the Exim Bank at around USD 319 million. For the Development
Partnership Administration, economic infrastructure corresponded to 65% of total support allocated to
developing countries in that year (India MEA 2015). Most of this support (roughly 83%) went to the
energy sector, primarily financing hydroelectric projects in Bhutan. However, as India imports power from
Bhutan, projects such as the Dagachhu hydropower plant are mainly to promote power export to India
(Acharya 2010). The remaining amount was mainly directed to transport projects in Nepal and Myanmar.
Of the LoCs, 46% of total amounts were disbursed to infrastructure in 201427
.
74. India was also the top recipient for infrastructure ODF by other development partners at
USD 4.5 billion in 2013 (see Figure 8 in Section 1 and Figure 18 below), which was mostly (60%)
non-concessional financing. Main providers of ODF were Japan, AsDB, WBG and USA. In terms of
27. Estimates for total disbursements of LoCs to infrastructure are based off of figures reported in the Ministry of Finance
outcome budget (MoF 2015), EXIM Bank official report (EIBI 2011), and IDCR estimates of sector distribution
(IDCR 2015). See Technical Notes for details.

41
sectoral distribution, transport was 45% of total amounts, energy was 42%, and water and sanitation was
13%. India was also the third top recipient for DFIs/IFIs finance for infrastructure in 2013 (see Figure 13).
3. Turkey
75. Turkey’s development co-operation is seen as a part of foreign policy, which is implemented by
various Turkish public institutions (Turkey MFA 2015). Activities are currently concentrated in the Middle
East, Africa, South and Central Asia, Balkans and East Europe. In 2013, the main recipients of Turkish
development co-operation were Syria, Egypt, Kyrgyz Republic, Somalia, and Afghanistan. Turkey’s
bilateral ODF amounted to USD 3.2 billion in 2013, an increase of almost a third from 2012-levels
(OECD 2015b). Contributing to its stated role as a mediator in regional conflicts, the largest share of
Turkey’s bilateral aid in 2013 was allocated in the form of humanitarian assistance, a significant portion of
which was used to maintain its “open-door policy” for Syrian refugees displaced by the nation’s civil war.
76. Turkey’s bilateral development co-operation is primarily focused on social infrastructure and
services, particularly in education, health, and governance (Turkey MFA 2015, TIKA 2013a).
Nevertheless, Turkey’s total disbursements for economic infrastructure were approximately
600 USD million in 201328
, which is a relatively large amount compared to other development partners.
Most of this amount (USD 500 million) was a loan installment provided to Egypt as budget support for
infrastructure. Large infrastructure projects include the construction of the Pul-e-Sokhta-Darulaman Palace
Road and the Darya Khan Bridge in Afghanistan, which TIKA financed entirely for USD 11 million and
USD 18 million respectively, as well as the West African Access to Clean Drinking Water Programme to
drill water wells in Burkina Faso, Mali, Niger, Senegal, Guinea-Bissau, Guinea, Gambia, Ghana, Benin
and Togo.
77. Turkey was also the fourth largest recipient country of ODF to infrastructure by other
development partners (see Figure 8 and Figure 18) at about USD 2.5 billion, both through concessional
(44%) and non-concessional finance (56%). Half of the total was provided by EU institutions, with the
remaining by Japan, WBG, Korea, Germany and France. Slightly more than half was in transport (51%),
23% in energy, and 20% in communications. Turkey was also the second largest recipient for DFI/IFI
disbursements in infrastructure (see Figure 13).
28. Amounts of Turkish official support to infrastructure were provided by the Turkish government through email
correspondence.

42
Figure 18. Official Support for Development Co-operation in Infrastructure
by Emerging Country Disbursed and Received
Source: OECD/DAC aid activity database (CRS), disbursements, SCIO 2014, EIBI 2011, India MEA 2015, India MoF 2015, Turkish
government.
Note: See Technical Notes for estimates on China and India.
4. Arab Development Partners
78. The Arab development partners have increasingly been involved in development co-operation in
infrastructure. The work of these partners is streamlined by the Co-ordination Group, an umbrella
organization whose members includes Arab Fund for Economic and Social Development, Arab Bank for
Economic Development in Africa, IsDB, Kuwait Fund for Economic Development, OPEC Fund for
International Development; the Abu Dhabi Fund for Development29
; and Saudi Fund for Development
(SDF)30
. Originally created to support Arab countries, the Co-ordination Group has broadened its reach to
a wider range of developing countries across Asia, Africa, and in Europe. The Group aims to assist poorer
countries to achieve their economic and social development objectives, holding a development philosophy
that is strongly rooted in South-South solidarity as it recognises the important role that emerging countries
can play in regional development and knowledge sharing (ACGI 2011).
79. At an aggregate level, these Arab partners provided approximately USD 3.7 billion of ODF for
infrastructure in 201331
, mostly in the form of concessional loans and technical assistance. Energy and
transport together made up over 80% of ODF for infrastructure, with the remaining 20% allocated
predominantly towards water and sanitation. In terms of regional distribution, Africa received half of all
ODF to infrastructure, with largest recipients being North African countries including Morocco, Egypt, and
Tunisia. Asia received almost 40%, to which Jordan, Uzbekistan, and Bangladesh received the most
support. The remaining 10% was allocated largely to Europe, with Turkey being the largest recipient,
followed by Albania. The allocated share of ODF was relatively balanced across income groups, with
UMICs receiving 37%, LMICs receiving 33% and LICs receiving 30%.
29. The UAE is reported as a country in the CRS data, however we have only taken development co-operation figures
reported by the Abu Dhabi Fund for Development
30. Most of the data used for measuring official support to infrastructure from main Arab development partners is from the
CRS as only data for the SDF have been retrieved from secondary sources.
31. Estimates for SDF are for 2012 and based on commitments reported in the SDF 2012 Annual Report, and estimates for
IsDB in 2013 are based on figures reported in its 2013 Annual Report. See Technical Notes for details.
2,2
1,3
0,6
3.0
4.4
2.5
China - received
China - disbursed
India - received
India - disbursed
Turkey - received
Turkey - disbursed
N/A
Concessional
non-Concessional
43
5. Asian Infrastructure Investment Bank and New Development Bank
80. In order to provide additional financing for infrastructure, emerging countries have spearheaded
the creation of new multilateral institutions such as the AIIB and the NDB. Both of these institutions are
seen as complementary to existing MDBs, such as WBG and AsDB.
81. The AIIB’s focus is to support general infrastructure needs in the Asia region. Currently, more
than 50 countries have joined as founding members, including Australia, Germany, France, Netherlands,
Sweden, Switzerland, and the UK, to mention a few. It is expected to begin operations later in 2015 with
USD 100 billion in capital.
82. The NDB, on the other hand, has been created by Brazil, Russia, China, India and South Africa
(BRICS) to primarily fund infrastructure and development projects in the BRICs and other developing
countries. With an initial capital of USD 50 billion, the annual lending size is yet to be decided by its
Board. While membership is open to all countries, currently they consist mainly of the five BRICS
countries.

44
VI. END REMARKS
83. This report acknowledged that infrastructure investments in developing countries need to be
scaled up significantly—two to three times—to meet the SDGs. Although development co-operation is
playing a role to fill the financing gap, leveraging financial resources from the private sector will become
increasingly important. Therefore, development partners are placing great effort in allocating resources to
the enabling environment in addition to financing hard infrastructure. They are also directly supporting the
private sector through financial instruments and public-private initiatives to leverage investment for
infrastructure. However, promoting private investment should not be an end in itself, but a means to
support inclusive and climate-compatible growth.
84. The report presented an overview of the scale, distribution, and modality of development
co-operation for infrastructure. It did not attempt to make judgments regarding whether the collective or
individual development partner distributions were appropriate against development objectives. This is
because assessing allocations against factors such as the degree of infrastructure needs, population size,
level of economic development, availability of and ability to raise private financing, and so on for each
country, region, income-level or sector, would require separate in-depth analyses.
85. Instead, the objective of the report was to facilitate discussions and research elsewhere, such as
the G20 IIWG and DWG, GIH or other international fora regarding how to unlock private investment for
developing country infrastructure. Comprehensive and harmonised annual disbursement data on
infrastructure by development partners are necessary in order to better understand annual expenditures or
financing requirements for infrastructure. However these data are rare, as opposed to many multi-year
commitment figures. By providing such data, the expectation is to contribute to a reflection on a more
effective use of scarce public funds in filling the large infrastructure gap, which is crucial for developing
countries to achieve sustainable development.

45
ANNEX: CASE STUDIES OF LEVERAGING PRIVATE INVESTMENT
FOR INFRASTRUCTURE
I. The Gigawatt Solar Plant in Rwanda32
86. The Gigawatt Solar Plant energy project consisted of the development, negotiation, financing,
construction and operation of an 8.5 MW solar photovoltaic power plant in Rwanda, the largest in Africa
outside South Africa and Mauritius. The project was financed by two private investors, Gigawatt Global
(GWG) and Scatec Solar, and various development partners, including OPIC under the U.S. Power Africa
initiative, the Energy and Environment Partnership (EEP) Programme (co-financed by Finland, the UK,
and Austria), FMO, Norwegian Investment Fund for Developing Countries (Norfund), KLP Norfund and
the Private Infrastructure Development Group (PIDG). The project took only a year and a half from the
start of negotiations (February 2013) through signing of Power Purchasing Agreement (PPA) and financial
close to interconnection (July 2014).
87. One of the key reasons Gigawatt Global chose to do business in Rwanda was the country’s good
enabling environment, which included an existing Independent Power Producer framework, rule of law
concerning land use, as well as the Rwanda Development Board, which facilitated company registrations
and acted as a one-stop-shop to negotiate with multiple ministries. Other business environment factors also
appealed to the private actors, such as the country’s political stability, low corruption, the existence of a
strong local partner which had land to offer for the plant, and the Government of Rwanda’s commitment to
a Development Strategy for the electricity sector, including renewables. Most importantly, there was a
compelling business case: 110 MW of energy, 40% of which came from diesel, for a population of 12
million people.
88. The collaboration between the private actors and development partners helped the project to
reach financial close within a short period. OPIC, under the Power Africa initiative's US-African Clean
Energy Financing Facility (ACEF), joined with the EPP Programme to provide grants at a crucial early
stage, covering project preparation costs which included legal fees associated with drafting loan and
security documentation for the project’s financing and PPA negotiations. Norton Rose Fulbright, a law
firm with previous experience in Rwanda, provided legal assistance to negotiate the PPA, land lease, as
well as the equity and debt financing and Engineering, Procurement, and Construction and O&M contracts.
DFIs provided senior debt, mezzanine loan, and equity, amounting to more than USD 21 million.
Furthermore, EAIF and FMO were able to act quickly as they capitalised on their experience working
together on a previous energy project in Rwanda. Scatec Solar - the engineering, procurement,
construction, operation and maintenance company - also had a significant equity stake, which helped align
incentives. As a result of the collaboration among these stakeholders, the energy project matured to receive
project financing and is now providing power to Rwanda’s national grid.
89. While the DFIs played a significant role in mobilising financing from the private sector, the
equity raised amounted to 9% of total project costs, which was relatively small (See Table A). At the same
time, there were significant development impacts of the project, such as: provision of 6% more electricity
generation capacity to the country’s national grid, sufficient to power over 15,000 households; creation of
300-350 local jobs during the construction phase; training on solar plant construction as well as health and
safety standards that could lead to the development of sub-industries; reform of the tax code, which will
reduce ambiguity for future investors; and a demonstration effect, which encourages other developers to
invest.
32. For full report and more details, see OECD 2014b and OECD 2015c.

46
Table A: Distribution of Project
Preparation Costs
Institution Type Amount (USD)
Energy and Environment Partnership
(Finland, Austria, UK) Grant 310,000
US-ACEF (OPIC) Grant 400,000
Gigawatt Own resources N/A
II. Dakar-Diamniadio Toll Highway Project34
90. The Dakar-Diamniadio Toll Highway Project was a PPP project in Senegal that consisted of the
design, construction and operation of a portion of a 32 km highway linking the cities of Dakar and
Diamniado. The project was financed by the Government of Senegal (GoS), the PPIAF, the WBG,
France’s Agence Française de Developpement (AFD), AfDB, the West African Development Bank
(WADB), CBAO Bank, and a consortium of private companies.
91. Several factors were key in attracting private investment. The GoS demonstrated strong political
commitment by issuing a growth strategy emphasising the importance of road infrastructure and by fully
funding the first section of the road from its own budget. It also created a conducive enabling environment
by establishing the Agence pour la Promotion des Investissement et Grand Travaux (APIX), an agency to
design investment policies and promote private investment in large infrastructure projects. Furthermore,
with the support of PPIAF, the GoS developed a transparent and predictable procurement system for PPPs.
33. Norfund KLP Investments is a joint venture between Norfund and KLP, a Norwegian mutual insurance company.
Therefore, it is not strictly a public development partner.
34. For full report and more details, see OECD 2014c.
Table B:Distribution of Finance for the Gigawatt Solar Plant Project
Institution Nature
Amount
(USD
million)
Share of
total
Dev
elopm
ent
Par
tner
s
FMO Senior loan 8.9 38%
PIDG (EAIF) Senior loan 8.9 38%
Norfund Mezzanine Loan 2.4 10%
Norfund Equity 1.4 6%
Norfund KLP Investments33
Subtotal Development Partners 21.6 91%
Pri
vat
e
Sec
tor Scatec Solar Equity 1.5 6%
Gigawatt Global Equity 0.6 3%
Subtotal Private Sector 2.1 9%
Total Construction Costs 23.7 100%

47
92. A co-ordinated approach to support Senegal in carrying out the project preparation contributed to
bringing together a financing package for the PPP project. The feasibility studies were funded by the GoS
and WBG, which helped the government to realise that an investment subsidy was needed to attract
potential private sponsors. Thus, official development partners, notably AFD and AfDB, provided
sovereign concessional loans to the GoS to finance this subsidy. The IFC was the lead arranger of private
debt financing from the private arms of AfDB and WADB, which helped mobilise equity finance from a
consortium of companies led by Eiffage, a French construction company. CBAO, a private, Senegalese
bank, was crowded-in last by providing a commercial loan.
Table C: Distribution of Project Preparation Costs
Institution Type
Amount (USD
million)
Government of Senegal N/A N/A
PPIAF Grant 0.25
World Bank (Project Preparation
Fund) Grant
1.25
World Bank - IDA (Private Investment
Promotion Project)
Concessional
Loan N/A
Table D: Distribution of the Road Construction Costs
Institution Nature
Amount
(USD
million)
Share of
total
a. Government of Senegal Government Budget 54 19%
b. Official Development partners 176 64%
Sovereign Loans 105 38%
AFD Concessional Loan 37 13%
AfDB (African Development Fund) Concessional Loan 67 24%
Non-Sovereign Loans 72 26%
World Bank - IFC Non-concessional Loan 27 10%
AfDB (Private Arm) Non-concessional Loan 16 6%
West African Development Bank Non-concessional Loan 29 10%
c. Private Sector Equity and Non-sovereign Loan 48 17%
Concessionaire (SENAC) Equtiy 40 14%
CBAO Group Attijariwafa Bank Non-concessional Loan 8 3%
Total Construction Costs of PPP 278 100%
93. In terms of determining how financing was leveraged from the private sector, one might say that
the non-sovereign lending by the development partners of 26% was able to leverage the 17% from the
private sector (ratio of 1:0.7). However, one could also say that the sovereign loans by the AFD and AfDB
of 38% were crucial in getting the private sector involved; thus the sovereign and non-sovereign lending of
64% was able to leverage the 17% of private investment (ratio of 1: 0.3). Either way, the amount
leveraged from the private sector did not surpass the amounts provided by the official development
partners.

48
94. At the same time, the development impact of this project includes: the significant reduction in
road congestion and travel time; the adoption of new institutional and regulatory frameworks to improve
the business enabling environment; and strengthened institutional capacity of APIX. The GoS has also
taken advantage of the construction of the road to upgrade Pikine Irrégulier Sud, an urban area in the
surroundings of Dakar, whose works are expected to be completed by the end of 2016.

49
TECHNICAL NOTES
Section I. Overview of Infrastructure Finance
A. CRS Sectors for Infrastructure
ODF (see Footnote 3) data by development partners which report to the DAC are taken from the
OECD/DAC aid activity database (CRS). For infrastructure, the following CRS sectors have been used:
Water and Sanitation (140), Transport and storage (210), Communications (220), and Energy (230)
B. Report Usage of ODF Disbursements and Commitments
Absolute amounts of ODF in this report are in disbursements and not in commitments. The reason is
that commitments are recorded in total only in the particular year they are signed. Once the commitment
has been reported, it is not repeated again in subsequent years, although it may be spent over several years.
Therefore, the amount may be recorded as zero for the particular project the following years even though
the activities and financing would be on-going. Furthermore, since different projects usually have different
years of planned disbursements, aggregates of committed amounts would be an accumulation of projects
with different number of years of implementation. As such, disbursements are more comparable with
annual expenditure figures, for example, annual infrastructure spending, gross national income (GNI), and
so on.
However, some development partners do not report in disbursements. For these development partners,
the absolute amounts for disbursements are estimated. The way they have been estimated is explained
individually below. At the same time, all development partners reporting to the DAC at activity level
report in commitments. For this reason, percentages measuring distributions such as ODF for infrastructure
by region (Figure 6), income-group (Figure 7) and sector (Figure 9) are based on commitments.
C. Projected Annual Infrastructure Investment Gaps, 2015 – 2013 (Figure 1)
Projected annual infrastructure investment gaps for each infrastructure sector are calculated based on
projections made by UNCTAD in its 2014 World Investment Report. To illustrate the investment need for
achieving the infrastructure-related objectives of the upcoming SDGs, UNCTAD has made projections of
the infrastructure investment in developing countries. UNCTAD, using a meta-analytic approach by
combining estimates made by a number of studies and analyses, provides a projected range to estimate the
investment gap in each infrastructure sector. Projected annual investment gaps for each infrastructure
sector in Figure 1 are based on the average of the range included in UNCTAD’s report. The investment
gaps include only capital expenditures, leaving out operating expenditure.
D. Estimated Distribution of Developing Country Infrastructure by Source of Finance (Figure 2)
Estimates of total current investment in each infrastructure sector in developing countries are taken
directly from the UNCTAD 2014 World Investment Report. The UNCTAD’s report also provided a range
for the level of private sector participation in each infrastructure sector. Therefore, the percentage of
private sector participation in Figure 2 is based on the average of this range. On the other hand, the
estimated share of finance provided by development partners in each sector was calculated using CRS data.
The remaining portion of current investment is attributed to the infrastructure expenditures of developing
country governments.

50
E. Total Official Support to Infrastructure by Development Partners Categories (Figure 3)
Figure 3 is based on actual disbursements of development partners reporting to the DAC at activity
level as well as estimates of disbursements of those that do not report fully to the DAC or at all. Of the
USD 60 billion, USD 51 billion are actual disbursements reported to the DAC in the CRS. The remaining
USD 9 billion include estimates for IsDB, IFC, FMO, BIO, IFU, SIMEST, COFIDES, China, India and
Turkey, explained below in this section and in Technical note of Section V.
F. Estimates for development partners in Figure 4 and 5.
1. Estimates for Islamic Development Bank’s disbursements in 2013
IsDB only reports commitments at the activity level in the CRS database. IsDB’s total disbursement to
infrastructure in 2013 is taken from its 2013 Annual Report, reported as USD 1.58 billion (IsDB 2013).
This figure corresponds only to IsDB’s Ordinary Capital Resources and is considered non-concessional.
This amount is used in Figure 4.
2. Estimates for IFC disbursements in 2013:
IFC does not report its annual disbursements at the activity level in the CRS database. However, it reports
its total disbursements for all sectors combined in DAC2b table. In 2013, total IFC disbursements were
USD 6.7 billion. Since the share of infrastructure in total commitments reported to the DAC in the CRS
was 28%, this percentage is applied to the total disbursements of USD 6.7 billion to obtain the estimate of
IFC’s disbursements for infrastructure. This amount corresponds to USD 1.9 billion. It was added to the
WBG’s sum in Figure 4, which also includes disbursements by IBRD and IDA.
3. Estimates for FMO disbursements in 2013:
a) FMO total disbursements – FMO’s disbursement figures are not reported in the CRS database.
FMO’s total disbursement in 2013 is estimated based on figures in its 2013 Annual Report. Total
disbursements is estimated to be USD 1.48 billion, calculated as the sum of loans extended to the
private sector (USD 1.24 billion or EUR 934.90 million), loans guaranteed by the State
(USD 24.78 million or EUR 18.66 million), and equity purchases and contributions
(USD 216.10 million or EUR 162.74 million) (FMO 2013, pg 95-97). This estimate is added to
Netherland’s total ODF for all sectors, used in Figure 5.
b) FMO total disbursements for infrastructure – To estimate total disbursements for
infrastructure, the share of FMO’s portfolio in infrastructure, which is approximately 30% as
reported in the 2013 EDFI Annual Report (EDFI 2013, p. 30), is multiplied by total
disbursements in 2013, as estimated in 3a). Total disbursements for infrastructure is estimated at
USD 0.45 billion. This estimate is added to the Netherland’s total ODF for infrastructure in
Figure 4 and Figure 5.
4. Estimates for Belgium BIO disbursements in 2013
a) BIO total disbursements to the private sector– total disbursements to the private sector in 2013
as reported in the CRS (USD 189.68 million).
b) BIO total disbursements to the private sector for infrastrelgium’s BIO does not provide a sector
breakdown at the activity level in the CRS database. Thus, to estimate disbursements for
infrastructure in 2013, the share of BIO’s portfolio in infrastructure, which is approximately 22%
as reported in the 2013 EDFI Annual Report (EDFI 2013, pg 20), is multiplied by total
disbursements to the private sector in 2013 as reported in the CRS (USD 189.68 million). Total

51
disbursements for infrastructure is estimated at USD 40.94 million. This estimate is added to
Belgium’s ODF for infrastructure in Figure 4 and Figure 5.
5. Estimates for Denmark IFU disbursements to the private sector for infrastructure in 2013
Denmark’s IFU reports a sector breakdown for only ODA in the CRS, capturing only a small portion
of its total disbursements to infrastructure. To estimate total disbursements for infrastructure, the share of
IFU’s portfolio in infrastructure, which is approximately 17% as reported in the 2013 EDFI Annual Report
(EDFI 2013, pg 32), is multiplied by total disbursements for to the private sector in 2013 as reported in the
CRS (USD 81.92 million). Total disbursements for infrastructure is estimated at USD 13.7 million. This
estimate is added to Denmark’s ODF for infrastructure in Figure 4 and Figure 5.
6. Estimates for Italy’s SIMEST disbursements in 2013
a) SIMEST total disbursements to the private sector– SIMEST does not report figures in the
CRS. To estimate total disbursements to the private sector, the USD 117.6 million or
EUR 88.6 million worth of “equity investments acquired” in 2013, as reported in its cash flow
statements in its 2013 Annual Report (SIMEST 2013, pg 101), is used as a proxy. This is likely
overestimates disbursements as it also includes SIMEST activities in non-developing countries.
This estimate is added to Italy’s total ODF for all sectors, used in Figure 5.
b) SIMEST total disbursements to the private sector for infrastructure – To estimate total
disbursements for infrastructure, the share of SIMEST’s portfolio in infrastructure, which is
approximately 6% as reported in the 2013 EDFI Annual Report (EDFI 2013, pg 32), is multiplied
by total estimated disbursements for to the private sector in 2013 as estimated in 7a). Total
disbursements for infrastructure is estimated at USD 13.7 million. This estimate is added to
Italy’s ODF for infrastructure in Figure 4 and Figure 5.
7. Estimates for Spain’s COFIDES disbursements in 2013
a) COFIDES total disbursements to the private sector– COFIDES does not report figures in the
CRS. Total disbursements to the private sector amounts to USD 278.4 million or
EUR 209.7 million, as reported in its 2013 Annual Report (COFIDES 2013, p. 33) . This figure is
added to Spain’s total ODF for all sectors, used in Figure 5.
b) COFIDES total disbursements to the private sector for infrastructure – To estimate total
disbursements for infrastructure, the share of COFIDES’ portfolio in infrastructure, which is
approximately 41% as reported in the 2013 EDFI Annual Report (EDFI 2013, p. 24), is
multiplied by total disbursements to the private sector in 2013 as calculated in 8a). Total
disbursements for infrastructure is estimated at USD 113.8 million. This estimate is added to
Spain’s ODF for infrastructure in Figure 4 and Figure 5.

52
Section II. Enabling Environment for Private Sector Participation in Infrastructure (Figure 11)
A. CRS codes classified as “enabling environment”:
Investment Openness and Predictability
15130: Legal and judicial development
25010: Business support services and institutions
25020: Privatisation
Public Governance
15110: Public sector policy and administrative management
15111: Public finance management
15112: Decentralisation and support to subnational government
15113: Anti-corruption organizations and institutions
Financial Sector
24010: Financial policy and administrative management
24030: Formal sector financial intermediaries
Policy, Regulation, and Managemnet of Infrastructure Sectors
14010: Water sector policy and administrative management
14081: Education/training in water supply and sanitation
21010: Transport policy and administrative management
21081: Education and training in transport and storage
22010: Communications policy and administrative management
23010: Energy policy and administrative management
Projects were filtered by hand in order to remove projects unrelated to the enabling environment for
infrastructure.
B. Estimates for IsDB and IFC disbursements for infrastructure enabling environment
1. Estimates for IsDB
IsDB’s disbursements for infrastructure were estimated by multiplying its total disbursements (see
Technical Notes Section I.E.1a) by its ratio of commitments to the enabling environment as a share of total
commitments (to all sectors).
2. Estimates for IFC disbursements for infrastructure enabling environment:
IFC’s disbursements for infrastructure were estimated by multiplying its total disbursements (see
Technical Notes Section 1.E.2a) by its ratio of commitments to the enabling environment as a share of total
commitments (to all sectors).
C. Calculating development partner share of ODF to infrastructure for enabling environment
The share of ODF to enabling environment is calculated as the total of all enabling environment
categories as a share of all enabling environment categories and the hardware and construction in all four
infrastructure sectors (“hard infrastructure”):

53
Section III. Support to the Private Sector
A. DFI/IFI Disbursements to the private sector for infrastructure
1. Estimates for IFC disbursements in 2013
a) IFC disbursements to the private sector for infrastructure– See Note 2b. Estimates used
Figure 11.
b) IFC disbursements for infrastructure to each of its recipient countries – IFC disbursements
to each country calculated by using the share of commitments to each country multiplied by
IFC’s estimated total disbursement to infrastructure (See Note 2b). Estimates used in Figure 14.
2. AsDB disbursements to the private sector for infrastructure in 2013
Total disbursements of USD 668 million provided by AsDB’s Strategy and Policy Department.
3. Estimates for Inter-American Development Bank disbursements and commitments in 2013
a) IADB disbursements to the private sector for infrastructure – IADB did not separately report
its disbursements or commitments to the private sector in 2013, though it has done so for
previous reporting years. As such, IADB’s disbursements to the private sector for infrastructure
in 2013 were calculated by aggregating all disbursements for outstanding projects in 2013 that
were reported as allocations to the private sector in previous years. IADB disbursements to the
private sector for infrastructure amounted to USD 775.5 million in 2013. Estimates used in
Figure 11.
b) IADB commitments to the private sector for infrastructure– As sectoral, regional, and
income distributions in this report use commitment data, and IADB did not separately report its
commitments to the private sector in 2013, estimates of its commitments to the private sector for
infrastructure were made by taking the 2012 sectoral, regional, and income distributions of
commitments to the private sector for infrastructure, and applying these to 2013 total
commitments. In 2013, it is estimated that USD 347.5 million was committed to energy,
USD 116.6 million to transport, and USD 0.75 million to communications, and USD 0.70 to
water and sanitation. In terms of income distribution, USD 374.0 million was committed to
UMICs and USD 0.8 million was committed to LMICs. The total USD 465.6 million estimated
commitments in 2013 were allocated to the Americas. Estimates used in Figure 12 and Figure 14.

54
4. FMO total disbursements to the private sector for infrastructure – See Note 3b). This estimate is used in
Figure 11.
5. Estimates for Belgium BIO disbursements to the private sector for infrastructure in 2013 – See Note 4).
Estimate used in Figure 11.
6. Estimates for Denmark IFU disbursements to the private sector for infrastructure in 2013 – See Note 5).
Estimate used in Figure 11.
7. Estimates for Italy’s SIMEST disbursements to the private sector for infrastructure in 2013 – See note
6b). Estimate used in Figure 11.
8. Estimates for Spain’s COFIDES disbursements to the private sector for infrastructure in 2013– See note
7b). Estimate used in Figure 11.
9. Estimates for Austria’s OeEB disbursements to the private sector for infrastructure in 2013
To estimate total disbursements for infrastructure, the share of OeEB’S portfolio in infrastructure,
which is approximately 15% as reported in the 2013 EDFI Annual Report (EDFI 2013, pg 36), is
multiplied by total disbursements to the private sector in 2013 as reported in the CRS (USD 133.2 million).
Total disbursements for infrastructure are estimated at USD 20.2 million. Estimate used in Figure 11.
10. France’s PROPARCO disbursements to the private sector for infrastructure in 2013
Total disbursements of USD 248 million (EUR 187 million) were provided by AFD’s Département
Finances et Comptabilité (DFC) through email correspondence on 21 July 2015.
B. Largest Recipients, Income and Sectoral Distribution of DFI/IFI flows to the private sector for
infrastructure in 2013 (Figure 13, 14 and 15).
Figures 13, 14, and 15 show the income distribution, the largest recipients, and sectoral distribution of
DFI/IFI flows to the private sector for infrastructure. Bilateral DFIs of Belgium (BIO), France
(PROPARCO), Italy (SIMEST), Netherlands (FMO), and Spain (COFIDES) are not included as they do
not report as separate agencies in the CRS database. While the bilateral DFIs of Austria (OeEB) and
Denmark (IFU) are reported in the CRS as separate agencies, since most or all flows are not broken down
by sector, they are also not included in these figures.
C. Amounts mobilised from the private sector
The amounts reported are taken from the 2015 OECD DAC Survey on Amounts Mobilised from the
Private Sector by Official Development Finance Interventions, which provides amounts mobilised from the
private sector through guarantees, syndicated loans and shares in CIVs between 2012 and 2014. However,
all development finance institutions/agencies do not report mobilised amounts across all years. As such, in
this report, aggregate, annual amounts mobilised are calculated by summing the average annual amount
mobilised by each institution/agency.
See also: http://www.oecd.org/dac/stats/mobilisation-effect-of-public-development-finance.htm

DCD/WKP(2015)1/REV1
55
Section IV. Support to Green Infrastructure
Analyses in this Section are based on climate-related development finance data from the OECD
DAC CRS database for 2013.
A. Accounting for bilateral development partners
Bilateral data includes projects screened using the Rio Marker approach as having climate
change as a “principal” or “significant” objective. The former includes activities which have climate
change adaptation or mitigation as one of the principal reasons being undertaken i.e. the activity
would not have been undertaken in without this objective. The latter includes activities for which
climate change adaptation or mitigation is an important aspect, but is not one of the principal drivers
of the design of the project or programme. Rio-marked data for both climate change mitigation and
adaptation are available for flows from 2010 and onwards.
Coverage of ODA commitments from bilaterals development partners is generally complete,
though data gaps still exist for some bilateral development partners. Data on Other Official Flows
from bilateral agencies, however, are incomplete, with only four DAC members reporting
non-concessional climate-related development finance to date. Thus, for this section of the report,
only ODA commitment data is analysed for bilaterals partners.
The Rio Marker approach allows for an approximate quantification of aid flows that target
climate objectives, as it does not provide the exact share of aid activity expenditure that contributes to
climate change adaptation or mitigation provided bilateral partners. As this report takes projects
where climate change is either a principle or a significant objective, the figures provided in this
section for bilateral development partners should be considered as an upper bound estimate of
climate-change-related aid.
1. Australia green infrastructure commitments: Only includes flows from the Department
of Foreign Affairs and Trade (OECD 2015c).
2. Austria green infrastructure commitments: Only includes flows from main agency ADA
(OECD 2015c).
3. Iceland, Ireland, Luxembourg, and Portugal green infrastructure commitments: Country climate data reporting is based on disbursements data so commitment data equals
disbursement data (OECD 2015c).
4. EU Institutions green infrastructure commitments: EU institutions flows in this report
incorporate flows from EIB. Other than EIB, only flows from DG DEVCO and DG ELARG
are captured (OECD 2015c). EU institutions reports as a bilateral development partner in the
CRS database and thus uses the Rio Marker approach (See Section IV.A.), but is considered
a multilateral development partner in this report.
For more information on the OECD climate markers, please refer to the Handbook for OECD
Climate Markers available at http://www.oecd.org/dac/stats/48785310.pdf
B. Accounting for multilateral development partners
The DAC has been collaborating with multilateral and regional development banks over a
number of years to capture climate-related data from multilateral development partners in its
statistical system. First data on climate-related multilateral flows is available for flows reported in
DCD/WKP(2015)1/REV1
56
2013. Multilateral climate finance data includes reporting from 9 multilateral development partners:
i.e. the African Development Bank (AfDB), the Asian Development Bank (AsDB), the European
Bank for Reconstruction and Development (EBRD), the European Investment Bank (EIB), the
Inter-American Development Bank (IADB), the World Bank (WB) and the International Finance
Corporation (IFC), the Global Environment Facility, and the Adaptation Fund.
Multilateral partners report using a climate-related component approach, where the share of aid
activity expenditure that contributes to climate change adaptation or mitigation is identifiable. As
many multilateral partners only began reporting on climate components either in 2014 or 2015, there
are still gaps within the data, i.e. projects that are climate-related but have not been marked. As
reporting becomes more standardised over time, it is expected that coverage will become more
complete.
1. Non-standard filers: AfDB, AsDB, and EIB report their climate data to the DAC in a
stand-alone file (“non-standard” filers). Some projects have not been incorporated into the
CRS database at this time. Thus, in order to ensure consistency with the rest of the data in
this paper, some climate-related projects from these non-standard filers were excluded, due
to their not being included in the wider CRS database at the time the analyses were
conducted.
2. Climate Investment Funds green infrastructure commitments: Climate data reporting is
based on disbursements data so commitment data equals disbursement data. Data on
commitments have not yet been reported.
3. AsDB green infrastructure commitments: Climate data reporting only captures flows
from AsDB Special Funds. Therefore, in this section of the report, only flows from AsDB
Special funds are taken into account.
For an outline of the treatment and coverage of multilateral climate data, please see a technical
note on the treatment of climate-related multilateral flows in DAC statistics available at
http://www.oecd.org/dac/stats/documentupload/RD%2016%20-
%20Treatment%20of%20green%20multilater%20flows%20in%20OECD%20DAC%20statistics.pdf

DCD/WKP(2015)1/REV1
57
Section V. Emerging Countries Providing Development Co-operation for Infrastructure
Estimates for China’s development co-operation for infrastructure in 2013
According to China’s 2014 White Paper on Foreign Aid, from 2010 to 2012 the country’s
foreign aid amounted to US$ 14.41 billion (SCIO 2014). This puts China’s average annual foreign aid
at US$ 4.8 billion over this time period. Additionally, the White Paper shows that 44.8%, the bulk of
Chinese foreign aid, was allocated to economic infrastructure projects (not including water and
sanitation projects). Therefore, China’s annual development co-operation for infrastructure is
estimated at USD 2.2 billion. This includes concessional loans provided by the EXIM-bank. Estimate
used in Figure 3 and Figure 18.
Estimates for India’s development co-operation for infrastructure in 2013
India’s development co-operation is estimated at USD 1.3 billion. An estimated USD 1.0 billion
is provided by the Development Partnership Administration, calculated by aggregating amounts
budgeted for each infrastructure project as reported in the Ministry of External Affairs 2014-2015
Outcome Budget. The budget for infrastructure projects amounted to 6,031.9 crores, or
USD 1.0 billion. Estimate used in Figure 3 and Figure 18.
India’s government also backs EXIM-bank LoCs as part of its development co-operation
strategy. Total disbursements for LoCs during the 2014-2015 fiscal year were 880 million USD (India
MoF 2015). However, only LoCs backed by the government are considered concessional in India
whereas the other LoCs are export oriented and thus non-concessional (EIBI 2011). Data provided by
the Exim Bank in 2011 help estimate the volume of concessional LoCs as a share of outstanding loans
that are backed by the government (ibid.) out of the total volume of LoCs in 2014 (India MoF 2015).
Based on this calculation, approximately 86% of LoCs are supported by the government. Applying
this ratio to the 880 million USD LoCs disbursed in 2014-2015 (as mentioned in the 2014-2015 MoF
Outcome budget), it can be estimated that 760 million USD equivalent LoCs were disbursed in
2014-2015. According to IDCR estimates of sector distribution over the period 2004-2013
(IDCR 2015), approximately 46% of this amount was allocated to infrastructure. As such, it can be
estimated that 350 million USD has been disbursed for infrastructure through LoCs in the 2014-2015
fiscal year.
Estimates for Saudi Development Fund disbursements to infrastructure in 2012
SFD’s most recent annual report is its 2012 Annual Report, which lists total commitments at a
project level. As a proxy for SFD’s disbursements to infrastructure, this report calculates uses the
average annual commitment amount of each infrastructure project (dividing by the project’s loan
term, and then aggregate the average annual commitment amounts for all infrastructure projects).

DCD/WKP(2015)1/REV1
58
BIBLIOGRAPHY
ACGI (Arab Coordination Group Institutions) (2011), Statement of Resolve of the Arab Funds of The
Coordination Group, 4th High Level Forum on Aid Effectiveness, 29 Nov – 1 Dec 2011, Busan,
Korea, http://www.adfd.ae/Documents/2011-11-02_Busan_Statement_of_Resolve.pdf.
Acharya, J. (2010), Dagachhu Hydropower Project: First Cross-Border Clean Development
Mechanism Initiative, CDM Project Brief, Asian Development Bank, September 2010,
http://www.adb.org/sites/default/files/publication/29066/cdm-project-brief-dagachhu.pdf.
AFD (The French Agency for Development) (2013), AFD Supports Sustainable Transport in
Istanbul, 21 January 2013,
http://www.afd.fr/webdav/shared/PORTAILS/PAYS/TURQUIE/PAGE%20D'ACCUEIL/CTR
1033_Istanbul_PRESS_RELEASE_01-2013.pdf
AFD (2014), Rehabilitaiton of Mavuzi and Chicamba Hydropower Stations,
http://www.afd.fr/lang/en/home/pays/afrique/geo-afr/mozambique/projets-
mz/infra/energie2/Mavuzi-Chicamba_1.
AfDB (African Development Bank) (2012), AfDB-Funded Thika Superhighway: A Masterpiece for
East Africa "A National Pride" - President Mwai Kibaki, 9 September 2012,
http://www.afdb.org/en/news-and-events/article/afdb-funded-thika-superhighway-a-
masterpiece-for-east-africa-a-national-pride-president-mwai-kibaki-9986/.
Agénor PR and Moreno-Dodson B (2006), Public Infrastructure and Growth: New Channels and
Policy Implications, World Bank Policy Research Working Paper 4064, http://www-
wds.worldbank.org/servlet/WDSContentServer/WDSP/IB/2006/11/08/000016406_2006110816
1655/Rendered/PDF/wps4064.pdf.
AsDB (2012), Philippines: Strengthening Public-Private Partnerships in the Philippines, Asian
Development Bank, December 2012, http://www.adb.org/sites/default/files/project-
document/75470/45515-001-phi-mcs.pdf.
Barr, R., S. Fankhauser and K. Hamilton (2010). “Adaptation Investments: A Resource Allocation
Framework”, in: Mitigation and Adaptation Strategies for Global Change, 15(8): 843-858,
http://www.oecd.org/env/cc/48351202.pdf.
Brooks, N., N. Adger and M. Kelly (2005). “The determinants of vulnerability and adaptive capacity
at the national level and the implications for adaptation”, in: Global Environmental Change 15:
151-163, http://www.sciencedirect.com/science/article/pii/S0959378004000913
COFIDES (Spanish Development Finance Company) (2013), 2013 Annual Report,
http://www.cofides.es/ficheros/Informes/2013_Annual_Report.pdf.
DFID (United Kingdom Department for International Development) (2013), Business Case and
Summary – Building a Reliable Investment Climate in Kenya (BRICK), March 2013,
http://devtracker.dfid.gov.uk/projects/GB-1-203348/documents/.
EBRD (European Bank for Reconstruction and Development) (2013), Western Balkans Sustainable
Energy Financing Facility II, May 2013, http://www.ebrd.com/documents/comms-and-
bis/western-balkans-sustainable-energy-financing-facility-ii.pdf.

DCD/WKP(2015)1/REV1
59
EC (European Commission) (2004), MEDA: over €700 million in 2004 to support the EU’s
Mediterranean partners, Press Release Database, Brussels, 26 November 2004,
http://europa.eu/rapid/press-release_MEMO-04-276_en.htm.
EC (2005), Euro-Mediterranean Partnership and MEDA Regional Activities, European Commission,
Euromed, Euromed Information Notes, June 2005,
http://www.emwis.org/overview/fol101997/fol221357/infonotes_200506-
en.pdf/download/1/infonotes_200506-en.pdf.
EC (2009), “Service procurement notice for ‘New Approaches in Telecommunications Policy III
(NATP III)’- ENPI South, Announced, European Commission”, Euromed, 31 March 2009,
http://www.enpi-info.eu/mainmed.php?id_type=4&id=18286.
Edenhofer O., R. Pichs-Madruga, Y. Sokona, S. Kadner, J. C. Minx, S. Brunner, S. Agrawala, G.
Baiocchi, I. A. Bashmakov, G. Blanco, J. Broome, T. Bruckner, M. Bustamante, L. Clarke, M.
Conte Grand, F. Creutzig, X. Cruz-Núñez, S. Dhakal, N. K. Dubash, P. Eickemeier, E.
Farahani, M. Fischedick, M. Fleurbaey, R. Gerlagh, L. Gómez-Echeverri, S. Gupta, J.
Harnisch, K. Jiang, F. Jotzo, S. Kartha, S. Klasen, C. Kolstad, V. Krey, H. Kunreuther, O.
Lucon, O. Masera, Y. Mulugetta, R. B. Norgaard, A. Patt, N. H. Ravindranath, K. Riahi, J.
Roy, A. Sagar, R. Schaeffer, S. Schlömer, K. C. Seto, K. Seyboth, R. Sims, P. Smith, E.
Somanathan, R. Stavins, C. von Stechow, T. Sterner, T. Sugiyama, S. Suh, D. Ürge-Vorsatz, K.
Urama, A. Venables, D. G. Victor, E.Weber, D. Zhou, J. Zou, and T. Zwickel, 2014: Technical
Summary. In: Climate Change 2014: Mitigation of Climate Change. Contribution of Working
Group III to the Fifth Assessment Report of the Intergovernmental Panel on Climate Change
[Edenhofer, O., R. Pichs-Madruga, Y. Sokona, E. Farahani, S. Kadner, K. Seyboth, A. Adler, I.
Baum, S. Brunner, P. Eickemeier, B. Kriemann, J. Savolainen, S. Schlömer, C. von Stechow, T.
Zwickel and J. C. Minx (eds.)]. Cambridge University Press, Cambridge, United Kingdom and
New York, NY, USA. http://www.ipcc.ch/pdf/assessment-
report/ar5/wg3/ipcc_wg3_ar5_technical-summary.pdf.
EDFI (European Development Finance Institutions) (2013), EDFI Annual Report,
www.edfi.be/component/downloads/downloads/106.html.
EIB (European Investment Bank) (2012), Broadband Rural Areas, 29 November 2012,
http://www.eib.org/projects/pipeline/2012/20120311.htm.
EIBI (Export Import Bank of India) (2011), Indian Lines of Credit: an Instrument to Enhance Indian-
African Partnership, http://www.indiainbusiness.nic.in/trade/presentation_loc/exim.pdf.
European Parliament (2014), Financing for Development Post-2015: Improving the Contribution of
Private Finance,
http://www.europarl.europa.eu/RegData/etudes/etudes/join/2014/433848/EXPO-
DEVE_ET(2014)433848_EN.pdf.
FMO (Dutch Entrepreneurial Development Bank) (2013), FMO Full Annual Report & Accounts
2013, http://annualreport2013.fmo.nl/.
Foster, V.and Briceno-Garmendia, C. (2009), Africa’s Infrastructure: A Time for Transformation,
Africa Development Forum Series, Washington, DC: World Bank Group,
http://documents.worldbank.org/curated/en/2009/01/11487313/africas-infrastructure-time-
transformation.

DCD/WKP(2015)1/REV1
60
Freemantle, S. and Stevens, J. (2010), Economic Strategy, “BRIC and Africa: New partnership poised
to grow Africa’s commercial infrastructure,” Standard Bank, South Africa, 15 October, 2010.
Fankhauser, M. and McDermott, T.K.J (2014). Understanding the adaptation deficit: why are poor
countries more vulnerable to climate events than rich countries?, Centre for Climate Change
Economics and Policy Working Paper No. 150. Grantham Research Institute on Climate
Change and the Environment Working Paper No. 134, http://ac.els-
cdn.com/S0959378014000806/1-s2.0-S0959378014000806-main.pdf?_tid=566c112a-2b09-
11e5-a955-00000aacb35f&acdnat=1436975661_03bb4eec13d64413cc76bacff65358f6
GEF (Global Environment Facility) (2014), Request for MSP Approval Sustainable Urban Mobility
Program for San Jose, Costa Rica, CR-T1110, January 2013,
http://www.thegef.org/gef/sites/thegef.org/files/gef_prj_docs/GEFProjectDocuments/Climate%
20Change/Costa%20Rica%20-%20(5838)%20-
%20Sustainable%20Urban%20Mobility%20Program%20for%20San%20Jose/MSP_request_si
gned1.pdf.
GCEC (The Global Commission on the Economy and Climate) (2014), Better Growth, Better
Climate: The New Climate Economy Report, http://2014.newclimateeconomy.report/wp-
content/uploads/2014/08/NCE_Chapter6_Finance.pdf.
Geary, K. (2015), The Suffering of Others, OXFAM,
https://www.oxfam.org/sites/www.oxfam.org/files/file_attachments/ib-suffering-of-others-
international-finance-corporation-020415-en.pdf.
GIZ (German Corporation for International Cooperation) (2015), Energy policy and energy efficiency,
12 June 2015, http://www.giz.de/en/worldwide/15622.html.
Gutman, J. et al. (2015). Financing African Infrastructure: Can the World Deliver? Brookings
Institutions, http://www.brookings.edu/~/media/Research/Files/Reports/2015/03/financing-
african-infrastructure-gutman-sy-
chattopadhyay/AGIFinancingAfricanInfrastructure_FinalWebv2.pdf?la=en.
IADB (Inter-American Development Bank) (2015a), Project Abstract: Panama Canal Expansion
Program, http://www.iadb.org/en/projects/project-description-title,1303.html?id=pn-l1032.
IADB (2015b), Sustainable Urban Mobility Program for San Jose Costa Rica Technical Co-
operation Document, CR-T1119, http://www.iadb.org/en/projects/project-description-
title,1303.html?id=CR-T1119.
ICA (Infrastructure Consortium for Africa) (2013), Infrastructure Financing Trends in Africa: ICA
Annual Report 2012. Tunis, Tunisia: Infrastructure Consortium for Africa Secretariat, African
Development Bank,
http://www.icafrica.org/fileadmin/documents/Annual_Reports/ICA%20_AnnualReport%20201
2.pdf.
IDCR (Indian Development Cooperation Research) (2015), Trends in Indian Development Assistance
in the Energy Sector, News Brief no. 4, 1st February, 2015, http://idcr.cprindia.org/blog/trends-
indian-development-assistance-energy-sector.
India MEA (Ministry of External Affairs, Government of India) (2015), Outcome Budget 2014-2015,
http://mea.gov.in/Uploads/PublicationDocs/23954_MEA_Outcome_Budget_ENG_2014-
15.pdf.

DCD/WKP(2015)1/REV1
61
India MoF (Ministry of Finance, Government of India) (2015). Outcome Budget 2014-2015,
http://finmin.nic.in/reports/OutcomeBudget2014_15.pdf.
IsDB (Islamic Development Bank) (2013), Annual Report 1434H (2013),
http://www.isdb.org/irj/go/km/docs/documents/IDBDevelopments/Internet/English/IDB/CM/Pu
blications/Annual_Reports/39th/AnnualReport39.pdf.
JICA (Japan International Cooperation Agency) (2013), Signing of Japanese ODA Loan Agreement
with the People’s Republic of Bangladesh, Press Release, 11 March 2013,
http://www.jica.go.jp/english/news/press/2012/130311_02.html.
Kaplinsky, R. (2013) Infrastructure Development within the Context of Africa's Cooperation with
New and Emerging Development Partners. Report prepared for the UN Office of the Special
Advisor on Africa, New York: United Nations. Available at
http://www.nepad.org/sites/default/files/Role%20of%20Emerging%20Partners%20in%20Infras
tructure%20Development.pdf.
Kasper, H. and Jett, A.N (2014), H1 2014 Global PPI Update, World Bank Group, Public Private
Partnership Group, http://ppi.worldbank.org/~/media/GIAWB/PPI/Documents/Global-
Notes/Global2014-PPI-Update.pdf.
Kingombe, C.K.M. (2011), Mapping the new infrastructure financing landscape, Overseas
Development Institute, http://www.odi.org/sites/odi.org.uk/files/odi-assets/publications-
opinion-files/6311.pdf.
Marin, P., (2009), Public-Private Partnerships for Urban Water Utilities A Review of Experiences in
Developing Countries, The World Bank Group, Washington DC,
https://openknowledge.worldbank.org/bitstream/handle/10986/2703/530170PUB0Tren101Offic
ial0Use0Only1.pdf?sequence=6.
Melohina, V. (2014), EBRD boosts energy efficiency in Serbia, European Bank for Reconstruction
and Development, 13 November 2014, http://www.ebrd.com/news/2014/ebrd-boosts-energy-
efficiency-in-serbia.html.
Miyamoto, K. and Biousse, K. (2014), Official Support for Private Sector Participation in Developing
Country Infrastructure, Organisation for Economic Co-operation and Development,
Development Co-operation Directorate, Working Papers No. 19. July 2014,
http://dx.doi.org/10.1787/5jz14cd40nf0-en.
Mwase N and Yang Y (2012), BRICs’ Philosophies for Development Financing and Their
Implications for LICs, IMF Working Paper WP/12/74,
https://www.imf.org/external/pubs/ft/wp/2012/wp1274.pdf.
NGO Briefing (2014), Ending fossil fuel support: the way forward NGO recommendations for OECD
countries on their Export Credit Agencies, http://bankwatch.org/sites/default/files/Briefing-
OECD-ECAs-coal-27May2014.pdf.
OECD (Organisation for Economic Co-operation and Development) (2012a), Mapping Support for
Africa’s Infrastructure Investment, http://www.oecd.org/daf/inv/investment-
policy/MappingReportWeb.pdf.
OECD (2012b), Trade-Related South-South Co-operation: India, Policy Dialogue on Aid for Trade,
2012, http://www.oecd.org/dac/aft/South-South_India.pdf.

DCD/WKP(2015)1/REV1
62
OECD (2014a), Background paper: A first international standard for measuring the leveraging effect
of private-sector instruments, Organisation for Economic Co-operation and Development, DAC
High Level Meeting, OECD Conference Centre, Paris, 15-16 December 2014,
http://www.oecd.org/dac/DACHLM2014%20A%20first%20international%20standard%20for
%20measuring%20the%20leveraging%20effect%20of%20private-sector%20instruments.pdf.
OECD (2014b), Case Study on Support for Private Sector Investment in Infrastructure: Gigawatt
Solar Plant in Rwanda, [DCD/WKP(2014)3/REV1].
OECD (2014c), Donor support to public-private partnerships: The case of the Dakar-Diamniadio
Toll Highway Project, [COM/DAF/INV/DCD/DAC(2014)4].
OECD (2015a), Policy Framework for Investment 2015 Edition,
http://www.oecd.org/daf/inv/investment-policy/Policy-Framework-for-Investment-2015-
CMIN2015-5.pdf.
OECD (2015b), Turkey’s Official Development Assistance, http://www.oecd.org/dac/stats/turkeys-
official-development-assistanceoda.htm
OECD (2015c), Summary Record of the Advisory Group on Investment and Development of the 19th
March 2015 [COM/DAF/INV/DCD/DAC/M(2015)1].
Rothballer, C. (2011), Infrastructure Investment Characteristics: Risk, Regulation, and Inflation
Hedging, Technisce Universitat Munchen.
https://mediatum.ub.tum.de/doc/1106559/1106559.pdf.
Schmidt-Traub, G. and Sachs, J.D. (2015), Financing Sustainable Development: Implementing the
SDGs through Effective Investment Strategies and Partnerships, Working Paper, Sustainable
Development Solutions Networks, available at http://unsdsn.org/wp-
content/uploads/2015/04/150408-SDSN-Financing-Sustainable-Development-Paper.pdf
SCIO (The People’s Republic of China State Council Information Office) (2011), China’s Foreign
Aid, April 2011, Beijing, http://news.xinhuanet.com/english2010/china/2011-
04/21/c_13839683.htm.
SCIO (The People’s Republic of China State Council Information Office) (2014), China’s Foreign
Aid (2014), July 2014, Beijing, http://news.xinhuanet.com/english/china/2014-
07/10/c_133474011.htm.
SDF (Saudi Fund for Development) (2012). 2012 Annual Report,
http://www.sfd.gov.sa/cs/groups/public/documents/document/mdaw/mjuy/~edisp/121-37-3703-
document-252051.pdf.
SIMEST (Società Italiana per le Imprese all’estero) (2013), 2013 Annual Report,
http://www.cdp.it/annual-report/en/2013/management-report/gruppo/composizione/simest.html.
Spratt, S. and Collins, L.R. (2012), Development Finance Institutions and Infrastructure: A
Systematic Review of Evidence for Development Additionality, Private Infrastructure
Development Group, Institute of Development Studies & Engineers Against Poverty, January
2012, https://www.ids.ac.uk/files/dmfile/2012IDS-PIDGSystematicReviewFinal.pdf.

DCD/WKP(2015)1/REV1
63
Straub, S. (2008). Infrastructure and Growth in Developing Countries: Recent Advances and
Research Challenges, Policy Research Working Paper 4460, the World Bank Group,
Washington, D.C, http://www-
wds.worldbank.org/servlet/WDSContentServer/WDSP/IB/2008/01/03/000158349_2008010308
2911/Rendered/PDF/wps4460.pdf
Sweden MFA (Ministry of Foreign Affairs, Government of Sweden) (2013), Speech by Ulla Andren,
Ambassador of Sweden and Mozambique, Maputo, 17 May 2013, http://www.swedenabroad.com/ImageVaultFiles/id_10831/cf_347/Speech_by_the_Ambassador_of_Swe
den_-_Chicamba_and_.PDF.
Sy, A. and Rakotondrazaka, F.M (2015), Private Capital Flows, Official Development Assistance, and
Remittances to Africa: Who Gets What? The Brookings Institution, Global Economy and
Development, Policy Paper 2015-2, May 2015,
http://www.brookings.edu/~/media/Research/Files/Papers/2015/05/official-development-
assistance-africa-sy-rakotondrazaka/Private-Capital-Flowswebv3.pdf?la=en.
Taraporevala, P. and Mullen, R. (2013) India–Africa Brief: Courting Africa through Economic
Diplomacy, Indian Development Cooperation, Research Policy Brief, New Delhi: Centre for
Policy Research, http://idcr.cprindia.org/blog/india-africa-brief.
te Welde, W., D. and Warne, M. (2007) Use of subsidies by Development Finance Institutions in the
infrastructure sector, Overseas Development Institute, London,
http://www.odi.org/sites/odi.org.uk/files/odi-assets/publications-opinion-files/604.pdf.
Tol, R.S.J. and G.W. Yohe (2007), The Weakest Link Hypothesis for Adaptive Capacity: An Empirical
Test, Global Environmental Change, 17: 218-227, http://ac.els-
cdn.com/S0959378006000689/1-s2.0-S0959378006000689-main.pdf?_tid=902a68e4-2b09-
11e5-8126-00000aacb361&acdnat=1436975757_22faf20384118a5690fca1e319f2bcd3
Tortora, P. (2011), Common Ground between South-South and North-South Co-operation Principles,
OECD Development Co-operation Issue Brief, OECD Publishing, Paris,
www.oecd.org/dac/stats/49245423.pdf.
Turkey MFA (Ministry of Foreign Affairs, Government of Turkey) (2015),
http://www.mfa.gov.tr/turkey_s-development-cooperation.en.mfa.
UNCTAD (United Nations Conference on Trade and Development) (2014) World Investment Report,
United Nations Publications, http://unctad.org/en/PublicationsLibrary/wir2014_en.pdf.
UNDP (United Nations Development Programme) (2014), Economy-wide integration to climate
change adaptation and disaster risk management and reduction to reduce climate vulnerability
of communities in Samoa,
http://www.undp.org/content/dam/samoa/docs/Factsheets/UNDP_WS_Economy-
WideProjectBrief.pdf.
USAID (United States Agency for International Development) (2012), Tanzania Integrated Water,
Sanitation and Hygiene Program (iWASH), Global Water for Sustainability Program, 2 August
2012, http://www.globalwaters.net/wp-content/uploads/2012/02/August-21-NEW-iWASH-
brief.pdf.

DCD/WKP(2015)1/REV1
64
USAID (2013), Performance Evaluation for the Integrated Water, Sanitation and Hygiene (iWASH)
Program: Final Report, United States Agency for International Development, November 2013
http://pdf.usaid.gov/pdf_docs/pa00jm6x.pdf.
Wolf, C. et al. (2013), China’s Foreign Aid and Government-Sponsored Investment Activities, RAND
National Defense Research Institute,
http://www.rand.org/content/dam/rand/pubs/research_reports/RR100/RR118/RAND_RR118.pd
f.
TIKA (Turkish Cooperation and Coordination Agency) (2013a), 2013 Annual Report,
http://www.tika.gov.tr/upload/publication/TIKA%20ANNUAL%20REPORT%202013.pdf
TIKA (Turkish Cooperation and Coordination Agency) (2013b). Turkish Development Assistance
2013, http://www.tika.gov.tr/upload/publication/KYR_FRAE_2013_uyg9.pdf.
WBG (World Bank Group) (2011), World Bank Supports Morocco’s Bold Solar Power Plans, 17
November 2011, http://www.worldbank.org/en/news/press-release/2011/11/17/world-bank-
supports-moroccos-bold-solar-power-plans
WBG (2012), Restructuring Paper on a Proposed Project Restructuring of the South-West Roads
Project: Western Europe-Western China International Transit Corridor (CAREC 1B & 6B)
Project to the Republic of Kazakhstan, Central Asia Country Unit, 7 May 2012, http://www-
wds.worldbank.org/external/default/WDSContentServer/WDSP/IB/2012/06/12/000356161_20
120612011449/Rendered/PDF/640440PJPR0P090Official0Use0Only090.pdf.
WBG (2013a), Turn Down the Heat. Climate Extremes, Regional Impacts, and the Case for
Resilience. World Bank Group, Washington DC,
http://www.worldbank.org/content/dam/Worldbank/document/Full_Report_Vol_2_Turn_Down
_The_Heat_%20Climate_Extremes_Regional_Impacts_Case_for_Resilience_Print%20version
_FINAL.pdf.
WBG (2013b), Bangladesh Received $400 Million to Rehabilitate 600km Embankments in Coastal
Districts, 1 October 2013, http://www.worldbank.org/en/news/press-
release/2013/10/01/bangladesh-receives-400-million-to-rehabilitate-600km-embankments-in-
coastal-districts.