supply chain vulnerability assessment for manufacturing
TRANSCRIPT

Vol.:(0123456789)
Annals of Operations Researchhttps://doi.org/10.1007/s10479-021-04155-4
1 3
ORIGINAL RESEARCH
Supply chain vulnerability assessment for manufacturing industry
Satyendra Kumar Sharma1 · Praveen Ranjan Srivastava2 · Ajay Kumar3 · Anil Jindal4 · Shivam Gupta5
Accepted: 8 June 2021 © The Author(s), under exclusive licence to Springer Science+Business Media, LLC, part of Springer Nature 2021
AbstractIn today’s business, environment natural and manmade disasters like recent event (Covid 19) have increased the attention of practitioners and researchers to Supply chain vulner-ability. Purpose of this paper is to investigate and prioritize the factors that are responsi-ble for supply chain vulnerability. Extant literature review and interviews with the experts helped to extract 26 supply chain vulnerability factors. Further, the relative criticality of vulnerability factors is assessed by analytical hierarchy process (AHP). Critical part sup-plier; location of supplier; long supply chain lead times; Fixing process owners and mis-aligned incentives in supply chain are identified as the most critical factors among twenty-six vulnerability factors. Research concludes that not only long and complex supply chain but supply chain practices adopted by firms also increase supply chain vulnerability. Rela-tive assessment of vulnerability factors enables professionals to take appropriate mitigation strategies to make the supply chains more robust. This research adds in building a model for vulnerability factors that are internal to supply chain & controllable.
Keywords Supply chain · Vulnerability · Drivers · AHP · Sensitivity analysis
1 Introduction
In today’s business environment, companies striving for global competitiveness through supply chain management (Tan et al., 2002; Ketchen Jr & Hult 2007). With the increase in out-sourcing and off-shoring, disruptions in supply chain has increased (Manuj & Mentzer, 2008; Mudambi & Venzin, 2010). Global supply chain decisions are based on tradeoff
* Ajay Kumar [email protected]
1 Department of Management, BITS Pilani, Rajasthan, India2 Indian Institute of Management (IIM), Rohtak, India3 AIM Research Center on Quantitative Methods in Business, EMLYON Business School, Écully,
France4 Maharaja Ranjit Singh Punjab Technical University, Bathinda, India5 NEOMA Business School, REIMS, France

Annals of Operations Research
1 3
between efficiency and vulnerability in supply chains (Bode & Wagner, 2015). A pivotal step in managing the frequency and impact of disruptions that may jeopardize the flow in supply chain is the ability to recognize the segments that are more prone and sensi-tive to disruption (Blackhurst et al., 2018; Trkman & McCormack, 2009). Supply-chain vulnerability can be described as the propensity of risk sources and risk drivers to exceed risk-mitigating strategies, thereby leading to unfavorable results and jeopardizing the sup-ply chain’s ability to productively serve the consumer (Bode & Wagner, 2015; Wagner & Bode, 2006). Supply chain risk and supply chain vulnerability are used interchangeably by authors (Chapman et al., 2002; Peck, 2006). But Peck (2010) differentiated the terms like supply chain risk, vulnerability and resilience. Literature defined vulnerably as design and process factors that may increase the exposure to different kind of internal or external risks in supply chain (Bogataj & Bogataj, 2007). In other words, vulnerability is used to measure the sensitivity of a supply chain to these disturbances. If managers can assess their supply chain vulnerability, then better decisions can be taken to make supply chains more robust.
Literature on supply chain vulnerability (SCV) provides some conceptual frameworks and a very few empirical studies, though literature on supply chain risk management has vast coverage in terms of conceptual frameworks and mathematical models. There is dif-ference in supply chain risk and supply chain vulnerability. Risk is outcome (always nega-tive in case of supply chain disruptions) and vulnerability is a driving force that leads to risk in supply chain (El Baz & Ruel, 2020; Marvin et al., 2020). Research has developed various qualitative and quantitative models for supply chain risk assessment, the present literature lacks in assessing the Supply Chain Vulnerability factors. SCV is precondition to supply chain risks. SCV is the result of various supply chain decisions that increase the exposure of supply chain to various disruptions (Ivanov & Sokolov, 2019). Literature on supply chain resilience have provided discussion on supply chain design and its relation-ship with resilience. Literature is lacking discussions on supply chain practices that may cause vulnerability. This research aims to develop a supply chain vulnerability model in the context of emerging economies. SCV in form of index, does not provide any help to man-agers, rather if its formulated into criteria and sub-criteria form, managers have some start points for mitigation. There is a need to study and provide a definitive weightage to each of the criteria and sub-criteria. This would help in identifying the highly critical factors and focused approach to minimize SCV. In the current COVID scenario, it is therefore both critical to first identify the various supply chain factors in manufacturing sector and then, to compute the crisp priority score for each criterion. This rationalizes the formulation of the following two important research questions answered through this research.
RQ1 What are the supply chain vulnerability factors prevalent in manufacturing indus-try?RQ2 What is the priorities of each supply chain vulnerability factor?
In this paper, a supply chain vulnerability hierarchical framework is proposed and devel-oped. The framework embeds the vulnerability factors also known as pressure points in supply chain that may cause disruptions. Certain pressure points in supply chain can have too low pressure or too high pressure, depending on the supply chain resources, manage-ment styles and supply chain design parameters. Main aim of this research is to identify comprehensive and relevant supply chain vulnerability factors, wherein firms have control power to adjust the SCV underlying factors known as SCV drivers. Then research aims to utilize analytic hierarchy process for prioritizing identified SCV factors.
Annals of Operations Research
1 3
The proposed supply chain vulnerability framework is based on expert survey in manu-facturing industry and extensive literature review. The next section provides the literature review from supply chain risk and vulnerability perspectives. Section 3 explained research framework used in this research. Section 4 provides detailed view on research method-ology to answer the research questions. Then next Sect. 5 describes the use of proposed model through a case application in Indian manufacturing industry. Section 6 provides a discussion on results and then Sect. 7 briefly discusses theoretical and managerial implica-tions of the research. Last Sect. 8 concludes the main findings and future scope of research.
2 Literature review
Supply chain risk management (SCRM) has picked up a lot of attention in the last decade due to increased frequency and ferocity of catastrophes, disasters and crises (Biggs et al., 2011).
In addition to prominent macro-events that have caused disturbance to supply chain, supply chain level events have also resulted in serious problems for the firms (Latour, 2001; Norrman & Jansson, 2004; Sheffi and Rice Jr 2005). (Svensson, 2004; Wagner & Neshat, 2010) noted that “supply chain vulnerability is a function of certain supply chain characteristics and that a given supply chain disruption may result into losses to a firm due to its supply chain vulnerability’’.
DuHadway et al. (2019) developed a framework for supply chain risk management and concluded that it is important to understand the reasons that generate supply chain risks. Supply chain risks are the events that affect the supply chain goals and causes losses to firms. Supply chain vulnerability is precondition to supply chain risk. SCV exposes supply chain to external or internal risk (Chiu & Choi, 2016; Wagner & Bode, 2006).
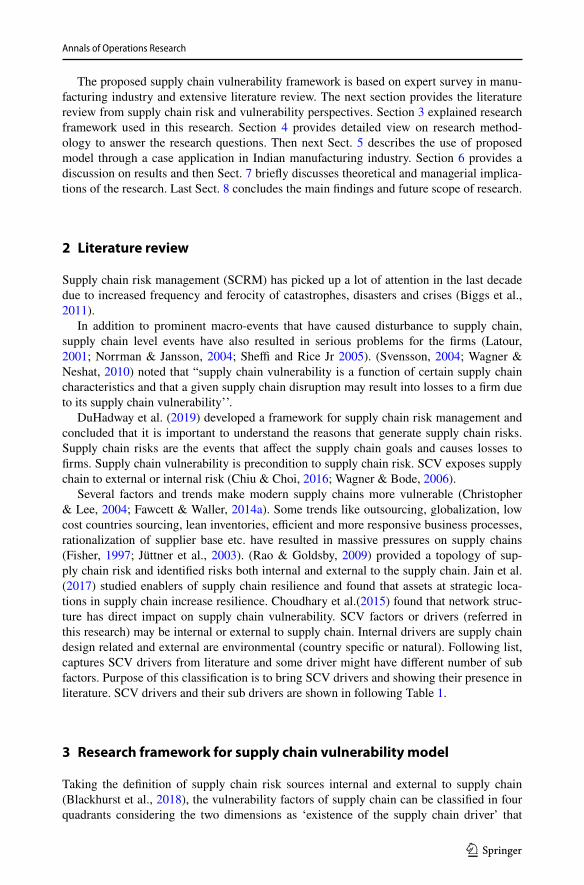
Several factors and trends make modern supply chains more vulnerable (Christopher & Lee, 2004; Fawcett & Waller, 2014a). Some trends like outsourcing, globalization, low cost countries sourcing, lean inventories, efficient and more responsive business processes, rationalization of supplier base etc. have resulted in massive pressures on supply chains (Fisher, 1997; Jüttner et al., 2003). (Rao & Goldsby, 2009) provided a topology of sup-ply chain risk and identified risks both internal and external to the supply chain. Jain et al. (2017) studied enablers of supply chain resilience and found that assets at strategic loca-tions in supply chain increase resilience. Choudhary et al.(2015) found that network struc-ture has direct impact on supply chain vulnerability. SCV factors or drivers (referred in this research) may be internal or external to supply chain. Internal drivers are supply chain design related and external are environmental (country specific or natural). Following list, captures SCV drivers from literature and some driver might have different number of sub factors. Purpose of this classification is to bring SCV drivers and showing their presence in literature. SCV drivers and their sub drivers are shown in following Table 1.
3 Research framework for supply chain vulnerability model
Taking the definition of supply chain risk sources internal and external to supply chain (Blackhurst et al., 2018), the vulnerability factors of supply chain can be classified in four quadrants considering the two dimensions as ‘existence of the supply chain driver’ that

Annals of Operations Research
1 3
Tabl
e 1
Sup
ply
chai
n vu
lner
abili
ty d
river
s and
sub
driv
ers
Vul
nera
bilit
y fa
ctor
Sub
fact
orM
easu
rem
ent v
aria
ble
Defi
nitio
nC
itatio
ns
Supp
ly c
hain
stru
ctur
eSu
pply
cha
in c
ompl
exity
(Xia
op-
ing,
201
6); (
Cha
tterje
e &
Kar
, 20
16);
(Don
g &
Coo
per,
2016
)
Num
ber o
f nod
esN
o. o
f ups
tream
& d
owns
tream
fa
cilit
ies
Abd
el-B
asse
t & M
oham
ed (2
020)
, Pa
ksoy
et a
l. (2
019)
No
of d
irect
link
ages
Mat
eria
ls/p
rodu
cts m
ovem
ent
betw
een
two
faci
litie
s with
out
any
inte
rmed
iate
stor
age
poin
t is
calle
d di
rect
ion
conn
ectio
n
Kim
(200
9), D
ubey
et a
l. (2
019)
No.
of i
ndire
ct li
nkag
esN
o. o
f ind
irect
con
nect
ion;
and
if
faci
litie
s are
con
nect
ed th
roug
h so
me
inte
rmed
iate
/third
par
ty is
ca
lled
indi
rect
con
nect
ion
Kim
(200
9), D
ubey
et a
l. (2
019)
, El
luru
et a
l. (2
019)
Glo
bal s
ourc
ing
Supp
liers
spre
ad o
ut in
offs
hore
lo
catio
nsW
agne
r & N
esha
t (20
10),
Gro
sse-
Ruyk
en e
t al.
(201
2)Le
an in
vent
ory
Supp
ly o
f par
ts/ra
w m
ater
ials
in
Just
in ti
me
mod
eW
agne
r & N
esha
t (20
10),
Abd
el-
Bas
set &
Moh
amed
(202
0)Lo
w in
hou
se p
rodu
ctio
nPr
oduc
tion
capa
city
if h
ome
loca
-tio
n of
OEM
Wag
ner &
Nes
hat (
2010
)
Nod
e cr
itica
lity
Loca
tion
of su
pplie
rLo
catio
n of
supp
liers
acr
oss t
he
glob
eA
bdel
-Bas
set &
Moh
amed
(202
0)
Con
cent
ratio
n of
supp
liers
/ sin
gle
supp
lier
If m
any
of th
e su
pplie
rs a
re
loca
ted
in o
ne lo
catio
n/Pa
rt is
su
pplie
d by
one
sing
le su
pplie
r
Paks
oy e
t al.
(201
9), R
ajes
h &
R
avi (
2017
), Ro
gers
et a
l. (2
016)
, W
agne
r & N
esha
t (20
10),
Gro
sse-
Ruyk
en e
t al.
(201
2)K
ey su
pplie
r fai
lure
Supp
liers
of p
refe
rred
stat
us fa
il in
su
pply
ing
parts
/inpu
t sup
ply
Sach
in K
Man
gla
et a
l., (2
015a
, 20
15b)
, Sac
hin
Kum
ar M
angl
a et
al.,
(201
5a, 2
015b
)C
ritic
al p
art s
uppl
ier
Supp
lier u
ncer
tain
ty su
pplie
r fa
ilure
Abd
el-B
asse
t & M
oham
ed (2
020)
, M
ajum
dar e
t al.
(202
0)O
rgan
izat
ion
com
plex
ityPr
oduc
t com
plex
ityPr
oduc
t var
iety
No.
of p
rodu
ct v
aria
nts
Cha
udhu
ri et
al.
(201
3)Pr
oduc
t life
cyc
leSh
ort p
rodu
ct li
fe c
ycle
Wag
ner &
Nes
hat (
2010
)
Annals of Operations Research
1 3
Tabl
e 1
(con
tinue
d)
Vul
nera
bilit
y fa
ctor
Sub
fact
orM
easu
rem
ent v
aria
ble
Defi
nitio
nC
itatio
ns
No.
of s
ubas
sem
blie
s/m
odul
esN
o. o
f sub
asse
mbl
ies o
f mod
ule
cont
aini
ng m
any
parts
Lam
bert
(199
7), (
He
et a
l. (2
020)
Proc
ess c
ompl
exity
Proc
ess c
ycle
tim
eSh
ort l
ead
time
Paks
oy e
t al.
(201
9), (
Roge
rs e
t al.
(201
6), C
haud
huri
et a
l. (2
013)
Ope
ratio
nal f
ailu
reA
n in
terr
uptio
n du
e to
mac
hine
or
equi
pmen
t fai
lure
Sach
in K
Man
gla
et a
l., (2
015a
, 20
15b)
, Abd
el-B
asse
t &
Moh
amed
(202
0), M
ital e
t al.
(201
8), X
iaop
ing
(201
6), C
hatte
r-je
e &
Kar
(201
6), D
ong
& C
oope
r (2
016)
Fixi
ng p
roce
ss o
wne
rsFi
the
resp
onsi
bilit
ies o
f sup
-pl
y ch
ain
proc
esse
sG
unas
ekar
an e
t al.
(200
4), d
e So
usa
Jabb
our e
t al.
(201
8)Le
an in
vent
ory
Supp
ly o
f par
ts/ra
w m
ater
ials
in
Just
in ti
me
mod
ePa
ksoy
et a
l. (2
019)
, Raj
esh
& R
avi
(201
7), A
bdel
-Bas
set &
Moh
amed
(2
020)
, Mita
l et a
l. (2
018)
Dec
isio
n m
akin
g le
vels
in a
pr
oces
sN
o. o
f dec
isio
n m
akin
g la
yers
for
a pa
rticu
lar d
ecis
ion
abou
t the
pr
oces
s
Abd
el-B
asse
t & M
oham
ed (2
020)
Supp
ly c
hain
rela
tions
hip
Type
of r
elat
ions
hip
No
of c
olla
bora
tive
rela
tions
hips
Trus
t am
ong
supp
ly c
hain
par
tner
sFa
isal
et a
l. (2
006)
, Sin
ha e
t al.
(200
4) G
hode
et a
l. (2
020)
Num
ber o
f tra
nsac
tiona
l rel
atio
n-sh
ipD
yad
(sup
plie
r–bu
yer)
hav
ing
arm
s-le
ngth
rela
tions
hip
Gun
asek
aran
et a
l. (2
004)
, de
Sous
a Ja
bbou
r et a
l. (2
018)
No.
of n
odes
with
dep
ende
ncie
sN
umbe
r of f
acili
ties h
avin
g de
pend
enci
es o
n ot
her f
acili
ties
Lópe
z &
Ishi
zaka
(201
9)
Deg
ree
of a
lignm
ent
Perfo
rman
ce b
ased
ince
ntiv
esM
onet
ary
ince
ntiv
es b
ased
on
perfo
rman
ceFa
isal
et a
l. (2
006)
, Nar
ayan
an &
R
aman
(200
4)B
uyer
supp
lier p
roce
ss a
lignm
ent
Proc
esse
s of o
rder
pla
cem
ent a
nd
rece
ipt o
f buy
ers a
nd su
pplie
rs
are
inte
grat
ed
Kim
(200
9), D
ubey
et a
l. (2
019)

Annals of Operations Research
1 3
Tabl
e 1
(con
tinue
d)
Vul
nera
bilit
y fa
ctor
Sub
fact
orM
easu
rem
ent v
aria
ble
Defi
nitio
nC
itatio
ns
Info
rmat
ion
man
agem
ent
Info
rmat
ion
visi
bilit
yU
se o
f ER
P, E
DI
Use
of e
nter
pris
e re
sour
ce p
lan-
ning
, ele
ctro
nic
data
inte
rcha
nge
Whi
te e
t al.
(200
5); Y
uvar
aj &
Sa
ngee
tha
(201
6)U
se o
f GPS
, RFI
DU
se o
f glo
bal p
ositi
onin
g sy
stem
an
d R
adio
freq
uenc
y id
entifi
ca-
tion
Whi
te e
t al.
(200
5); Y
uvar
aj &
Sa
ngee
tha
(201
6)
Shar
ing
of In
vent
ory
data
Shar
ing
of in
vent
ory
stat
us d
ata
betw
een
buye
r & su
pplie
rA
bdel
-Bas
set &
Moh
amed
(202
0)
Shar
ing
of d
eman
d da
taSh
arin
g of
inve
ntor
y de
man
d fo
re-
casts
bet
wee
n bu
yer &
supp
lier
Paks
oy e
t al.
(201
9)
Lack
of t
rans
pare
ncy
No
data
is sh
ared
bet
wee
n su
pply
ch
ain
partn
ers
Paks
oy e
t al.
(201
9)
Fore
casti
ng e
rror
bul
lwhi
p eff
ect
Fore
casts
are
not
acc
urat
eM
ajum
dar e
t al.
(202
0), R
ajes
h &
R
avi (
2017
)Lo
ss/la
ck o
f inf
orm
atio
nR
ight
info
rmat
ion
is n
ot sh
ared
am
ong
supp
ly c
hain
par
tner
sR
ajes
h &
Rav
i (20
17),
Abd
el-B
asse
t &
Moh
amed
(202
0), X
iaop
ing
(201
6), D
ong
& C
oope
r (20
16)
Info
rmat
ion
dela
yIn
form
atio
n is
shar
ed ti
mel
yPa
ksoy
et a
l. (2
019)
Con
trols
/ear
ly w
arni
ng sy
stem
sU
se o
f sup
ply
chai
n da
shbo
ards
Use
of v
ario
us su
pply
cha
in m
et-
rics f
or p
erfo
rman
ce m
onito
ring
& c
ontro
l
Vla
jic e
t al.
(201
2), M
ital e
t al.
(201
8)
Early
war
ning
syste
ms
Dev
iatio
ns a
re c
aptu
red
and
early
si
gn a
re p
asse
dD
ong
& C
oope
r (20
16)
Use
of r
isk
anal
ytic
s/m
anag
emen
tR
isks
are
fore
caste
d an
d ris
k m
an-
agem
ent i
s im
plem
ente
dM
ajum
dar e
t al.
(202
0)
Fina
ncia
l sou
rce
Cur
renc
y flu
ctua
tion
exch
ange
rate
Glo
bal s
uppl
y ch
ains
con
side
r the
cu
rren
cy fl
uctu
atio
n fo
r sup
ply
chai
n de
cisi
ons
Maj
umda
r et a
l. (2
020)
, Pak
soy
et a
l. (2
019)
, Rog
ers e
t al.
(201
6),
Sach
in K
Man
gla
et a
l., (2
015a
, 20
15b)

Annals of Operations Research
1 3
Tabl
e 1
(con
tinue
d)
Vul
nera
bilit
y fa
ctor
Sub
fact
orM
easu
rem
ent v
aria
ble
Defi
nitio
nC
itatio
ns
Tran
spor
tatio
n m
ode/
pric
e ch
ange
Diff
eren
t mod
es o
f tra
nspo
rtatio
n an
d ch
ange
s in
pric
ePa
ksoy
et a
l. (2
019)
, Maj
umda
r et
al.
(202
0), R
oger
s et a
l. (2
016)
Envi
ronm
ent
Nat
ural
dis
aste
rs d
isea
ses/
epi-
dem
icFl
ood,
ear
th q
uake
etc
Maj
umda
r et a
l. (2
020)
, Rog
ers
et a
l. (2
016)
Dem
and
side
Dem
and
unce
rtain
ty (D
U)
DU
is fl
uctu
atio
ns in
dem
and
impl
ied
by fi
rm, i
ndus
try a
nd
envi
ronm
enta
l rel
ated
var
iabl
es
Sach
in K
umar
Man
gla
et a
l.,
(201
5a, 2
015b
), T.
-M. C
hoi e
t al.
(201
7)

Annals of Operations Research
1 3
may be within supply chain and outside the supply chain. Another dimension is the ‘extent of business control’ which may be at two level like controllable and uncontrollable.
The two dimensions used to classify SCV factors are: Source of risk with endpoints namely Internal and External; Risk controllability having two end points namely Control-lable and Uncontrollable. SCV factors’ that drives or increase vulnerability are called SCV drivers. In this paper, these terms have been used interchangeably. In this way, the different supply chain vulnerability drivers in four quadrants are shown in Fig. 1. The identified supply chain vulnerability factors presented in Fig. 1 presents the perspective on quick-wins that can be taken for consideration and results can be achieved with less efforts. The SCV drivers in quadrant 1 are internal to the supply chain and are controllable. In this research, only factors/drivers lying in internal/controllable category are taken into consideration. These factors rep-resent supply design factors which can be adjusted by firms with suitable strategies or supply chain configurations. Factors in quadrant I are supply chain vulnerability factors and priority understanding of these SCV factors will provide actionable insights to managers.
SCV Factors that are internal to the supply chain and controllable by business actions are considered for criticality assessment. Wagner and Neshat (2010) identified three supply chain vulnerability drivers namely: Supply, Demand and Structural vulnerability. In this research, for modelling purpose SCV factors that lies within supply chain and factors wherein firm has controllability have been considered. Proposed supply chain vulnerability factors are categorized at four levels: Supply chain level, within the firm (node) level and buyer–sup-plier relationship level. Moreover, information is most influential supply chain enabler (Faw-cett & Waller, 2014b). Information sharing and its usage in information technology systems makes supply chain more secure and provides capability to cope with risk drivers (Luthra et al., 2017). Information management has been taken as fourth SCV driver. Sections 3.1 to 3.4show a description of supply chain vulnerability drivers with literature citations.
3.1 Supply chain structure vulnerability drivers
Supply chain structure is denoted by number of nodes and the linkages among them. Struc-ture complexity of supply chain is measured through number of nodes and complex interac-tions between nodes (Serdarasan, 2013). Higher the number of nodes and linkages among them higher is the supply chain complexity (Aelker et al., 2013; Wilding et al., 2012). Sup-ply chain vulnerability is affected by factors like number of suppliers, supplier concentra-tion (Paksoy et al., 2019; Tang, 2006), customer dependence (Hallikas et al., 2005) and
Fig. 1 Classification of supply chain vulnerability factors (Agrawal & Pingle, 2020; Chand et al., 2020)
Quadrant 3Internal to the Supply Chain and Un-Controllable by Business Ac�onEx. Transporta�on Infra Bo�lenecks
Quadrant 4External to the Supply Chain and Un-Controllable by Business Ac�onEx. Natural disaster, War
Quadrant 1Internal to the Supply Chain and Controllable by Business Ac�onEx. SC Complexity
Quadrant 2External to the Supply Chain and Controllable by Business Ac�onEx. Poli�cal/Legal Uncertainty
Internal External
Con
trol
labl
e U
n-C
ontr
olla
ble

Annals of Operations Research
1 3
dependence on a particular supplier (Giunipero & Eltantawy, 2004; Majumdar et al., 2020; Svensson, 2004). Here, No. of nodes and each node’s criticality is considered to represent complexity influencing SCV.
3.1.1 Number of nodes
Is indicated by the number of alternative suppliers that are available for particular compo-nent (Hallikas et al., 2005). As number of nodes in upstream or downstream increases the supply chain complexity increases. This increased number of nodes in supply chain causes coordination difficulty and may results into errors in processes. Simultaneously, alternative suppliers reduces the dependencies and reduces the vulnerability in supply chain (Paksoy et al., 2019).
3.1.2 Node criticality
Is represented by number of linkages emerging out and merging in from a particular node. For a particular node if number of linkages coming in are more than number of linkages going out it becomes more vulnerable. The focal company is forced to have substantial losses if there are any disruptions from the customer side. A situation in which buying firms have a limited no. of suppliers is called as Node Concentration. There is an increase in supply chain vulnerability due to the growing reduction of suppliers and having closer contact with less suppliers (T. Y. Choi & Krause, 2006). Supply base reduction has advan-tages such as increased product quality but the firm lacks contingency suppliers in case of supply disruption. Single sourcing occurs when there is extreme case of supplier concen-tration (Abdel-Basset & Mohamed, 2020).
3.2 Organization complexity vulnerability drivers
It has long been stressed that the structure and management system of the organization must evolve to growing maturity in order to adapt to the dynamic environment (Anderson & Narus, 1990). Complexity can be interpreted as the variety in objects, structures and processes (Wagner & Bode, 2006). It is suggested that modern initiatives for supply chain management amplify the supply chain risk (Vilko & Hallikas, 2012). Organization com-plexity may be present in all nodes of the supply chain. Complexity of the organization is considered to be dependent on the product and processes in the organization. For measur-ing organization complexity, product and process complexity is considered.
3.2.1 Product complexity
Is defined by number of parts and components needed to produce a product (Clark & Fuji-moto, 1991). Supply chain vulnerability is affected by product design as chances of failure increase if product design is complex (Inman & Blumenfeld, 2014). Product complexity can be judged by managers by answering questions like: In the final product, what is num-ber of bought out components? What is number of critical components in the end product? What amount of time and money is spent on designing the product? The concept of modu-larity is being adopted by automobile companies. Vehicle manufacturers are increasingly asking suppliers to take a greater responsibility of assembling vehicle components into sub-assemblies (Froggatt, 2017; Wolters & Schuller, 1997).

Annals of Operations Research
1 3
3.2.2 Process complexity
Affects supply chain risk in a significant way (Bode & Wagner, 2015). Two types of pro-cess complexity are defined in this risk model namely: Manufacturing process complexity and Business process complexity. Process complexity is affected by factors like: (1) No. of bought out components, (2) Product life cycle, (3) Variety of products, (4) Manufacturing lead time and (5) Production process types (Chaudhuri et al., 2013; Paksoy et al., 2019). Long process lead time and high decision making points in process increases the business process complexity.
3.3 Supply chain relationship vulnerability drivers
Creation of active relationships and integration across different levels of the supply chain are inevitable part of supply-chain management (Trkman & McCormack, 2009). Each participat-ing member as an independent identity has its own strategic objectives, performance measures and business processes. Because of which supply chain members tries to maximizing their own performance efficiency rather than overall supply chain and its acts as a major source of supply chain discontent (Fisher, 1997; Zeng & Yen, 2017).
3.3.1 Type of supply chain relationship
Firms are building stronger relationships with their supply chain suppliers in order to gain flexibility, efficiency, and sustainable competitive advantage (Liao et al., 2010). In order to reduce risks to whole supply chain collaborative supply chain relationships are done (Nyaga et al., 2010). Behavioral uncertainty (negatively) and specific asset investment (positively) highly influence the firm’s trust in its supply chain partner. Based on this dyad might be placed at different points on supply chain relationship continuum from transactional to collaborative (Touboulic et al., 2014; van Donk et al., 2010). Social network analysis is used by focal com-panies for network position characteristics of focal companies which also affects the supply chain relationship and financial performance (Seiler et al., 2020).
3.3.2 Performance measure alignment
Depends on individual metrics isolated from the entire goal. In the entire supply chain there is no performance evaluation for supply chain members. Any deed that only aims to improve an individual’s metric, without considering the overall scenario of system is likely to result in a negative effect (Simatupang & Sridharan, 2002). Internal measures do not direct towards whole supply chain. Frequently, performance evaluations are based on cost reductions instead of revenue management (Manuj & Sahin, 2011). Disintegration between performance meas-ures can be found by managers through answering the question as to what is cost pressure faced by their supply chain and how to shift cost pressures in the supply chain.
3.4 Information management vulnerability drivers
Information flow in supply chain is very vital while making managerial decisions. Demand information flows in upstream through successive members in supply chain transferring this information to their immediate member. During its movement starting from end

Annals of Operations Research
1 3
customer to the last source of supply, the distortion of demand information is common (Lee et al., 2004). Supply chain vulnerability due to information management is deter-mined via proposed vulnerability model based on level of information sharing (Abdel-Bas-set & Mohamed, 2020).
3.4.1 Information visibility
Plays a vital role in supply chain. More access to information sources to members in sup-ply chain compared to other players results in information asymmetry (Lee et al., 2004). (Caridi et al., 2010) identified the benefits of visibility in the supply chain in terms of effi-ciency, productivity, and the effective planning of operations (Petersen et al., 2005). The member with greater access to information may take unfair advantages, which reduces supply chain profits and increases supply chain vulnerability. For example, knowledge about manufacturing process and product quality is more aptly to be with the manufacturer while knowledge about customers and product demand is more with the retailer. The con-flicting decision criterion in terms of decisions related to inventory, transportation, lead time, capacity and quality are not resolved by information asymmetry (Levi et al., 2000). Another important factor is Information Accuracy (Paksoy et al., 2019).
3.4.2 Detection and control mechanism
To prevent the occurrence of potential failure, final and important factor that is included in the model is failure detection and control mechanism. This factor is rated by manager’s by determining the sort of detection tools supply side has and what are control methods that the supply chain is using to prevent any adverse event and reduce the graveness of it (Ojha et al., 2018). Some of the detection or alarming tools are statistical quality control tech-niques and inspection, forecasting tools, ERP, MRP, analytic solutions for vehicle routing and scheduling. Supply chains are less vulnerable based on the extent to which it uses all these tools.
In this research, SCV is addressed through individual (organization), supply chain, interfaces in supply chain and the important factor information that acts as glue in connect-ing supply chain. Four important factors supply chain complexity, organizational complex-ity, supply chain relationships and information management are taken as SCV main drivers and furthers the sub drivers are being developed for four major drivers. Literature provides in depth discussion on the various vulnerability drivers. Based on the above discussion, the supply chain vulnerability model proposed is shown below in Fig. 2.
This research provides a novel framework in terms of connecting two research streams in supply chain with SCV. Figure 2 is a three-level structure-based, supply chain vulner-ability driver model, wherein SCV’s main drivers and then sub-drivers are being explored in manufacturing industry. The main drivers of SCV are classified into: Supply Chain (SC) Structure, Organizational Complexity, SC Relationship Complexity and Information Man-agement. Further, each driver is sub-divided in turn into many sub-drivers. Supply Chain Structure can be defined in terms of ‘No of Nodes’ and ‘Node Criticality’. Organizational Complexity can be addressed by minimizing both ‘Product Complexity’ and ‘Process Complexity’.SC Relationship Complexity can be handled by examining the ‘Type of SC Relationship’ and ‘Degree of Alignment’. Information Management can be performed by maximizing ‘Information Visibility’ and strengthening the various ‘Control and Alert IT Systems’.

Annals of Operations Research
1 3
(Chand et al., 2020; Wang et al., 2018) studied the supply chain complexity drivers. Other authors like (Serdarasan, 2013) also talked about the supply chain complexity as one of the important drivers of supply chain vulnerability. In this research, authors consid-ered the supply chain relationship as the driver of SCV. Supply chain relationships is well explored area in supply chain but how relationship issues in supply chain can cause SCV is not investigated in literature. Information flow associated with material flow in supply chain also affects the SCV.
4 Research methodology
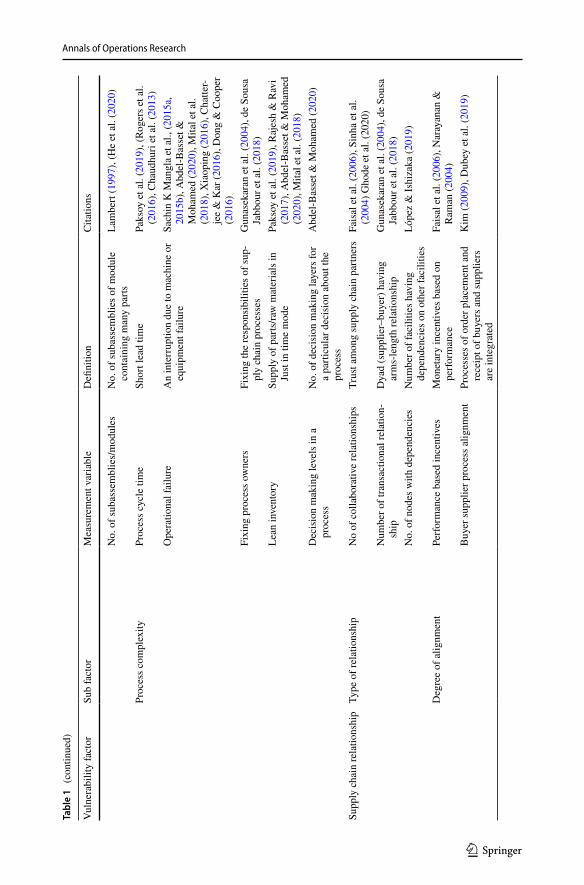
To address the research questions, a mixed research method is used. The detailed steps used in this research are shown below in Fig. 3:
Delphi method is used to get data from a group of experts in sequential manner through structured questionnaires. It’s a very practical method for reaching convergence of opinions (Nowack et al., 2011). In this research, the supply chain vulnerability drivers (SCVD) in manufacturing supply chain have been investigated. For this purpose, manufacturing sup-ply chain in India is selected. To get reliable results generally the researches have suggested that at least ten experts are sufficed (Okoli & Pawlowski, 2004). A total of ten experts were used in this research to get reliable results. All subject matter experts (SME’s) had more than 20 years of experience working in the supply chain domains. The SME’s have expe-rienced different kinds of disruption in their supply chain. To identify the most prominent SCVD, three round Delphi technique was conducted. Experts were asked to confirm the SCV main drivers, sub drivers and sub- sub drivers at three levels in the hierarchy. Experts were asked to add or delete SCV drivers in model presented to them.
Information Management
SC Relationship Complexity
Organizational Complexity
Supply Chain Structure
No. of Nodes
Node Criticality
Product Complexity
Process Complexity
Degree of Alignment
Type of SC Relationship
Control and Alert IT Systems
Information Visibility
Supply Chain Vulnerability
Fig. 2 Proposed supply chain vulnerability driver model
Annals of Operations Research
1 3
)( srevird )DVCS( ytilibarenluv niahc ylppuS no weiver erutaretiL
Making exhaustive list of SCVD
Selection of Internal to supply chain and Controllable SCVD
Develop the hierarchical diagram with the help of experts
Construct the pairwise comparison matrices for all four levels
Get the subject matter expert data on Saaty scale
Evaluate the pairwise comparison matrices to get priority vector
Calculate the global ranking of SCVD
Performing the sensitivity analysis on AHP Results
Reporting results and conclusion
Check CR if it is less than 0.1
Fig. 3 Diagrammatic representation of research methodology

Annals of Operations Research
1 3
In this research, SCV drivers have been represented in hierarchical form and different driv-ers do not have any loops or interaction with other factors. AHP is a roust method in collecting expert’s judgment through pairwise comparison.
After selecting the drivers and sub-drivers, Analytic hierarchy Process (AHP) was used to rank drivers. This method is well suited for the ranking the variables of a given problem. This method is widely acceptable and applicable, using few data items of pair wise comparison matrices (Thomas L Saaty, 2008). AHP is best suited to the scenario due to its inherent capa-bility in analyzing definitive responses provided by the companies and its ability to modular-ize a given problem in terms of criteria and sub-criteria to pinpoint the root cause of a problem (Ishizaka & Labib, 2011; Ishizaka & Lusti, 2006). By analyzing at a granular level and identi-fying which sub-criteria is impacted, a robust solution can be provided. In AHP methodology, decision problem is converted into hierarchical form and goal of the problem is kept at top level (Sarkis et al., 2010). To avoid unbalanced scale problems several researchers gave differ-ent solution like fuzzy AHP (Ilbahar et al., 2018). Application of fuzzy based AHP-TOPSIS to prioritizing solution of reverse logistics barriers was proposed by (Sirisawat & Kiatchar-oenpol, 2018). Interval rough AHP and interval rough MABAC methods for were utilized for evaluating university web pages by (Pamučar et al., 2018). Sharma and Bhat (2014) used AHP method for assessing supply chain risk sources in manufacturing supply chain. López, and Ishizaka (2019) developed a hybrid FCM-AHP approach to predict impacts of offshore outsourcing location decisions on supply chain resilience.
AHP methodology used in this research is explained below.
4.1 Step 1 Define the research objective
The objective of research is to be defined clearly. The research objective was based on research questions outlined through extant literature review. Objective of this research is to study Indian manufacturing supply chain vulnerability.
4.2 Step 2 Develop the hierarchical structure
SCV factors called SCV drivers were identified from SCV/SCRM literature. Identify all suit-able drivers at major level and then sub level through literature review. The created hierarchi-cal structure was shown to experts and was confirmed by experts. Confirmation of experts was done using Delphi method.
4.3 Step 3 Build the pairwise comparison matrices
Pairwise comparison matrices are developed for all levels of drivers. Saaty scale (1 -9) is being used for collecting inputs of experts to complete pairwise comparison matrices. A ques-tionnaire was prepared on pairwise comparison matrices for all variables (SCV drivers) for data collection purpose.
4.4 Step 4 Calculation of the priority weights
In the next step, the Eigen values and eigenvector is calculated for the developed pairwise comparison matrices for SCV drivers and sub drivers. The procedure for calculating Eigen values and eigenvector is explained in Table 3.

Annals of Operations Research
1 3
4.5 Step 5 Checking the consistency ratio
Check of expert input’s consistency is an important step. Consistency is checked to ensure associative and transitivity in compared factors. For consistency ratio, following equation is used to check the consistency of pairwise comparison matrices;
First compute the ƛmax = Average of A*X divided by X; where X is the priority vector and A pairwise comparison matrix.
In second step, compute the Consistency index (CI) = (ƛmax-n) − n / n − 1.In third step, Consistency ratio (CR) is computed.CR = CI/RI; RI is random index computed for different size matrices by random genera-
tion of matrices.
5 Case application
5.1 Data collection and selection of industry and respondents
As a developing country, India’s recent government intervention have attracted foreign direct investment. India is becoming attractive destination for the manufacturing of elec-tronic and automotive components. The current Pandemic Covid 19 affected the supply chains globally and this event created vital need for supply chain vulnerability (SCV) assessment globally. Business continuity has become number one priority for all of the companies. Vulnerability assessment has been attempted by companies in bits and pieces.
In this study, Automotive and Electronic appliances manufacturing industry have been considered due to similar kind of supply chain structure in terms of purchased part com-ponents. Both industries have OEMS and component manufacturers, finished products are delivered through dealer network throughout the India. Firms in these two sectors are global and their contribution to Indian economy is 8% and 10% respectively.
In this research, a supply chain vulnerability assessment (SCVA) framework was pro-posed and for providing a case application of this tool, two types of industries have been selected. Several manufacturing companies have used SCV in different forms of supply chain risk management (Nooraie & Parast, 2015). Companies assess supply chain risk and very few companies use SCV assessment. Use of SCV assessment is still limited in companies and to show the application of SCVA, two different sectors in India have been selected. For implementation of SCVA, two sectors namely Automotive sector, Electric appliance manufacturing were chosen. Selection of these two sectors was based on extent of globalization and complexity in supply chains. These two manufacturing companies are globally dispersing and have global presence in the supply chain. Any global event or dis-aster natural or manmade affects these manufacturing supply chain maximally. Therefore, it is essential to identify drivers of SCV in manufacturing sector.
Delphi based AHP method has certain advantages than AHP based SME interviews on two parameters. In Delphi based AHP method, data collection through iterations enhances the data quality and it stops when data saturation reaches. Another advantage is that, it’s free from biases (Gandhi et al., 2016).
In this research, judgmental sampling was used, wherein selection of case company is not random (Bai et al., 2017; Maalouf & Gammelgaard, 2016). In this research, three large scale companies were selected in each sector respectively. Thus, six large scale

Annals of Operations Research
1 3
companies in two chosen sectors also showed their intense interest in implementation of SCVA tool. Accordingly, twelve senior level mangers agreed for participating in the research study. These twelve managers provided data on decision hierarchy for refining the SCVA tool and then we gathered data on pairwise comparison matrices from these professionals. The above responses provided by the managers are then transformed to crisp scores according to the AHP scale provided by Saaty (1980) for computing weights by AHP.
The selection of the twelve managers for the data collection purpose was based on experience in global supply chain management and selected purposively based on the knowledge of the managers. In brief a two-phase research methodology was used for data collection and analysis. In phase one, first most relevant drivers were identified with help of industrial experts. Experts refined the drivers at three level hierarchi-cal model. This objective was achieved using Delphi study. In Delphi, two iterations were enough to get saturation in data, after second iteration, stability in responses was achieved. In phase 2, ranking of SCV drivers was done using AHP method. Feedback from a group of 12 experts was collected on their views on SCV drivers.
AHP data collection requires substantial time commitment from experts. This research has 13 pairwise comparison matrices, so researchers interacted over phone to explain the method for filling matrices and then visited respondent workplaces. After fixing appointments over phone researchers carried out in depth interviews. Each inter-view with one expert went for 2.5–3 h, as 13 matrices data filling requires one to one interaction to keep motivation of respondent for complete data filling.
The hierarchical model of SCV drivers is presented in Fig. 4. Table 2 below gives the profile of case companies and respondents.
Supply Chain Vulnerability
SC Complexity0.5101
Organizational Complexity0.2863
SC Relationship0.1334
Information Management0.0700
No of Nodes0.1666
Node Criticality0.8333
ProcessComplexity
0.8
ProductComplexity
0.2
Type of Relationship
0.1666
Degree of Alignment
0.8333
InformationVisibility0.8333
Control/EarlyWarning System
0.1666
• Location of Supplier(0.2590)
• Sole Supplier (0.0698)
• Concentrationof Supplier (0.1534)
• Critical PartSupplier(0.5177)
• Process cycle time (0.3202)
• Fixing process Owners(0.5571)
• Decisionmaking levels (0.1226)
• No of CollaborativeRelationships(0.7993)
• No. of TransactionalRelationship (0.1787)
• No. of Nodes withdependencies(0.0818)
• Buyer Supplier PerformanceAlignment(0.2842)
• Buyer Supplier IncentivesAlignment(0.619)
• Buyer Supplier IncentivesAlignment(0.0964)
• Use of ERP, EDI (0.2961)
• Use of GPS, RFID (0.3100)
• Sharing of Inventory data(0.0516)
• Sharing of Demand data(0.3422)
• Use of SC Dashboards(0.2394)
• Early Warning Systems (0.6232)
• Use of Risk Analytics/Management(0.1372)
• No. of Nodes in Supply Chain (0.6393)
• No. of AlternateSuppliers(0.2737)
• TotalDistributionCapacityAvailable(0.0869)
• No. of Parts/Components(0.1226)
• ComponentCommonality(0.5571)
• No of Subassemblies/Modules(0.3202)
Fig. 4 Hierarchical structure of supply chain vulnerability drivers

Annals of Operations Research
1 3
5.2 Application of Delphi based AHP SCVA tool
5.2.1 Phase 1 Identify the most significant drivers of SCV in manufacturing supply chains
In this phase, a list of SCV drivers were chosen from literature review and exhaustive list was prepared. The extensive list of SCV drivers is shown in Table 1. This list was based on different SCV drivers discussed in supply chain risk/vulnerability literature. The level one and two were based on the extant literature review. In level 3 some measurement variables are shown in hierarchical fashion.
The expert feedback was gathered on the all level drivers about their relevance for inclu-sion and exclusion in the hierarchical figure. Different company might have different way to gauge certain parameters. It’s really important to have a set of common measurement system for level 3 SCV drivers. Figure 4 below presents the hierarchical SCVA model after two rounds of iterations.
5.2.2 Phase 2 Evaluating SCV drivers in manufacturing supply chains
In this phase, the final version of drivers was prioritized with AHP tool. The respondent’s feedback on the drivers were used to get the ranking of drivers. The pairwise comparison matrices at three different level were constructed to gather experts’ feedback. The hierar-chical structure consists of four levels: examining the drivers in determining the SCV in manufacturing supply chains in the context of India (Level 1), the four main drivers (Level 2), the eight sub drivers (Level-3) and the measurement variables for SCV- twenty-six driv-ers at the bottom level (Level-4).
Table 2 Profile of case companies and respondents
Name of the manufac-turing sector
Product types Respondents Years of experi-ence
Automotive manufacturingCompany-1 Passenger cars, commercial
vehiclesSupply chain head 20
Company-1 Logistics Manager 25Company-2 Passenger cars Global Procurement head 18Company-2 Passenger cars Supply chain planning manager 22Company-3 Auto component Logistics Manager 25Company-3 Auto component Purchase Head 25Electric appliance manufacturingCompany-1 AC, refrigerators, TV Global procurement head 16Company-1 AC, refrigerators, TV Logistics manager 22Company-2 Air conditioners Production head 18Company-2 Air conditioners Supply chain head 20Company-3 AC, refrigerators, TV Logistics manager 20Company-3 AC, refrigerators, TV Global procurement head 19

Annals of Operations Research
1 3
Applying Saaty’s scale, the pairwise comparison matrix was formed among major drivers and sub-drivers with the assistance of expert’s opinions. First, we constructed a pairwise comparison matrix of major drivers then a pairwise comparison matrix of the sub-drivers was constructed. A total of 13 pair wise comparison matrices were con-structed to get the relative importance of SCV drivers.
After that, we calculated the priority vector for each level drivers using the AHP procedure given by Saaty. The pairwise comparison matrix for the major drivers is pre-sented in Table 3.
The pairwise comparison matrix for level three sub-drivers and the last level opera-tional drivers (measurement variables) was constructed in similar fashion. Priority vec-tor was calculated for each pairwise comparison matrix and CR was found to be less than 0.1 and it was acceptable.
Finally, by multiplying the relative weights of the major drivers with the relative weights of the sub-drivers, the global weight of each sub-driver was calculated. Table 4 shows the ranking of operational drivers which was determined according to the global weights of each sub-driver. Table 4 shows that SC complexity (SCV1) has the high-est weight (0.5101) by presenting the global rankings of selected drivers. This means that SC Complexity (SCV1) is the major driving force to the supply chain vulnerability in Indian manufacturing industries. Consequently, other drivers, such as Organizational Complexity driver (SCV2) is second highest having weight of (0.2863), SC Relation-ship-related drivers (SCV3), were ranked third and Information management was ranked at low weight (0.07). This indicates that decision makers should pay greater attention to SC complexity driver in assessment of SCV in manufacturing supply chains.
5.2.3 Phase 3
Once, we get the priority vector for SCV drivers at level 3 (sub drivers) that relative importance of SCV sub drivers. These sub drivers can be measured in practice by level 4 measures. Level 4 measures are the practical set of measures that can be directly used for quantification of sub drivers. The global ranking depends on the weights of major SCV drivers. It’s would be very insightful to get understanding of SCV operational driv-er’s sensitivity on major SCV drivers.
Lambda Max = 4.258 CI = 0.086; CR = 0.095 < 0.10 Matrix is consistent.
Table 3 Pairwise Comparison matrix for major drivers
SC complexity Focal company complexity
SC relationship Information management
Priority vector
SC complexity 1 3 4 5 0.510Focal company complex-
ity0.33 1 4 4 0.286
SC relationship 0.25 0.25 1 3 0.133Information management 0.20 0.25 0.33 1 0.07

Annals of Operations Research
1 3
Tabl
e 4
Glo
bal r
anki
ng o
f SC
V d
river
s in
man
ufac
turin
g su
pply
cha
ins
Leve
l 1 d
river
s and
rela
tive
wei
ght
Leve
l 2 d
river
s and
rela
tive
wei
ght
Leve
l 3 d
river
s and
rela
tive
wei
ght
Glo
bal w
eigh
tG
loba
l ran
king
SC c
ompl
exity
(0.5
101)
Num
ber o
f nod
es (0
.166
6)N
o. o
f nod
es in
SC
(0.6
393)
0.05
4280
7N
o. o
f alte
rnat
e su
pplie
rs (0
.273
7)0.
0232
3912
Tota
l dist
ribut
ion
capa
city
avai
labl
e (0
.086
9)0.
0073
8219
Nod
e cr
itica
lity
(0.8
333)
Loca
tion
of su
pplie
r (0.
2590
)0.
1100
833
Sole
supp
lier (
0.06
98)
0.02
9676
10C
once
ntra
tion
of su
pplie
r (0.
1534
)0.
0652
116
Crit
ical
par
t sup
plie
r (0.
5177
)0.
2200
31s
tO
rgan
izat
iona
l com
plex
ity (0
.286
3)Pr
oces
s com
plex
ity (0
.8)
Proc
ess c
ycle
tim
e (0
.320
2)0.
0733
354
Fixi
ng p
roce
ss o
wne
rs (0
.557
1)0.
1275
862
Dec
isio
n m
akin
g le
vels
(0.1
226)
0.02
808
11Pr
oduc
t com
plex
ity (0
.2)
No.
of P
arts
/com
pone
nts (
0.12
26)
0.00
7014
21C
ompo
nent
com
mon
ality
(0.5
571)
0.03
1869
8N
o of
suba
ssem
blie
s/ m
odul
es (0
.320
2)0.
0183
1814
SC re
latio
nshi
p (0
.133
4)Ty
pe o
f rel
atio
nshi
p (0
.166
6)N
o of
col
labo
rativ
e re
latio
nshi
ps (0
.799
3)0.
0164
1517
No.
of t
rans
actio
nal r
elat
ions
hip
(0.1
787)
0.00
3969
22N
o. o
f nod
es w
ith d
epen
denc
ies (
0.08
18)
0.00
1816
25D
egre
e of
alig
nmen
t (0.
8333
)B
uyer
supp
lier p
erfo
rman
ce a
lignm
ent (
0.28
42)
0.03
1578
9B
uyer
supp
lier i
ncen
tives
alig
nmen
t (0.
619)
0.06
881
5B
uyer
supp
lier p
roce
ss a
lignm
ent (
0.09
64)
0.01
0712
18In
form
atio
n m
anag
emen
t (0.
0700
)In
form
atio
n vi
sibi
lity
(0.8
333)
Use
of E
RP,
ED
I (0.
2961
)0.
0172
6316
Use
of G
PS, R
FID
(0.3
100)
0.01
8075
15Sh
arin
g of
inve
ntor
y da
ta (0
.051
6)0.
0030
1123
Shar
ing
of d
eman
d da
ta (0
.342
2)0.
0199
5113
Con
trols
/ear
ly w
arni
ng sy
stem
s (0.
1666
)U
se o
f SC
das
hboa
rds (
0.23
94)
0.00
2778
24Ea
rly w
arni
ng sy
stem
s (0.
6232
)0.
0072
2920
Use
of r
isk
anal
ytic
s/m
anag
emen
t (0.
1372
)0.
0015
9326

Annals of Operations Research
1 3
6 Results and discussion
In this section, we discuss the finding in detail. These findings will be helpful for supply chain professionals to get a good sense of their supply chain vulnerability and will provide insights in understanding which factor is playing an increased role in vulnerability. Which factors enhance the exposure to risks, if any unknown happens then how much sensitive is your sup-ply chains to such disruption. Research findings on the ranking of SCV operational drivers show that all operational drivers under the category of SC complexity are in top ten drivers. We note that nodes with the status of critical part suppliers is ranked highest. Critical part suppliers halt the production line and finding the alternative supplier takes time (Norrman & Jansson, 2004). Following Table 4 provides calculation of global ranks for SCV operational drivers kept at the last level 4 in hierarchical diagram.
6.1 Supply chain complexity
These set of sub drivers were ranked first among all the drivers that indicates its significant in SCV. Studies by (Birkie et al., 2017; Bode & Wagner, 2015) also highlighted the SC complex-ity as main driver of SCV and its most difficult to manage. Authors (Manuj & Mentzer, 2008) argued that globalization resulted into complex supply chain in search of efficiency and global markets. Managing complexity is most pressing challenge among industries. The detailed examination of SC complexity sub drivers is Critical Part Supplier (0.5177) ranked 1st and Location of Supplier (0.2590) ranked 3rd. No. of Nodes in SC (0.6393) is also a significant driver and ranked 7th among SCV operational drivers. Action needs to be taken by industrial managers to manage the complexity of their supply chain. Companies are now adopting the strategy of vendor rationalization that reduce the number of vendors that help in reducing the coordination cost (Seth & Rastogi, 2019).
Managing the critical suppliers is vital for supply chain continuity. With information shar-ing and proper alignment of supply chain with critical suppliers reduces disruptions in supply chain. Therefore, managers should take SC complexity as major challenge and should give proper attention.
6.2 Organization complexity
Focal company’s organizational complexity was ranked second of the four major drivers. It’s necessary to realize the contributing factors of organizational complexity and related problems in managing these kinds of factors for better managing the SCV drivers in manufacturing sup-ply chains. The sub to sub drivers (operational drivers) of organizational complexity all con-tribute significantly in SCV except no. of parts/component and no. of modules. Automotive firms and Electrical and Electronics firms have reduced the number of purchased parts parts through component commonality and modularization (Lau et al., 2010; Mikkola & Gassmann, 2003). The most contributing driving factors to organizational complexity is process complex-ity rather than product complexity.

Annals of Operations Research
1 3
6.2.1 Fixing process Owners (0.5571) ranked 2nd, Process cycle time (0.3202) ranked 4th among all the operational drivers
An in-depth investigation reveals good insights into understanding of organizational com-plexity. Previous studies on product-process complexity indicate that risk management implementation is effective by fixing the processes rather than the people (Cveykus & Carter, 2006; Newman et al., 2018). This study helps supply chain managers to have better understanding of product and process complexities and what specific measure is significant contributor in causing the supply chain vulnerability. Delays in decision making decreases probability of taking sound decisions and adopting better alternatives. Competitor might use those better alternatives early that might reduce your recovery rate and market share.
This indicates that to efficiently work on process flows and make the process flows effi-cient. Supply chain managers should develop specialized departments for process flow mapping and improvement. Simultaneously, firms should also look into the product designs so that component commonality is high for most of the product versions. Tasks such as to develop new parts for particular products and activities are required. This is not an easy action as this area requires special investments. Hence, it may be beneficial in improving business performance and product quality. Developing specialized research departments can help achieve long-term economic benefits.
6.3 SC relationship
Managing SC relationships can be a hurdle for manufacturing companies due to the non-alignment of performance and incentives among SC members. SC relationship stood third among the four major drivers. The most contributing operational drivers under the SC rela-tionship are alignment of performance and incentives among SC members. SC relation-ship is soft aspect of SCV and many times managers ignore this aspect. The type of SC relationship is not significant, none of operational driver is in top ten. Companies choose transactional or collaborative relationship depending on the nature of business, so this sub driver dies not play vital role in SCV. Orders of measures were Buyer Supplier Incentives Alignment (0.619) ranked 5th and Buyer Supplier Performance Alignment (0.2842) ranked 9th. All other operational drivers were not in top list. The most pressing issue that exposes the firms to SC risks and also diminishes the firm’s capability in responding to SC disrup-tions is non alignment of incentives in supply chain. Companies having right set of SC alignment in terms of performance and incentives ensures early handling of issues (Kutsch & Hall, 2010).
To handle SC alignment related issues, manufacturers should develop certain strategies. This finding is corroborated with the study of (Simatupang & Sridharan, 2002). There-fore, a proper consideration is essential for the supply chain managers. Manufacturers and supply chain managers can understand the drivers and their impact with the help of this research, so that they can skillfully formulate the suitable policies necessary for analyzing and reducing the SCV in their manufacturing supply chains.
6.4 Information management
Information management (IM) is least weighted among four SCV drivers. The order of operational drivers under Information management is as follows: Sharing of Demand data (0.3422) ranked 13th, Use of GPS, RFID (0.3100) ranked 15th, Use of ERP, EDI
Annals of Operations Research
1 3
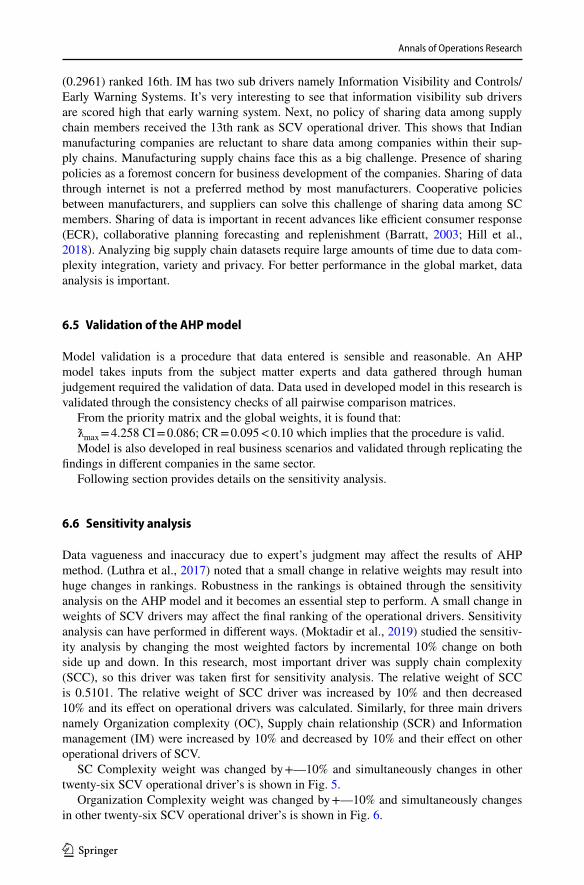
(0.2961) ranked 16th. IM has two sub drivers namely Information Visibility and Controls/Early Warning Systems. It’s very interesting to see that information visibility sub drivers are scored high that early warning system. Next, no policy of sharing data among supply chain members received the 13th rank as SCV operational driver. This shows that Indian manufacturing companies are reluctant to share data among companies within their sup-ply chains. Manufacturing supply chains face this as a big challenge. Presence of sharing policies as a foremost concern for business development of the companies. Sharing of data through internet is not a preferred method by most manufacturers. Cooperative policies between manufacturers, and suppliers can solve this challenge of sharing data among SC members. Sharing of data is important in recent advances like efficient consumer response (ECR), collaborative planning forecasting and replenishment (Barratt, 2003; Hill et al., 2018). Analyzing big supply chain datasets require large amounts of time due to data com-plexity integration, variety and privacy. For better performance in the global market, data analysis is important.
6.5 Validation of the AHP model
Model validation is a procedure that data entered is sensible and reasonable. An AHP model takes inputs from the subject matter experts and data gathered through human judgement required the validation of data. Data used in developed model in this research is validated through the consistency checks of all pairwise comparison matrices.
From the priority matrix and the global weights, it is found that:ƛmax = 4.258 CI = 0.086; CR = 0.095 < 0.10 which implies that the procedure is valid.Model is also developed in real business scenarios and validated through replicating the
findings in different companies in the same sector.Following section provides details on the sensitivity analysis.
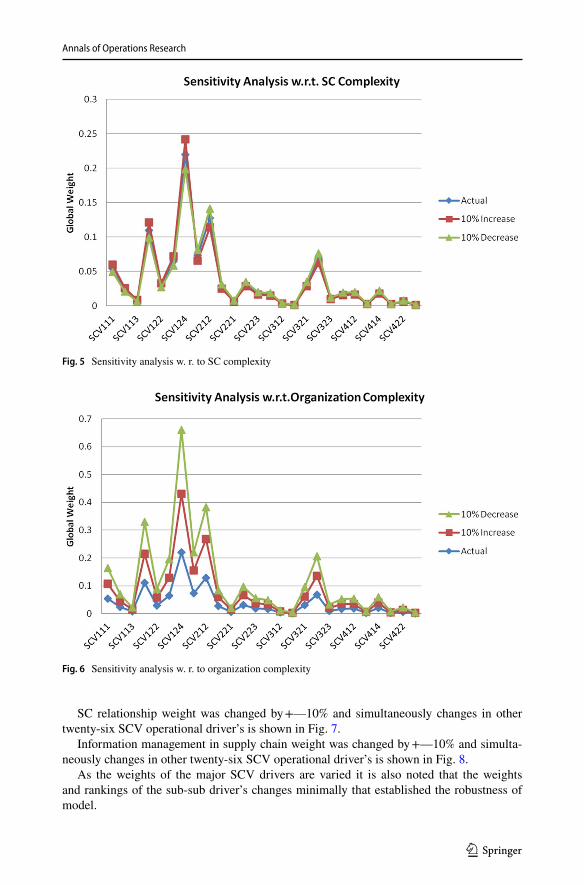
6.6 Sensitivity analysis
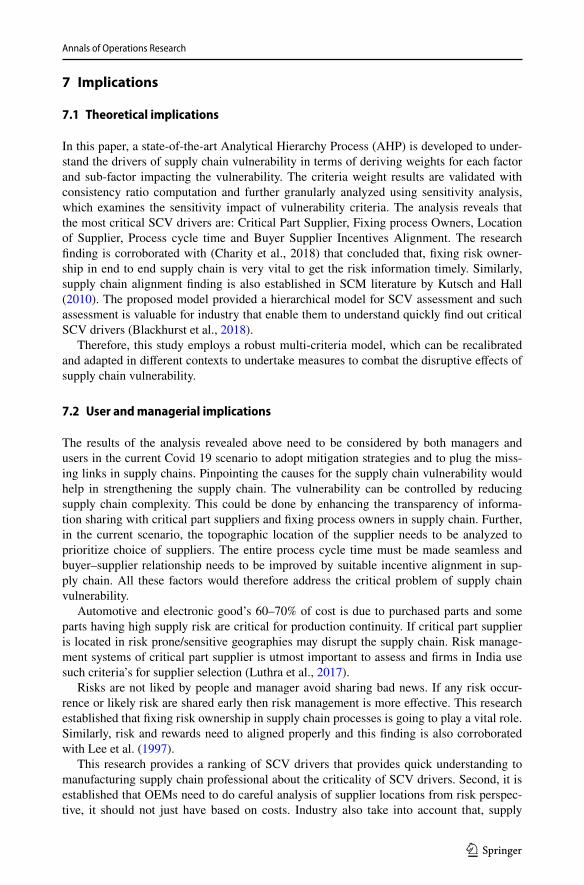
Data vagueness and inaccuracy due to expert’s judgment may affect the results of AHP method. (Luthra et al., 2017) noted that a small change in relative weights may result into huge changes in rankings. Robustness in the rankings is obtained through the sensitivity analysis on the AHP model and it becomes an essential step to perform. A small change in weights of SCV drivers may affect the final ranking of the operational drivers. Sensitivity analysis can have performed in different ways. (Moktadir et al., 2019) studied the sensitiv-ity analysis by changing the most weighted factors by incremental 10% change on both side up and down. In this research, most important driver was supply chain complexity (SCC), so this driver was taken first for sensitivity analysis. The relative weight of SCC is 0.5101. The relative weight of SCC driver was increased by 10% and then decreased 10% and its effect on operational drivers was calculated. Similarly, for three main drivers namely Organization complexity (OC), Supply chain relationship (SCR) and Information management (IM) were increased by 10% and decreased by 10% and their effect on other operational drivers of SCV.
SC Complexity weight was changed by +—10% and simultaneously changes in other twenty-six SCV operational driver’s is shown in Fig. 5.
Organization Complexity weight was changed by +—10% and simultaneously changes in other twenty-six SCV operational driver’s is shown in Fig. 6.
Annals of Operations Research
1 3
SC relationship weight was changed by +—10% and simultaneously changes in other twenty-six SCV operational driver’s is shown in Fig. 7.
Information management in supply chain weight was changed by +—10% and simulta-neously changes in other twenty-six SCV operational driver’s is shown in Fig. 8.
As the weights of the major SCV drivers are varied it is also noted that the weights and rankings of the sub-sub driver’s changes minimally that established the robustness of model.
Fig. 5 Sensitivity analysis w. r. to SC complexity
Fig. 6 Sensitivity analysis w. r. to organization complexity

Annals of Operations Research
1 3
We can conclude that SC complexity SCV drivers have high significance among the listed drivers from the sensitivity analysis. Supply chain managers in manufacturing supply chains should therefore warrant greater attention to this topic. Decision makers can make planned and strategic decisions regarding the supply chain risk management in manufacturing supply chains more smoothly through this.
Fig. 7 Sensitivity analysis w. r. to SC relationship
Fig. 8 Sensitivity analysis w. r. to information management
Annals of Operations Research
1 3
7 Implications
7.1 Theoretical implications
In this paper, a state-of-the-art Analytical Hierarchy Process (AHP) is developed to under-stand the drivers of supply chain vulnerability in terms of deriving weights for each factor and sub-factor impacting the vulnerability. The criteria weight results are validated with consistency ratio computation and further granularly analyzed using sensitivity analysis, which examines the sensitivity impact of vulnerability criteria. The analysis reveals that the most critical SCV drivers are: Critical Part Supplier, Fixing process Owners, Location of Supplier, Process cycle time and Buyer Supplier Incentives Alignment. The research finding is corroborated with (Charity et al., 2018) that concluded that, fixing risk owner-ship in end to end supply chain is very vital to get the risk information timely. Similarly, supply chain alignment finding is also established in SCM literature by Kutsch and Hall (2010). The proposed model provided a hierarchical model for SCV assessment and such assessment is valuable for industry that enable them to understand quickly find out critical SCV drivers (Blackhurst et al., 2018).
Therefore, this study employs a robust multi-criteria model, which can be recalibrated and adapted in different contexts to undertake measures to combat the disruptive effects of supply chain vulnerability.
7.2 User and managerial implications
The results of the analysis revealed above need to be considered by both managers and users in the current Covid 19 scenario to adopt mitigation strategies and to plug the miss-ing links in supply chains. Pinpointing the causes for the supply chain vulnerability would help in strengthening the supply chain. The vulnerability can be controlled by reducing supply chain complexity. This could be done by enhancing the transparency of informa-tion sharing with critical part suppliers and fixing process owners in supply chain. Further, in the current scenario, the topographic location of the supplier needs to be analyzed to prioritize choice of suppliers. The entire process cycle time must be made seamless and buyer–supplier relationship needs to be improved by suitable incentive alignment in sup-ply chain. All these factors would therefore address the critical problem of supply chain vulnerability.
Automotive and electronic good’s 60–70% of cost is due to purchased parts and some parts having high supply risk are critical for production continuity. If critical part supplier is located in risk prone/sensitive geographies may disrupt the supply chain. Risk manage-ment systems of critical part supplier is utmost important to assess and firms in India use such criteria’s for supplier selection (Luthra et al., 2017).
Risks are not liked by people and manager avoid sharing bad news. If any risk occur-rence or likely risk are shared early then risk management is more effective. This research established that fixing risk ownership in supply chain processes is going to play a vital role. Similarly, risk and rewards need to aligned properly and this finding is also corroborated with Lee et al. (1997).
This research provides a ranking of SCV drivers that provides quick understanding to manufacturing supply chain professional about the criticality of SCV drivers. Second, it is established that OEMs need to do careful analysis of supplier locations from risk perspec-tive, it should not just have based on costs. Industry also take into account that, supply

Annals of Operations Research
1 3
chain practices that ensure information visibility and having risk alignment of risk and rewards in supply chain should be implemented.
8 Conclusion and Future scope of research
Supply chains have become more vulnerable to risks during the past few years. Under-standing the level of vulnerability of supply chains has become imperative for supply chain managers in highly uncertain times, wherein Covid 19 further exemplified this situation. Manufacturers in developing countries are starting to rethink their supply chain designs from vulnerability perspective. Therefore, this research contributes to SCV literature by assessing the SCV factors (SCV drivers). This research found four major categories and twenty-six operational drivers, these drivers can be measured and actions can be taken by managers to reduce the negative effects of disruptions. Supply chain complexity found to be most important factor scoring with weight of 0.5101. The findings revealed that the most critical SCV operational drivers are: Critical Part Supplier (0.22003), Fixing Process Owners (0.127586), Location of Supplier (0.110083), Process Cycle Time (0.073335) and Buyer Supplier Incentives Alignment (0.06881). Understanding of the supply chain vulner-ability drivers through hierarchical manner provides the operational drivers at the lowest level that helps managers to take the actionable insights. A systematic literature review and framework for SCV driver’s assessment and drivers ranking is provided in this paper. The four types of supply chain pressure points (SCV drivers) which are responsible for increase in supply chain vulnerability are presented in this paper. Further, a sensitivity analysis was conducted, which confirmed the stability of ranking. The developed framework provides conceptual foundation with the ranking of SCV drivers on which empirical data can be col-lected and supply chain vulnerability exposure with empirical data can be analyzed.
Survey in different industries or across globe can be done with this proposed supply chain vulnerability framework and it would also provide interesting insights to supply chain managers and draw attention that needs immediate attention. Further different sub drivers and operational drivers can be related to each other, the interdependencies can be modelled using analytics network process. Also, examining the interactions among driv-ers using the grey based decision making trial and evaluation laboratory (DEMATEL) and interpretive structural modeling (ISM). To capture vagueness of data collection through experts, extended techniques like Fuzzy AHP, AHP integrated PROMETHEE and VIKOR method can be used for criticality assessment. This research may help companies in decid-ing supply chain risk mitigation strategies and this SCV evaluation would lead to better assessment and decision on robust/resilient supply chain.
References
Abdel-Basset, M., & Mohamed, R. (2020). A novel plithogenic TOPSIS-CRITIC model for sustainable sup-ply chain risk management. Journal of Cleaner Production, 247, 119586.
Aelker, J., Bauernhansl, T., & Ehm, H. (2013). Managing complexity in supply chains: A discussion of cur-rent approaches on the example of the semiconductor industry. Procedia CIRP, 7, 79–84.
Agrawal, N., & Pingle, S. (2020). Mitigate supply chain vulnerability to build supply chain resilience using organisational analytical capability: A theoretical framework. International Journal of Logistics Eco-nomics and Globalisation, 8(3), 272–284.
Anderson, J. C., & Narus, J. A. (1990). A model of distributor firm and manufacturer firm working partner-ships. Journal of Marketing, 54(1), 42–58.

Annals of Operations Research
1 3
Bai, C., Kusi-Sarpong, S., & Sarkis, J. (2017). An implementation path for green information technology systems in the Ghanaian mining industry. Journal of Cleaner Production, 164, 1105–1123.
Barratt, M. (2003). Positioning the role of collaborative planning in grocery supply chains. The Interna-tional Journal of Logistics Management, 14(2), 53–66.
Biggs, D., Biggs, R., Dakos, V., Scholes, R. J., & Schoon, M. (2011). Are we entering an era of concat-enated global crises? Ecology and Society, 16(2).
Birkie, S. E., Trucco, P., & Campos, P. F. (2017). Effectiveness of resilience capabilities in mitigat-ing disruptions: Leveraging on supply chain structural complexity. Supply Chain Management: An International Journal.
Blackhurst, J., Rungtusanatham, M. J., Scheibe, K., & Ambulkar, S. (2018). Supply chain vulnerability assessment: A network based visualization and clustering analysis approach. Journal of Purchas-ing and Supply Management, 24(1), 21–30.
Bode, C., & Wagner, S. M. (2015). Structural drivers of upstream supply chain complexity and the fre-quency of supply chain disruptions. Journal of Operations Management, 36, 215–228.
Bogataj, D., & Bogataj, M. (2007). Measuring the supply chain risk and vulnerability in frequency space. International Journal of Production Economics, 108(1–2), 291–301.
Caridi, M., Crippa, L., Perego, A., Sianesi, A., & Tumino, A. (2010). Do virtuality and complexity affect supply chain visibility? International Journal of Production Economics, 127(2), 372–383.
Chand, P., Thakkar, J. J., & Ghosh, K. K. (2020). Analysis of supply chain sustainability with supply chain complexity, inter-relationship study using delphi and interpretive structural modeling for Indian mining and earthmoving machinery industry. Resources Policy, 68, 101726.
Chapman, P., Christopher, M., Jüttner, U., Peck, H., & Wilding, R. (2002). Identifying and managing supply chain vulnerability. Logistics & Transport Focus, 4(4), 59–70.
Chatterjee, K., & Kar, S. (2016). Multi-criteria analysis of supply chain risk management using interval valued fuzzy TOPSIS. Opsearch, 53(3), 474–499.
Chaudhuri, A., Mohanty, B. K., & Singh, K. N. (2013). Supply chain risk assessment during new prod-uct development: A group decision making approach using numeric and linguistic data. Interna-tional Journal of Production Research, 51(10), 2790–2804.
Chiu, C.-H., & Choi, T.-M. (2016). Supply chain risk analysis with mean-variance models: A technical review. Annals of Operations Research, 240(2), 489–507.
Choi, T.-M., Govindan, K., Li, X., & Li, Y. (2017). Innovative supply chain optimization models with multiple uncertainty factors. Annals of Operations Research, 257(1), 1–14.
Choi, T. Y., & Krause, D. R. (2006). The supply base and its complexity: Implications for transaction costs, risks, responsiveness, and innovation. Journal of Operations Management, 24(5), 637–652.
Choudhary, A., Sarkar, S., Settur, S., & Tiwari, M. K. (2015). A carbon market sensitive optimization model for integrated forward–reverse logistics. International Journal of Production Economics, 164, 433–444. https:// doi. org/ 10. 1016/j. ijpe. 2014. 08. 015
Christopher, M., & Lee, H. (2004). Mitigating supply chain risk through improved confidence. Interna-tional Journal of Physical Distribution & Logistics Management.
Clark, K. B., & Fujimoto, T. (1991). Heavyweight product managers. McKinsey Quarterly, 1, 42–60.Cveykus, R., & Carter, E. (2006). Fix the process, not the people. Strategic Finance, 88(1), 26.de Sousa Jabbour, A. B. L., Jabbour, C. J. C., Godinho Filho, M., & Roubaud, D. (2018). Industry 4.0
and the circular economy: a proposed research agenda and original roadmap for sustainable opera-tions. Annals of Operations Research, 270(1), 273–286.
Dong, Q., & Cooper, O. (2016). An orders-of-magnitude AHP supply chain risk assessment framework. International Journal of Production Economics, 182, 144–156.
Dubey, R., Altay, N., & Blome, C. (2019). Swift trust and commitment: The missing links for humani-tarian supply chain coordination? Annals of Operations Research, 283(1), 159–177.
DuHadway, S., Carnovale, S., & Hazen, B. (2019). Understanding risk management for intentional sup-ply chain disruptions: Risk detection, risk mitigation, and risk recovery. Annals of Operations Research, 283(1), 179–198.
El Baz, J., & Ruel, S. (2020). Can supply chain risk management practices mitigate the disruption impacts on supply chains’ resilience and robustness? Evidence from an empirical survey in a COVID-19 outbreak era. International Journal of Production Economics, 107972.
Elluru, S., Gupta, H., Kaur, H., & Singh, S. P. (2019). Proactive and reactive models for disaster resilient supply chain. Annals of Operations Research, 283(1), 199–224.
Faisal, M. N., Banwet, D. K., & Shankar, R. (2006). Supply chain risk mitigation: modeling the enablers. Business Process Management Journal.

Annals of Operations Research
1 3
Fawcett, S. E., & Waller, M. A. (2014a). Supply chain game changers—mega, nano, and virtual trends—and forces that impede supply chain design (ie, building a winning team). Journal of Business Logistics, 35(3), 157–164.
Fawcett, S. E., & Waller, M. A. (2014b). Supply chain game changers—mega, nano, and virtual trends—and forces that impede supply chain design (ie, building a winning team). Wiley Online Library.
Fisher, M. L. (1997). What is the right supply chain for your product? Harvard Business Review, 75, 105–117.
Froggatt, D. (2017). Motor components: locational issues in an international industry. In Restructuring the global automobile industry (pp. 156–168): Routledge.
Gandhi, S., Mangla, S. K., Kumar, P., & Kumar, D. (2016). A combined approach using AHP and DEMA-TEL for evaluating success factors in implementation of green supply chain management in Indian manufacturing industries. International Journal of Logistics Research and Applications, 19(6), 537–561.
Giunipero, L. C., & Eltantawy, R. A. (2004). Securing the upstream supply chain: a risk management approach. International Journal of Physical Distribution & Logistics Management.
Grosse-Ruyken, P. T., Zaremba, B., & Wagner, S. M. (2012). Assessing key drivers of supply chain vulner-ability. Logistics Quarterly, 17(3), 2–7.
Gunasekaran, A., Patel, C., & McGaughey, R. E. (2004). A framework for supply chain performance meas-urement. International Journal of Production Economics, 87(3), 333–347.
Hallikas, J., Puumalainen, K., Vesterinen, T., & Virolainen, V.-M. (2005). Risk-based classification of sup-plier relationships. Journal of Purchasing and Supply Management, 11(2–3), 72–82.
He, J., Chu, F., Zheng, F., & Liu, M. (2020). A green-oriented bi-objective disassembly line balancing prob-lem with stochastic task processing times. Annals of Operations Research, 1–23.
Hill, C. A., Zhang, G. P., & Miller, K. E. (2018). Collaborative planning, forecasting, and replenishment & firm performance: An empirical evaluation. International Journal of Production Economics, 196, 12–23.
Ilbahar, E., Karaşan, A., Cebi, S., & Kahraman, C. (2018). A novel approach to risk assessment for occupa-tional health and safety using Pythagorean fuzzy AHP & fuzzy inference system. Safety Science, 103, 124–136.
Inman, R. R., & Blumenfeld, D. E. (2014). Product complexity and supply chain design. International Jour-nal of Production Research, 52(7), 1956–1969.
Ishizaka, A., & Labib, A. (2011). Review of the main developments in the analytic hierarchy process. Expert Systems with Applications, 38(11), 14336–14345.
Ishizaka, A., & Lusti, M. (2006). How to derive priorities in AHP: A comparative study. Central European Journal of Operations Research, 14(4), 387–400.
Ivanov, D., & Sokolov, B. (2019). Simultaneous structural–operational control of supply chain dynamics and resilience. Annals of Operations Research, 283(1), 1191–1210.
Jain, V., Kumar, S., Soni, U., & Chandra, C. (2017). Supply chain resilience: Model development and empirical analysis. International Journal of Production Research, 55(22), 6779–6800.
Jüttner, U., Peck, H., & Christopher, M. (2003). Supply chain risk management: Outlining an agenda for future research. International Journal of Logistics: Research and Applications, 6(4), 197–210.
Ketchen, D. J., Jr., & Hult, G. T. M. (2007). Bridging organization theory and supply chain management: The case of best value supply chains. Journal of Operations Management, 25(2), 573–580.
Kim, S. W. (2009). An investigation on the direct and indirect effect of supply chain integration on firm per-formance. International Journal of Production Economics, 119(2), 328–346.
Kutsch, E., & Hall, M. (2010). Deliberate ignorance in project risk management. International Journal of Project Management, 28(3), 245–255.
Lambert, A. (1997). Optimal disassembly of complex products. International Journal of Production Research, 35(9), 2509–2524.
Latour, A. (2001). Trial by fire: A blaze in Albuquerque sets off major crisis for cell-phone giants. Wall Street Journal, 1(29), 2001.
Lau, A. K., Yam, R., & Tang, E. P. (2010). Supply chain integration and product modularity: An empirical study of product performance for selected Hong Kong manufacturing industries. International Jour-nal of Operations & Production Management, 30(1), 20–56.
Lee, H. L., Padmanabhan, V., & Whang, S. (1997). Information distortion in a supply chain: The bullwhip effect. Management Science, 43(4), 546–558.
Lee, H. L., Padmanabhan, V., & Whang, S. (2004). Information distortion in a supply chain: the bullwhip effect. Management Science, 50(12), 1875–1886.
Levi, D. S., Kaminsky, P., & Levi, E. S. (2000). Designing and managing the supply chain. McGraw-Hill.

Annals of Operations Research
1 3
Liao, Y., Hong, P., & Rao, S. S. (2010). Supply management, supply flexibility and performance outcomes: An empirical investigation of manufacturing firms. Journal of Supply Chain Management, 46(3), 6–22.
López, C., & Ishizaka, A. (2019). A hybrid FCM-AHP approach to predict impacts of offshore outsourcing location decisions on supply chain resilience. Journal of Business Research, 103, 495–507.
Luthra, S., Govindan, K., Kannan, D., Mangla, S. K., & Garg, C. P. (2017). An integrated framework for sustainable supplier selection and evaluation in supply chains. Journal of Cleaner Production, 140, 1686–1698.
Maalouf, M., & Gammelgaard, B. (2016). Managing paradoxical tensions during the implementation of lean capabilities for improvement. International Journal of Operations & Production Management.
Majumdar, A., Sinha, S. K., Shaw, M., & Mathiyazhagan, K. (2020). Analysing the vulnerability of green clothing supply chains in South and Southeast Asia using fuzzy analytic hierarchy process. Interna-tional Journal of Production Research, 1–20.
Mangla, S. K., Kumar, P., & Barua, M. K. (2015a). Flexible decision modeling for evaluating the risks in green supply chain using fuzzy AHP and IRP methodologies. Global Journal of Flexible Systems Management, 16(1), 19–35.
Mangla, S. K., Kumar, P., & Barua, M. K. (2015b). Risk analysis in green supply chain using fuzzy AHP approach: A case study. Resources, Conservation and Recycling, 104, 375–390.
Manuj, I., & Mentzer, J. T. (2008). Global supply chain risk management strategies. International Journal of Physical Distribution & Logistics Management.
Manuj, I., & Sahin, F. (2011). A model of supply chain and supply chain decision‐making complexity. Inter-national journal of Physical Distribution & Logistics Management.
Marvin, H. J., van Asselt, E., Kleter, G., Meijer, N., Lorentzen, G., Johansen, L.-H., et al. (2020). Expert driven methodology to assess and predict the effects of drivers of change on vulnerabilities in a food supply chain: Aquaculture of Atlantic salmon in Norway as a showcase. Trends in Food Science & Technology.
Mikkola, J. H., & Gassmann, O. (2003). Managing modularity of product architectures: Toward an inte-grated theory. IEEE Transactions on Engineering Management, 50(2), 204–218.
Mital, M., Del Giudice, M., & Papa, A. (2018). Comparing supply chain risks for multiple product catego-ries with cognitive mapping and analytic hierarchy process. Technological Forecasting and Social Change, 131, 159–170.
Moktadir, M. A., Ali, S. M., Paul, S. K., & Shukla, N. (2019). Barriers to big data analytics in manufactur-ing supply chains: A case study from Bangladesh. Computers & Industrial Engineering, 128, 1063–1075. https:// doi. org/ 10. 1016/j. cie. 2018. 04. 013
Mudambi, R., & Venzin, M. (2010). The strategic nexus of offshoring and outsourcing decisions. Journal of Management Studies, 47(8), 1510–1533.
Narayanan, V., & Raman, A. (2004). Aligning incentives in supply chains. Harvard Business Review, 82(11), 94–103.
Newman, W., Charity, M., Faith, S., & Ongayi, W. (2018). Literature review on the effectiveness of risk management systems on financial performance in a public setting. Academy of Strategic Management Journal, 17(4), 1–12.
Nooraie, S. V., & Parast, M. M. (2015). A multi-objective approach to supply chain risk management: Inte-grating visibility with supply and demand risk. International Journal of Production Economics, 161, 192–200.
Norrman, A., & Jansson, U. (2004). Ericsson’s proactive supply chain risk management approach after a serious sub‐supplier accident. International Journal of Physical Distribution & Logistics Management.
Nowack, M., Endrikat, J., & Guenther, E. (2011). Review of Delphi-based scenario studies: Quality and design considerations. Technological Forecasting and Social Change, 78(9), 1603–1615.
Nyaga, G. N., Whipple, J. M., & Lynch, D. F. (2010). Examining supply chain relationships: Do buyer and supplier perspectives on collaborative relationships differ? Journal of Operations Management, 28(2), 101–114.
Ojha, R., Ghadge, A., Tiwari, M. K., & Bititci, U. S. (2018). Bayesian network modelling for supply chain risk propagation. International Journal of Production Research, 56(17), 5795–5819.
Okoli, C., & Pawlowski, S. D. (2004). The Delphi method as a research tool: An example, design considera-tions and applications. Information & Management, 42(1), 15–29.
Paksoy, T., Çalik, A., Yildizbaşi, A., & Huber, S. (2019). Risk management in lean & green supply chain: A novel fuzzy linguistic risk assessment approach. In Lean and green supply chain management (pp. 75–100): Springer.

Annals of Operations Research
1 3
Pamučar, D., Stević, Ž, & Zavadskas, E. K. (2018). Integration of interval rough AHP and interval rough MABAC methods for evaluating university web pages. Applied Soft Computing, 67, 141–163.
Peck, H. (2006). Reconciling supply chain vulnerability, risk and supply chain management. Interna-tional Journal of Logistics: Research and Applications, 9(2), 127–142.
Peck, H. (2010). Supply chain vulnerability, risk and resilience. Global Logistics: New Directions in Supply Chain Management, 192–207.
Petersen, K. J., Ragatz, G. L., & Monczka, R. M. (2005). An examination of collaborative planning effectiveness and supply chain performance. Journal of Supply Chain Management, 41(2), 14–25.
Rajesh, R., & Ravi, V. (2017). Analyzing drivers of risks in electronic supply chains: A grey–DEM-ATEL approach. The International Journal of Advanced Manufacturing Technology, 92(1–4), 1127–1145.
Rao, S., & Goldsby, T. J. (2009). Supply chain risks: a review and typology. The International Journal of Logistics Management.
Rogers, H., Srivastava, M., Pawar, K. S., & Shah, J. (2016). Supply chain risk management in India – practical insights. [doi: https:// doi. org/ 10. 1080/ 13675 567. 2015. 10754 76]. International Journal of Logistics Research and Applications, 19(4), 278–299, doi:https:// doi. org/ 10. 1080/ 13675 567. 2015. 10754 76.
Saaty, T. L. (1980). The analytic hierarchy process: Planning, priority setting, resource allocation. McGraw Hill.
Saaty, T. L. (2008). Decision making with the analytic hierarchy process. International Journal of Ser-vices Sciences, 1(1), 83–98.
Sarkis, J., Sarmiento, R., & Thomas, A. (2010). Identifying improvement areas when implementing green initiatives using a multitier AHP approach. Benchmarking: An International Journal.
Seiler, A., Papanagnou, C., & Scarf, P. (2020). On the relationship between financial performance and position of businesses in supply chain networks. International Journal of Production Economics, 227, 107690.
Serdarasan, S. (2013). A review of supply chain complexity drivers. Computers & Industrial Engineer-ing, 66(3), 533–540.
Seth, D., & Rastogi, S. (2019). Application of vendor rationalization strategy for manufacturing cycle time reduction in engineer to order (ETO) environment. Journal of Manufacturing Technology Management.
Sharma, S. K., & Bhat, A. (2014). Supply chain risk management dimensions in Indian automobile industry: A cluster analysis approach. Benchmarking: An International Journal.
Sheffi, Y., & Rice, J. B., Jr. (2005). A supply chain view of the resilient enterprise. MIT Sloan Manage-ment Review, 47(1), 41.
Simatupang, T. M., & Sridharan, R. (2002). The collaborative supply chain. The International Journal of Logistics Management, 13(1), 15–30.
Sinha, P. R., Whitman, L. E., & Malzahn, D. (2004). Methodology to mitigate supplier risk in an aero-space supply chain. Supply Chain Management: An International Journal.
Sirisawat, P., & Kiatcharoenpol, T. (2018). Fuzzy AHP-TOPSIS approaches to prioritizing solutions for reverse logistics barriers. Computers & Industrial Engineering, 117, 303–318.
Svensson, G. (2004). Key areas, causes and contingency planning of corporate vulnerability in supply chains. International journal of physical distribution & logistics management.
Tan, K. C., Lyman, S. B., & Wisner, J. D. (2002). Supply chain management: a strategic perspective. International Journal of Operations & Production Management.
Tang, C. S. (2006). Perspectives in supply chain risk management. International Journal of Production Economics, 103(2), 451–488.
Touboulic, A., Chicksand, D., & Walker, H. (2014). Managing imbalanced supply chain relationships for sustainability: A power perspective. Decision Sciences, 45(4), 577–619.
Trkman, P., & McCormack, K. (2009). Supply chain risk in turbulent environments—A conceptual model for managing supply chain network risk. International Journal of Production Economics, 119(2), 247–258.
van Donk, D. P., van der Vaart, T., Ambrose, E., Marshall, D., & Lynch, D. (2010). Buyer supplier perspec-tives on supply chain relationships. International Journal of Operations & Production Management.
Vilko, J. P., & Hallikas, J. M. (2012). Risk assessment in multimodal supply chains. International Jour-nal of Production Economics, 140(2), 586–595.
Vlajic, J. V., Van der Vorst, J. G., & Haijema, R. (2012). A framework for designing robust food supply chains. International Journal of Production Economics, 137(1), 176–189.
Wagner, S. M., & Bode, C. (2006). An empirical investigation into supply chain vulnerability. Journal of Purchasing and Supply Management, 12(6), 301–312.

Annals of Operations Research
1 3
Wagner, S. M., & Neshat, N. (2010). Assessing the vulnerability of supply chains using graph theory. Inter-national Journal of Production Economics, 126(1), 121–129.
Wang, H., Gu, T., Jin, M., Zhao, R., & Wang, G. (2018). The complexity measurement and evolution analy-sis of supply chain network under disruption risks. Chaos, Solitons & Fractals, 116, 72–78.
White, A., Daniel, E. M., & Mohdzain, M. (2005). The role of emergent information technologies and systems in enabling supply chain agility. International Journal of Information Management, 25(5), 396–410.
Wilding, R., Wagner, B., Colicchia, C., & Strozzi, F. (2012). Supply chain risk management: a new method-ology for a systematic literature review. Supply Chain Management: An International Journal.
Wolters, H., & Schuller, F. (1997). Explaining supplier-buyer partnerships: A dynamic game theory approach. European Journal of Purchasing & Supply Management, 3(3), 155–164.
Xiaoping, W. (2016). Food supply chain safety risk evaluation based on AHP fuzzy integrated evaluation method. International Journal Security Application, 10, 233–244.
Yuvaraj, S., & Sangeetha, M. Smart supply chain management using internet of things (IoT) and low power wireless communication systems. In 2016 international conference on wireless communications, sig-nal processing and networking (WiSPNET), 2016 (pp. 555–558): IEEE
Zeng, B., & Yen, B.P.-C. (2017). Rethinking the role of partnerships in global supply chains: A risk-based perspective. International Journal of Production Economics, 185, 52–62.
Publisher’s Note Springer Nature remains neutral with regard to jurisdictional claims in published maps and institutional affiliations.