supply chain resilience 2011 - cips summary/bci... · supply chain resilience 2011. copyright ©...
TRANSCRIPT

Supply Chain Resilience 2011. Copyright © 2011 The Business Continuity Institute. Al Rights Reserved. 1
Sponsored by: Supported by:
Supply Chain Resilience 2011Supply Chain Resilience 2011Supply Chain Resilience 2011
3rd Annual Survey
Published November 2011
An international survey of more than 550 organizations from over 60 countries, which
considers the causes and consequences of disruption, the techniques and approaches
to identify key supply chains, and methods to gain assurance of resilience capability

Supply Chain Resilience 2011. Copyright © 2011 The Business Continuity Institute. Al Rights Reserved. 2
Contents
03 Executive summary
04 Introduction
05 Part 1: Sources and levels of disruption with their short and longer term consequences
14 Part 2: Identifying and assuring key supply chains
23 Part 3: Winning business with Business Continuity Management
26 Conclusions & recommendations
27 Respondent profiles
30 About the survey, the BCI, CIPS and the report’s sponsors

Supply Chain Resilience 2011. Copyright © 2011 The Business Continuity Institute. Al Rights Reserved. 3
Introduction
This survey is the third in a series, starting in
2009, that set out to consider the challenge of
developing resilient supply chains.
The survey in 2011 considers the sources and
consequences of disruption along with their
origins within the supply chain system.
It majors on the methods used to understand
supply chain vulnerability and measures taken
to ensure continuity.
Key Findings
85% of survey respondents experienced at
least one disruption.
40% of analysed disruptions originated
below the immediate tier one supplier.
Adverse weather was the main cause of
disruption at 51%, with unplanned IT and
telecommunication outages in second
place at 41%. Sources of disruption can,
however, vary significantly by sector and
geography.
Cyber attack rose to become a top three
source of disruption in the Financial
Services sector.
Supply chain incidents led to a loss of
productivity for almost half of businesses
along with increased cost of working (38%)
and loss of revenue (32%).
The longer term consequences of
disruption in the supply chain included
shareholder concern (19%), damage to
reputation (17%), and expected increases
in regulatory scrutiny (11%).
The earthquakes and tsunami experienced
in Japan and New Zealand this year,
affected 20% of responding organizations,
headquartered in 18 different countries
and across 12 different industry sectors.
For 17% of respondents the financial costs
of the largest single incident totalled a
million or more Euros. For those with
weaker supply chains, the number
experiencing higher financial costs almost
doubled to 32%.
Only 8% of respondents could confirm that
all of their key suppliers had Business
Continuity (BCM) programmes in place to
deal with disruption. Less than half of
businesses check that BCM programmes
are likely to be effective in practice.
The ability to demonstrate resilience is
starting to become a factor in purchasing
decisions with 28% of respondents stating
that they always or often have to provide
assurance to prospective clients.
Conclusions & Recommendations
Effectively managing supply chain continuity is
critical not just because of the immediate
costs of disruption but as a result of the
longer term consequences to stakeholder
confidence and reputation that arise from
failure.
Fortunately, supply chain and BCM
management techniques are being brought
together to better understand the risk and
provide methods for managing continuity of
key supply chains.
Notwithstanding the level of risk mitigation
that can be achieved through these actions,
responsibility for resilience cannot be
outsourced, so organizations still need their
own BCM programmes to consider and deal
with the consequences of supply chain failure.
Executive Summary

Supply Chain Resilience 2011. Copyright © 2011 The Business Continuity Institute. Al Rights Reserved. 4
Introduction
This report is the third in a series that
started in 2009 to consider the challenge of
developing resilient supply chains.
The drivers of vulnerability in supply chains
have been well documented1. Whether
product or supply chain complexity, ICT
dependency, lean/Just-In-Time methods,
single sourcing, outsourcing or the broader
globalisation of sourcing and supply chains.
Supply chains are now multi-tiered and
multi-layered; an interactive system, whose
operational efficiency allows risks to
propagate fast and efficiently.
The survey in 2011 considers the sources of
disruption along with their origin within the
supply chain system. The survey majors on
the methods used to understand the
vulnerability and measures taken to ensure
supply chain continuity.
By identifying key supply chains and
evaluating their likely resilience, better
informed decisions on supply chain strategy
can be made, requiring Business Continuity
Management (BCM) programmes to be
reviewed in light of likely supply chain
behaviour when faced with disruption.
So, what do we mean by supply chain?
Here's one definition that we like
(Christopher 2005):
“The network of organizations that are
involved, through upstream and down-
stream relationships, in the different
processes and activities that produce
value in the form of products and services
in the hands of the ultimate consumer”.
Levels of supply chain disruption remain
undiminished with 85% of survey
respondents experiencing at least one
disruptive incident. Among those who
didn’t experience disruption, they
commented that the disruption was very
modest or that the business continuity
measures that had in place meant that
there was no substantive disruption.
85% of responding organizations stated they experienced at least one supply chain incident that
caused disruption to their organization
15%
56%
16%
6%
4% 3%
0
1-5
6-10
11-20
21-50
51+
Number of supply chain incidents in the past
12 months that caused disruption to the
organization (Base: 377)
1. “The Drivers of Supply Chain Vulnerability: An Integrated Framework”, Dr
Helen Peck, International Journal of Physical Distribution and Logistics Manage-
ment, Vol. 35, No4, 2005. pp210-232 ISSN 0960 0035
Supply Chain Resilience 2011. Copyright © 2011 The Business Continuity Institute. Al Rights Reserved. 5
Part 1: Sources and levels of disruption with
their short and longer term consequences

Supply Chain Resilience 2011. Copyright © 2011 The Business Continuity Institute. Al Rights Reserved. 6
8%
9%
9%
10%
11%
13%
15%
16%
17%
21%
21%
41%
51%
Adverse weather (windstorm/tornado, flooding,snow etc)
Unplanned outtage of IT or telecommunication systems
Transport network disruption
Earthquake/tsunami
Failure in service provision by an outsourcer
Loss of talent/skills
Product quality incident
Volcanic ash cloud
Insolvency
Civil unrest/conflict
Industrial dispute
Fire
Cyber attack(e.g. malware, DDOS attack)
Major sources of disruption on supply chains
Only 15% of the overall sample could
firmly state they did not suffer from a
disruptive supply chain incident. 85%
reported at least one incident, while
almost a third reported more that six.
Adverse weather is the source of most
disruption over the past 12 months, as
it was in 2010, with 51%.
Unplanned IT or telecom outages
follow in second place at 41%.
Transport network disruption rises to
third place in this year’s survey.
The new entrant is earthquake/
tsunami given the events in Japan in
March 2011 but also in New Zealand.
At 21% this is a significant result given
the wide representation of sectors and
countries involved in the survey and it
underlines the sensitivity of globalised
supply chains to disruption.
With the continued difficult economic
environment disruption through
supplier insolvency remains prominent
in the list of causes disruption. Base: 340

Supply Chain Resilience 2011. Copyright © 2011 The Business Continuity Institute. Al Rights Reserved. 7
‘Watch list’ sources of disruption
1%
1%
3%
3%
3%
4%
4%
5%
6%
6%
7%
7%
8%
Energy scarcity (loss of supply or rapid price increase)
Human illness(e.g. influenza)
Health & Safety incident
New laws or regulations
Data breach(loss or theft of confidential information)
Environmental incident
Act of terrorism
Product safety incident
Adverse media coverage
Business ethics incident (e.g. human rights,corruption)
Tighter credit insurance conditions
Intellectual Property violation
Animal disease
Looking at some of the movers from
2010, the loss of talent and skills has
risen up the list.
Human illness/influenza has fallen
from its high in the 2010 survey,
which reflected the swine flu
epidemic.
Sustainability issues such as
environmental incidents and business
ethics incidents are still there.
Intellectual property violation also
records a relatively high level of
incidence and it is one to watch for
the future.
We are always interested to see the
extent to which disruption has
strategic reputational consequences
on organizations, and the levels of
adverse media coverage provide an
indicator of this threat—especially as
the fault may well lie with the
supplier, but it is the buying
organization that suffers. Base: 340

Supply Chain Resilience 2011. Copyright © 2011 The Business Continuity Institute. Al Rights Reserved. 8
Leading sources of disruption vary by sector
Considering the following six
industry sectors some
important dist inct ions
emerge:
Financial Services: It is not a
surprise that this sector is
most sensitive to unplanned
IT or telecommunication
outages, given the high
reliance on technology and
outsourcing. However
looking down the list, what
this clearly enables is a
vulnerability to cyber attack,
whether through malware such as a virus or a
distributed denial of service attack. While the
cyber threat has been a “hot topic” through
much of 2011, only in the financial services
sector does it reach a top three position with
13%, almost double the survey average.
Retail/Wholesale sector: No surprises in
terms of the disruptions that affect supply
chains in this sector although the prominence
of fires is not found in other sectors.
Manufacturing: Sources of disruption among
manufacturing respondents are dominated by
product quality incidents. 92% reported at
least one disruptive incident. The earthquake
and tsunami had a particular impact on this
sector with high levels of force majeure
invocations (44%).
IT & Communications: This sector reported
the lowest levels of disruption with 29%
stating their organization had not suffered any
disruptions.
Transport & Storage: Respondents in this
sector reported more heavily on adverse
weather (82%) than other sectors and 55%
reported industrial disputes causing
disruption. The earthquake/tsunami was in a
close fourth position (46%)
Government: Failure in service provision by
an outsourcer reaches a top three position in
this sector. This likely reflects not only the
long standing trend to outsourcing and shared
services in the public sector but also the
impact of price pressures within these
contracts and reduction in capacity to deal
with disruptions.
Financial
Services
Retail &
WholesaleManufacturing
IT &
Communications
Transport &
StorageGovernment
1Unplanned
outage of IT or
telecom systems
Adverse
weather
(windstorm,
flooding, snow,
etc)
Product quality
incident
Adverse weather
(windstorm, flooding,
snow, etc)
Adverse weather
(windstorm,
flooding, snow,
etc)
Adverse weather
(windstorm,
flooding, snow,
etc)
2
Adverse weather
(windstorm,
flooding, snow,
etc)
Transport
network
disruption
Earthquake/
Tsunami
Unplanned outage of
IT or telecom
systems
Unplanned outage
of IT or telecom
systems
Unplanned
outage of IT or
telecom systems
3Cyber attack
(malware,
DDOS)
Fire
Adverse weather
(windstorm,
flooding, snow,
etc)
Earthquake/Tsunami Industrial dispute
Failure in service
provision by an
outsourcer

Supply Chain Resilience 2011. Copyright © 2011 The Business Continuity Institute. Al Rights Reserved. 9
And by geography...
The top three causes of
disruption are given for each
country or geographical
cluster in the adjacent table.
Given the high proportion of
UK based respondents in
the survey population, it is
no surprise to see that the
top three in the UK is very
close to the overall survey
results.
Respondents in Asia and the
Middle East and Africa are
notable in that adverse weather does not
feature in their top three. And while
unplanned outages of IT or telecom systems
are common to both regions, they are unique
in having product quality incidents featuring
so prominently. Social unrest in the Middle
East & North Africa did register in the survey
response for this cluster with 22% citing this
cause. In this region, 92% of respondents
reported at least one disruptive incident.
The severity of the 2011 earthquakes and
Japanese tsunami made these events the
main causes of supply chain disruption in Asia
but their effects registered prominently in the
USA as well.
The USA response is noticeable by the
strength of response to adverse weather at
76%, far higher than other regions while 36%
were affected by the earthquake/tsunami.
Continental Europe was the only geography to
give prominence to “loss of talent/skills” as a
leading source of supply chain disruption
although this featured in fourth place in the
Middle East cluster.
Beyond the countries and regions listed, some
other countries had interesting variations
although it should be noted that the sample
size is small.
Respondents in Canada had “industrial
disputes” as the second source of supply
chain disruption behind IT.
Respondents in the Central & Latin America
cluster registered the failure of service
provision by an outsourcer as the lead
cause of disruption followed by product
quality incidents and transport.
UKContinental
EuropeAsia
Middle East &
Africa
Australia &
New ZealandUSA
1
Adverse
weather
(windstorm,
flooding,
snow, etc)
Unplanned outage
of IT or telecom
systems
Earthquake/
tsunami
Unplanned outage of IT
or telecom systems
Adverse weather
(windstorm,
flooding, snow, etc)
Adverse
weather
(windstorm,
flooding,
snow, etc)
2
Unplanned
outage of IT
or telecom
systems
Adverse weather
(windstorm,
flooding, snow,
etc)
Unplanned
outage of IT or
telecom
systems
Transport network
disruption
Earthquake/
tsunami
Unplanned
outage of IT
or telecom
systems
3Transport
network
disruption
Loss of
talent/skills
Product quality
incidentProduct quality incident
Unplanned outage
of IT or telecom
systems
Earthquake/
tsunami

Supply Chain Resilience 2011. Copyright © 2011 The Business Continuity Institute. Al Rights Reserved. 10
9%
30%
61%
The source of the disruption was with our immediate, Tier 1, supplier
The source of the disruption was with our supplier's supplier, i.e. at Tier 2
The source of the disruption was much lower down the supply chain i.e. Tier 3, Tier 4 etc
Tier 1 Supplier
Tier 2 Supplier
Tier 3+ Supplier
Disruption can originate deep in the supply chain
New to 2011’s survey was a question which asked respondents to detail the level within the supply chain where the disruption originated. 265 respondents were able to identify the tier in which the disruption originated across 327 incidents. 81 reported they do not analyse the full supply chain to identify the original source of disruption, which could imply they are missing the opportunity to learn from incidents and apply the lessons to mitigate future disruption. The results of this analysis shows that 61% of disruption originated with tier one suppliers, with 30% at tier two and 9% at tier three or lower. The clear implication of these results is that there are sufficient levels of disruption originating below the first tier supply chain partner to justify further analysis with key suppliers.
Earthquakes & Tsunami
72 responding organizations cited that they were affected
by an earthquake or tsunami in 2011, this covers the
earthquake in New Zealand and the tsunami-earthquake in
Japan. Manufacturing sector respondents numbered the
largest affected group (17%), however, financial services
(14%) and professional services (14%) sector were not far
behind. Affected organizations were headquartered in 18
different countries including Australia, Barbados, Belgium,
Bulgaria, Bahrain, China, Germany, France, Japan, Mexico,
New Zealand, Philippines, Pakistan, Singapore, Switzerland,
Taiwan and the USA. 40% of these organizations reported a
force majeure invocation by a supplier.
“The earthquake in Japan caused many
problems in the primary supply chains, and
the downstream impacts to other supply
chains had a tremendous ripple effect.”
Survey respondent.

Supply Chain Resilience 2011. Copyright © 2011 The Business Continuity Institute. Al Rights Reserved. 11
1%
3%
4%
5%
11%
17%
17%
18%
19%
32%
32%
32%
38%
49%
Loss of productivity
Increased cost of working
Loss of revenue
Customer complaints received
Service outcome impaired
Stakeholder/shareholder concern
Delayed cash flows
Product release delay
Damage to brand reputation/image
Expected increase in regulatory scrutiny
Product recall/withdrawal
Fine by regulator for non-compliance
Share price fall
Payment of service credits
Short and longer term consequences of disruption
Loss of productivity remains in
pole position when it comes to the
primary consequences of supply
chain disruption. Increased cost
of working, loss of revenue and
customer complaints follow close
behind.
New entrants this year were
“share price fall” and “expected
increase in regulatory scrutiny”,
which scored at 2.5% and 11%
respectively.
Damage to brand and reputation
recorded 17%. Respondents who
marked this consequence had
supply chains with much weaker
levels of BCM adoption than the
average. They also reported
higher levels of force majeure
invocations (30%).
The overall message is that
ignoring supply chain resilience
issues can cause longer term
consequences to reputation and
stakeholder action. What were the consequences of the disruptions experienced of the last 12 months. Base:323

Supply Chain Resilience 2011. Copyright © 2011 The Business Continuity Institute. Al Rights Reserved. 12
83%
14%
2%
1%
Less than €1M
€1 Million to €10 Million
€11 Million to €50 Million
€51 Million to €100 Million
Greater than €100 Million
17% of organizations stated that the cost of the most significant single disruption was more than €1million
Looking at the most significant incident of the 12 month period
covered by the survey, 83% of respondents stated that the financial
cost was less than €1 million. However, for 14% the cost was
between €1M and €10M, while for 2% the cost was between €51M
and €100M and 1% reported costs in excess of €100M.
Those reporting reputational damage as a consequence of disruption
also reported much higher levels of financial cost, with 32% reporting
costs greater than €1 million— almost double the survey average.
The financial cost
We lost over a billion in inventory and lost
opportunity plus new model delays.
Survey respondent.
Primarily continued employment expenses relating
to persons not working due to office shutdown.
Survey respondent Question: Considering the single most significant incident in the last 12 months, what was the approximate finan-
cial cost (loss of revenue, increased cost of working). Base 276

Supply Chain Resilience 2011. Copyright © 2011 The Business Continuity Institute. Al Rights Reserved. 13
Balancing supply chain continuity risk with corporate cost saving initiatives
The widespread supply chain disruption in many
sectors arising from the tragic earthquake and
tsunami in Japan in March 2011 ignited the
debate about the pursuit of “just in time” supply
chains.
The survey response supports the assertion that
decisions made within organizations can create
vulnerabilities that are exposed by any number of
events listed earlier in the report.
JIT/lean and outsourcing in particular are seen to
increase vulnerability with 74% of respondents,
who hold an opinion, either strongly agreeing or
somewhat agreeing with the proposition (see
adjacent chart).
However, comments by respondents did highlight
advantages of supplier consolidation such as
fewer suppliers making engagement on BCM
more substantive and that outsourcing can
provide additional options for BCM strategies.
So, in addition to being “lean” and “six sigma”,
“green” and “sustainable”, key supply chains also
need to be designed for resilience objectives, if
the cost gains are not to be lost through
disruptions.
82
66
69
48
147
129
106
80
57
75
45
41
23
16
16
29
0% 10% 20% 30% 40% 50% 60% 70% 80% 90% 100%
Our outsourcing strategies have increased our vulnerability to supply chain disruption
Our supplier consolidation strategies have increased our vulnerability to supply chain disruption
Our approach to Just-In-Time / lean production techniques has made us more vulnerable to supply chain disruption
A shift to low cost suppliers (e.g. manufacturing to China) has increased our vulnerability to supply chain disruption.
Strongly agree Somewhat agree Somewhat disagree Strongly disgree
A shift to low cost suppliers (e.g.
Manufacturing to China) has
increased our vulnerability to
supply chain disruption
Our approach to Just-In-Time /
lean production techniques has
made us more vulnerable to
supply chain disruption.
Our supplier consolidation
strategies have increased our
vulnerability to supply chain
disruption.
Our outsourcing strategies have
increased our vulnerability to
supply chain disruption.
Low cost options are always considered with business continuity in mind.
Survey respondent.
Base: 352

Supply Chain Resilience 2011. Copyright © 2011 The Business Continuity Institute. Al Rights Reserved. 14
Part 2: Identifying and assuring key supply chains

Supply Chain Resilience 2011. Copyright © 2011 The Business Continuity Institute. Al Rights Reserved. 15
52% 29% 11% 6% 2%
Strongly agree Somewhat agree Somewhat disagree Strongly disagree We do not identify key suppliers
Key supplier identification
We have identified all of our key suppliers (Base: 325)
This next section of the survey considers
questions about key suppliers and how they
are identified. The working assumption is that
not all suppliers and supply chains need the
same level of analysis and attention, i.e.
where they are quickly and easily replaced
and the consequences of non-availability of
their product or service can be managed with
no impact on the buying organization, then
nominal attention is required. Key suppliers or
supply chains can therefore be defined as
those that support or provide key resources,
processes, activities or products and services
as identified in BCM's Business Impact Analy-
sis or those identified in supply chain manage-
ment techniques as strategic or bottleneck
suppliers.
Respondents to the survey seem to have a
good grasp of who their key suppliers are with
52% fully confident and a further 29% not far
behind in confidence terms. Techniques used
to identify key suppliers and supply chains
included BCM’s Business Impact Analysis,
which 28% of respondents favoured; while
22% used supply chain evaluation techniques
such as identifying bottle neck and strategic
suppliers. 36% used a combination of these
techniques.
When asked in a follow up question
how many key suppliers their
organization had, there was a very
wide range, however it is noteworthy
that very few have zero key suppliers
and the majority of organizations are
choosing in the 6-50 range (refer to
pp.27-28 for respondent profiles).
1% 15% 18% 19% 20% 10% 8% 5% 4%
0% 10% 20% 30% 40% 50% 60% 70% 80% 90% 100%
0 1 2-5 6-10 11-20 21-50 51-100 101-500 501-1000 Greater than 1,000
How many key suppliers do you have? (Base: 315)
Supply Chain Resilience 2011. Copyright © 2011 The Business Continuity Institute. Al Rights Reserved. 16
Criteria for identifying key supply chains
49%54%
57%
50%
50%35%
21%
43%
37%
41%
28%
0%
10%
20%
30%
40%
50%
60%
Spend
Financial impact of non-supply over a period of time
Reputational impact
Regulatory compliance impact
Availability of other suppliers
Speed that can change to alternative supplier
Maturity of the industry
Location of suppliers
Bespoke nature of product/service supplied
Key people/knowledge involved
Interdependencies with other suppliers
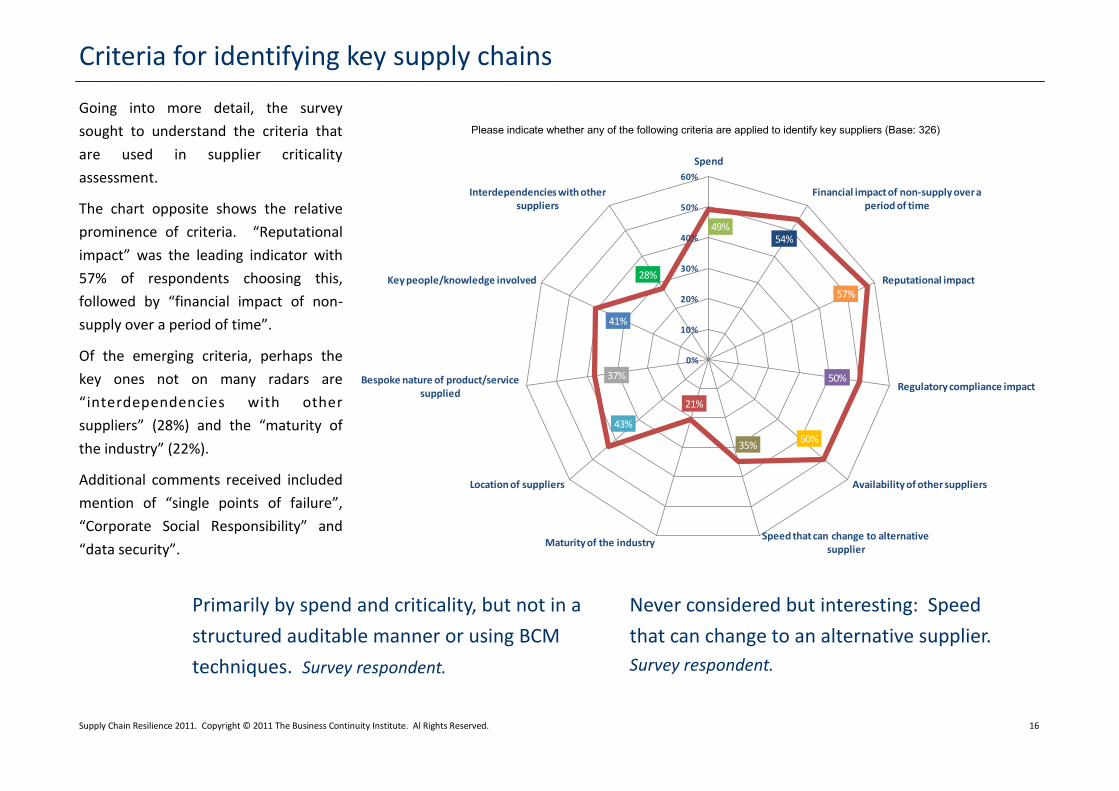
Going into more detail, the survey
sought to understand the criteria that
are used in supplier criticality
assessment.
The chart opposite shows the relative
prominence of criteria. “Reputational
impact” was the leading indicator with
57% of respondents choosing this,
followed by “financial impact of non-
supply over a period of time”.
Of the emerging criteria, perhaps the
key ones not on many radars are
“interdependencies with other
suppliers” (28%) and the “maturity of
the industry” (22%).
Additional comments received included
mention of “single points of failure”,
“Corporate Social Responsibility” and
“data security”.
Never considered but interesting: Speed
that can change to an alternative supplier.
Survey respondent.
Primarily by spend and criticality, but not in a
structured auditable manner or using BCM
techniques. Survey respondent.
Please indicate whether any of the following criteria are applied to identify key suppliers (Base: 326)

Supply Chain Resilience 2011. Copyright © 2011 The Business Continuity Institute. Al Rights Reserved. 17
How many key suppliers have BCM in place for their own needs?
Having identified key suppliers and supply
chains, the survey asked how many of these
suppliers already had business continuity
management (BCM) programmes in place.
84% of respondents were able to feed in their
analysis to this question, while 16% confessed
to not knowing, primarily due to not having
started down this road yet.
Only 7% could confidently state that all of
their key suppliers have business continuity
arrangements in place.
48% of respondents stated that
less than half of their key
suppliers had BCM with 52%
stating that more than 50% had
BCM in place.
When comparing sectors, some
significant variations emerge. In
financial services, many more
firms have key suppliers with
BCM in place, while for
manufacturing, transport and
storage and energy the figures
are much lower.
More detailed sector research is required, but
it might be fair to conclude that key suppliers
in the financial services sector will often be
larger IT services companies, which are likely
to be required to have BCM programmes in
place, whereas other sectors may have more
smaller and medium sized organizations
among their key suppliers, which are less
likely to have BCM in place, according to BCI
and third party research into BCM adoption.
The responses to these questions show that
you shouldn’t make assumptions that
suppliers have BCM and that there is still a
long way to go before we have widespread
resilient supply chains.
The good news is that the required analysis
has been completed in many organizations, so
their own BCM strategies can be reviewed in
the context of the underlying fragility, or
otherwise, of their supply chain.
14%
19%
15%
24%
21%
8%
Less than 10%
50% to 75%%
76% to 99%
26% to 50%
11% to 25%
All of them!
Considering your key suppliers, what percentage of them would you say have business continuity programmes in place to address their own needs? Base: 280. Excludes “Don’t knows” (+55).

Supply Chain Resilience 2011. Copyright © 2011 The Business Continuity Institute. Al Rights Reserved. 18
Assessing and validating BCM in the supply chain
The next part of the survey considered the
approaches being used to understand BCM
capability among key supply chains. Detailed
charts follow on the next four pages.
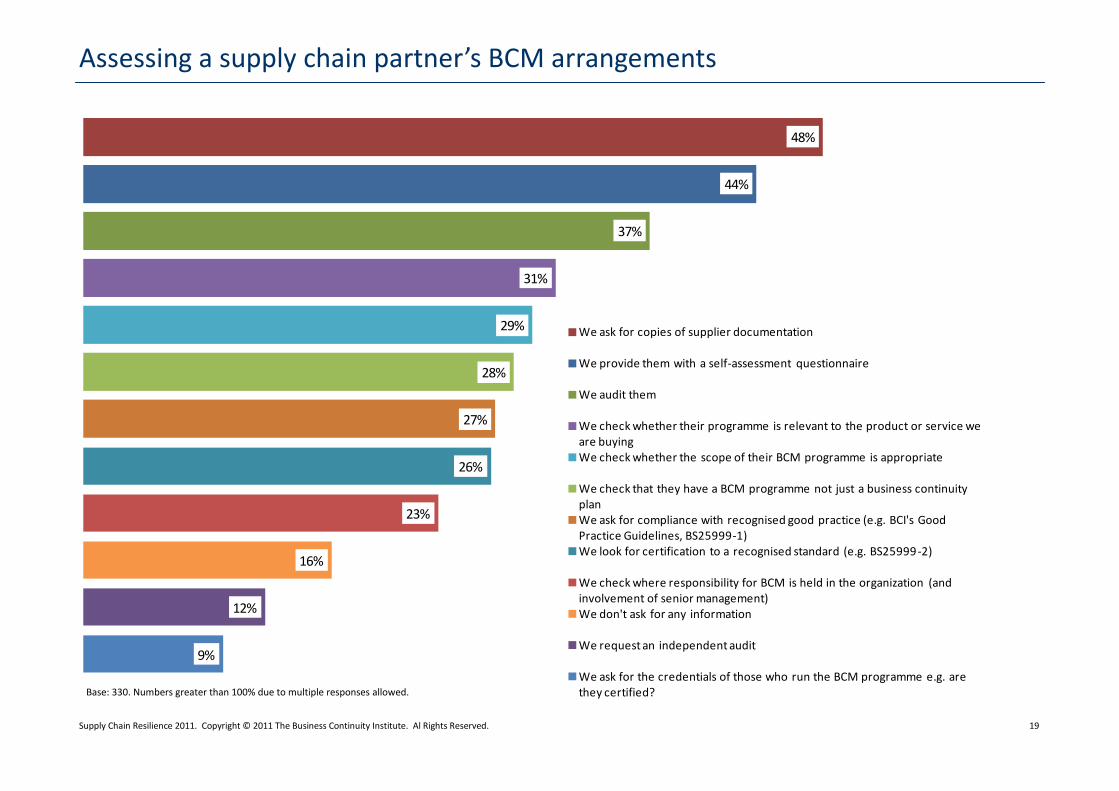
In terms of “questions to ask” and information
that should be retrieved to help build a
picture of capability, some eleven different
techniques were identified in the survey. The
most popular approach was to request copies
of supplier documentation (48%), followed
closely by sending a supplier a self-assessment
questionnaire (44%).
The weaknesses of pursuing these approaches
in isolation have been well documented in
terms of the ability to secure access to what
might be seen as confidential information
(e.g. Business Impact Analysis) or interpreting
information received through self-assessment
questionnaire in a meaningful way.
Compared with the survey in 2010 some
techniques have gained in prominence:
Auditing suppliers has increased from
28% to 37% with independent audits up
to 12% from under 4% in 2010.
Checking that the BCM programme is
relevant to the product/service
purchased nudged up from 28% to 31%
However, it is still rare that the buying
organization will check the credentials of
those who are actually running the BCM
programme, e.g. professional certification,
with just 9% doing this. This is a clear
omission in assessing BCM capability.
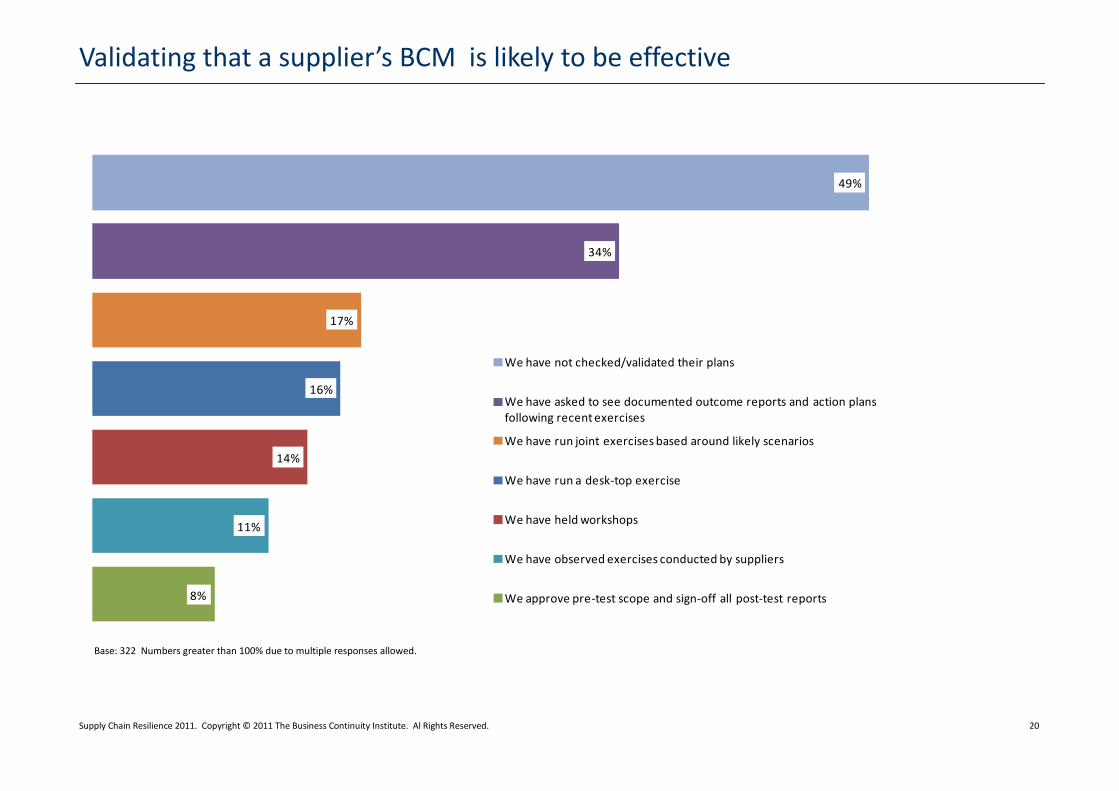
Moving on to discuss approaches taken to
understand how effective a key supplier’s
BCM is likely to be, and how to get a better
understanding of their likely behaviour in an
incident, it is very disappointing to see that
49% still do not take this essential step in
some form.
As BCM programmes are reviewed in-house,
so there needs to be a process for engaging
with key suppliers around changes at either
end. While 18% “never review” and 37% wait
until contract renewal, many are more
structured and proactive by linking reviews to
changes, and scheduling regular sessions.
Finally, in this section, we asked about
approaches to key suppliers who either do
not, cannot or will not meet the purchasing
organization’s BCM requirements. Where
possible the most favoured approach is to
work with the supplier to improve their
capability. However, 39% are prepared to
accept the situation, i.e. an increased level of
risk, while 26% would change their strategy.
12% would look at financial risk transfer
through insurance.
Our Supplier BCM evaluation
process is progressive, and depends
upon our dependency upon
them...We check that we are far
enough up their "Key Customer" list
to be sure that we do figure as one
to whom service must be
maintained rather than one to be
abandoned until their recovery has
been completed.
Survey respondent.
Supply Chain Resilience 2011. Copyright © 2011 The Business Continuity Institute. Al Rights Reserved. 19
9%
12%
16%
23%
26%
27%
28%
29%
31%
37%
44%
48%
We ask for copies of supplier documentation
We provide them with a self-assessment questionnaire
We audit them
We check whether their programme is relevant to the product or service we are buyingWe check whether the scope of their BCM programme is appropriate
We check that they have a BCM programme not just a business continuity planWe ask for compliance with recognised good practice (e.g. BCI's Good Practice Guidelines, BS25999-1)We look for certification to a recognised standard (e.g. BS25999-2)
We check where responsibility for BCM is held in the organization (and involvement of senior management)We don't ask for any information
We request an independent audit
We ask for the credentials of those who run the BCM programme e.g. are they certified?
Assessing a supply chain partner’s BCM arrangements
Base: 330. Numbers greater than 100% due to multiple responses allowed.
Supply Chain Resilience 2011. Copyright © 2011 The Business Continuity Institute. Al Rights Reserved. 20
8%
11%
14%
16%
17%
34%
49%
We have not checked/validated their plans
We have asked to see documented outcome reports and action plans following recent exercises
We have run joint exercises based around likely scenarios
We have run a desk-top exercise
We have held workshops
We have observed exercises conducted by suppliers
We approve pre-test scope and sign-off all post-test reports
Validating that a supplier’s BCM is likely to be effective
Base: 322 Numbers greater than 100% due to multiple responses allowed.

Supply Chain Resilience 2011. Copyright © 2011 The Business Continuity Institute. Al Rights Reserved. 21
13%
18% 18%
21%
24%
31%
37%
Whenever there's a major change event at their end
Never
Whenever there's a major change event at our end
Whenever a new, significant external risk/threat is identified
Ad hoc/when we get the opportunity
We have scheduled review meetings with key suppliers at appropriate time intervals as part of existing governance processes
At contract renewal
How often are supplier BCM requirements and capability reviewed?
Base: 326. Numbers greater than 100% due to multiple responses allowed.

Supply Chain Resilience 2011. Copyright © 2011 The Business Continuity Institute. Al Rights Reserved. 22
45%
39%
31% 31%
26%
12%
Agreed an appropriate BCM improvement plan with the supplier. Accepted the situation (i.e. increased risk).
Brought an additional supplier on-board. Changed supplier.
Changed approach/strategy (e.g. insource a key process) Transfer all or part of the risk to insurers.
What if your key suppliers do not, cannot or will not meet your requirements?
Base: 319. Numbers greater than 100% due to multiple responses allowed.
Supply Chain Resilience 2011. Copyright © 2011 The Business Continuity Institute. Al Rights Reserved. 23
Part 3: Winning business with BCM
Supply Chain Resilience 2011. Copyright © 2011 The Business Continuity Institute. Al Rights Reserved. 24
47% 30% 24%
Yes, an integral part of the procurement process from the start Yes, but after the decisions have essentially been taken No
13%
15%
24%14%
10%
6%
18%
Every tender/proposal
Majority
Sometimes
Rarely
Not at all
Don't know
Not applicable
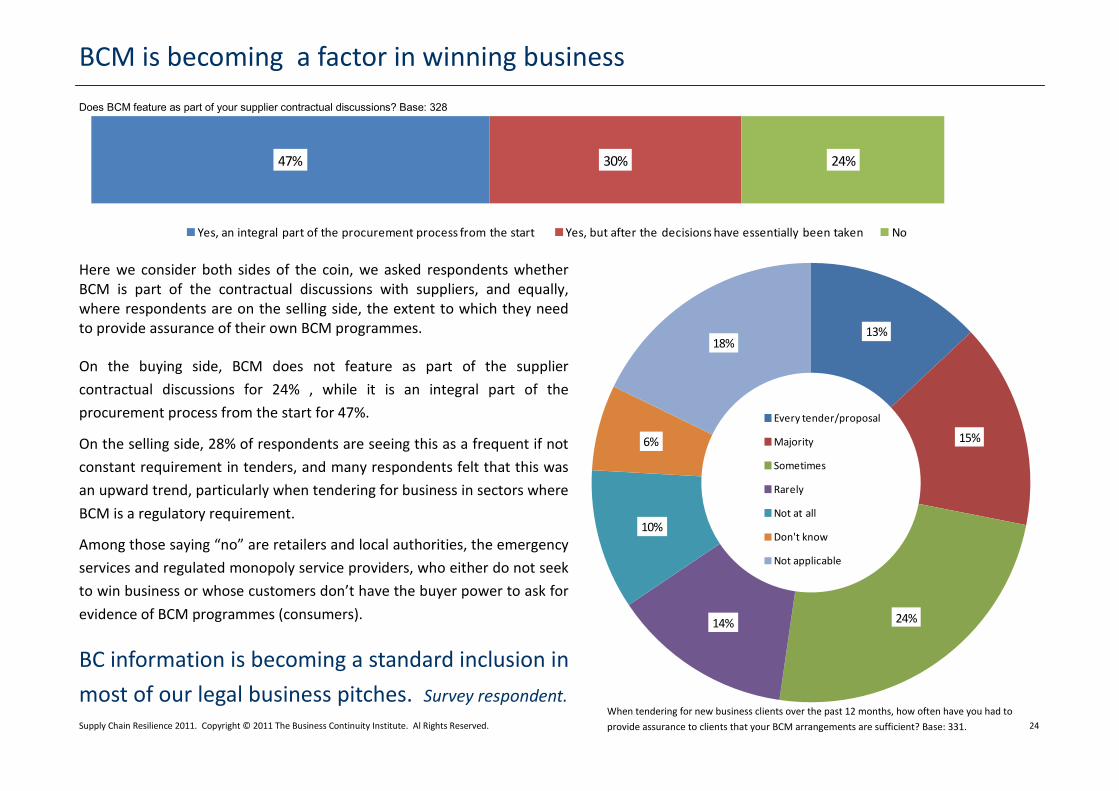
Here we consider both sides of the coin, we asked respondents whether BCM is part of the contractual discussions with suppliers, and equally, where respondents are on the selling side, the extent to which they need to provide assurance of their own BCM programmes.
On the buying side, BCM does not feature as part of the supplier
contractual discussions for 24% , while it is an integral part of the
procurement process from the start for 47%.
On the selling side, 28% of respondents are seeing this as a frequent if not
constant requirement in tenders, and many respondents felt that this was
an upward trend, particularly when tendering for business in sectors where
BCM is a regulatory requirement.
Among those saying “no” are retailers and local authorities, the emergency
services and regulated monopoly service providers, who either do not seek
to win business or whose customers don’t have the buyer power to ask for
evidence of BCM programmes (consumers).
Does BCM feature as part of your supplier contractual discussions? Base: 328
BCM is becoming a factor in winning business
When tendering for new business clients over the past 12 months, how often have you had to
provide assurance to clients that your BCM arrangements are sufficient? Base: 331.
BC information is becoming a standard inclusion in
most of our legal business pitches. Survey respondent.

Supply Chain Resilience 2011. Copyright © 2011 The Business Continuity Institute. Al Rights Reserved. 25
3% 37% 60%
Yes Yes, to some extent No
Contract ‘force majeure’ invocations are more common than you might think
Is business continuity used as a means to negotiate greater specificity in “force majeure contract clauses*? (Base: 324)
* Specifically include or exclude event types or establish recovery times for suppliers
As in 2009 and 2010, the survey looked at
levels of force majeure invocations and
whether BCM was being used to achieve
greater specificity in terms of events that
could allow invocation of force majeure
clauses in supply contracts.
Force majeure events are often described as
“Acts of God”, implying that they are beyond
the control of the affected party, and they
therefore relieve them from performing their
responsibilities under the contract. This is
important in the BCM context as the type of
events generally envisaged in such clauses are
precisely those that BCM is traditionally
associated with—high impact, low probability
ones. Hence with the application of BCM,
purchasing organizations are able to place
greater onus on the supplier to mitigate the
impact of such sources of disruption. There
are four key dimensions to a valid force
majeure invocation2:
One of the events referenced in the force
majeure clause has occurred;
The force majeure event was beyond the
control of either party, it was “unexpected”
and “beyond reasonable foresight and
skill”;
The event prevented, hindered, or delayed
the party seeking to rely upon the clause
from performing its contractual obligations;
and...
There were no reasonable steps that could
have been taken to avoid or mitigate the
event or its consequences.
The results from the survey show that 40%
use BCM to some extent to negotiate greater
specificity in force majeure clauses.
This is clearly an area where BCM
practitioners, contract managers and legal can
work more closely together for the benefit of
their organization: Being the organization with
the more specific terms of invocation may
mean you enjoy higher priority in the affected
party’s recovery strategy.
Note 2: Supreme Court of Canada in Atlantic Paper Stock Ltd v. Anne-
Nackawic Pulp & Paper Company Limited (Atlantic Paper). Cited in
Blakes article 21.4.2009
24% of respondents stated their suppliers invoked force majeure in the past 12 months

Supply Chain Resilience 2011. Copyright © 2011 The Business Continuity Institute. Al Rights Reserved. 26
Conclusions & Recommendations
Conclusions
As in previous years, there are many sources
of disruption to supply chains, and while the
probability of being affected by any specific
one naturally varies by business, sector and
geography, the probability of your supply
chain being affected by at least one of them is
high—at least according to the sample of
organizations that responded to this survey -
with 85% reporting at least one disruptive
event in the preceding 12 months.
A disruption in the supply chain can be as
equally devastating on your own firm’s brand
and reputation as the organization facing the
actual incident.
Effectively managing supply chain continuity is
critical not just because of the immediate
costs of disruption but as a result of the
longer term consequences to stakeholder
confidence and reputation that arise.
While just-in-time and outsourcing are here to
stay in some form, this survey shows it is
more critical than ever to strike a sensible
balance between the need to drive down
costs and the need for these cost savings not
to be wiped out through disruption or
unacceptable risk exposure, especially in the
context of the longer term reputational
damage
The survey reveals that disruption originates
below the immediate, tier one supplier, this
provides a stark warning that if your
immediate supplier has not got a handle on
their suppliers, then you might suffer from a
disruptive incident.
Fortunately, supply chain and business
continuity management techniques are being
brought together to better under the risk and
provide methods for managing continuity of
key supply chains.
For the first time the survey sought to
understand the extent to which BCM is
becoming a factor in winning business. The
response is encouraging with 28% already
seeing a demand for BCM information in the
tender process.
Recommendations
Resilience considerations need to be brought
more prominently into the equation when
considering operational efficiency in supply
chain decision making.
For the BCM practitioner, it is worth
leveraging the discipline and vigour of supply
chain management when it comes to engag-
ing suppliers, especially to establish review
meetings and audit processes.
At a practical level, it is important to analyse
supply chain incidents and learn from them,
updating planning assumptions as a result.
Be particularly alert to disruption below the
immediate supplier.
However good the risk mitigation approach
achieved through applying BCM in the
supply chain, organizations cannot
“outsource” their responsibility for resilience
and BCM programmes need to assume that
disruption will happen and be prepared to
deal with the consequences to ensure
continuity of supply.

Supply Chain Resilience 2011. Copyright © 2011 The Business Continuity Institute. Al Rights Reserved. 27
Respondent profile
28%
16%
13%
10%
9%
5%
4%
4%
3%
3%2%
2% 1%
Financial Services
Government (e.g. local/municipal, central, emergency services)
Professional Services
IT & Communcations
Manufacturing
Health & Social Care
Energy
Transport & Storage
Education
Retail/Wholesale
Engineering/Construction
Agriculture, Forestry & Fishing
Support Services
Media & Entertainment
42%
12%7%
4%
2%
2%
2%2%
2%
2%
1%
1%
1%
1%
1%
1%
14%
uk – United Kingdom us – United States au – Australia
in – India ca – Canada za – South Africa
cn – China nz – New Zealand sg – Singapore
ch – Switzerland nl – Netherlands de – Germany
it – Italy ng – Nigeria pk – Pakistan
ae – United Arab Emirates be – Belgium ie – Ireland
jp – Japan ke – Kenya Other
42%
12%
7%
4%
2%
2%
2%
2%
2%
2%
1%1%
1%
1%
1%
1%
14%
uk – United Kingdom us – United States
au – Australia in – India
ca – Canada za – South Africa
cn – China nz – New Zealand
sg – Singapore ch – Switzerland
nl – Netherlands de – Germany
it – Italy ng – Nigeria
pk – Pakistan ae – United Arab Emirates
be – Belgium ie – Ireland
jp – Japan ke – Kenya
Other
28%
16%
13%
10%
9%
5%
4%
4%3%
3%2%
2% 1%
Financial Services Government (e.g. local/municipal, central, emergency services)
Professional Services IT & Communcations
Manufacturing Health & Social Care
Energy Transport & Storage
Education Retail/Wholesale
Engineering/Construction Agriculture, Forestry & Fishing
Support Services Media & Entertainment
Base: 559 Base: 328
Geographical location of the respondent Primary activity of the responding organization (Standard Industrial
Classification 2007)

Supply Chain Resilience 2011. Copyright © 2011 The Business Continuity Institute. Al Rights Reserved. 28
0%13%
8%
6%
11%
29%
10%
15%
3%5%
0
1-50
51-250
251-500
501-1,000
1,001-5,000
5,001-10,000
10,001-50,000
50,001-100,000
Greater than 100,000
14%
15%
21%17%
10%
13%
7%3%
Less than €1 Million per annum
€1 Million- €10 Million
€11 Million - €100 Million
€101 Million - €500M Million
€501 Million - €1 Billion
€1 Billion - €10 Billion
€11 Billion - €50 Billion
Greater than €50 Billion
Size of organization by number of employees Size of organization by revenues or budget (public sector)
Base: 322 Base: 259
Respondent profile

Supply Chain Resilience 2011. Copyright © 2011 The Business Continuity Institute. Al Rights Reserved. 29
46%
13%
10%
9%
7%
3%
2%
1%
1%1%
1%6% Business Continuity Management (incl. incident/crisis
management)
Supply chain/Procurement/Purchasing
Risk Management
Consultant
IT Disaster Recovery / IT Service Continuity
Emergency Planning
Quality / Business Improvement
Internal/External audit
Security (physical/virtual)
Health & Safety management
Line of Business /Service Directorate
Other
46%
13%
10%
9%
7%
3%
2%
1%
1%1%
1%6%
Business Continuity Management (incl. incident/crisis management) Supply chain/Procurement/Purchasing
Risk Management Consultant
IT Disaster Recovery / IT Service Continuity Emergency Planning
Quality / Business Improvement Internal/External audit
Security (physical/virtual) Health & Safety management
Line of Business /Service Directorate Other
Profile of respondents by job function:
Respondent profile
94% experienced at least one disruptive event.
Product quality, adverse weather and failure of service provision
by outsourcers are given as the leading causes of disruption.
Customer complaints, loss of productivity, increased cost of
working and loss of revenue are given as the leading impacts or
consequences of disruption.
Spend, availability of other suppliers, and financial impact of
non-supply comprise the top three criteria to identify key
suppliers.
Will typically look to bring an additional supplier on board,
when faced with intransigence (47%).
Significance preference for auditing key suppliers (63%) and
seeking certification (39%) compared with the survey average.
Much more likely to hold workshops with key suppliers (21%).
Much more likely to have scheduled review meetings(44%).
68% state that BCM does feature as part of supplier contractual
discussions.
48% have experienced a force majeure event in past 12 months.
Supply Chain Practitioners
Base: 552

Supply Chain Resilience 2011. Copyright © 2011 The Business Continuity Institute. Al Rights Reserved. 30
The online survey response in 2011 was 80% higher than in 2010 with 559 organizations responding. This reflects much
higher numbers of supply chain professionals responding along with much increased participation from the USA and the
almost doubling of countries participating overall. All members of the Business Continuity Institute received an individual
email invitation to complete the survey. This was complimented by the Chartered Institute of Purchasing & Supply inviting its
members to contribute through their existing communication methods. In addition, support is acknowledged from DRJ and
Buyers Meeting Point for bringing the survey to the attention of their subscribers and members respectively. The survey was
conducted between June 30th and September 5th 2011. Respondents came from 62 countries and were active across 14
industry sectors (SIC 2007).
We would like to thank Zurich for sponsoring this research for third successive year and DHL Supply Chain for joining them.
We would also like to thank the BCI Partnership Working Party on Supply Chain Continuity, and the BCI Partnership Steering
Group for their support in the development of the survey.
Author: Lee Glendon CBCI, Head of Campaigns, The Business Continuity Institute
Chief Reviewer: Lyndon Bird FBCI, Technical Director, The Business Continuity Institute
Survey response, methodology and acknowledgements

Supply Chain Resilience 2011. Copyright © 2011 The Business Continuity Institute. Al Rights Reserved. 31
About
The Business Continuity Institute
Based in Caversham, United Kingdom, the Business Continuity Institute (BCI) was
established in 1994 to promote the art and science of business continuity
management and to assist organizations in preparing for and surviving minor and
large-scale man-made and natural disasters. The Institute enables members to
obtain guidance and support from their fellow practitioners, as well as offers
professional training and certification programmes to disseminate and validate
the highest standards of competence and ethics. It has over 6,000 members in
more than 100 countries, active in an estimated 2,500 organizations in private,
public and third sectors. For more information go to: www.thebci.org
The BCI Partnership, established in 2007, offers corporate membership of the BCI
with 80 member organizations including Aon, BAE Systems, BP, BSI Group, BT,
ContinuitySA, Continuity Shop, Deloitte, DHL Supply Chain, DNV, Cassidian,
Garrison Continuity, IBM, HP, Link Associates, Lloyds Banking Group, Lockheed
Martin, Marsh, Milton Keynes Council, Prudential, PwC, Royal Mail, Savant, Statoil,
Steelhenge Consulting, VocaLink and Zurich. To join as a corporate member,
go to: www.bcipartnership.com
Business Continuity Management
Business Continuity Management (BCM) identifies
potential threats to an organization and the impacts
to business operations that those threats, if realized,
might cause. It provides a framework for building
organizational resilience with the capability for an
effective response that safeguards the interests of key
stakeholders, reputation, brand and value-creating
activities.
Contacting the BCI
Lee Glendon CBCI, Head of Campaigns
The Business Continuity Institute
10-11 Southview Park, Marsack Street
Caversham, RG4 5AF, UK.
Phone: +44 (0) 118 947 8215
E-mail: [email protected]

Supply Chain Resilience 2011. Copyright © 2011 The Business Continuity Institute. Al Rights Reserved. 32
About
The Chartered Institute of Purchasing & Supply
The Chartered Institute of Purchasing & Supply (CIPS) is the leading international body representing
purchasing and supply management professionals. It is the worldwide centre of excellence on
purchasing and supply management issues. CIPS has over 65,000 members in 150 different countries,
including senior business people, high-ranking civil servants and leading academics. The activities of
purchasing and supply chain professionals have a major impact on the profitability and efficiency of all
types of organisation and CIPS offers corporate solutions packages to improve business
profitability. www.cips.org
Strategic partners include the United Nations and the UK Government
Support donor-funded capacity and capability training all over the developing world and beyond to
build effective, sustainable supply chains
Offices in South Africa, Australia, the Middle East, the UK
20% increase in membership in 2010
Supports over 47,000 studying members across the globe
Over 6,000 members a year attend our events including our annual conference
1.2 million unique visitors to the CIPS website each year

Supply Chain Resilience 2011. Copyright © 2011 The Business Continuity Institute. Al Rights Reserved. 33
Zurich
Zurich Financial Services Group (Zurich) is a leading multi-line insurance provider with a global network
of subsidiaries and offices in Europe, North America, Latin America, Asia-Pacific and the Middle East as
well as other markets. It offers a wide range of general insurance and life insurance products and
services for individuals, small businesses, mid-sized and large companies as well as multinational
corporations. Zurich employs about 60,000 people serving customers in more than 170 countries.
Founded in 1872, the Group is headquartered in Zurich, Switzerland. Zurich Financial Services Ltd
(ZURN) is listed on the SIX Swiss Exchange and has a level I American Depositary Receipt program
(ZFSVY) which is traded over-the-counter on OTCQX. Further information about Zurich is available at
www.zurich.com.
Zurich is a thought leader in supply chain risk management. It has developed supply chain risk
assessment tools and an innovative and award winning insurance product. The company has extensive
experience of working with clients to help them make their supply chains more resilient.
Zurich Contact Details
Nick Wildgoose: Global Supply Chain Product Manager
Phone +44 (0) 7764282065
Email [email protected]
About

Supply Chain Resilience 2011. Copyright © 2011 The Business Continuity Institute. Al Rights Reserved. 34
About
DHL
DHL is the global market leader in the logistics industry and “The Logistics Company for the world”. DHL
commits its expertise in international express, air and ocean freight, road and rail transportation,
contract logistics and international mail services to its customers.
A global network composed of more than 220 countries and territories and about 275,000 employees’
worldwide offers customers superior service quality and local knowledge to satisfy their supply chain
requirements. DHL accepts its social responsibility by supporting climate protection, disaster
management and education.
DHL Supply Chain Service Capability
DHL Supply Chain provides solutions for all industry sectors including retail and fashion. By understand-
ing your business needs, DHL delivers cost effective supply chain solutions that improve efficiency.
From consulting and design, sourcing and transportation through to warehousing, order assembly,
distribution and returns, we manage the full supply chain operation.
DHL is part of Deutsche Post DHL. The Group generated revenue of more than 51 billion Euros in 2010.
DHL Supply Chain Contact Details
Ruth Robottom: Supply Chain Development Manager
Phone +44 (0) 7880 980436
Email [email protected]