supply chain excellence
TRANSCRIPT
© S A Partners 2014
Leadership for
Enterprise Excellence
September 2014

© S A Partners 2014
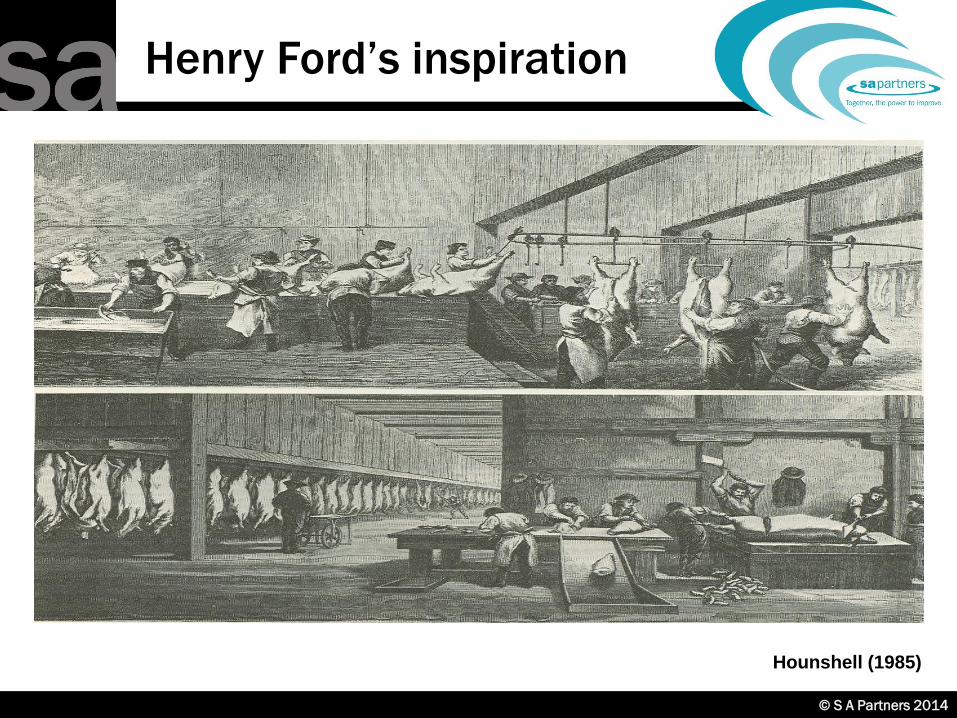
Henry Ford’s inspiration
Hounshell (1985)

© S A Partners 2014© S A Partners 2014
Food Industry is getting fatter
0
2
4
6
8
10
12
Sto
cktu
rn
Food and drinks Manufacturing Trend (food and drinks) Trend (manufacturing)
Automotive:15
Toyota: 35
Dell: 80
© S A Partners 2014© S A Partners 2014
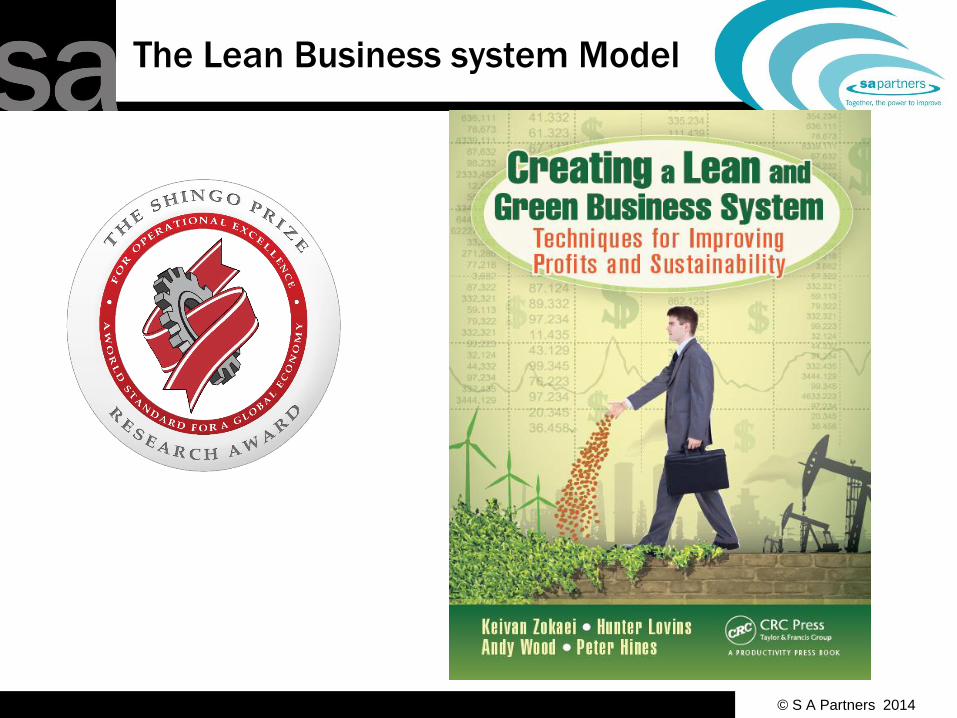
The Lean Business system Model

© S A Partners 2014
Lean & Green Maturity
GREEN
LEAN
Ambidexterity
Lean and green
can co-exist and
even be
complementary.
E.g. efficient
technical
solutions for both
lean and green
outcomes.
Synergy
Catalytic
relationship
between lean and
green.
E.g. clean tech.
allowing tax
concession.
Simultaneous
elimination of
economic and
green wastes.
Symbiosis
Lean and green are
pursued as part of
the same strategy.
E.g. L&G strategy
for reducing ‘loss’
imparted to society
during entire
product life cycle.
Trade-off
Lean contradicts
organisation’s green
ambitions and vice
versa.
E.g. more frequent
deliveries increases
CO2 emissions. Lower
CO2 emissions
reducing productivity.
+ +
--
++
--
+ +
++
Source: Martinez, Vazquez and Zokaei et al, 2010
© S A Partners 2014
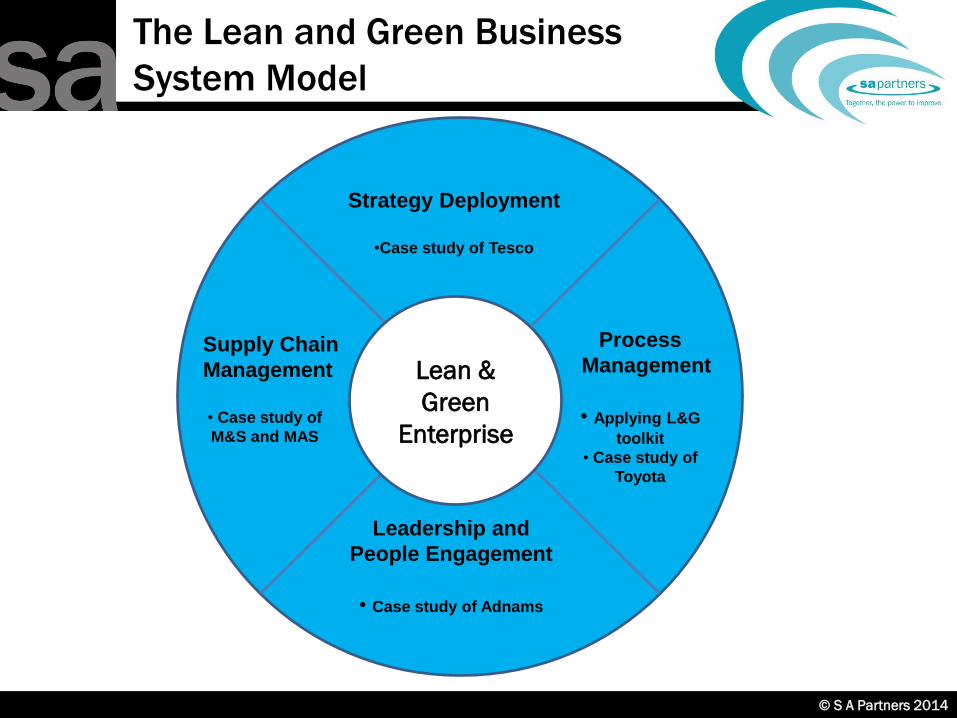
Lean &
Green
Enterprise
Strategy Deployment
•Case study of Tesco
Process
Management
• Applying L&G
toolkit
• Case study of
Toyota
Supply Chain
Management
• Case study of
M&S and MAS
Leadership and
People Engagement
• Case study of Adnams
The Lean and Green Business
System Model

© S A Partners 2014© S A Partners 2014
Problem Solving v.
Implementation Mind-set
Mike Rother, 2009

Based on the work of Shirzad Chamine
While your IQ, SQ and EQ (emotional intelligence)
contribute to your maximum potential, it’s your PQ
that determines how much of that potential you
actually achieve

Based on the work of Shirzad Chamine
• Positive Intelligence (PQ) measures the
percentage of time that your mind is serving you
as opposed to sabotaging you
• An indicator of how much mastery you have
developed over your own mind is sometimes
called mindfulness, self-awareness or
consciousness.

© S A Partners 2014© S A Partners 2014
The Shingo Model and its Principles
Culture• Values-What is important
• Beliefs-What is right and wrong
• Behaviours-How we demonstrate the
above
Behaviour• Described, Observed and Recorded
Purpose
Process
People
Stakeholders
© S A Partners 2014© S A Partners 2014
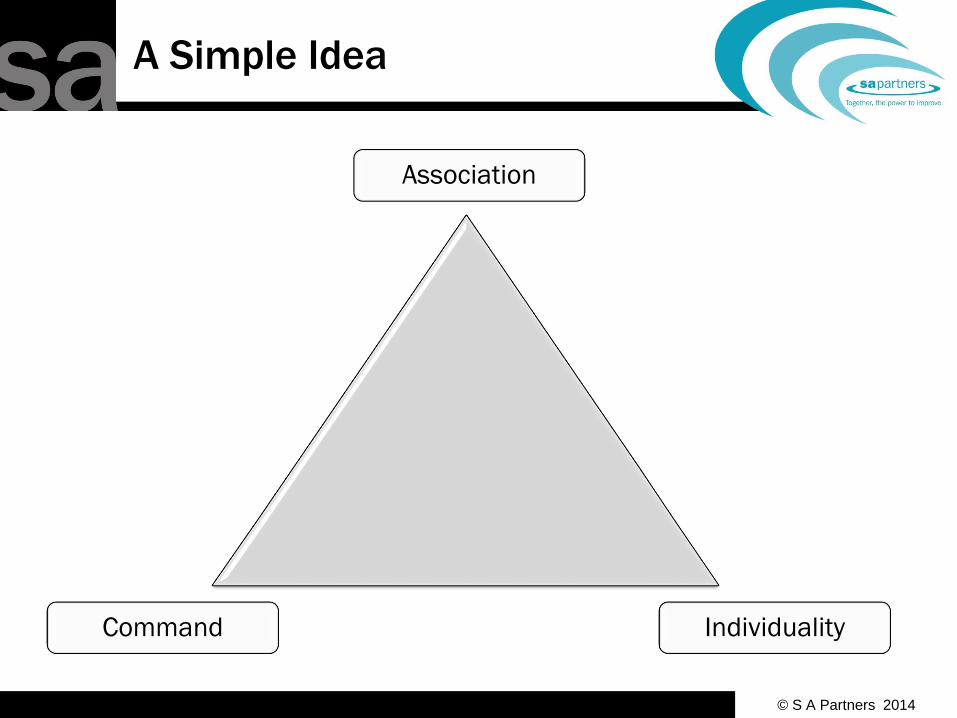
Association
Command Individuality
A Simple Idea

© S A Partners 2014
Tesco Case Study
Strategy Deployment across
end-to-end supply chain

© S A Partners 2014
Tesco’s Growth and profitability
0
10
20
30
40
50
60
Sales excl.VAT £bn
0.000
0.500
1.000
1.500
2.000
2.500
3.000
3.500
Profit £bn
Internal efficiency … whole chain efficiency … effectiveness ... sustainability
£400m saving due to Lean
thinking. Starts
systematically deploying
clubcard information.
Start of Lean
Programme. Extending
efficiency to whole chain
1/3 UK market share.
Clear environmental
strategy and action

© S A Partners 2014
PROFIT IS NOT THE CORE PURPOSE
IT IS ONE OF THE MEASURES OF SUCCESS
BY WHICH TESCO JUDGES IF IT IS ACHIEVING ITS CORE
PURPOSE
TESCO Core Purpose
To create value for customers to earn their lifetime loyalty
(Evans, Mason & Zokaei, 2007)

© S A Partners 2014
BETTER SIMPLER CHEAPER
• Better for customers
• Simpler for staff
• Cheaper for Tesco
Based on
• Lean Thinking - Womack & Jones
• Loyalty - Reichheld
• Simplicity - de Bono
(Evans, Mason & Zokaei, 2007)
TESCO Approach

© S A Partners 2014
TESCO Business Model
BuySupply Distribute Sell
“Convenience” factory
Availability
Convenience
Price
Value
One-stop shop
Innovation
LOYALTY
How do Tesco thrive
when they make
nothing?
(Evans, Mason & Zokaei, 2007)
© S A Partners 2014
•
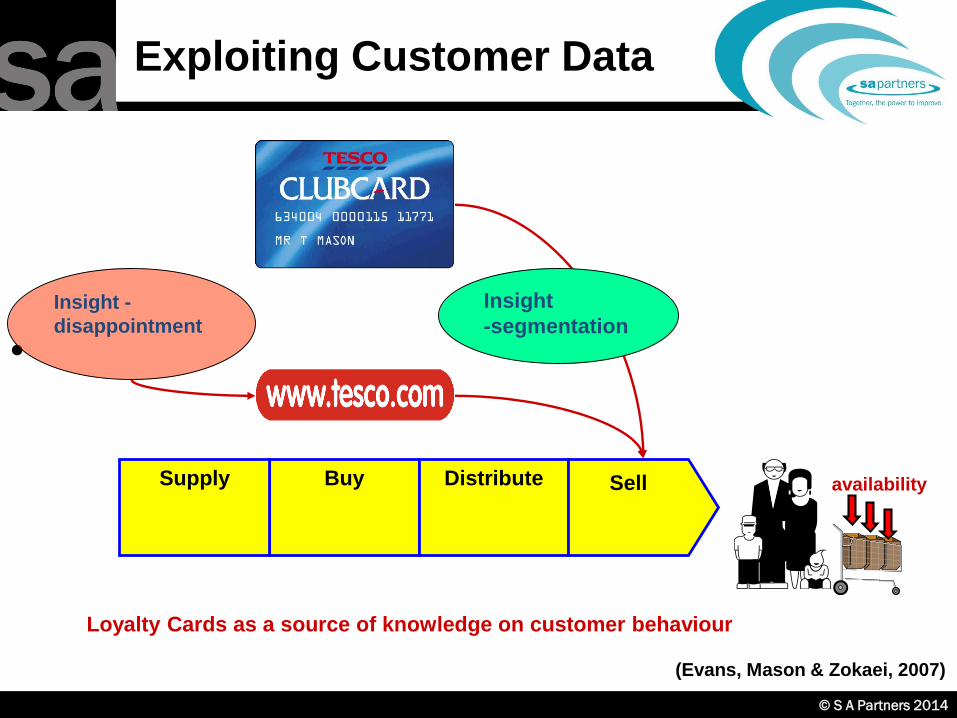
Exploiting Customer Data
BuySupply Distribute Sell
Insight
-segmentation
availability
Insight -
disappointment
Loyalty Cards as a source of knowledge on customer behaviour
(Evans, Mason & Zokaei, 2007)
© S A Partners 2014
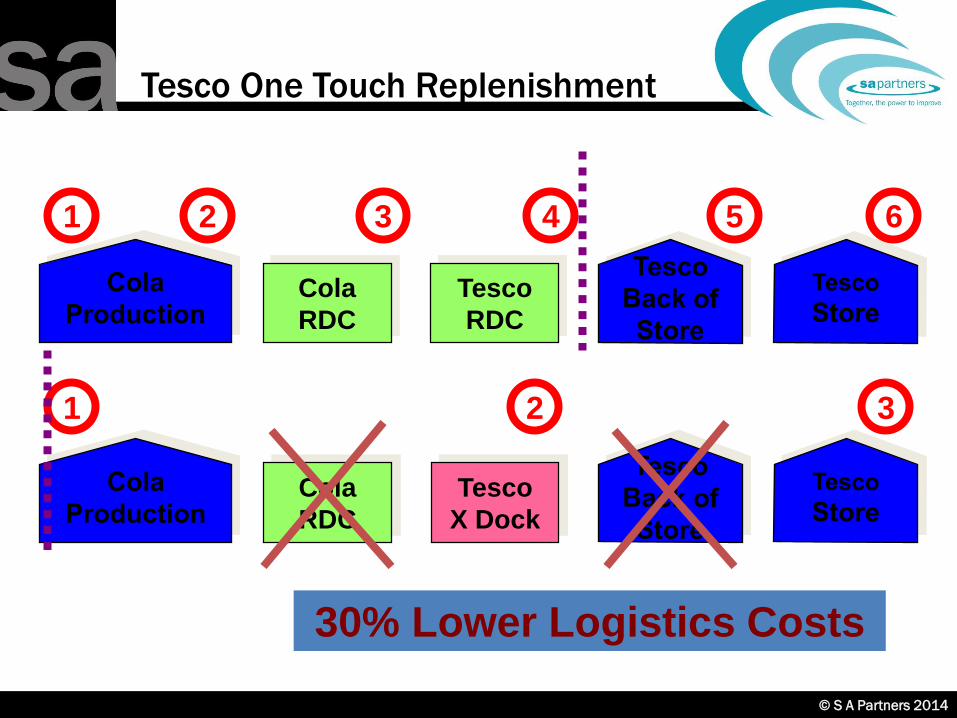
Tesco One Touch Replenishment
Tesco
RDC
Cola
RDC
1 2 3 4 5 6
30% Lower Logistics Costs
Tesco
X Dock
Cola
RDC
1 2 3
© S A Partners 2014
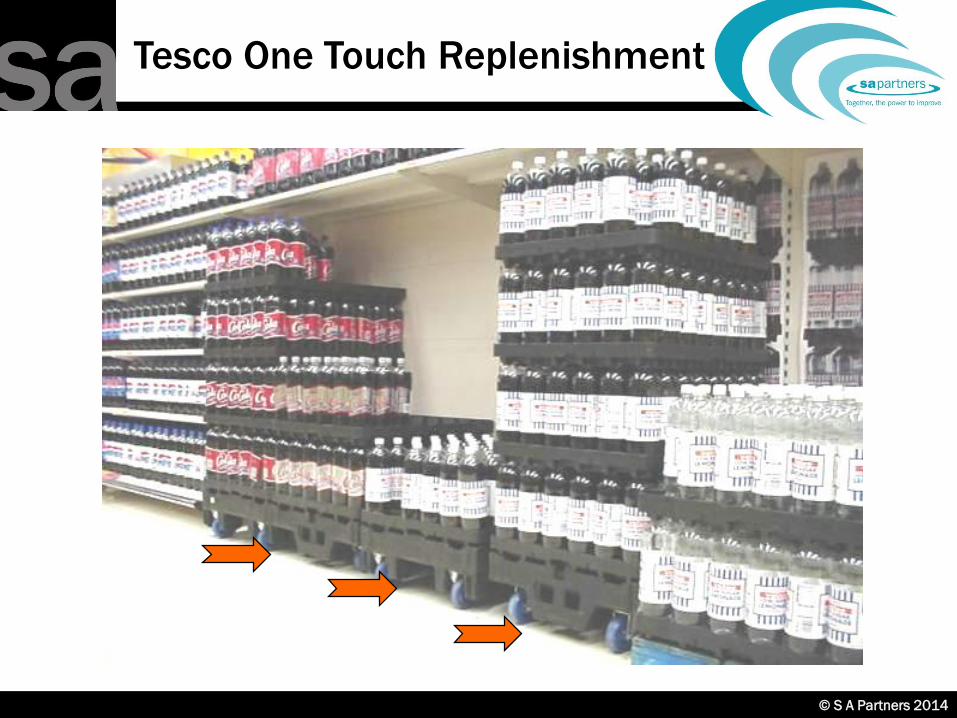
Tesco One Touch Replenishment
© S A Partners 2014
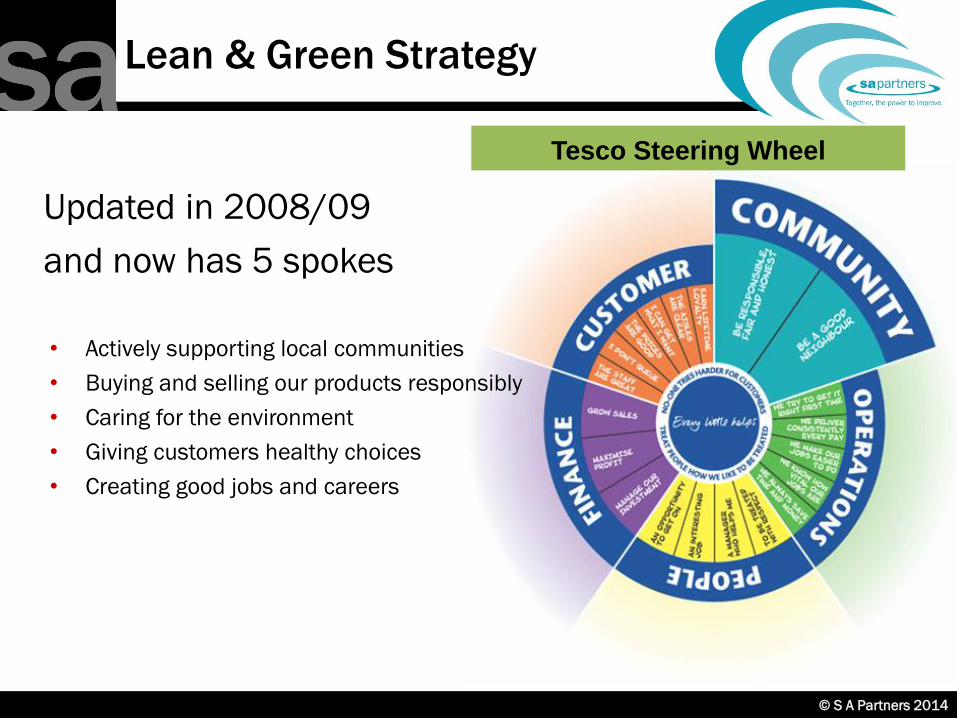
Lean & Green Strategy
Updated in 2008/09
and now has 5 spokes
• Actively supporting local communities
• Buying and selling our products responsibly
• Caring for the environment
• Giving customers healthy choices
• Creating good jobs and careers
Tesco Steering Wheel
© S A Partners 2014© S A Partners 2014
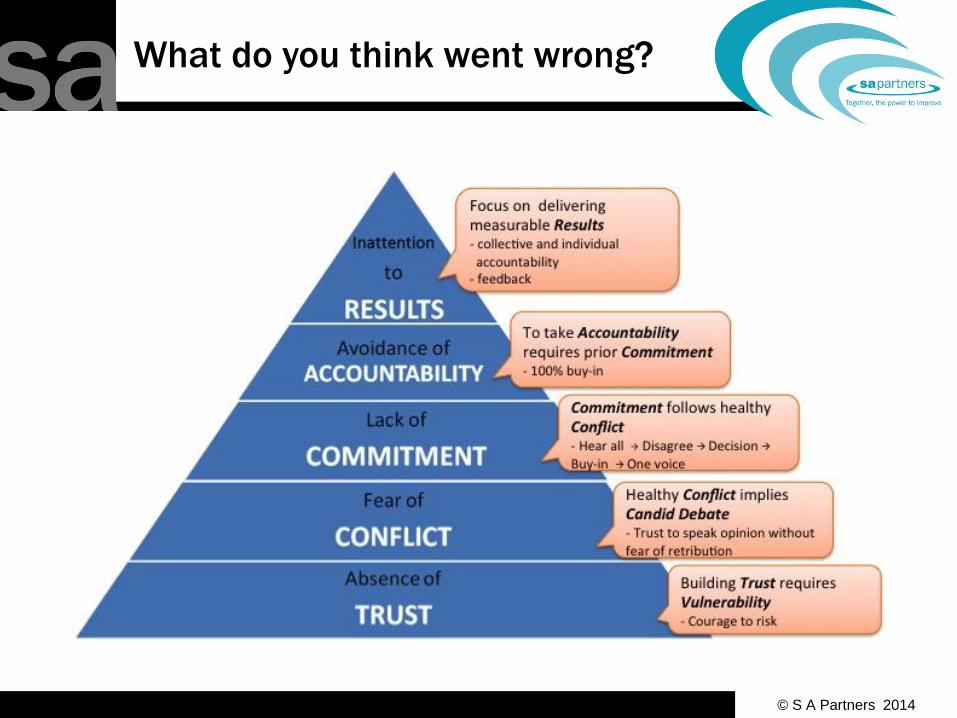
What do you think went wrong?

© S A Partners 2014
Operational
Excellence

© S A Partners 2014
Operational Excellence
Best in class end to end Supply Chain performance in
Safety, Quality, Customer Service, Cost and Cash
Pro
cu
rem
en
t
Pla
nn
ing
Op
era
tio
ns
Lo
gis
tic
s
Supply Chain Development
Project Assurance
Continuous Improvement
Process Development
Group Engineering
Operational Improvement
Standardised Processes, Systems & KPIs/Scorecards
Safety
Meat Supply
QualityCustomer
ServiceCost Cash
© S A Partners 2014
Henry Ford’s inspiration
Hounshell (1985)

© S A Partners 2014© S A Partners 2014
The Lean Business system Model
© S A Partners 2014© S A Partners 2014
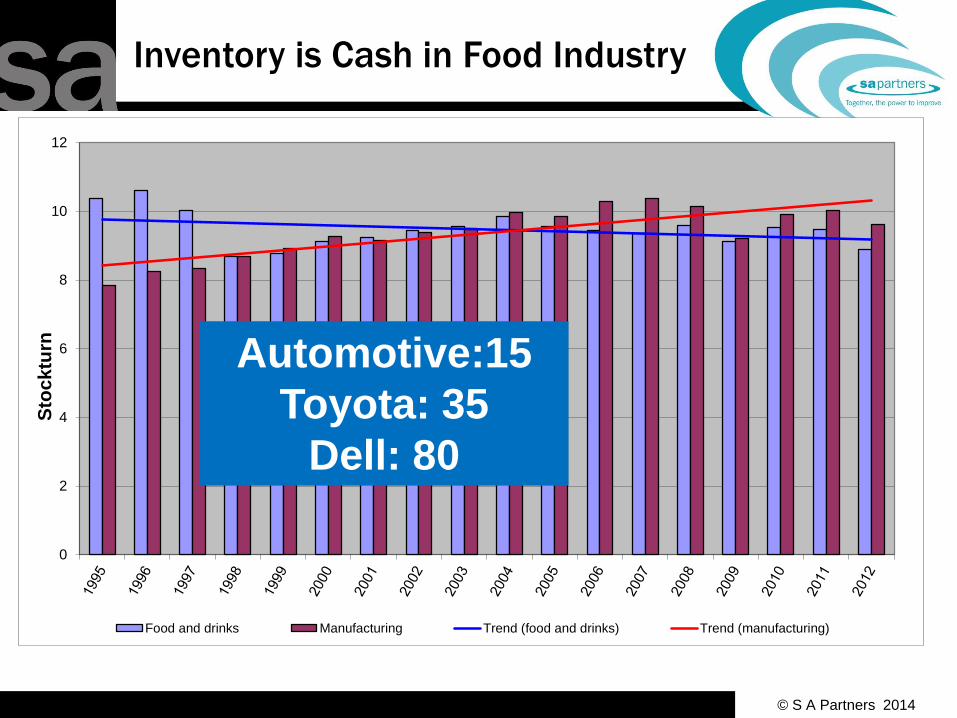
Inventory is Cash in Food Industry
0
2
4
6
8
10
12
Sto
cktu
rn
Food and drinks Manufacturing Trend (food and drinks) Trend (manufacturing)
Automotive:15
Toyota: 35
Dell: 80

© S A Partners 2014© S A Partners 2014
Opportunities for Operational Excellence
Household food waste
Giveaway
Food on the floor
Out of life
© S A Partners 2014
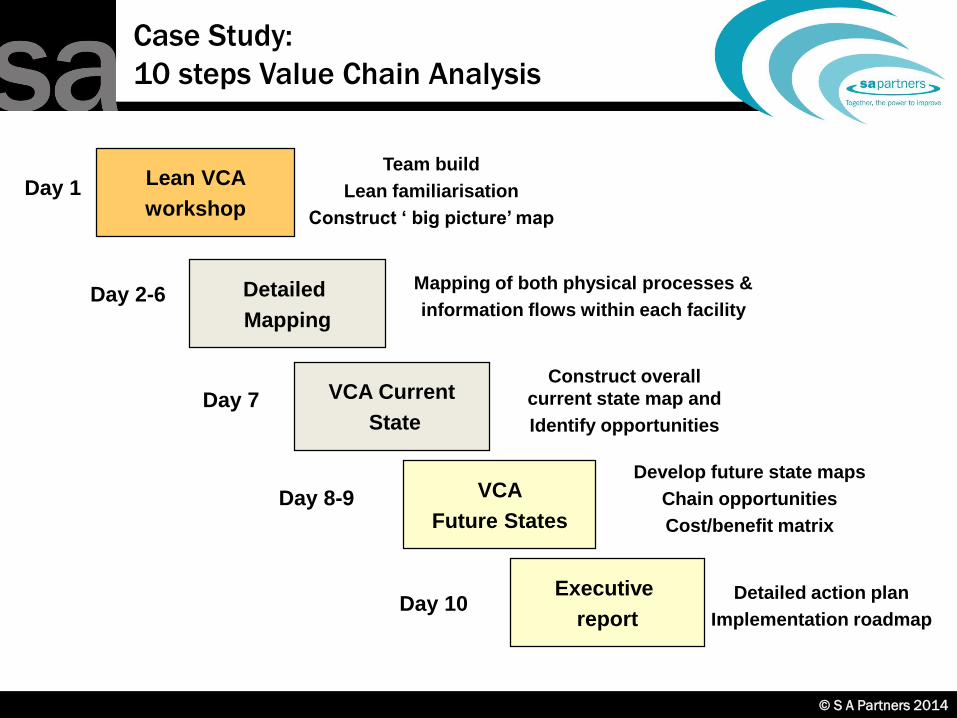
Case Study:
10 steps Value Chain Analysis
Detailed
Mapping
VCA Current
State
Mapping of both physical processes &
information flows within each facility
VCA
Future States
Develop future state maps
Chain opportunities
Cost/benefit matrix
Executive
report
Detailed action plan
Implementation roadmap
Lean VCA
workshop
Team build
Lean familiarisation
Construct ‘ big picture’ map
Day 1
Day 2-6
Day 7
Day 8-9
Day 10
Construct overall
current state map and
Identify opportunities

© S A Partners 2014© S A Partners 2014
Waste Map
Ou
t o
f L
ife
Qu
alit
y w
aste
Sh
rin
ka
ge
& R
DC
wa
ste
Prim
ary
de
po
t
Giv
e a
wa
y (
on
ave
. 4
% o
fp
acks a
re o
ve
rwe
igh
t)
Lin
e &
cha
ng
eo
ve
r w
aste
Un
de
r w
ieg
ht p
acks
OO
L in
gre
die
nts
Drip
lo
ss
Giv
ea
wa
y: o
ve
r sp
ec c
uts
Do
wn
gra
de
to
dic
e
Store WasteLogistics lossManufacturing wasteMeat cut & pack waste
Waste=11.5%
[32]

© S A Partners 2014© S A Partners 2014
Yield-loss and Giveaway
2 616
4348
73 74
115
35
64
15 8 1
65
MM
66
MM
67
MM
68
MM
69
MM
70
MM
71
MM
72
MM
73
MM
74
MM
75
MM
76
MM
77
MM
© S A Partners 2014
50% of food CO2 attributed to
“animal foods”

© S A Partners 2014
Customer benefits
• Better Quality
• More consistent product
• Better Customer Service
• Fresher products
• Higher availability
• Cost
• Lower prices
• Cash
• Lower Inventory
• Less environmental impact
© S A Partners 2014
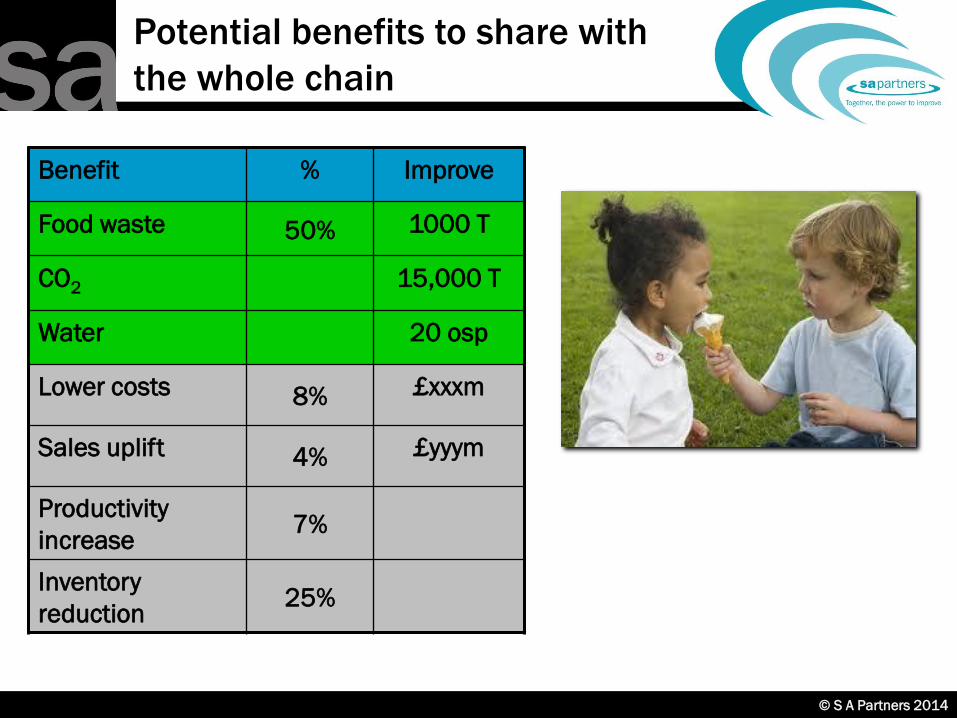
Potential benefits to share with
the whole chain
Benefit % Improve
Food waste 50% 1000 T
CO2 15,000 T
Water 20 osp
Lower costs 8% £xxxm
Sales uplift 4% £yyym
Productivity
increase7%
Inventory
reduction25%

© S A Partners 2014
Variation is the root of all evil
You need stability before you can pinpoint areas to improve
Pro
cess p
erfo
rmance
VARIATION STABILITY IMPROVEMENT