supply chain control towers: concept and impact · · 2014-01-21supply chain control towers:...
TRANSCRIPT
© AberdeenGroup 2011
Supply Chain
Control Towers:
Concept and Impact
October 31, 2012

© AberdeenGroup 2012 2
Webcast Panel
Bryan Ball Aberdeen Group
VP and Principal
Analyst
SCM Research
Practice
Kirk Munroe Kinaxis
VP of Marketing
© AberdeenGroup 2011
Supply Chain
Control Towers:
Concept and Impact
Bryan Ball
Vice President and
Principal Analyst
Supply Chain Practice
OCT 2012

© AberdeenGroup 2011 4
About Aberdeen and SCM Practice
Our Methodology
The Control Tower Business Case
Pressures
Actions
Capabilities
Power of the Tower
Enablers
Summary
Agenda

© AberdeenGroup 2011 5
Aberdeen’s SCM research coverage addresses the problems of today’s complex supply chains

© AberdeenGroup 2011 6
Aberdeen Supply Chain Research At a Glance
•Over 4100 of Supply Chain
Executives Surveyed over the past
year
•In-depth Online Supply Chain
Research – over 450 published
reports
•Over 27,000 Report Downloads
Yearly
•Over 79,000 Subscribers
•Annual Supply Chain
Management leadership
Summits
•Library of Research Topics
If your email program has trouble displaying this
message, click here to view online.
To ensure proper delivery of future Aberdeen Group emails, please click here.
About Aberdeen Complimentary Research Contact

© AberdeenGroup 2011 7
About Aberdeen and SCM Practice
Our Methodology
The Control Tower Business Case
Pressures
Actions
Capabilities
Power of the Tower
Enablers
Summary
Agenda

© AberdeenGroup 2011 8 Twitter: #scm #supplychain
The Maturity Class Framework
Selected Performance
Criteria (KPI)
Revenue Metrics
Cost Metrics
Campaign Metrics
Total
Respondents:
Top
20%
Middle
50%
Bottom
30% Respondents are scored
individually across KPI
Best-in-Class
Industry
Average
Laggard
8
Aberd
een
’s M
eth
od
olo
gy

© AberdeenGroup 2011 9 Twitter: #scm #supplychain
Aberdeen Maturity Class Framework
What are Best-in-Class
companies doing differently?
What pitfalls are they
avoiding?
Why are they achieving
greater success?
What technologies and
services are enabling them
to succeed?
Aberd
een
’s M
eth
od
olo
gy
C
E
Pressures:External and internal forces that impact an organization’s
market position, competitiveness, or business operations.
Actions:The strategic approaches that an organization takes in
response to industry pressures.Actions:The strategic approaches that an organization takes in
response to industry pressures.
Capabilities:The business competencies (organization, process, etc…)
required to execute corporate strategy.Capabilities:The business competencies (organization, process, etc…)
required to execute corporate strategy.
Enablers:The key technology solutions required to support the
organization’s business practices.

© AberdeenGroup 2011 10
About Aberdeen and SCM Practice
Our Methodology
The Control Tower Business Case
Pressures
Actions
Capabilities
Power of the Tower
Enablers
Summary
Agenda

© AberdeenGroup 2011 11
The Business Challenge
“What if” we could remove all information delay and
operate in real time for decision making?
Responses to customer inquiries on the spot.
What if questions answered in minutes, not hours/days
Is this notion of real time visibility and actionable insight
even feasible?
The "Holy Grail" for supply chain leaders has always been
to remove as much latency as possible in every aspect of
the supply chain
Control Towers have the potential to make this possibility
come alive!
© AberdeenGroup 2011 12
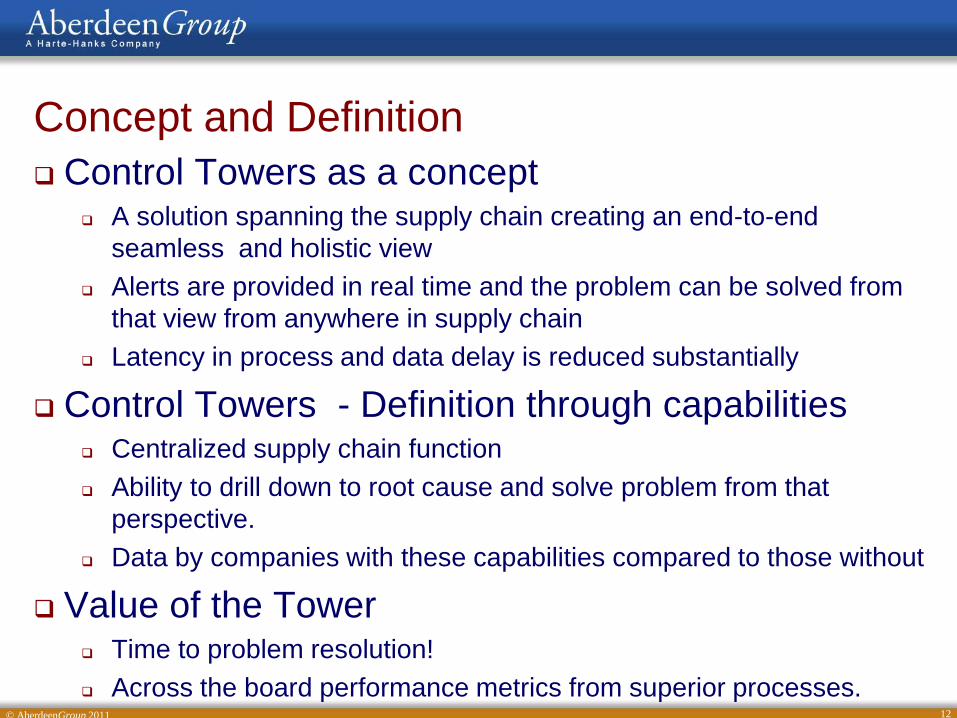
Concept and Definition
Control Towers as a concept A solution spanning the supply chain creating an end-to-end
seamless and holistic view
Alerts are provided in real time and the problem can be solved from
that view from anywhere in supply chain
Latency in process and data delay is reduced substantially
Control Towers - Definition through capabilities Centralized supply chain function
Ability to drill down to root cause and solve problem from that
perspective.
Data by companies with these capabilities compared to those without
Value of the Tower Time to problem resolution!
Across the board performance metrics from superior processes.

© AberdeenGroup 2011 13
About Aberdeen and SCM Practice
Our Methodology
The Control Tower Business Case
Pressures
Actions
Capabilities
Power of the Tower
Enablers
Summary
Agenda
© AberdeenGroup 2011 14
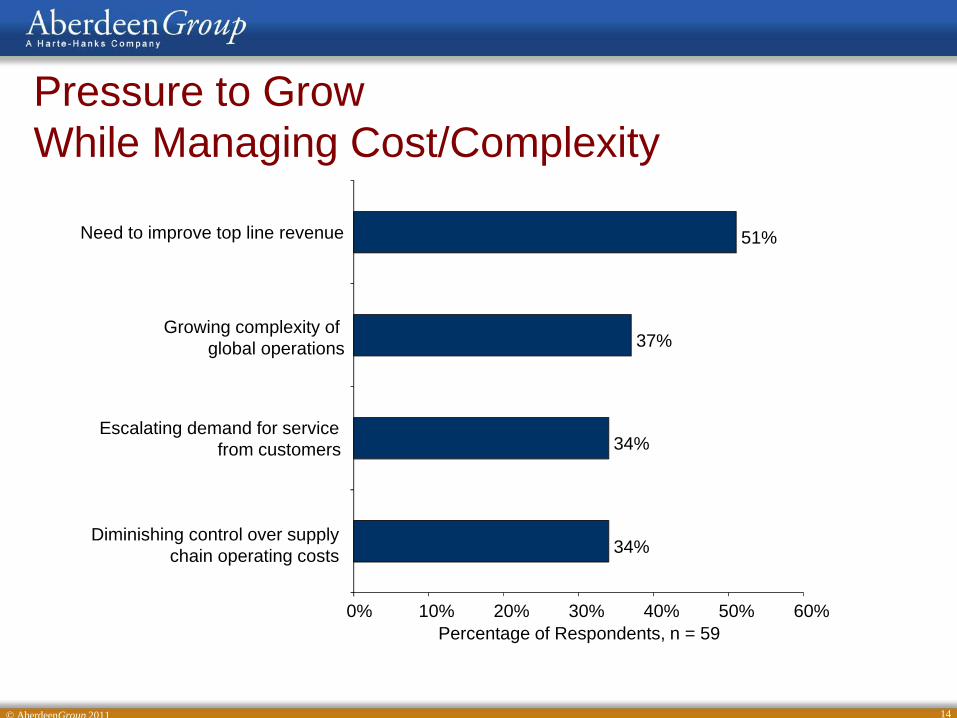
Pressure to Grow
While Managing Cost/Complexity
34%
34%
37%
51%
0% 10% 20% 30% 40% 50% 60%
Diminishing control over supply
chain operating costs
Escalating demand for service
from customers
Growing complexity of
global operations
Need to improve top line revenue
Percentage of Respondents, n = 59

© AberdeenGroup 2011 15
Behind the Pressures
Growth – how to manage profitably
Capacity, capital, systems, controls
Complexity
Additions of suppliers, partners, networks and geos
Lead time increases with extension of supply chain
Maintain current position and service level a challenge
Demand for service
Value added services, design, marketing, advertising
Installation or field support
Potential added cost in some form
Diminishing control over supply chain costs
Sum of challenges related to first three pressures
Speed of decision amplifies the cost challenge

© AberdeenGroup 2011 16
About Aberdeen and SCM Practice
Our Methodology
The Control Tower Business Case
Pressures
Actions
Capabilities
Power of the Tower
Enablers
Summary
Agenda

© AberdeenGroup 2011 17
Control Tower Actions
To Address Pressures
48%44%
36%
50%
24%
35%
0%
10%
20%
30%
40%
50%
60%
Streamline processes
for easier monitoring
Create multiple
scenarios to
analyze S&OP
Create collaboration
initiatives with suppliers
Pe
rce
nta
ge
of
Re
sp
on
de
nts
, n
= 6
1
Control Tower Non Control Tower

© AberdeenGroup 2011 18
Control Tower Actions
Similar actions between control tower vs. non–control tower
Streamlining processes to enable profitable growth.
End-to-end view
Getting the most out of processes and capacity
Multiple scenarios to support S&OP
Enabled by CT capabilities
View the challenge by testing the limits
All options considered, tradeoffs vetted
Breeds commitment at all levels, confidence before execution
End-to-end view considered at planning level
© AberdeenGroup 2011 19
About Aberdeen and SCM Practice
Our Methodology
The Control Tower Business Case
Pressures
Actions
Capabilities
Power of the Tower
Enablers
Summary
Agenda

© AberdeenGroup 2011 20
Process & Organization Capabilities
50%
41% 40%
30%
8%
3%
12%15%
0%
10%
20%
30%
40%
50%
60%
Manage critical
relationships end to endCreate and manage
multiple operational scenarios
View the supply
chain holistically
Profit optimized supply
demand matching
Pe
rce
nta
ge
of
Re
sp
on
de
nts
, n
=6
2
Control Tower Non Control Tower

© AberdeenGroup 2011 21
Control Tower Advantages
Understanding the Impact
Managing relationships end-to-end – making it happen with
confidence, 50% to 8%.
Multiple scenarios, 41% to 3%.
Command of the data, options and the timing.
Solution from end-to-end perspective.
Understanding the cross functional tradeoffs quickly.
Not guessing and hoping. Confidence in plan prior to execution.
View the supply chain holistically, 40% to 12%.
More than three times as likely – the basic premise behind CT’s.
Profit optimized supply demand match, 30% to 15%.
Twice as likely
Improved financials as a result

© AberdeenGroup 2011 22
About Aberdeen and SCM Practice
Our Methodology
Maturity Class Index
Pressures
Actions
Capabilities
Benefits
Enablers
Summary
Agenda
© AberdeenGroup 2011 23
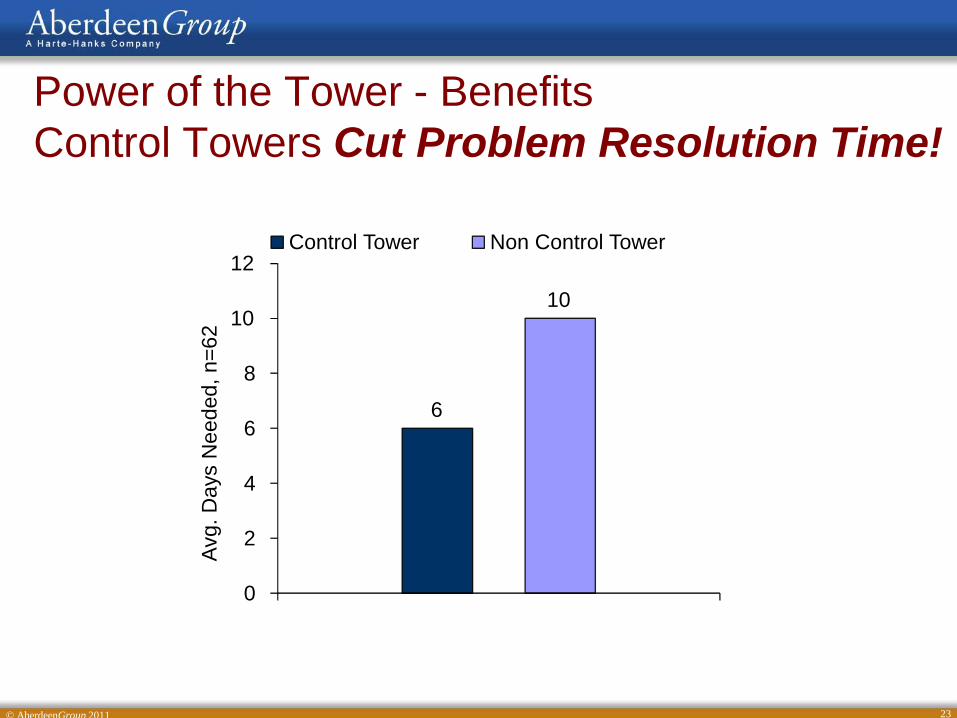
Power of the Tower - Benefits
Control Towers Cut Problem Resolution Time!
6
10
0
2
4
6
8
10
12
Avg
. D
ays N
ee
de
d,
n=
62
Control Tower Non Control Tower

© AberdeenGroup 2011 24
Power of the Tower – Benefits
Reduced Latency = Cash-to-Cash Cycle Gain!
49
56
44
46
48
50
52
54
56
58
Avg
. n
um
ber
of
da
ys,
n=
62
Control Tower Non Control Tower

© AberdeenGroup 2011 25
“Control Towers” Perform and Deliver

© AberdeenGroup 2011 26
Power of the Tower
Control Towers Perform and Deliver
40% less time to problem resolution -
Primary benefit of Control Towers
Huge process latency reduction.
Minimizes error throughout supply
Reduced Latency lowers Cash-to-Cash cycle by 13%
Control Towers have better metrics across the board.
Better forecast accuracy at SKU level, 68% to 48%.
Better forecast accuracy at product group level, 71% to 53%.
Better customer service, 94% to 89%.

© AberdeenGroup 2011 27
About Aberdeen and SCM Practice
Our Methodology
Maturity Class Index
Pressures
Actions
Capabilities
Enablers
Summary
Agenda
© AberdeenGroup 2011 28
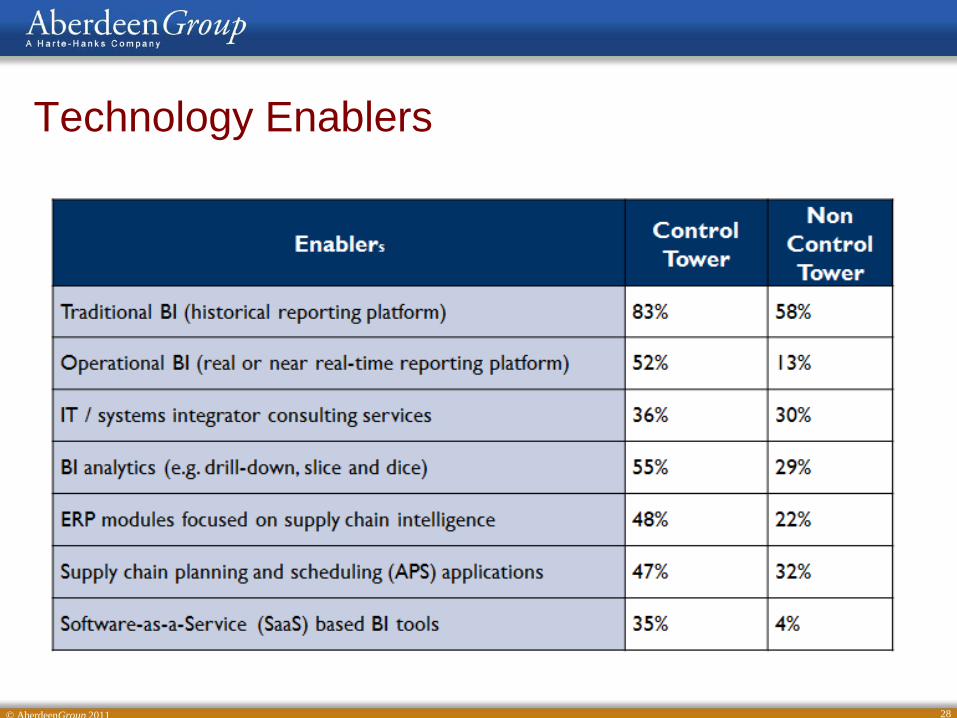
Technology Enablers
© AberdeenGroup 2011 29
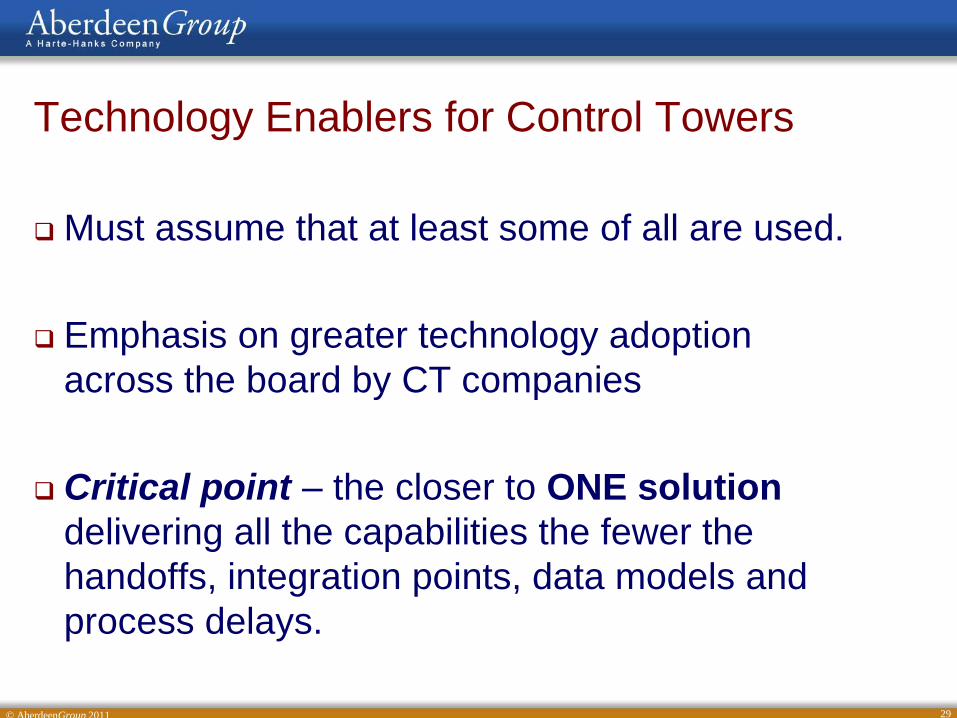
Technology Enablers for Control Towers
Must assume that at least some of all are used.
Emphasis on greater technology adoption
across the board by CT companies
Critical point – the closer to ONE solution
delivering all the capabilities the fewer the
handoffs, integration points, data models and
process delays.

© AberdeenGroup 2011 30
About Aberdeen and SCM Practice
Our Methodology
Maturity Class Index
Pressures
Actions
Capabilities
Enablers
Summary
Agenda

© AberdeenGroup 2011 31
Key Takeaways
The definition of Control Towers will continue to evolve.
Regardless of the ultimate definition, key capabilities are:
The ability to determine the impact of an event.
Who needs to know.
What team needs to be brought together to resolve the issue.
From our definition, we do know that CT companies
Have a centralized view with root cause drill down capability.
Are three times more likely to have personnel that view their supply
chains holistically as linked processes.
Are over 13 times more likely than their peers to have the ability to
create and manage multiple supply chain operational scenarios.
Have a substantial savings in time to problem resolution of 40% .
Cash-to-Cash cycle improvement of 7 days, equating to a 12.7%
reduction in deployed cash.

32 Copyright © 2012 Kinaxis Inc. All Rights Reserved.

33 Copyright © 2012 Kinaxis Inc. All Rights Reserved.
LCP ASPC
INVENTORY
OPTIMIZATION
DEMANTRA
S&OP SUPPLIER
COLLABORATION
APO-DM
SCP
D&F
APO-PS
• Limited to Functional Excellence
• Decision Latency
• Incomplete Global Representation

34 Copyright © 2012 Kinaxis Inc. All Rights Reserved.
… ENABLED BY A SINGLE CODE BASE CLOUD OFFERING …
A NEW PARADIGM:
Global Control Tower
for Operations
Customers
(CRM)
Outsourced Manufacturers
(ERP)
Channel Partners (various)
Enterprise
History (EDW) Brand Owner
(ERP)
Suppliers (EDI, portal)

35 Copyright © 2012 Kinaxis Inc. All Rights Reserved.
… ENABLED BY A SINGLE CODE BASE CLOUD OFFERING …
A NEW PARADIGM:
Global Control Tower
for Operations
• End-to-End Process Enablement
• Global Visibility and Alignment
• Fast and Accurate Decisions
Customers
(CRM)
Outsourced Manufacturers
(ERP)
Channel Partners (various)
Enterprise
History (EDW) Brand Owner
(ERP)
Suppliers (EDI, portal)

36 Copyright © 2012 Kinaxis Inc. All Rights Reserved.
HOURS
Disaster
Management
Total
Planning Cycle
New Order
Assessment
& Commit 0 300 700
Collapsing Planning Cycles
Kinaxis
Legacy
What if… You could reduce your planning cycle by 43%

37 Copyright © 2012 Kinaxis Inc. All Rights Reserved.
HOURS
Change to
Build Plan
Clear to
Build
New Demand
0 10
Fast and Accurate Decisions
20 30 40 50
What if… You needed an answer
within 2 hours?
Kinaxis
Legacy

© AberdeenGroup 2012 38
Questions and Discussion
Kirk Munroe Vice President of Marketing
Kinaxis
@KirkMunroe
Bryan Ball
Vice President/Principal Analyst
Supply Chain Management
Aberdeen Group
@BryanballSCM

© AberdeenGroup 2012 39
Thank You
© AberdeenGroup 2010 39
Conclu
sio
n