supplementary material 050714 - genes &...
TRANSCRIPT

1
Supplementary Material Supplementary Materials and Methods
Plasmid construction
The HA tagged full length LDB1 cDNA (375 aa) was cloned into the pYM-IRES-Neo vector and
various mutations and deletions of LDB1 were created (by site directed mutagenesis) in this
background. The shRNA target sequence located in the LID coding sequence of Ldb1 cDNA was
altered without changing the amino acid coding sequence of LDB1 protein. The shRNA target
sequence is underlined and mutated nucleotides are bolded and underlined:
Wild type: cgacgaggacagctttaacaa
Mutant: tgatgaagattcattcaataa
The dimerization domain of LDB1 (amino acids 1-200) was deleted and the K365R (AAA to
CGA) mutation at 3’ end of Ldb1 cDNA was introduced to stabilize the protein thus created.
Deletions in the LDB1 DD included sequences encoding amino acids 31 to 43 (Δ1), 58-62 (Δ2),
86 to 97 (Δ3) or 173 to 192 (Δ4/5). DD-only proteins were created by deletion of LDB1 C-
terminal sequences encoding amino acids 201-375. Further details of cloning are available upon
request. For the LMO2 fusion (2xLMO2), LMO2 cDNAs were tethered in the sense orientation
through a flexible linker (22-aa polypeptide [GT(GGGS)4GGGT]) (Wang et al., 2008).
Co-immunoprecipitation
Protein complexes were precipitated with anti-HA agarose (Sigma, A2095) overnight at 4oC.
Agarose was washed 3 times with IP100 buffer (Brand et al., 2004). Bound proteins were eluted
with HA peptides (Sigma) and analyzed by western blot. For LDB1/FOG1 experiments, the
protein complexes were precipitated overnight at 4oC by antibodies against LDB1 or FOG1 and
Dynabeads® Protein G (Life Technologies, 10004D), then washed once with IP500 and two
times with IP100 and eluted as described (Brand et al., 2004).
2
RNA-seq library construction, sequencing and computational analysis
RNA-seq libraries were constructed for induced MEL WT cells, LDB1 KD cells and LDB1 KD
cells expressing either LDB1 FL or LDB1Δ4/5 using TruSeq RNA Sample Prep Kit V2
(Illumina) according to the manufacturers protocol. Three biological replicates of each cell type
were sequenced on a HiSeq 2000. Illumina TruSeq adapters from the 51-bp single-end reads
were clipped using cutadapt v.1.1 with default parameters (Martin, 2011). Clipped reads were
then mapped to the UCSC mm9 assembly with TopHat v1.4.1 (Trapnell et al., 2009) using
default parameters with the additional parameter--butterfly-search. The number of uniquely
mapped reads for each library ranged from 13 to 55M, with a median of 24M. Reads mapping to
repetitive regions defined by the UCSC RepeatMasker track were removed from further analysis.
Reads were counted in exons of the Ensembl release 67 GTF for mm9, using HTSeq 0.5.3p9.
Differential expression of genes for all pairwise comparisons was assessed with DESeq v1.10.1
(Anders and Huber, 2010).
We defined genes repressed by LDB1 KD as those that, in the DESeq analysis, had an adjusted
P value < 0.05 and a log2 fold change < -1 in gene expression between LDB1 KD cells and WT.
To define rescued genes, we first used the variance-stabilized transformation (VST) in the
DESeq package to obtain comparable scaled counts for all experiments. VST-scaled counts for
replicates were averaged to obtain per-treatment values. Then, rescued genes were defined as
those LDB1 KD repressed genes with equal or greater expression in LDB1 KD cells expressing
LDB1 FL than WT, or, if genes have lower expression in LDB1 KD cells expressing LDB1 FL
than WT, whose expression difference between WT and LDB1 FL expressing cells was less than
half the expression difference between WT and LDB1 KD cells. More precisely, a gene was
defined as rescued if it was an LDB1 KD repressed gene and satisfied the condition:
((WT - LDB1 FL) < 0) OR ((WT - LDB1 FL) < (0.5 * (WT - LDB1 KD)) AND ((WT - LDB1
FL) > 0)), where "WT", "LDB1 FL", and "LDB1 KD" are the averaged, VST- scaled counts for
each treatment.
Next, of the genes that were rescued by LDB1 FL, we defined a gene to be 4/5-dependent if it
was repressed in LDB1 KD cells expressing LDB1Δ4/5 compared to LDB1 KD cells expressing
3
LDB1 FL (that is, log2 fold change < -1 and adjusted P value < 0.05). Otherwise, it was defined
as 4/5-independent. Since the transcribed sequence for LDB1 differs between LDB1 delta 4/5
and LDB1 FL, we removed LDB1 from consideration in the downstream RNA-seq rescue and
4/5-dependence analysis. Finally, genes were defined to be LDB1 bound if there was an LDB1
peak in induced MEL cells within 1kb of the start position of the gene, inside gene body or
within 1 kb of the end position of the gene ((Soler et al., 2010); BED file downloaded from the
PSU genome browser, http://main.genome-browser.bx.psu.edu). The OMIM database was
downloaded from a URL provided by omim.org (September 2013). A combination of Ensembl's
BioMart (mapping human HGNC to orthologous mouse Ensembl IDs) and the "mousecorr" field
in the OMIM database were used to identify human homologs of mouse genes. An OMIM entry
was considered orthologous in mouse if one of these methods successfully mapped the HGNC
human gene symbol to a mouse Ensembl gene.
Primers
ChIP primers Alas2 + 2kb Fw AGGGCAGGACTTTGCCTCTAATCTAlas2 + 2kb Rev AGATGTCCCAGTTCCTGCAGGTTTGypA Fw GTCCTCGCAGTTATGCAGAC GypA Rev GGCCTCTATCCGTTGACACA α-globin HS26 Fw TGACCATAGTCAACAGCAGGT α-globin HS26 Rev GCTCGTTCAAGCATCTCCAT A730036l17Rik Fw TCAAAACTCTGCCTCCTCCC A730036l17Rik Rev GATAGGTGAAAAGGCGCCAG Kctd14 Fw CTTAGAGTTCCTCAGGGGCG Kctd14 Rev GGGTACACAACGCTGTCTTG Ubash3a Fw TTTTCTTCACAGCCTCAGCC Ubash3a Rev CCATGTCTTCCTGCTTGCTG CD24a Fw AACAAAGGAAACTTGGGCCG CD24a Rev CTCTGGCACAGCTAGGGTTT Treml1 Fw TGTCAGCCTCGATGGATAGC Treml1 Rev GCTGGGCAGTAGTAGGTTCT Ypel3 Fw CAGCCCTTTCTCTCCTTCCA Ypel3 Rev TCCCAGCCGTTGTCTTTGAT
qRT-PCR primers α-globin Fw GCTGAAGCCCTGGAAAGGAT α-globin Rev GGCTTACATCAAAGTGAGGAAAGT Alas2 Fw CCATCTTAAGGCAACCAAGGC
4
Alas2 Rev ACAGCATGAAAGGACAATGGC GypA Fw ATTCATGTCTCAACTTATCACA GypA Rev CCAATGTGTGGTGAGACAGGCT A730036l17Rik Fw GCATTCAGGACTTGCTCTGG A730036l17Rik Rev GTCCTCACACTTGGCTTGTG Kctd14 Fw ATGCCACAGATCTTCGGTGA Kctd14 Rev AGGACCTCCAGGTTTTCTCTG Ubash3a Fw GCCAGTAAAGACGCTGACAC Ubash3a Rev ACCTCTTCCTGGAAAGCTCG CD24a Fw AGTAACGCTACCACCAGAGG CD24a Rev GTTTCCTGGCCTGAGTCTCT Treml1 Fw GATCCACCATCAAGCGAACC Treml1 Rev TCCTGGGAAGACAACTGTGG Ypel3 Fw CATGTGGCTTCAGCCTGG Ypel3 Rev GTACAGGAGCTGGGTCCTTC Neo Fw TCGACGTTGTCACTGAAGCG Neo Rev GGATACTTTCTCGGCAGGAGC Ldb1’UTR Fw GGGGTACTCATGTGGATGCCTGT Ldb1 3’UTR Rev ACCCAGAACCTGGGGTAAGAACG Hprt Fw TGACACTGGTAAAACAATGCAAACT Hprt Rev AACAAAGTCTGGCCTGTATCCAA
All other primers have been described (Song et al., 2007; Handoko et al., 2011).
Antibodies
Antibodies used for western blots were against HA (Roche, 11867423001), Tubulin (Sigma,
T5168), LDB1 (Santa Cruz Biotechnology, sc-11198), TAL1 (Santa Cruz Biotechnology, sc-
12984), FOG1 (Santa Cruz Biotechnology, sc-9361), ETO2 (Santa Cruz Biotechnology, sc-
9739), GATA1 (Santa Cruz Biotechnology, sc-265), LMO2 (R&D, AF2726) and appropriate
HRP-fused secondary antibodies from Santa Cruz Biotechnology or Goat TrueBlot®: Anti-Goat
IgG HRP (Rockland Immunochemicals, 18-8814-33).
Antibodies from Santa Cruz Biotechnology were used in ChIP for GATA1 (sc-1233), BRG1 (sc-
10768), Pol II (sc-899), FOG1 (Santa Cruz Biotechnology,sc-9361), MTA2 (sc-9474), HDAC1
(sc-7872), CBP (sc-369) and LAMB1 (sc-6217). Other antibodies were against AcH3 (Millipore,
06-599), H3 (Abcam, ab1791), and HA (Millipore, 05-904).
For immuno-staining antibody against LAMB1 (Santa Cruz Biotechnology, sc-6216) and
secondary anti-Goat DyLight 594 (Jackson ImmunoResearch, 805-515-180) were been used.

5
Supplementary References
Anders S, Huber W. 2010. Differential expression analysis for sequence count data. Genome. Biol. 11:
R106.
Brand M, Ranish JA, Kummer NT, Hamilton J, Igarashi K, Francastel C, Chi TH, Crabtree GR, Aebersold
R, Groudine M. 2004. Dynamic changes in transcription factor complexes during erythroid
differentiation revealed by quantitative proteomics. Nat. Struct. Mol Biol. 11: 73-80.
Handoko L, Xu H, Li G, Ngan CY, Chew E, Schnapp M, Lee CW, Ye C, Ping JL, Mulawadi F et al. 2011.
CTCF-mediated functional chromatin interactome in pluripotent cells. Nat Genet 43: 630-638.
Martin M. 2011. Cutadapt removes adaptor sequences from high-throughput sequencing reads.
EMBnet. journal 17: 10-12.
Soler E, Andrieu-Soler C, de Boer E., Bryne JC, Thongjuea S, Stadhouders R, Palstra RJ, Stevens M,
Kockx C, van IW et al. 2010. The genome-wide dynamics of the binding of Ldb1 complexes during
erythroid differentiation. Genes Dev 24: 277-289.
Song S-H, Hou C, Dean A. 2007. A positive role for NLI/Ldb1 in long-range -globin locus control
region function. Mol. Cell 28: 810-822.
Trapnell C, Pachter L, Salzberg SL. 2009. TopHat: discovering splice junctions with RNA-Seq.
Bioinformatics. 25: 1105-1111.
Wang J, Levasseur DN, Orkin SH. 2008. Requirement of Nanog dimerization for stem cell self-renewal
and pluripotency. Proc. Natl. Acad. Sci U. S. A. 105: 6326-6331.
Supplementary Figure Legends
Figure S1. LDB1 FL fully rescues β-globin expression in induced LDB1 KD MEL cells. (A)
Diagram of LDB1 FL cDNA expressed in induced LDB1 KD MEL cells. Colored rectangles:
purple, HA tag; green, DD domain; orange, nuclear localization signal (NLS); yellow, LID. (B)
Western blot of protein extracts from three induced LDB1 FL-expressing LDB1 KD MEL cell
lines with LDB1 or HA antibodies. α-tubulin served as loading control. (C) β-globin and
6
endogenous LDB1 gene expression in three induced LDB1 FL-expressing LDB1 KD MEL cell
lines. Induced cells containing an empty vector (Empty) served as a control. Expression in
induced WT MEL cells was set to 1. Error bars indicate SEM, N=3 biological replicates.
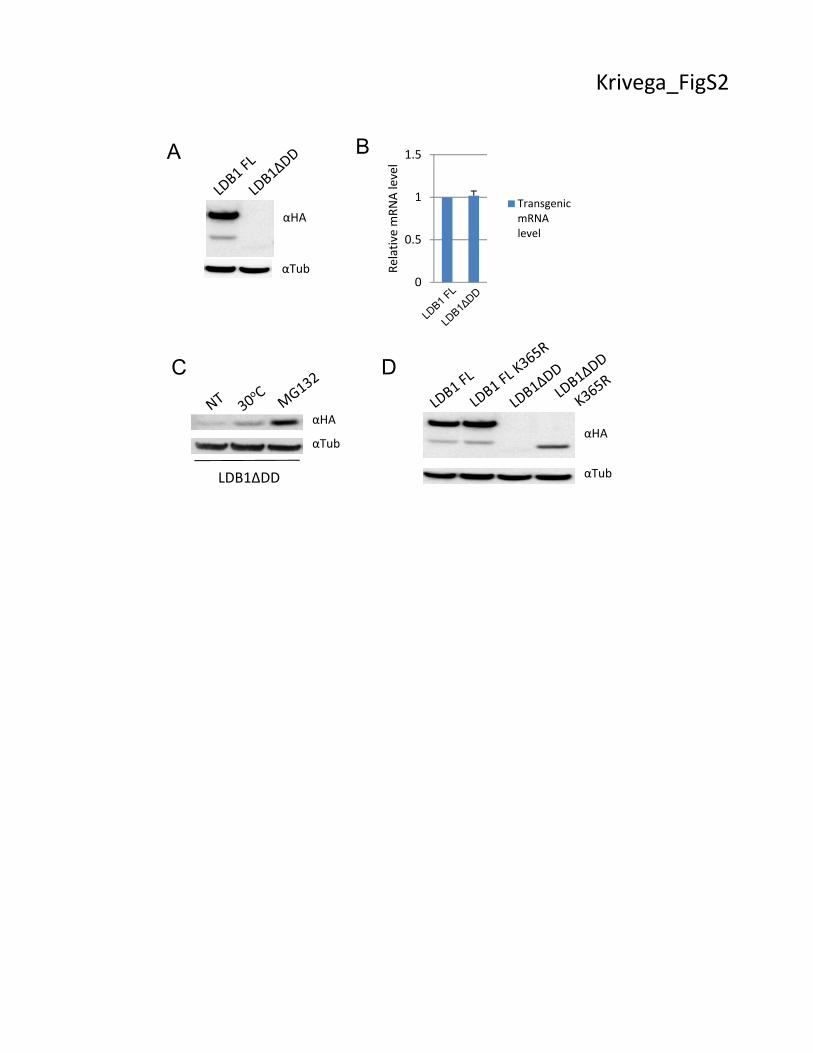
Figure S2. K365R mutation stabilizes LDB1ΔDD. (A) Western blotting of protein extracts
from LDB1 KD MEL cells expressing LDB1 FL and LDB1ΔDD with antibodies against HA. α-
tubulin served as loading control. (B) Expression level of transgenic RNA measured by real-time
PCR with primers to neo-resistant gene. Expression level in LDB1 FL was set to 1. Error bars
indicate SEM, N=3. (C) Western blotting of protein extracts from LDB1 KD MEL cells
expressing LDB1ΔDD incubated at 30o C overnight or treated with 26S proteasome inhibitor
MG132 with antibodies against HA. α-tubulin served as loading control. (D) Western blotting of
protein extracts from LDB1 KD MEL cells expressing LDB1 FL, LDB1 FL K365R, LDB1ΔDD
and LDB1ΔDD K365R with antibodies against HA. α-tubulin served as loading control.
Figure S3. Heterologous dimerizing or physical tethering of LMO2 fails to rescue activation
of β-globin gene expression. (A) Expression level of the β-globin gene in induced MEL LDB1
KD cell lines expressing LDB1 FL, LMO-Lex, 2xLMO2 or GATA1-DD. (B) Locus-wide
crosslinking frequencies analyzed by 3C-qPCR using the LCR HS2 as the anchor fragment (red
vertical bar). Relative crosslinking frequencies observed in induced LDB1 KD MEL cell lines
expressing LDB1 FL, LMO-DD, LMO-Lex, 2xLMO2 or GATA1-DD or containing an empty
expression vector are shown. The X-axis shows the genomic coordinates of the interacting
fragments and globin gene locations in the locus. Yellow triangles mark BglII restriction sites.
Error bars in both panels indicate SEM, N=3 biological replicates.
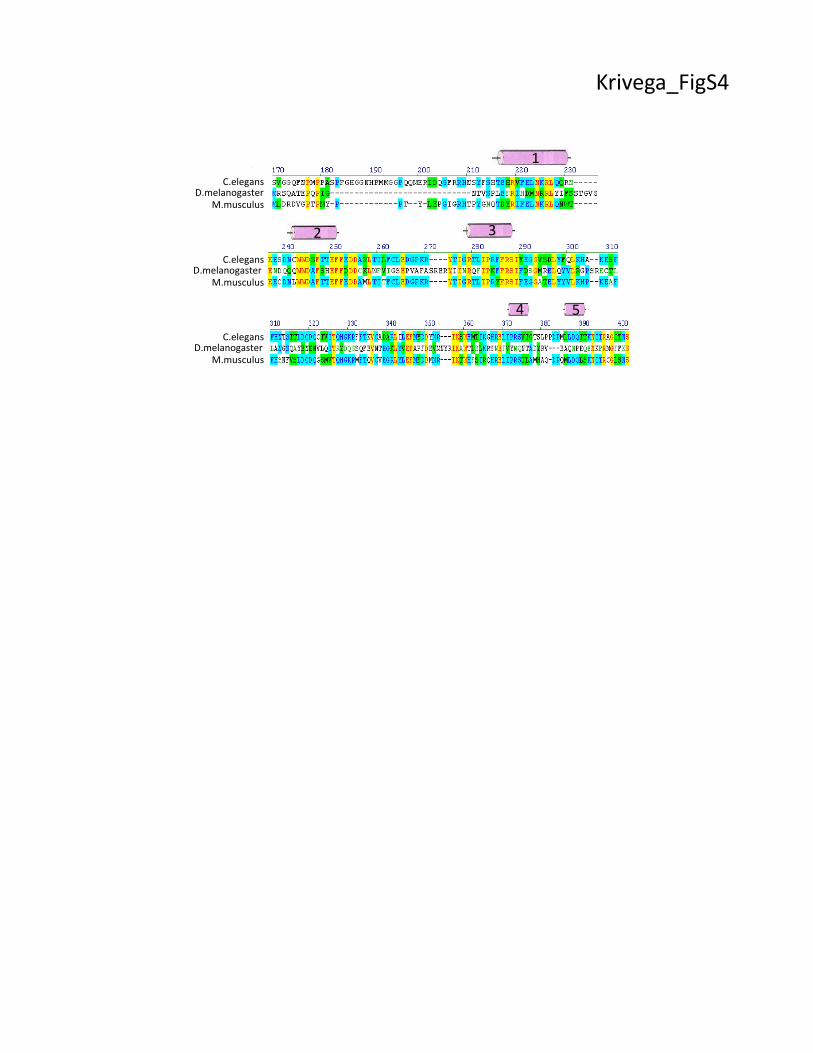
Figure S4. Conserved and structural elements in DD domain of LDB1. Alignment of amino
acid sequences of LDB1 homologs from M. musculus, D.melanogaster and C.elegans. Yellow
color marks coincidence in all sequences, blue – in two, green - conserved substitutions.
Cylinders mark potential helical regions.
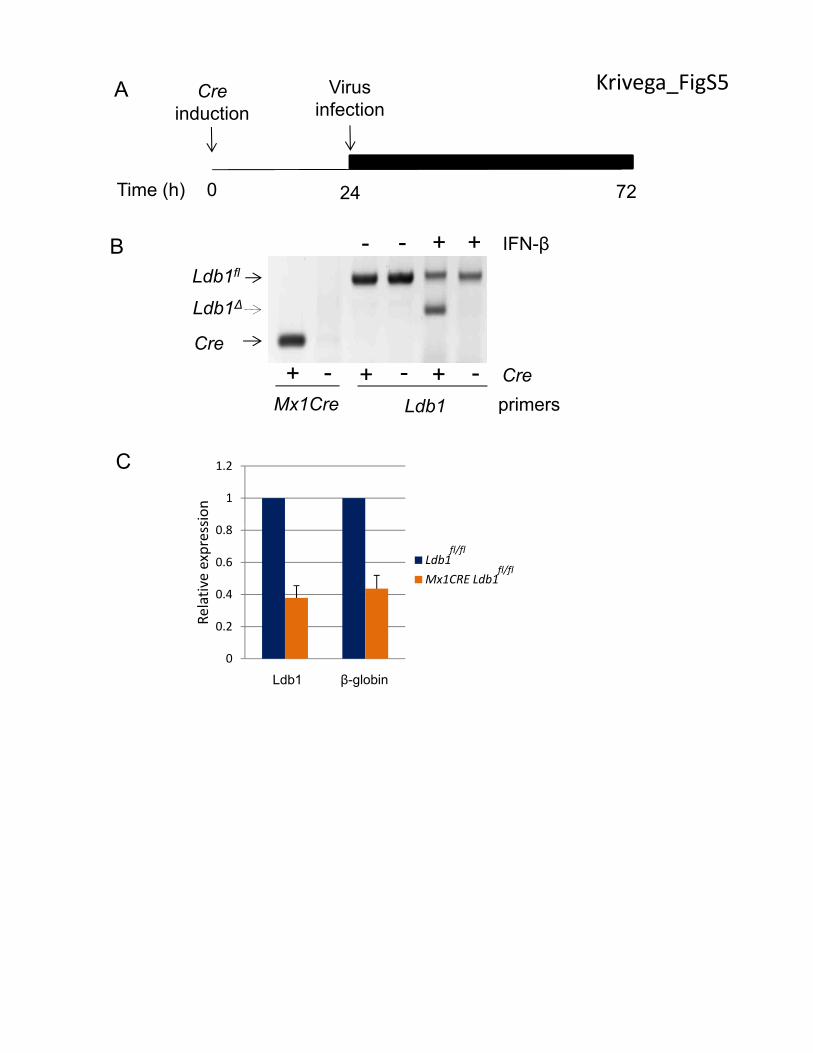
Figure S5. Inducible deletion of endogenous LDB1 in E14.5 fetal liver cells. (A)
Experimental strategy of endogenous Ldb1 deletion and overexpression of transgenic versions of

7
LDB1. (B) Ldb1 deletion in E14.5 Ldbfl/fl fetal liver cells with and without Mx1CreDNA was
analyzed by PCR of genomic DNA for the presence of the Mx1Cre, Ldb1 deleted allele (Ldb1Δ)
and floxed allele (Ldb1fl) before and after IFN-β treatment. (C) Expression level of Ldb1 and β-
globin genes in Mx1Cre Ldb1fl/fl and control Ldb1fl/fl E14.5 fetal liver cells after 3 days of IFN-β
treatment. Expression level in control cells was set to 1. Error bars indicate SEM, N=3 biological
replicates.
Figure S6. DD4/5 region is not required for LDB1 dimerization. (A) Diagram of cDNAs of
DD and deleted versions without the LDB1 C-terminal LID that were expressed in wild type
MEL cells. Designations are the same as Figure 2A. (B) Western blots of protein extracts from
representative wild type MEL cells expressing the indicated proteins. α-tubulin served as loading
control. (C) Immunoprecipitation (IP) was performed with an antibody to the HA tag using
nuclear extracts from induced WT MEL cells expressing the DD (left panel). IP material was
analyzed by western blot with antibodies to LDB1, LMO2 and TAL1. The DD interacted with
endogenous LDB1 and through this interaction with LDB1 complex members LMO2 and TAL1.
Antibodies to the HA tag and ETO2 served as positive and negative controls. IP and western
blotting for cells expressing DDΔ1 or DDΔ4/5 were performed in the same way (right panels).
(D) β-globin expression in induced MEL cells expressing DD, DDΔ1 or DDΔ4/5 compared to
induced WT MEL cells (set to 1). Error bars indicate SEM, N=3 biological replicates.
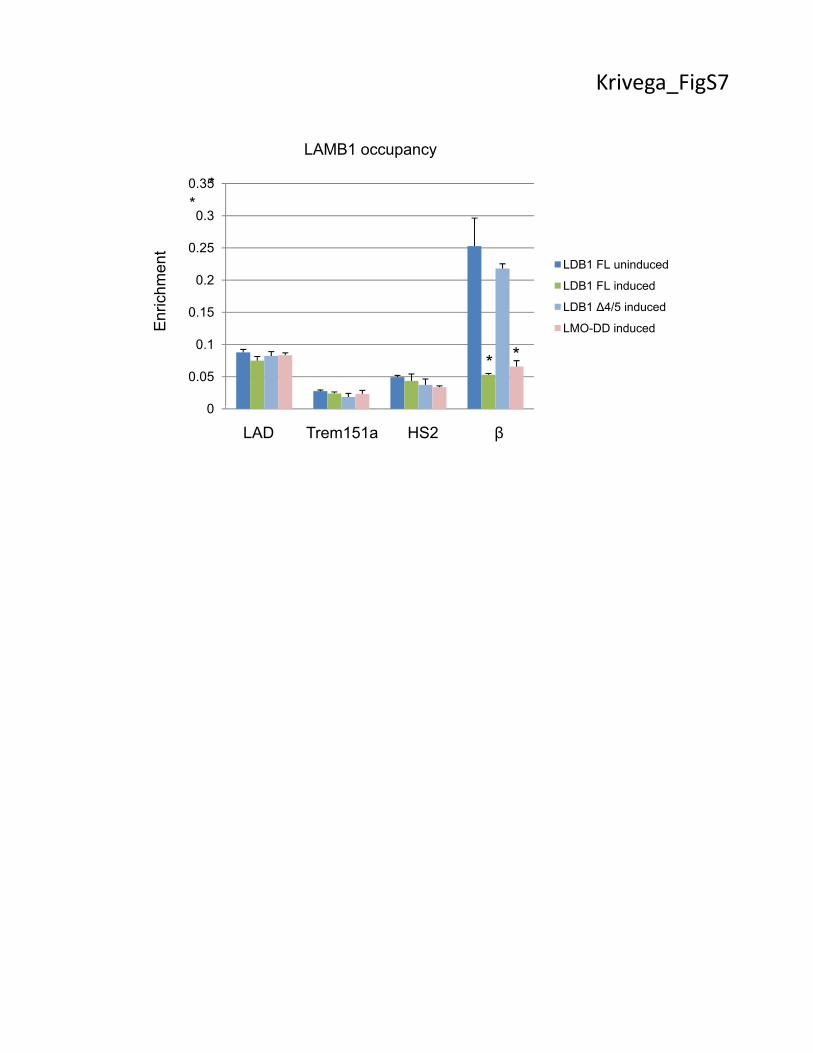
Figure S7. Association of LAMB1 with the β-globin locus. ChIP was performed with a
LAMB1 antibody and chromatin from uninduced LDB1 KD MEL cells expressing LDB1 FL and
induced LDB1 KD MEL cells expressing LDB1 FL, LDB1Δ4/5 or LMO-DD. LAD served as
positive control and Trem151a served as a negative control (Handoko et al., 2011). Error bars
indicate SEM, N=3 biological replicates. Values are compared to the value for uninduced LDB1
KD cells expressing LDB1 FL and * indicates P<0.05 by Student’s t-test.
Figure S8. Failure to recruit BRG1 affects DNase I sensitivity. Nuclei from induced LDB1
KD MEL cells expressing LDB1 FL, LDB1Δ4/5, LMO-DD or containing an empty expression
vector were digested with increasing amounts of DNase I (from left to right: 15, 30, 45 U).
DNase I sensitivity was normalized by signal from coding region of actB gene. Values are
8
compared to the value for LDB1 FL and * indicates P<0.05 by Student’s t-test. (A) HS2 region
DNase I sensitivity. (B) β-globin promoter DNAseI sensitivity. Error bars in both panels indicate
SEM, N=3 biological replicates.
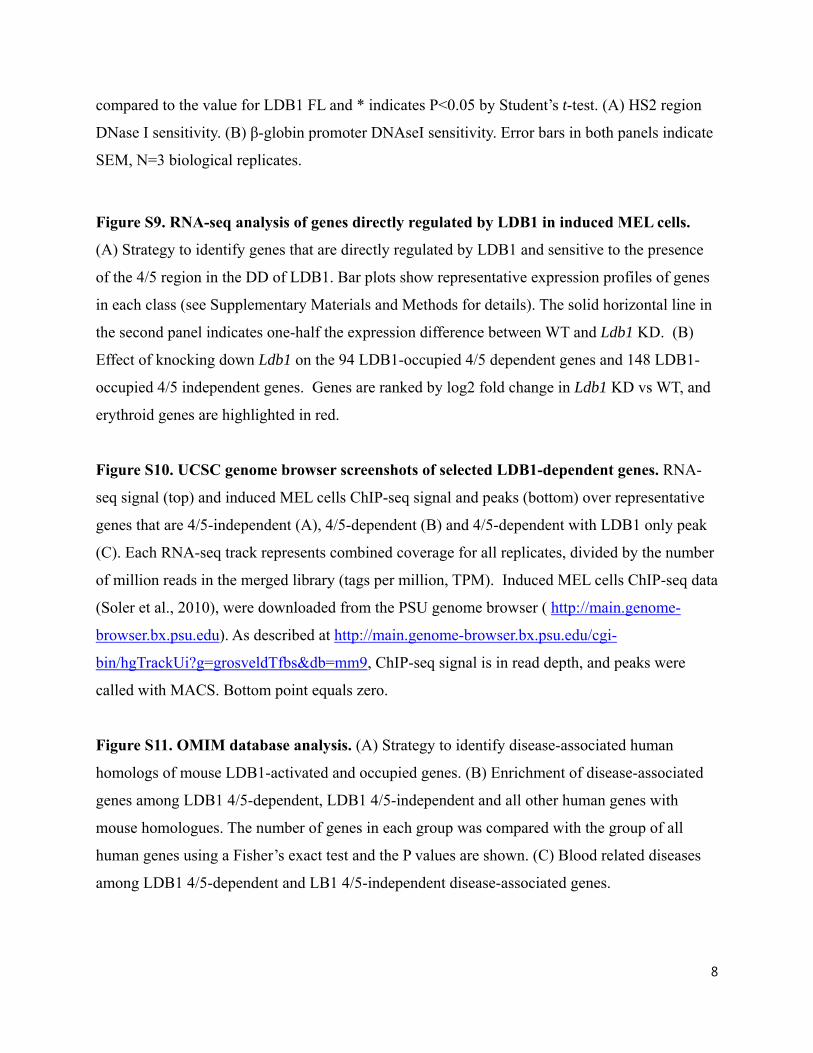
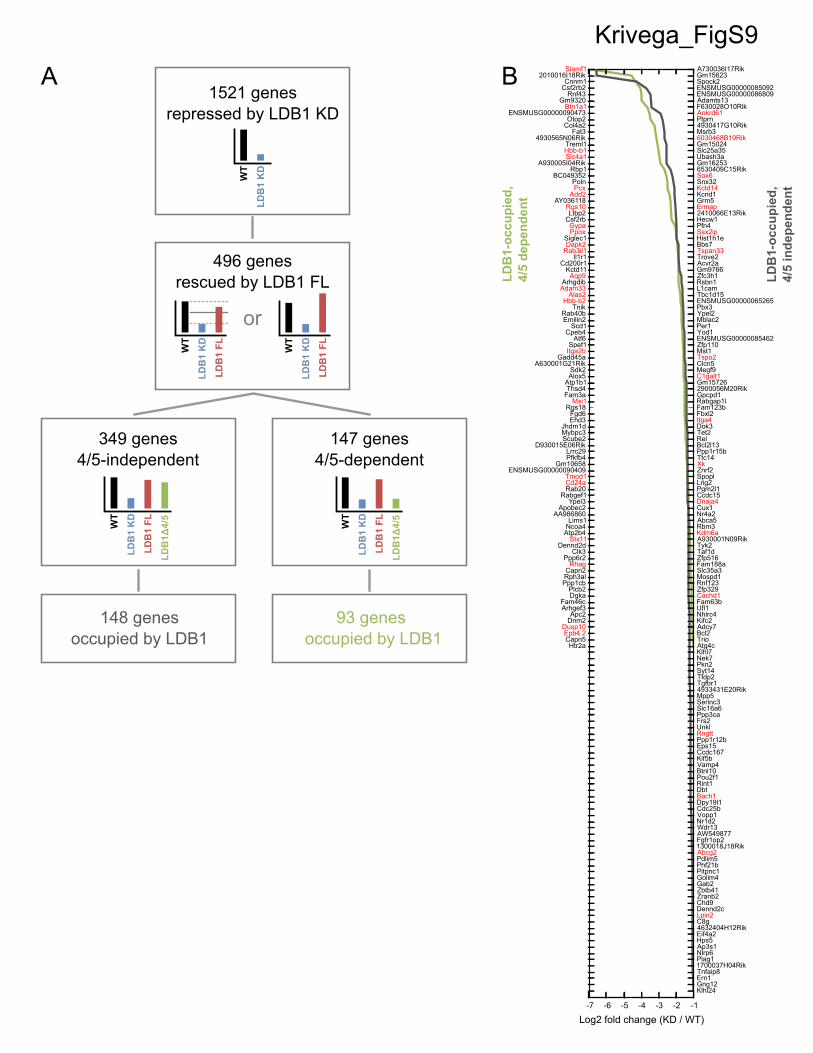
Figure S9. RNA-seq analysis of genes directly regulated by LDB1 in induced MEL cells.
(A) Strategy to identify genes that are directly regulated by LDB1 and sensitive to the presence
of the 4/5 region in the DD of LDB1. Bar plots show representative expression profiles of genes
in each class (see Supplementary Materials and Methods for details). The solid horizontal line in
the second panel indicates one-half the expression difference between WT and Ldb1 KD. (B)
Effect of knocking down Ldb1 on the 94 LDB1-occupied 4/5 dependent genes and 148 LDB1-
occupied 4/5 independent genes. Genes are ranked by log2 fold change in Ldb1 KD vs WT, and
erythroid genes are highlighted in red.
Figure S10. UCSC genome browser screenshots of selected LDB1-dependent genes. RNA-
seq signal (top) and induced MEL cells ChIP-seq signal and peaks (bottom) over representative
genes that are 4/5-independent (A), 4/5-dependent (B) and 4/5-dependent with LDB1 only peak
(C). Each RNA-seq track represents combined coverage for all replicates, divided by the number
of million reads in the merged library (tags per million, TPM). Induced MEL cells ChIP-seq data
(Soler et al., 2010), were downloaded from the PSU genome browser ( http://main.genome-
browser.bx.psu.edu). As described at http://main.genome-browser.bx.psu.edu/cgi-
bin/hgTrackUi?g=grosveldTfbs&db=mm9, ChIP-seq signal is in read depth, and peaks were
called with MACS. Bottom point equals zero.
Figure S11. OMIM database analysis. (A) Strategy to identify disease-associated human
homologs of mouse LDB1-activated and occupied genes. (B) Enrichment of disease-associated
genes among LDB1 4/5-dependent, LDB1 4/5-independent and all other human genes with
mouse homologues. The number of genes in each group was compared with the group of all
human genes using a Fisher’s exact test and the P values are shown. (C) Blood related diseases
among LDB1 4/5-dependent and LB1 4/5-independent disease-associated genes.

ALDB1 FL
Krivega_FigS1
αLDB1αHAαTub
HA-LDB1 FL
DD NLS LID
B
1
1.2
1.4β-globin Endogenous Ldb1C
αTubon
0
0.2
0.4
0.6
0.8
LDB1 FL
Exp
ress
io
LDB1 FL
1.5
l
A B
Krivega_FigS2
αHA
αTub0
0.5
1
Relative mRNA leve
Transgenic mRNA level
C D
αHA
αTub
αHA
αTub
LDB1ΔDD

Krivega_FigS3
A1.4
0 4
0.6
0.8
1
1.2
obin expression
0
0.2
0.4
‐glo
HS2
B
slinkingfreq
uen
cy
6
8
10
12Empty
LDB1 FL
LMO‐Lex
2xLMO2
GATA‐DD
Relative cros
Chr 70
2
4
103659323 103679323 103699323 103719323
εyβH1βmajβmin
1
Krivega_FigS4
2 3
C.elegansD.melanogaster
M.musculus
C.elegansD.melanogaster
M.musculus
4 5
C.elegansD.melanogaster
M.musculus
Virus infection
Creinduction
A Krivega_FigS5
Ldb1fl
IFN-β- + +B -
Time (h) 0 24 72
Mx1Cre
Cre
Ldb1∆
Ldb1
-primers
Cre- -+ + +
0 8
1
1.2
sion
C
Mx1Cre Ldb1 primers
0.2
0.4
0.6
0.8
Relative expres
Ldb1
Mx1CRE Ldb1
fl/fl
fl/fl
0
β-globinLdb1

Krivega_FigS6
A
αΗΑ
αTub
A
DD∆1
2 3 4 51 DD2 3 4 5
DD∆4/52 31
B
DC
αLDB1
αLMO2
αTAL1Input
DDΔ4/5
αHA
InputDD
InputDDΔ1
αLDB1
0.4
0.6
0.8
1
1.2
obin Expression
D
αETO2
αHA
WT MEL cells
DDΔ4/5
αHA
αLDB1
0
0.2
induced WT
DD DDΔ1 DDΔ4/5
β‐glo
Krivega_FigS7
LAMB1 occupancy
0.2
0.25
0.3
0.35
LDB1 FL uninduced
LDB1 FL induced
* *
men
t
0
0.05
0.1
0.15
LDB1 FL induced
LDB1 ∆4/5 induced
LMO-DD inducedEnr
ich
* *
0
LAD HS2 βTrem151a

8
HS22y
β promoterA B
Krivega_FigS8
2
4
6
8
tive DNaseIsensitivity
Empty
Ldb1 FL
Ldb1 Δ4
LMO‐DD0.5
1
1.5
tive DNaseI sen
sitivity
Empty
Ldb1 FL
Ldb1 Δ4
LMO‐DD
* *
* **
*
** *
*LDB1 FL LDB1 FL
LDB1Δ4/5 LDB1Δ4/5
0
15U 30U 45U
Relat
0
15U 30U 45U
Rela
Krivega_FigS9A730036I17RikGm15623Spock2ENSMUSG00000085092ENSMUSG00000086809Adamts13F630028O10RikAnkrd61Ptprn4930417G10RikMsrb36030468B19RikGm15024Slc25a35Ubash3aGm162536530409C15RikSox6Snx32Kctd14Kcnd1Grm5Ermap2410066E13RikHecw1Pfn4Ssx2ipHist1h1eBbs7Tspan33Trove2Acvr2aGm9766Zfc3h1Rsbn1L1camTbc1d15ENSMUSG00000065265Pbx3Ypel2Mblac2Per1Yod1ENSMUSG00000085462Zfp110Mst1Tspo2Clcn5Megf9C1galt1Gm157262900056M20RikGpcpd1Rabgap1lFam123bFbxl2Itga4Dok3Tet2RelBcl2l13Ppp1r15bTtc14XkZnrf2SpoplLrig2Pgm2l1Ccdc15Dnaja4Cux1Nr4a2Abca5Rbm3Kdm6aA930001N09RikTyk2Taf1dZfp516Fam188aSlc35a3Mospd1Rnf123Zfp329Cachd1Fam63bUfl1Nhlrc4Kifc2Adcy7Bcl2TrioAtg4cKlhl7Nek7Pkn2Syt14Tfdp2Tgfbr14933431E20RikMpp5Serinc3Slc16a6Ppp3caFrs2UnklRngttPpp1r12bEps15Ccdc167Kif5bVamp4Btnl10Pou2f1Rint1DbtBach1Dpy19l1Cdc25bVopp1Nr1d2Wdr13AW549877Fgfr1op21300018J18RikAbcg2Pdlim5Phf21bPitpnc1Golim4Gab2Zbtb41Zranb2Chd9Dennd2cLpin2C8g4632404H12RikEif4a2Hps5Ap3s1Nlrp6Plag11700037H04RikTnfaip8Ern1Gng12Klhl24
-1-2-3-4-5-6-7
Log2 fold change (KD / WT)
LD
B1-
occ
up
ied
,4/
5 in
dep
end
ent
Slamf12010016I18Rik
Cnnm1Csf2rb2
Rnf43Gm9320
Btn1a1ENSMUSG00000090473
Otop2Col4a2
Fat34930565N06Rik
Treml1Hbb-b1Slc4a1
A930005I04RikRbp1
BC049352PolnPcx
Add2AY036118
Rgs10Ltbp2
Csf2rbGypaPpox
Siglec1Dapk2
Rab3il1Il1r1
Cd200r1Kctd11
Aqp9ArhgdibAdam33
Alas2Hbb-b2
TnikRab40bEmilin2
Scd1Cpeb4
Atf6Spef1
Itga2bGadd45a
A630001G21RikSdk2Alox5
Atp1b1Thsd4
Fam3aMxi1
Rgs18Fgd6Ehd3
Jhdm1dMybpc3Scube2
D930015E06RikLrrc29Pfkfb4
Gm10658ENSMUSG00000090409
Tmod1Cd24aRab20
Rabgef1Ypel3
Apobec2AA986860
Lims1Ncoa4
Atp2b4Stx11
Dennd2dClk3
Ppp6r2Rhag
Capn2Rph3alPpp1cb
Plcb2Dgka
Fam46cArhgef3
Apc2Dnm2
Dusp10Epb4.2Capn5Htr2a
1521 genesrepressed by LDB1 KD
496 genesrescued by LDB1 FL
WT
LD
B1
KD
WT
LD
B1
KD
LD
B1
FL
A
WT
LD
B1
KD
LD
B1
FL
349 genes4/5-independent
148 genes occupied by LDB1
WT
LD
B1
KD
LD
B1
FL
LD
B1Δ
4/5
147 genes4/5-dependent
93 genes occupied by LDB1
WT
LD
B1
KD
LD
B1
FL
LD
B1Δ
4/5
or
LD
B1-
occ
up
ied
,4/
5 d
epen
den
t
B

Gypa
40
LDB1Δ4/5
40
LDB1 FL
40
LDB1 KD
40
WT
5 kbchr8:83016644-83036057
RepMask
LDB1
126
GATA1
126
TAL1
126
RN
A-s
eq (
TP
M)
ChI
P-s
eq(d
epth
)
Kctd14Kctd14Kctd14
0.35
LDB1Δ4/5
0.35
LDB1 FL
0.35
LDB1 KD
0.35
WT
RepMask
2 kbchr7:104599207-104608879
LDB1
56
GATA1
56
TAL1
56
RN
A-s
eq (
TP
M)
ChI
P-s
eq(d
epth
)
Treml1Treml1Treml1Treml1Treml1
0.25
LDB1Δ4/5
0.25
LDB1 FL
0.25
LDB1 KD
0.25
WT
RepMask
2 kbchr17:48498362-48507191
LDB1
48
GATA1
48
TAL1
48
RN
A-s
eq (
TP
M)
ChI
P-s
eq(d
epth
)
Krivega_FigS10
A
B
C

Krivega_FigS11
p=.001
LDB1-activated and occupied mouse gene
A
25
30
35
4/5‐dependent
4/5‐independent
B
p=.93
iate
d ge
nes
Human homolog
Disease association (OMIM base) 5
10
15
20all
of d
isea
se a
ssoc
i
Human disease-associated homologs from OMIM
C
0
%
4/5-dependentdisease related genes
4/5-independentdisease related genes
C
blood related diseases
others