supplementary information: primary coloured ... · supplementary information: primary coloured...
TRANSCRIPT

S1
Supplementary Information:
Primary Coloured Electrochromism of Aromatic Oxygen
and Sulfur Diesters
Xiuhui Xu, Richard D. Webster*
Division of Chemistry and Biology Chemistry, School of Physical & Mathematical
Sciences, Nanyang Technological University, Singapore
21 Nanyang Link, Singapore 637371.
Electronic Supplementary Material (ESI) for RSC Advances.This journal is © The Royal Society of Chemistry 2014

S2
Table of Contents
Page
1. General Experimental Information S4
2. Experimental Procedure for the Preparation of S,S-diethyl esters S4
3. Experimental Procedure for the Preparation of O-diesters S5
4. Spectroscopic Data
A. 1H and
13C NMR spectra S8
i. Compound 1 - S,S-Diethyl benzene-1,4-bis(carbothioate) S8
ii. Compound 2 - S,S-Diethyl pyridine-2,5-bis(carbothioate) S9
iii. Compound 3 - Dimethyl terephthalate S10
iv. Compound 4 - Dimethyl pyridine-2,5-dicarboxylate S11
v. Compound 5 - Diisopropyl terephthalate S12
vi. Compound 6 - Diisopropyl pyridine-2,5-dicarboxylate S13
vii. Compound 7 - Dipropyl terephthalate S14
viii. Compound 8 - Dipropyl pyridine-2,5-dicarboxylate S15
ix. Compound 9 - Dimethyl naphthalene-2,6-dicarboxylate S16
x. Compound 10 - Dimethyl biphenyl-4,4’-dicarboxylate S17
xi. Compound 11 - Dimethyl [2,2'-bipyridine]-5,5'-dicarboxylate S18
B. Cyclic voltammograms (varying scan rates) at 22 ºC and -30ºC S19
i. Compound 1 - S,S-Diethyl benzene-1,4-bis(carbothioate) S19
ii. Compound 2 - S,S-Diethyl pyridine-2,5-bis(carbothioate) S20
iii. Compound 3 - Dimethyl terephthalate S21
iv. Compound 4 - Dimethyl pyridine-2,5-dicarboxylate S22
v. Compound 5 - Diisopropyl terephthalate S23
vi. Compound 6 - Diisopropyl pyridine-2,5-dicarboxylate S24
vii. Compound 7 - Dipropyl terephthalate S25
viii. Compound 8 - Dipropyl pyridine-2,5-dicarboxylate S26
ix. Compound 9 - Dimethyl naphthalene-2,6-dicarboxylate S27
x. Compound 10 - Dimethyl biphenyl-4,4’-dicarboxylate S28
xi. Compound 11 - Dimethyl [2,2'-bipyridine]-5,5'-dicarboxylate S29
C. Voltammetric and coulometric spectra during electrolysis S30
i. Compound 1 - S,S-Diethyl benzene-1,4-bis(carbothioate) S30
ii. Compound 2 - S,S-Diethyl pyridine-2,5-bis(carbothioate) S31
iii. Compound 3 - Dimethyl terephthalate S32
iv. Compound 4 - Dimethyl pyridine-2,5-dicarboxylate S33
v. Compound 5 - Diisopropyl terephthalate S34
vi. Compound 6 - Diisopropyl pyridine-2,5-dicarboxylate S35
vii. Compound 7 - Dipropyl terephthalate S36
viii. Compound 8 - Dipropyl pyridine-2,5-dicarboxylate S37
ix. Compound 9 - Dimethyl naphthalene-2,6-dicarboxylate S38

S3
D. In situ electrochemical UV-vis spectra at Pt mesh electrode S39
i. Compound 1 - S,S-Diethyl benzene-1,4-bis(carbothioate) S39
ii. Compound 2 - S,S-Diethyl pyridine-2,5-bis(carbothioate) S39
iii. Compound 3 - Dimethyl terephthalate S40
iv. Compound 4 - Dimethyl pyridine-2,5-dicarboxylate S40
v. Compound 5 - Diisopropyl terephthalate S41
vi. Compound 6 - Diisopropyl pyridine-2,5-dicarboxylate S41
vii. Compound 7 - Dipropyl terephthalate S42
viii. Compound 8 - Dipropyl pyridine-2,5-dicarboxylate S42
ix. Compound 9 - Dimethyl naphthalene-2,6-dicarboxylate S43
E. Voltammetric and UV-vis spectra using gold-mesh electrode
i. In situ electrochemical UV-vis spectra of Compound 2 S44
ii. In situ electrochemical UV-vis spectra of Compound 5 S44
iii. In situ electrochemical UV-vis spectra of Compound 9 S45
iv. Absorbance spectrum of gold-mesh electrode S45
v. Table of chromatic contrast ratios of compounds 2, 5 and 9 S46
vi. Coulometric data obtained from LSV of compounds 2, 5 and 9 S47
vii. Table of chromatic efficiencies of compounds 2, 5 and 9 S48
viii. 100 cycles of cyclic voltammograms of Compound 2 S48
ix. 100 cycles of cyclic voltammograms of Compound 5 S49
x. 100 cycles of cyclic voltammograms of Compound 9 S49

S4
General Experimental Information
Unless specified, all reagents and starting materials were purchased from commercial
sources and used as received. Solvents were purified following standard literature
procedures. Analytical thin layer chromatography (TLC) was performed using pre-
coated silica gel plates. Visualization was achieved by UV light (254 nm). Flash
chromatography was performed using silica gel and gradient solvent system
(EtOAc:nHexane as eluent). 1H and
13C NMR spectra were recorded with 400 MHz
spectrometer. Chemical shifts (ppm) were recorded with tetramethylsilane (TMS) as
the internal reference standard. Multiplicities are given as: s (singlet), br s (broad
singlet), d (doublet), t (triplet), dd (doublet of doublets), q (quartet) or m (multiplet).
The number of protons (n) for a given resonance is indicated by nH and coupling
constants are reported as a J value in Hz. Infrared spectra were recorded on a IR
spectrometer. Solid samples were examined as a thin film between NaCl salt plates.
Low resolution mass spectra were determined on a mass spectrometer and reported in
units of mass to charge (m/z). High-resolution mass spectra (HRMS) were obtained
on a LC/HRMS mass spectrometer.
General Procedure for the Preparation of S,S-diethyl esters
Compounds (1 & 2)
To 15 mmol of the dicarboxylic acid, 10 ml of thionyl chloride was added and reflux
in DMF for 3 hours. Triethylamine and ethanethiol were then added, followed by dry
THF and left to reflux overnight. Upon completion of reaction, solvent was removed
under reduced pressure. Mixture was washed with sodium bicarbonate and extracted
twice with ether. Combined organic layers were dried with sodium sulfate. Organic
layer was then dried under reduced pressure to yield the final product.
Spectroscopic data
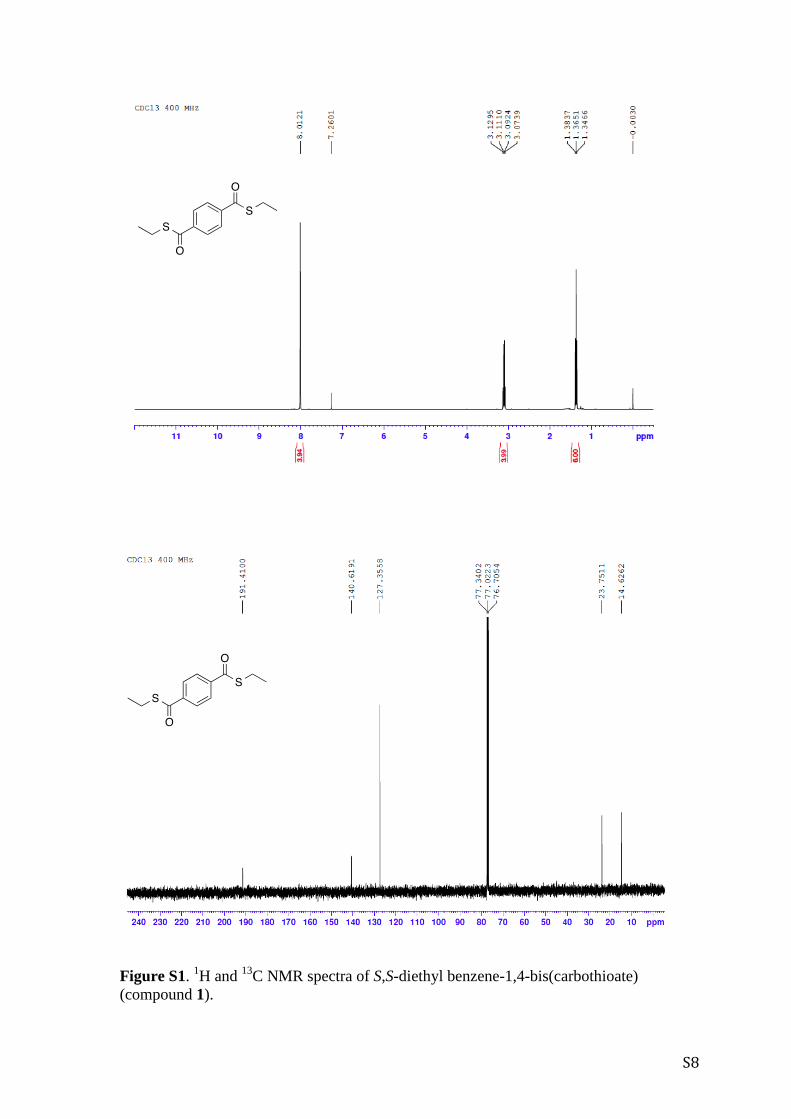
S,S-diethyl benzene-1,4-bis(carbothioate) (1): White solid; mp: 88-91 ºC; IR (Nujol)
1668 (S–C=O) cm-1
; 1H NMR (CDCl
3, 400 MHz) δ 8.01 (s, 4H), 3.95 (q, 2H, J = 7.44
Hz), 1.35 (t, 3H, J = 7.44 Hz); 13
C NMR (CDCl3, 400 MHz) δ 191.4, 140.6, 127.4,
23.8, 14.6; HRMS ESI (m/z): found, 255.0517, calcd for C12H15O4S2: [M+H]+,
255.0513.
S,S-diethyl pyridine-2,5-bis(carbothioate) (2): Pale-yellow solid; mp: 88-90 ºC; IR
(Nujol) 1667 (S–C=O) cm-1
; 1H NMR (CDCl3, 400 MHz) δ 9.19 (d, 1H, J = 1.96
Hz), 8.32 (dd, 1H, J = 8.12, 2.12 Hz), 8.02 (d, 1H, J = 8.04 Hz), 3.11 (q, 2H, J = 7.44

S5
Hz), 3.04 (q, 2H, J = 7.44 Hz), 1.34 (q, 6H, J = 7.52 Hz); 13
C NMR (CDCl3, 400
MHz) δ 192.9, 189.9, 154.6, 147.8, 135.9, 135.6, 120.1, 23.9, 23.3, 14.5, 14.3; HRMS
ESI (m/z): found, 256.0471, calcd for C11H14NO2S2: [M+H]+, 256.0466.
General Procedure for the Preparation of O-diesters
Compounds (3 - 11)
To 3 mmol of the dicarboxylic acid, approximately 0.5 ml of concentrated Sulfuric
acid was added and reflux in its respective alcohol overnight. Upon completion of
reaction, solvent was removed under reduced pressure. Cold water was then added;
extraction was done twice with ethyl acetate. Combined organic layers were dried
with sodium sulfate. Organic layer was then dried under reduced pressure to yield the
final product.
Spectroscopic data
Dimethyl terephthalate (3): White solid; IR (Nujol) 1719 (0–C=O) cm-1
; 1H NMR
(CDCl3, 400 MHz) δ 8.10 (s, 4H), 3.95 (s, 6H);
13C NMR (CDCl
3, 400 MHz) δ 166.3,
133.9, 129.6, 52.4; HRMS ESI (m/z): found, 195.0647, calcd for C10H11O4: [M+H]+,
195.0657.
Dimethyl pyridine-2,5-dicarboxylate (4): White solid; IR (Nujol) 1717 (0–C=O) cm-1
; 1H NMR (CDCl
3, 400 MHz) δ 9.30 (dd, 1H, J = 1.98, 0.64 Hz), 8.43 (dd, 1H, J =
8.14, 2.12 Hz), 8.19 (dd, 1H, J = 8.10, 0.68 Hz), 4.03 (s, 3H), 3.98 (s, 3H); 13
C NMR
(CDCl3, 400 MHz) δ 164.9, 164.8, 150.8, 150.7, 138.3, 128.6, 124.7, 53.2, 52.7;
HRMS ESI (m/z): found, 196.0605, calcd for C9H10NO4: [M+H]+, 196.0610.
Diisopropyl terephthalate (5). White solid: IR (Nujol) 1722 (0–C=O) cm-1
; 1H NMR
(CDCl3, 400 MHz) δ 8.08 (s, 4H), 5.29-5.24 (m, 2H), 1.38 (dd, 12H, J = 6.20, 3.04
Hz); 13
C NMR (CDCl3, 400 MHz) δ 165.4, 134.5, 129.4, 68.9, 21.9; HRMS ESI
(m/z): found, 251.1274, calcd for C14H19O4: [M+H]+, 251.1283.

S6
Diisopropyl pyridine-2,5-dicarboxylate (6). Pale-yellow solid; IR (Nujol) 1726 (0–
C=O) cm-1
; 1H NMR (CDCl
3, 400 MHz) 9.31 (d, 1H, J = 1.32 Hz), 8.39 (dd, 1H, J =
8.10, 2.04 Hz), 8.15 (d, 1H, J = 8.16 Hz), 5.38-5.28 (m, 2H), 1.39 (dd, 12H, J =
16.02, 6.28 Hz); 13
C NMR (CDCl3, 400 MHz) δ 164.1, 164.0, 151.5, 150.9, 138.0,
129.0, 124.4, 70.1, 69.7, 21.8; HRMS ESI (m/z): found, 252.1229, calcd for
C13H18NO4: [M+H]+, 252.1236.
Dipropyl terephthalate (7). White solid; IR (Nujol) 1726 (0–C=O) cm-1
; 1H NMR
(CDCl3, 400 MHz) δ 8.10 (s, 4H), 4.29 (t, 4H, J = 6.68 Hz), 1.85-1.76 (m, 4H), 1.02
(t, 6H, J = 7.4 Hz); 13
C NMR (CDCl3, 400 MHz) δ 165.9, 134.2, 129.4, 66.9, 22.0,
10.5; HRMS ESI (m/z): found, 251.1275, calcd for C14H19O4: [M+H]+, 251.1283.
Dipropyl pyridine-2,5-dicarboxylate (8). Yellow oil; IR 1730 (0–C=O) cm-1
; 1H
NMR (CDCl3, 400 MHz) δ 9.28 (s, 1H), 8.38 (dd, 1H, J = 8.10, 2.04 Hz), 8.14 (d, 1H,
J = 8.12 Hz), 4.35 (t, 2H, J = 6.84 Hz), 4.29 (t, 2H, J = 6.64 Hz), 1.85-1.76 (m, 4H),
1.02-0.98 (m, 6H); 13
C NMR (CDCl3, 400 MHz) δ 164.5, 164.4, 151.2, 150.8, 138.1,
128.7, 124.5, 67.8, 67.4, 22.0, 10.4, 10.3; HRMS ESI (m/z): found, 252.1244, calcd
for C13H18NO4: [M+H]+, 252.1236.
Dimethyl naphthalene-2,6-dicarboxylate (9). Pale-yellow solid; mp: 190-192 ºC; IR
(Nujol) 1713 (O–C=O) cm-1
; 1H NMR (CDCl
3, 400 MHz) δ 8.63 (s, 2H), 8.11 (dd,
2H, J = 8.58, 1.16 Hz), 7.99 (d, 2H, J = 8.56 Hz), 4.00 (s, 3H); 13
C NMR (CDCl3, 400
MHz) δ 166.8, 134.6, 130.6, 129.6, 126.0, 52.4; HRMS ESI (m/z): found, 245.0821,
calcd for C14H12O4: [M+H]+, 245.0814.

S7
Dimethyl biphenyl-4,4’-dicarboxylate (10): White solid; IR (Nujol) 1719 (O–C=O)
cm-1
; 1H NMR (CDCl
3, 400 MHz) δ 8.13 (d, J = 8.12 Hz, 4H), 7.79 (d, J = 8.12 Hz,
4H), 3.95 (s, 6H); 13
C NMR (CDCl3, 400 MHz) δ 166.8, 144.4, 130.2, 129.7, 127.2,
52.2; HRMS ESI (m/z): found, 271.0974, calcd for C16H15O4: [M+H]+, 271.0970.
Dimethyl [2,2'-bipyridine]-5,5'-dicarboxylate (11): White solid; mp: 266-270 ºC; IR
(Nujol) 1728 (O–C=O) cm-1
; 1H NMR (CDCl
3, 400 MHz) δ 9.32 (s, 2H), 8.61 (d, J =
8.28 Hz, 2H), 8.45 (dd, 2H, J = 8.26, 2.04 Hz), 4.02 (s, 6H); 13
C NMR (CDCl3, 400
MHz) δ 165.6, 158.4, 150.6, 138.1, 126.3, 121.3, 52.5; HRMS ESI (m/z): found,
273.0866, calcd for C14H13N2O4: [M+H]+, 273.0875.
S8
Figure S1. 1H and
13C NMR spectra of S,S-diethyl benzene-1,4-bis(carbothioate)
(compound 1).

S9
Figure S2. 1H and
13C NMR spectra of S,S-diethyl pyridine-2,5-bis(carbothioate)
(compound 2).

S10
Figure S3. 1H and
13C NMR spectra of dimethyl terephthalate (compound 3).

S11
Figure S4. 1H and
13C NMR spectra of dimethyl pyridine-2,5-dicarboxylate
(compound 4).

S12
Figure S5. 1H and
13C NMR spectra of diisopropyl terephthalate (compound 5).

S13
Figure S6. 1H and
13C NMR spectra of diisopropyl pyridine-2,5-dicarboxylate
(compound 6).

S14
Figure S7. 1H and
13C NMR spectra of dipropyl terephthalate (compound 7).

S15
Figure S8. 1H and
13C NMR spectra of dipropyl pyridine-2,5-dicarboxylate
(compound 8).

S16
Figure S9. 1H and
13C NMR spectra of dimethyl naphthalene-2,6-dicarboxylate
(compound 9).

S17
Figure S10. 1H and
13C NMR spectra of dimethyl biphenyl-4,4’-dicarboxylate
(compound 10).

S18
Figure S11. 1H and
13C NMR spectra of dimethyl [2,2'-bipyridine]-5,5'-dicarboxylate
(compound 11).

S19
Figure S12. Cyclic voltammograms of compound 1 at 20 °C and -30 °C.
Figure S12a: Cyclic voltammograms of 1 at 20 ºC.
Scan rates () from 0.1 V s-1
, 0.2 V s-1
, 0.5 V s-1
, 1.0 V
s-1
, 2.0 V s-1
, 5 V s-1
, 10 V s-1
, 12 V s-1
, 15 V s-1
and 20
V s-1
(top to bottom) obtained at a glassy carbon
electrode in CH3CN (0.2 M Bu4NPF6) for the 1-
electron reduction (left) and 2-electron reduction
(right) of ca. 2 mM analyte. Current data were scaled
by multiplying by -0.5.
Figure S12b: Cyclic voltammograms of 1 at -30 ºC.
Scan rates () from 0.1 V s-1
, 0.2 V s-1
, 0.5 V s-1
, 1.0 V
s-1
, 2.0 V s-1
, 5 V s-1
, 10 V s-1
, 12 V s-1
, 15 V s-1
and 20
V s-1
(top to bottom) obtained at a glassy carbon
electrode in CH3CN (0.2 M Bu4NPF6) for the 1-
electron reduction (left) and 2-electron reduction
(right) of ca. 2 mM analyte. Current data were scaled
by multiplying by -0.5.

S20
Figure S13. Cyclic voltammograms of compound 2 at 20 °C and -30 °C.
Figure S13a: Cyclic voltammograms of 2 at 20 ºC.
Scan rates () from 0.1 V s-1
, 0.2 V s-1
, 0.5 V s-1
,
1.0 V s-1
, 2.0 V s-1
, 5 V s-1
, 10 V s-1
, 12 V s-1
, 15 V
s-1
and 20 V s-1
(top to bottom) obtained at a glassy
carbon electrode in CH3CN (0.2 M Bu4NPF6) for
the 1-electron reduction (left) and 2-electron
reduction (right) of ca. 2 mM analyte. Current data
were scaled by multiplying by -0.5.
Figure S13b: Cyclic voltammograms of 2 at -30
ºC. Scan rates () from 0.1 V s-1
, 0.2 V s-1
, 0.5 V
s-1
, 1.0 V s-1
, 2.0 V s-1
, 5 V s-1
, 10 V s-1
, 12 V s-1
,
15 V s-1
and 20 V s-1
(top to bottom) obtained at a
glassy carbon electrode in CH3CN (0.2 M
Bu4NPF6) for the 1-electron reduction (left) and
2-electron reduction (right) of ca. 2 mM analyte.
Current data were scaled by multiplying by -0.5.

S21
Figure S14. Cyclic voltammograms of compound 3 at 20 °C and -30 °C.
Figure S14a: Cyclic voltammograms of 3 at 20 ºC.
Scan rates () from 0.1 V s-1
, 0.2 V s-1
, 0.5 V s-1
, 1.0
V s-1
, 2.0 V s-1
, 5 V s-1
, 10 V s-1
, 12 V s-1
, 15 V s-1
and 20 V s-1
(top to bottom) obtained at a glassy
carbon electrode in CH3CN (0.2 M Bu4NPF6) for the
1-electron reduction (left) and 2-electron reduction
(right) of ca. 2 mM analyte. Current data were
scaled by multiplying by -0.5.
Figure S14b: Cyclic voltammograms of 3 at -30 ºC.
Scan rates () from 0.1 V s-1
, 0.2 V s-1
, 0.5 V s-1
, 1.0 V
s-1
, 2.0 V s-1
, 5 V s-1
, 10 V s-1
, 12 V s-1
, 15 V s-1
and 20
V s-1
(top to bottom) obtained at a glassy carbon
electrode in CH3CN (0.2 M Bu4NPF6) for the 1-
electron reduction (left) and 2-electron reduction
(right) of ca. 2 mM analyte. Current data were scaled
by multiplying by -0.5.

S22
Figure S15. Cyclic voltammograms of compound 4 at 20 °C and -30 °C.
Figure S15a: Cyclic voltammograms of 4 at 20 ºC.
Scan rates () from 0.1 V s-1
, 0.2 V s-1
, 0.5 V s-1
, 1.0 V
s-1
, 2.0 V s-1
, 5 V s-1
, 10 V s-1
, 12 V s-1
, 15 V s-1
and 20
V s-1
(top to bottom) obtained at a glassy carbon
electrode in CH3CN (0.2 M Bu4NPF6) for the 1-
electron reduction (left) and 2-electron reduction (right)
of ca. 2 mM analyte. Current data were scaled by
multiplying by -0.5.
Figure S15b: Cyclic voltammograms of 4 at -30 ºC.
Scan rates () from 0.1 V s-1
, 0.2 V s-1
, 0.5 V s-1
, 1.0
V s-1
, 2.0 V s-1
, 5 V s-1
, 10 V s-1
, 12 V s-1
, 15 V s-1
and
20 V s-1
(top to bottom) obtained at a glassy carbon
electrode in CH3CN (0.2 M Bu4NPF6) for the 1-
electron reduction (left) and 2-electron reduction
(right) of ca. 2 mM analyte. Current data were scaled
by multiplying by -0.5.

S23
Figure S16. Cyclic voltammograms of compound 5 at 20 °C and -30 °C.
Figure S16a: Cyclic voltammograms of 5 at 20 ºC.
Scan rates () from 0.1 V s-1
, 0.2 V s-1
, 0.5 V s-1
, 1.0 V
s-1
, 2.0 V s-1
, 5 V s-1
, 10 V s-1
, 12 V s-1
, 15 V s-1
and 20
V s-1
(top to bottom) obtained at a glassy carbon
electrode in CH3CN (0.2 M Bu4NPF6) for the 1-
electron reduction (left) and 2-electron reduction
(right) of ca. 2 mM analyte. Current data were scaled
by multiplying by -0.5.
Figure S16b: Cyclic voltammograms of 5 at -30 ºC.
Scan rates () from 0.1 V s-1
, 0.2 V s-1
, 0.5 V s-1
, 1.0
V s-1
, 2.0 V s-1
, 5 V s-1
, 10 V s-1
, 12 V s-1
, 15 V s-1
and 20 V s-1
(top to bottom) obtained at a glassy
carbon electrode in CH3CN (0.2 M Bu4NPF6) for the
1-electron reduction (left) and 2-electron reduction
(right) of ca. 2 mM analyte. Current data were
scaled by multiplying by -0.5.

S24
Figure S17. Cyclic voltammograms of compound 6 at 20 °C and -30 °C.
Figure S17a: Cyclic voltammograms of 6 at 20 ºC.
Scan rates () from 0.1 V s-1
, 0.2 V s-1
, 0.5 V s-1
, 1.0
V s-1
, 2.0 V s-1
, 5 V s-1
, 10 V s-1
, 12 V s-1
, 15 V s-1
and 20 V s-1
(top to bottom) obtained at a glassy
carbon electrode in CH3CN (0.2 M Bu4NPF6) for the
1-electron reduction (left) and 2-electron reduction
(right) of ca. 2 mM analyte. Current data were
scaled by multiplying by -0.5.
Figure S17b: Cyclic voltammograms of 6 at -30 ºC.
Scan rates () from 0.1 V s-1
, 0.2 V s-1
, 0.5 V s-1
, 1.0 V
s-1
, 2.0 V s-1
, 5 V s-1
, 10 V s-1
, 12 V s-1
, 15 V s-1
and 20
V s-1
(top to bottom) obtained at a glassy carbon
electrode in CH3CN (0.2 M Bu4NPF6) for the 1-
electron reduction (left) and 2-electron reduction (right)
of ca. 2 mM analyte. Current data were scaled by
multiplying by -0.5.

S25
Figure S18. Cyclic voltammograms of compound 7 at 20 °C and -30 °C.
Figure S18a: Cyclic voltammograms of 7 at 20 ºC.
Scan rates () from 0.1 V s-1
, 0.2 V s-1
, 0.5 V s-1
, 1.0
V s-1
, 2.0 V s-1
, 5 V s-1
, 10 V s-1
, 12 V s-1
, 15 V s-1
and
20 V s-1
(top to bottom) obtained at a glassy carbon
electrode in CH3CN (0.2 M Bu4NPF6) for the 1-
electron reduction (left) and 2-electron reduction
(right) of ca. 2 mM analyte. Current data were scaled
by multiplying by -0.5.
Figure S18b: Cyclic voltammograms of 7 at -30
ºC. Scan rates () from 0.1 V s-1
, 0.2 V s-1
, 0.5 V s-1
,
1.0 V s-1
, 2.0 V s-1
, 5 V s-1
, 10 V s-1
, 12 V s-1
, 15 V
s-1
and 20 V s-1
(top to bottom) obtained at a glassy
carbon electrode in CH3CN (0.2 M Bu4NPF6) for
the 1-electron reduction (left) and 2-electron
reduction (right) of ca. 2 mM analyte. Current data
were scaled by multiplying by -0.5.

S26
Figure S19. Cyclic voltammograms of compound 8 at 20 °C and -30 °C.
Figure S19a: Cyclic voltammograms of 8 at 20 ºC.
Scan rates () from 0.1 V s-1
, 0.2 V s-1
, 0.5 V s-1
, 1.0
V s-1
, 2.0 V s-1
, 5 V s-1
, 10 V s-1
, 12 V s-1
, 15 V s-1
and
20 V s-1
(top to bottom) obtained at a glassy carbon
electrode in CH3CN (0.2 M Bu4NPF6) for the 1-
electron reduction (left) and 2-electron reduction
(right) of ca. 2 mM analyte. Current data were scaled
by multiplying by -0.5.
Figure S19b: Cyclic voltammograms of 8 at -30 ºC.
Scan rates () from 0.1 V s-1
, 0.2 V s-1
, 0.5 V s-1
, 1.0
V s-1
, 2.0 V s-1
, 5 V s-1
, 10 V s-1
, 12 V s-1
, 15 V s-1
and
20 V s-1
(top to bottom) obtained at a glassy carbon
electrode in CH3CN (0.2 M Bu4NPF6) for the 1-
electron reduction (left) and 2-electron reduction
(right) of ca. 2 mM analyte. Current data were scaled
by multiplying by -0.5.
S27
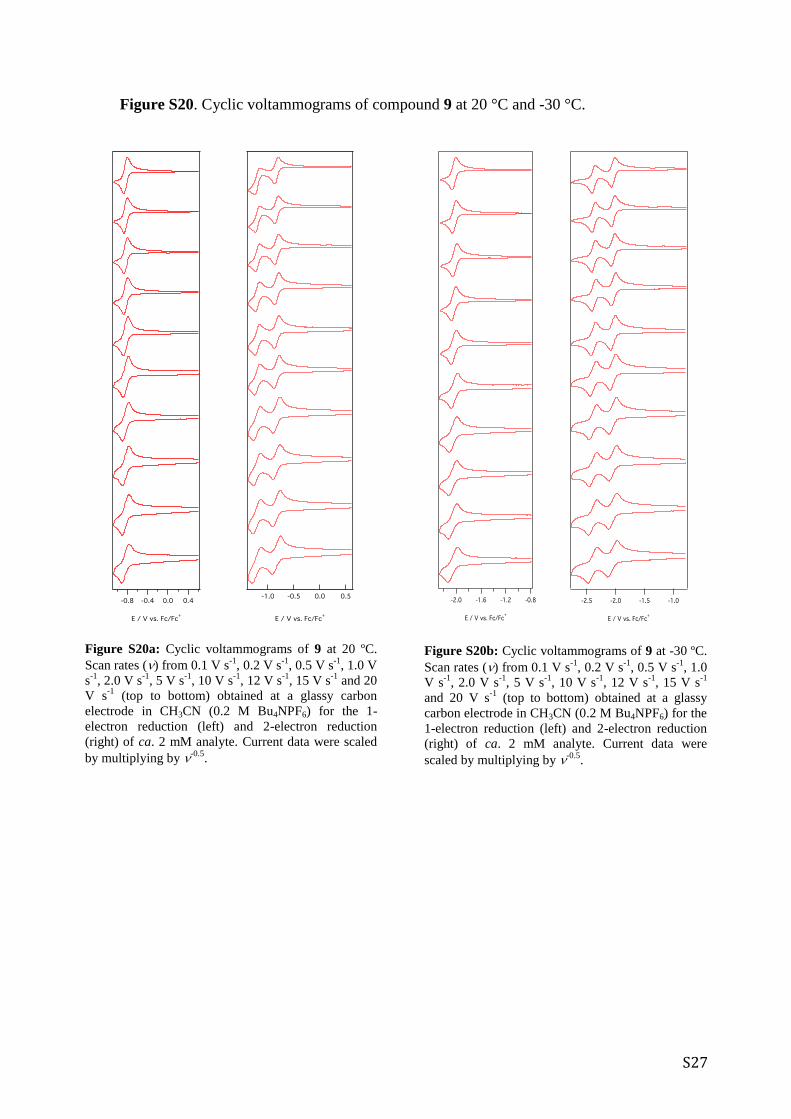
Figure S20. Cyclic voltammograms of compound 9 at 20 °C and -30 °C.
Figure S20a: Cyclic voltammograms of 9 at 20 ºC.
Scan rates () from 0.1 V s-1
, 0.2 V s-1
, 0.5 V s-1
, 1.0 V
s-1
, 2.0 V s-1
, 5 V s-1
, 10 V s-1
, 12 V s-1
, 15 V s-1
and 20
V s-1
(top to bottom) obtained at a glassy carbon
electrode in CH3CN (0.2 M Bu4NPF6) for the 1-
electron reduction (left) and 2-electron reduction
(right) of ca. 2 mM analyte. Current data were scaled
by multiplying by -0.5.
Figure S20b: Cyclic voltammograms of 9 at -30 ºC.
Scan rates () from 0.1 V s-1
, 0.2 V s-1
, 0.5 V s-1
, 1.0
V s-1
, 2.0 V s-1
, 5 V s-1
, 10 V s-1
, 12 V s-1
, 15 V s-1
and 20 V s-1
(top to bottom) obtained at a glassy
carbon electrode in CH3CN (0.2 M Bu4NPF6) for the
1-electron reduction (left) and 2-electron reduction
(right) of ca. 2 mM analyte. Current data were
scaled by multiplying by -0.5.

S28
Figure S21. Cyclic voltammograms of compound 10 at 20 °C.
Figure S21: Cyclic voltammograms of 10 at 20 ºC. Scan rates () from 0.1 V s-1
, 0.2 V s-1
, 0.5 V s-1
,
1.0 V s-1
, 2.0 V s-1
, 5 V s-1
, 10 V s-1
, 12 V s-1
, 15 V s-1
and 20 V s-1
(top to bottom) obtained at a
glassy carbon electrode in DMF (0.2 M Bu4NPF6) for the 1-electron reduction (left) and 2-electron
reduction (right) of ca. 2 mM analyte. Current data were scaled by multiplying by -0.5.

S29
Figure S22. Cyclic voltammograms of compound 11 at 20 °C.
Figure S22: Cyclic voltammograms of 11 at 20 ºC. Scan rates () from 0.1 V s-1
, 0.2 V s-1
, 0.5 V s-1
,
1.0 V s-1
, 2.0 V s-1
, 5 V s-1
, 10 V s-1
, 12 V s-1
, 15 V s-1
and 20 V s-1
(top to bottom) obtained at a glassy
carbon electrode in DCM (0.2 M Bu4NPF6) for the 1-electron reduction (left) and 2-electron reduction
(right) of ca. 2 mM analyte. Current data were scaled by multiplying by -0.5.

S30
Figure S23. Voltammetric and coulometric data of S,S-diethyl benzene-1,4-bis(carbothioate) (compound 1). (–) Before electrolysis. (---) After one-electron reduction.

S31
Figure S24. Voltammetric and coulometric data of S,S-diethyl pyridine-2,5-bis(carbothioate) (compound 2). (–) Before electrolysis. (---) After one-electron reduction.

S32
Figure S25. Voltammetric and coulometric data of dimethyl terephthalate (compound 3). (–) Before electrolysis. (---) After one-electron reduction.

S33
Figure S26. Voltammetric and coulometric data of dimethyl pyridine-2,5-dicarboxylate (compound 4). (–) Before electrolysis. (---) After one-electron reduction.

S34
Figure S27. Voltammetric and coulometric data of diisopropyl terephthalate (compound 5). (–) Before electrolysis. (---) After one-electron reduction.

S35
Figure S28. Voltammetric and coulometric data of diisopropyl pyridine-2,5-dicarboxylate (compound 6). (–) Before electrolysis. (---) After one-electron reduction.

S36
Figure S29. Voltammetric and coulometric data of dipropyl terephthalate (compound 7). (–) Before electrolysis. (---) After one-electron reduction.

S37
Figure S30. Voltammetric and coulometric data of dipropyl pyridine-2,5-dicarboxylate (compound 8). (–) Before electrolysis. (---) After one-electron reduction.

S38
Figure S31. Voltammetric and coulometric data of dimethyl naphthalene-2,6-dicarboxylate (compound 9). (–) Before electrolysis. (---) After one-electron reduction.

S39
Figure S32. In situ electrochemical UV-vis spectra obtained at a Pt mesh electrode of S,S-diethyl benzene-1,4-bis(carbothioate) (compound 1). (––) Before electrolysis. (––) After one-electron reduction. (---) After re-oxidation back to starting material.
Figure S33. In situ electrochemical UV-vis spectra obtained at a Pt mesh electrode of S,S-diethyl pyridine-2,5-bis(carbothioate) (compound 2). (––) Before electrolysis. (––) After one-electron reduction. (---) After re-oxidation back to starting material.

S40
Figure S34. In situ electrochemical UV-vis spectra obtained at a Pt mesh electrode of dimethyl terephthalate (compound 3). (––) Before electrolysis. (––) After one-electron reduction. (---) After re-oxidation back to starting material.
Figure S35. In situ electrochemical UV-vis spectra obtained at a Pt mesh electrode of
dimethyl pyridine-2,5-dicarboxylate (compound 4). (––) Before electrolysis. (––)
After one-electron reduction. (---) After re-oxidation back to starting material.

S41
Figure S36. In situ electrochemical UV-vis spectra obtained at a Pt mesh electrode of
diisopropyl terephthalate (compound 5). (––) Before electrolysis. (––) After one-
electron reduction. (---) After re-oxidation back to starting material.
Figure S37. In situ electrochemical UV-vis spectra obtained at a Pt mesh electrode of
diisopropyl pyridine-2,5-dicarboxylate (compound 6). (––) Before electrolysis. (––)
After one-electron reduction. (---) After re-oxidation back to starting material.
S42
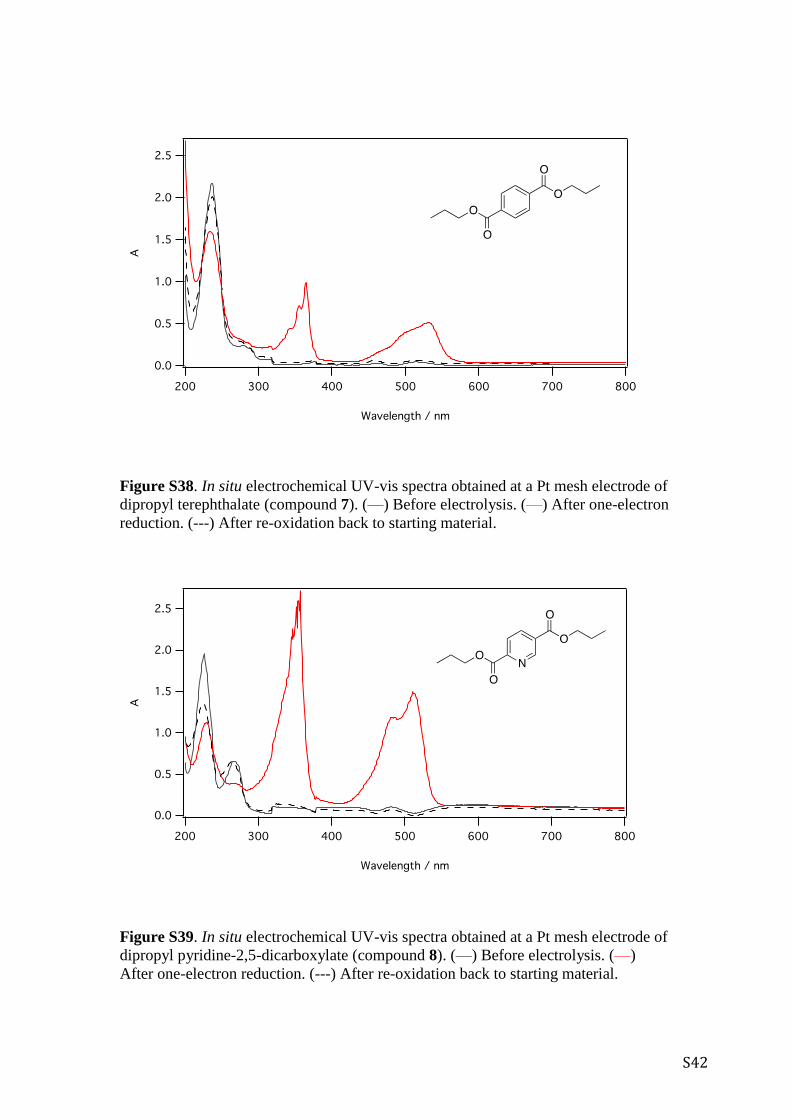
Figure S38. In situ electrochemical UV-vis spectra obtained at a Pt mesh electrode of
dipropyl terephthalate (compound 7). (––) Before electrolysis. (––) After one-electron
reduction. (---) After re-oxidation back to starting material.
Figure S39. In situ electrochemical UV-vis spectra obtained at a Pt mesh electrode of
dipropyl pyridine-2,5-dicarboxylate (compound 8). (––) Before electrolysis. (––)
After one-electron reduction. (---) After re-oxidation back to starting material.

S43
Figure S40. In situ electrochemical UV-vis spectra obtained at a Pt mesh electrode of
dimethyl naphthalene-2,6-dicarboxylate (compound 9). (––) Before electrolysis. (––)
After one-electron reduction. (---) After re-oxidation back to starting material.

S44
Figure S41a. Background subtracted in situ electrochemical UV-vis spectra obtained
at a gold micro-mesh electrode of 1 mM S,S-diethyl pyridine-2,5-bis(carbothioate)
(compound 2). (––) Before electrolysis. (––) After one-electron reduction.
Figure S41b. Background subtracted in situ electrochemical UV-vis spectra obtained
at a gold micro-mesh electrode of 1 mM diisopropyl terephthalate (compound 5). (––)
Before electrolysis. (––) After one-electron reduction.

S45
Figure S41c. Background subtracted in situ electrochemical UV-vis spectra obtained
at a gold micro-mesh electrode of 1 mM dimethyl naphthalene-2,6-dicarboxylate
(compound 9). (––) Before electrolysis. (––) After one-electron reduction.
Figure S41d. Absorbance spectrum of gold micro-mesh electrode.

S46
Compound Colour
(Wavelength
/ nm)a
Absorbance
of Au micro-
meshb
Transmittance
through Au
micro-mesh
(Ro)c
Absorbance
of compound
+ Au micro-
meshd
Transmission
through
compound +
Au micro-
mesh
(Rx)e
Chromatic
contrast
ratio:
Ro/Rx
(c = 1 mM)
2 Blue (612) 0.450 0.355 (0.777 +
0.450)
= 1.227
0.059 6.0
5 Red (533) 0.439 0.364 (0.572 +
0.439)
= 1.011
0.097 3.8
9 Green (732) 0.460 0.347 (0.541 +
0.460)
= 1.001
0.100 3.5
Table S1. Table of chromatic contrast ratios measured at the gold micro-mesh
electrode for 1 mM solutions of the analytes in CH3CN containing 0.2 M Bu4NPF6. aWavelength used for measurement.
bAbsorbance of the gold micromesh electrode at
specified wavelengths (from data in Figure S41d). cEquivalent transmission value
from absorbance reading (T = 10-A
). dAbsorbance of compound plus absorbance of
mesh (from data in Figures S41a-d) at specified wavelengths. eEquivalent
transmission value from absorbance reading (T = 10-A
).

S47
Figure S42. (Left hand side). Linear sweep voltammograms of compounds 2, 5 and 9
in CH3CN containing 0.2 M Bu4NPF6 at the gold micro-mesh electrode. The x-axis
has been converted from potential to time. (Right hand side) Integration of the
current-time data in the left hand column to give the charge (Q).
S48
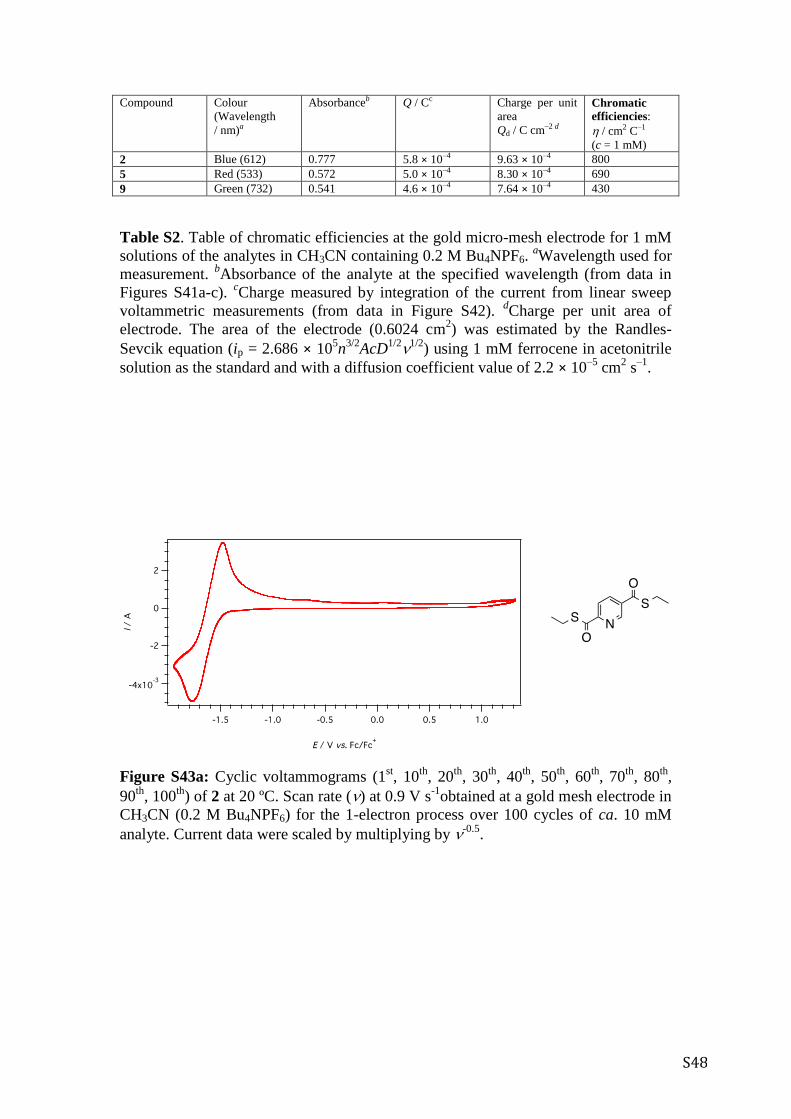
Compound Colour
(Wavelength
/ nm)a
Absorbanceb Q / Cc Charge per unit
area
Qd / C cm–2 d
Chromatic
efficiencies:
/ cm2 C–1
(c = 1 mM)
2 Blue (612) 0.777 5.8 × 10⁻⁴ 9.63 × 10⁻⁴ 800
5 Red (533) 0.572 5.0 × 10⁻⁴ 8.30 × 10⁻⁴ 690
9 Green (732) 0.541 4.6 × 10⁻⁴ 7.64 × 10⁻⁴ 430
Table S2. Table of chromatic efficiencies at the gold micro-mesh electrode for 1 mM
solutions of the analytes in CH3CN containing 0.2 M Bu4NPF6. aWavelength used for
measurement. bAbsorbance of the analyte at the specified wavelength (from data in
Figures S41a-c). cCharge measured by integration of the current from linear sweep
voltammetric measurements (from data in Figure S42). dCharge per unit area of
electrode. The area of the electrode (0.6024 cm2) was estimated by the Randles-
Sevcik equation (ip = 2.686 × 10⁵n
3/2AcD
1/21/2) using 1 mM ferrocene in acetonitrile
solution as the standard and with a diffusion coefficient value of 2.2 × 10⁻⁵
cm2 s
–1.
Figure S43a: Cyclic voltammograms (1st, 10
th, 20
th, 30
th, 40
th, 50
th, 60
th, 70
th, 80
th,
90th
, 100th
) of 2 at 20 ºC. Scan rate () at 0.9 V s-1
obtained at a gold mesh electrode in
CH3CN (0.2 M Bu4NPF6) for the 1-electron process over 100 cycles of ca. 10 mM
analyte. Current data were scaled by multiplying by -0.5.

S49
Figure S43b: Cyclic voltammograms (1st, 10
th, 20
th, 30
th, 40
th, 50
th, 60
th, 70
th, 80
th,
90th
, 100th
) of 5 at 20 ºC. Scan rate () at 0.5 V s-1
obtained at a gold mesh electrode in
CH3CN (0.2 M Bu4NPF6) for the 1-electron process over 100 cycles of ca. 10 mM
analyte. Current data were scaled by multiplying by -0.5.
Figure S43c: Cyclic voltammograms (1st, 10
th, 20
th, 30
th, 40
th, 50
th, 60
th, 70
th, 80
th,
90th
, 100th
) of 9 at 20 ºC. Scan rate () at 0.5 V s-1
obtained at a gold mesh electrode in
CH3CN (0.2 M Bu4NPF6) for the 1-electron process over 100 cycles of ca. 10 mM
analyte. Current data were scaled by multiplying by -0.5.