supplementary information for inhibitors of hedgehog ... fileshh peptide (3.21µm) was incubated...
TRANSCRIPT

Supplementary Information for
Inhibitors of Hedgehog Acyltransferase Block Sonic Hedgehog Signaling
Elissaveta Petrova1,5, Jessica Rios-Esteves1,2, Ouathek Ouerfelli3, J. Fraser Glickman4, and
Marilyn D. Resh1,2,6*
1Cell Biology Program, 2Gerstner Sloan-Kettering Graduate School of Biomedical Sciences,
3Pharmacology Program,
Memorial Sloan-Kettering Cancer Center
4High Throughput Screening Resource Center, Rockefeller University
5Graduate Program in Pharmacology, 6Graduate Programs in Cell Biology and Biochemistry,
Weill-Cornell Graduate School of Medical Sciences of Cornell University
*Corresponding Author:
Cell Biology Program
Memorial Sloan-Kettering Cancer Center
1275 York Avenue, Box 143
New York, NY 10065
Phone: 212-639-2514 FAX: 212-717-3317
e-mail: [email protected]
1Nature Chemical Biology: doi:10.1038/nchembio.1184
Supplementary Results
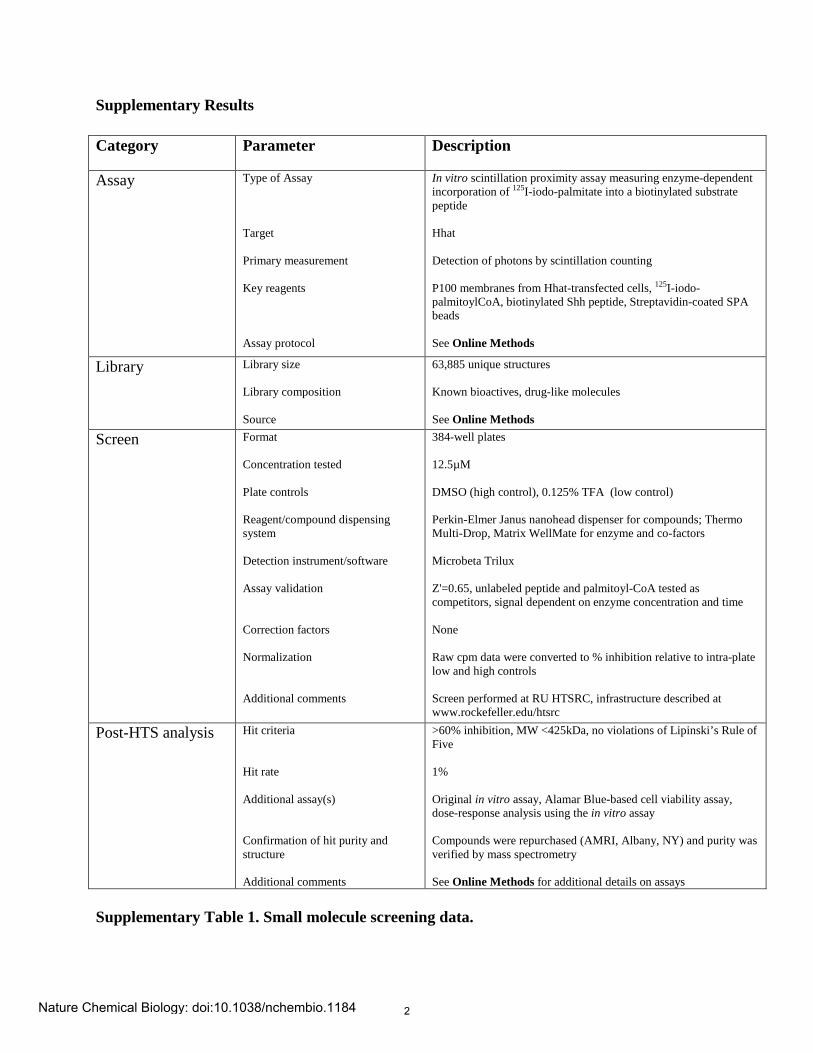
Supplementary Table 1. Small molecule screening data.
Category Parameter Description
Assay Type of Assay Target Primary measurement Key reagents Assay protocol
In vitro scintillation proximity assay measuring enzyme-dependent incorporation of 125I-iodo-palmitate into a biotinylated substrate peptide Hhat Detection of photons by scintillation counting P100 membranes from Hhat-transfected cells, 125I-iodo-palmitoylCoA, biotinylated Shh peptide, Streptavidin-coated SPA beads See Online Methods
Library Library size Library composition Source
63,885 unique structures Known bioactives, drug-like molecules See Online Methods
Screen Format Concentration tested Plate controls Reagent/compound dispensing system Detection instrument/software Assay validation Correction factors Normalization Additional comments
384-well plates 12.5µM DMSO (high control), 0.125% TFA (low control) Perkin-Elmer Janus nanohead dispenser for compounds; Thermo Multi-Drop, Matrix WellMate for enzyme and co-factors Microbeta Trilux Z'=0.65, unlabeled peptide and palmitoyl-CoA tested as competitors, signal dependent on enzyme concentration and time None Raw cpm data were converted to % inhibition relative to intra-plate low and high controls Screen performed at RU HTSRC, infrastructure described at www.rockefeller.edu/htsrc
Post-HTS analysis
Hit criteria Hit rate Additional assay(s) Confirmation of hit purity and structure Additional comments
>60% inhibition, MW <425kDa, no violations of Lipinski’s Rule of Five 1% Original in vitro assay, Alamar Blue-based cell viability assay, dose-response analysis using the in vitro assay Compounds were repurchased (AMRI, Albany, NY) and purity was verified by mass spectrometry See Online Methods for additional details on assays
2Nature Chemical Biology: doi:10.1038/nchembio.1184
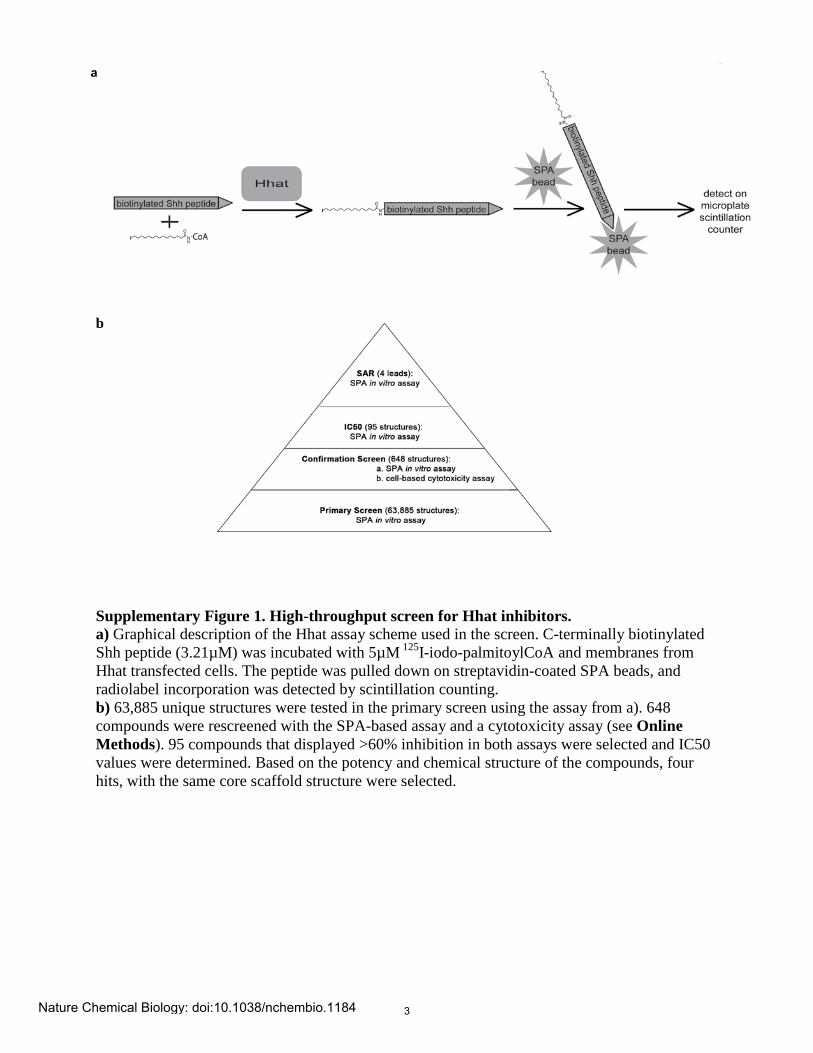
b Supplementary Figure 1. High-throughput screen for Hhat inhibitors. a) Graphical description of the Hhat assay scheme used in the screen. C-terminally biotinylated Shh peptide (3.21µM) was incubated with 5µM 125I-iodo-palmitoylCoA and membranes from Hhat transfected cells. The peptide was pulled down on streptavidin-coated SPA beads, and radiolabel incorporation was detected by scintillation counting. b) 63,885 unique structures were tested in the primary screen using the assay from a). 648 compounds were rescreened with the SPA-based assay and a cytotoxicity assay (see Online Methods). 95 compounds that displayed >60% inhibition in both assays were selected and IC50 values were determined. Based on the potency and chemical structure of the compounds, four hits, with the same core scaffold structure were selected.
3Nature Chemical Biology: doi:10.1038/nchembio.1184

Supplementary Figure 2. IC50 curve for RU-SKI 43. 11-point 2-fold serial dilutions in DMSO were prepared to yield final concentrations of RU-SKI 43 ranging from 12.5µM to 0µM. The SPA-based Hhat activity assay, described in Online Methods, was performed in duplicate, and the data were used to calculate an IC50 value for RU-SKI 43. Each point represents the Mean±SD.
4Nature Chemical Biology: doi:10.1038/nchembio.1184

Supplementary Figure 3. Structures of related compounds C-1 and C-2.
5Nature Chemical Biology: doi:10.1038/nchembio.1184
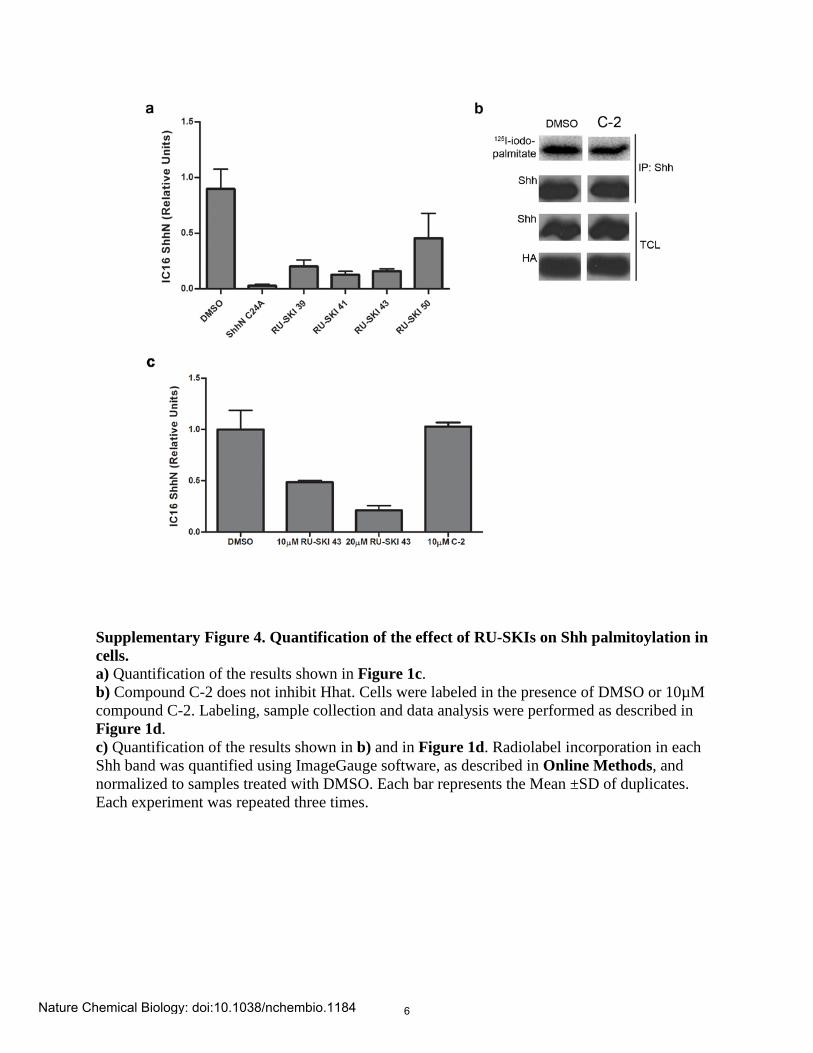
Supplementary Figure 4. Quantification of the effect of RU-SKIs on Shh palmitoylation in cells. a) Quantification of the results shown in Figure 1c. b) Compound C-2 does not inhibit Hhat. Cells were labeled in the presence of DMSO or 10µM compound C-2. Labeling, sample collection and data analysis were performed as described in Figure 1d. c) Quantification of the results shown in b) and in Figure 1d. Radiolabel incorporation in each Shh band was quantified using ImageGauge software, as described in Online Methods, and normalized to samples treated with DMSO. Each bar represents the Mean ±SD of duplicates. Each experiment was repeated three times.
6Nature Chemical Biology: doi:10.1038/nchembio.1184

a b
Supplementary Figure 5. Hhat, but not Porcupine overexpression can overcome the inhibitory effect of RU-SKI 43. a) Hhat can overcome the inhibitory effect of RU-SKI 43. COS-1 cells were transfected with 500ng Shh and increasing amounts of Hhat. The cells were treated with DMSO or 10µM RU-SKI 43, and labeled. Radiolabel incorporation was normalized to samples treated with DMSO; (Mean ± SD, n=2-4). b) Porcupine over-expression does not affect Hhat inhibition by RU-SKI 43. COS-1 cells were transfected with 500ng Shh, 10ng Hhat, and increasing amounts of Porcupine. The cells were treated and the data was analyzed as described in panel a. Each bar represents the Mean ±SD (n=2).
7Nature Chemical Biology: doi:10.1038/nchembio.1184

Supplementary Figure 6. RU-SKI 43 inhibits endogenous Hhat in COS-1 cells. a) COS-1 cells were transfected with 500ng of a plasmid encoding Shh and labeled in the presence of DMSO or 10µM RU-SKI 43. Labeling, sample collection and data analysis were performed as described in Figure 1c. b) Quantification of the results shown in a). Radiolabel incorporation in each Shh band was quantified using ImageGauge software, as described in Online Methods. Radiolabel incorporation was normalized to samples treated with DMSO. Each bar represents the Mean ±SD of duplicates.
8Nature Chemical Biology: doi:10.1038/nchembio.1184

Supplementary Figure 7. RU-SKI 43 does not alter Shh autoprocessing or Shh and Hhat localization. a) Shh processing is not affected by RU-SKI 43. 48h after transfection with Shh and HA-Hhat, COS-1 cells were treated with DMSO or 10µM RU-SKI 43 for 5h. Cells were lysed and Shh was immunoprecipitated from the samples. Samples were resolved on a 12.5% SDS-PAGE gel and analyzed by Western blot analysis. b) RU-SKI does not affect Shh and Hhat localization. 48h after transfection with Shh and HA-Hhat, COS-1 cells were treated with DMSO or 10µM RU-SKI 43 for 5h. The cells were then fixed and processed for indirect immunofluorescence.
9Nature Chemical Biology: doi:10.1038/nchembio.1184

Supplementary Figure 8. Inhibition by RU-SKI 43 is not rescued in Shh-expressing NIH 3T3 cells. NIH 3T3 cells were co-transfected with vectors encoding 8XGliBS-Firefly luciferase (unless indicated otherwise), Renilla luciferase reporter (pRL-TK), and Shh. The following day the cells were split, and upon reaching confluence were treated with DMSO, 100nM SAG, 10µM RU-SKI 43, or 10µM RU-SKI 43 with either 100nM SAG or 1µg/mL Shh (C24II) for 24h. The firefly luciferase (FL)/renilla luciferase (RL) ratio in cell lysates was calculated for each sample, and was normalized to the DMSO-treated samples. Each bar is the average of triplicate readings and represents the Mean±SD (n=2-3).
DMSO SAG RU-SKI 43 RU-SKI 43 RU-SKI 43 mutant +SAG +Shh(C24II) 8XGliBS
Nor
mal
ized
Luc
ifera
se A
ctiv
ity
0.0
0.2
0.4
0.6
0.8
1.0
1.2
1.4
10Nature Chemical Biology: doi:10.1038/nchembio.1184
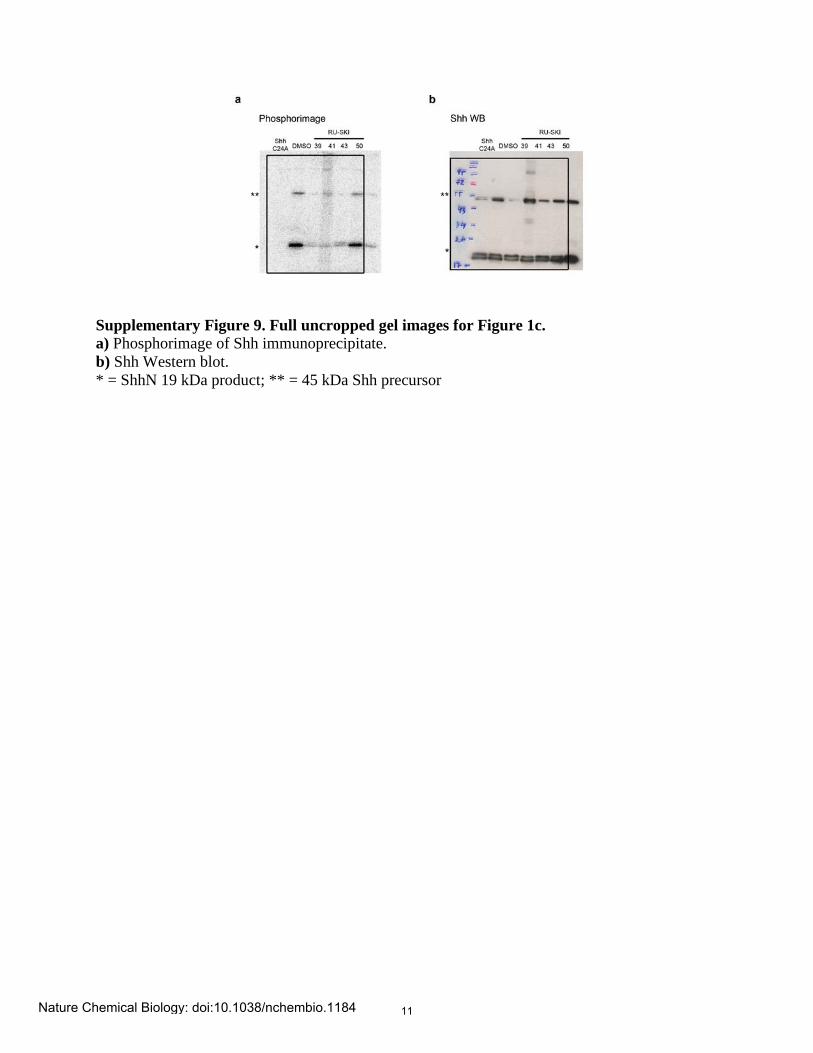
Supplementary Figure 9. Full uncropped gel images for Figure 1c. a) Phosphorimage of Shh immunoprecipitate. b) Shh Western blot. * = ShhN 19 kDa product; ** = 45 kDa Shh precursor
11Nature Chemical Biology: doi:10.1038/nchembio.1184
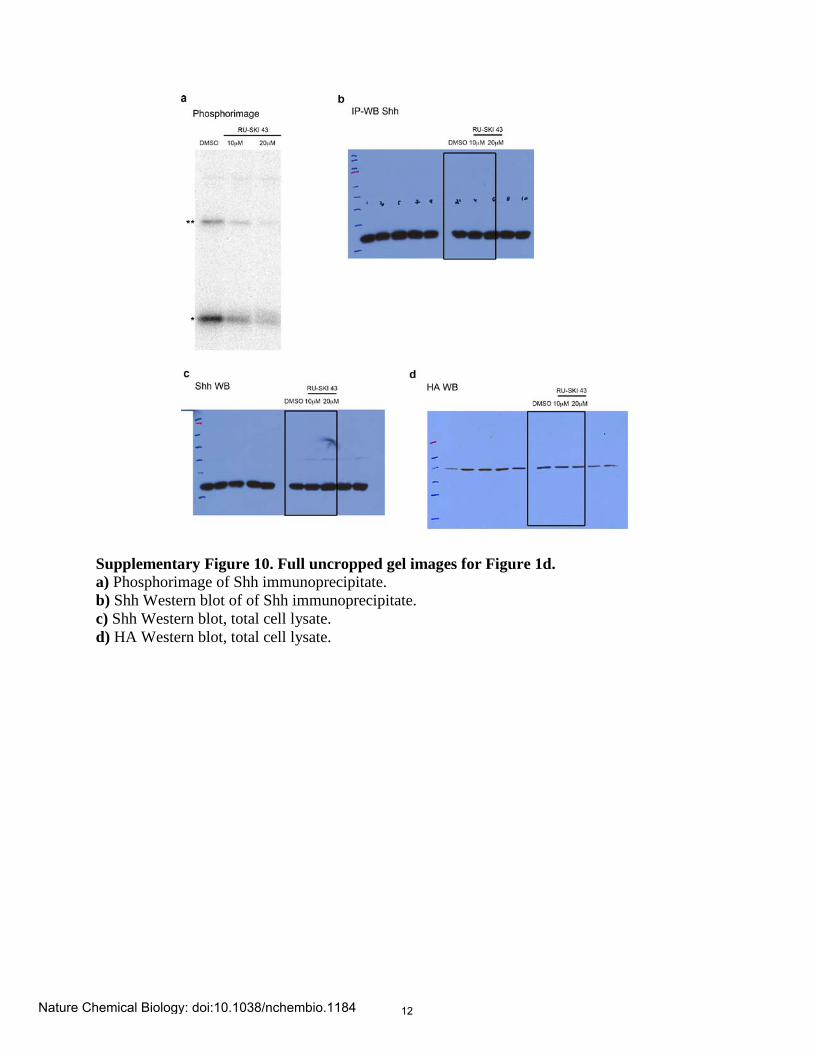
Supplementary Figure 10. Full uncropped gel images for Figure 1d. a) Phosphorimage of Shh immunoprecipitate. b) Shh Western blot of of Shh immunoprecipitate. c) Shh Western blot, total cell lysate. d) HA Western blot, total cell lysate.
12Nature Chemical Biology: doi:10.1038/nchembio.1184

Supplementary Figure 11. Full uncropped gel images for Figure 1e. a) Phosphorimage of H-Ras immunoprecipitate. b) Western blot of H-Ras immunoprecipitate. c) Phorphorimage of Fyn immunoprecipitate. d) Western blot of Fyn immunoprecipitate. e) Phosphorimage of c-Src immunoprecipitate. f) Western blot of c-Src immunoprecipitate.
13Nature Chemical Biology: doi:10.1038/nchembio.1184
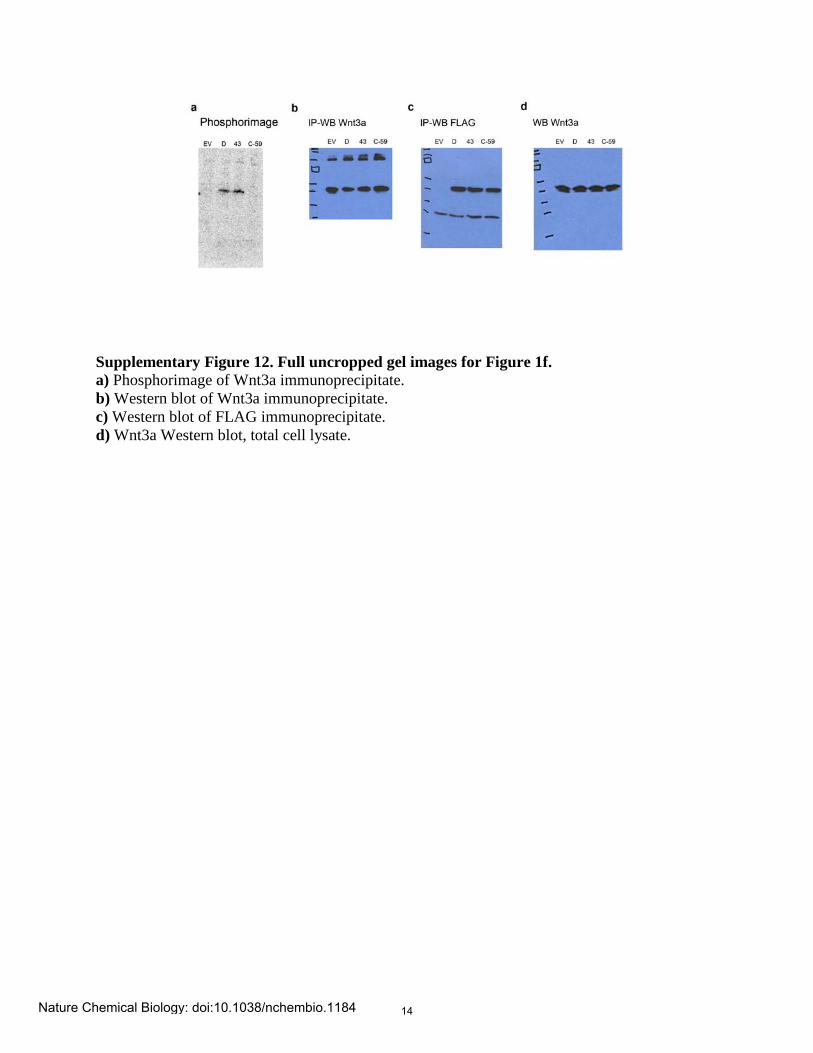
Supplementary Figure 12. Full uncropped gel images for Figure 1f. a) Phosphorimage of Wnt3a immunoprecipitate. b) Western blot of Wnt3a immunoprecipitate. c) Western blot of FLAG immunoprecipitate. d) Wnt3a Western blot, total cell lysate.
14Nature Chemical Biology: doi:10.1038/nchembio.1184

Supplementary Figure 13. MS Data for RU-SKI 43 Sample: 18 Date: 17-Dec-2010 Page 1.File: Ar37018ac_08 Time: 08:40:57 AMRI code: ALB-H01959680Vial: H/2 Description: 10749349 Vial label: B156L-087 Column: Acquity (Waters)BEHC18, 1.7 micron50 x 2.1 mm Solvent: Aqueous 0.05% v/v Trifluoroacetic acid;Acetonitrile 0.05% v/v Trifluoroacetic acid;pH= 2
MS ES+ :TICmax. intensity: 1.2E7 mAu
25
50
75
100
0 0.48 0.95 1.43 1.9
Peak_ID Peak Area Area% Height Time Mass Found1 0.09 0.13 4.E1 0 2.E3 0.112 0.17 0.21 7.E1 0.01 4.E3 0.193 0.21 0.37 2.E3 0.23 3.E4 0.316 0.39 0.53 1.E4 1.12 1.E5 0.478 0.53 0.71 1.E4 1.32 1.E5 0.6311 0.73 0.98 8.E5 82.99 1.E7 0.86 386.218 1.02 1.12 4.E3 0.44 7.E4 1.08 386.220 1.16 1.24 1.E3 0.13 4.E4 1.2225 1.34 1.62 1.E5 12.13 4.E5 1.56 386.226 1.64 1.72 6.E3 0.63 1.E5 1.70 386.227 1.72 1.82 4.E3 0.36 6.E4 1.80 386.228 1.82 1.86 2.E3 0.23 7.E4 1.8429 1.86 1.90 1.E3 0.14 5.E4 1.8831 1.90 2.00 3.E3 0.27 5.E4 1.96 386.2MS ES+ :387.2
max. intensity: 8E6 mAu
25
50
75
100
0 0.48 0.95 1.43 1.9
Peak_ID Peak Area Area% Height Time Mass Found9 0.63 0.77 8.E2 0.13 1.E4 0.7111 0.77 0.98 6.E5 91.74 8.E6 0.86 386.219 1.08 1.20 2.E3 0.36 4.E4 1.14 386.220 1.20 1.26 2.E2 0.03 8.E3 1.2224 1.34 1.62 4.E4 6.24 2.E5 1.54 386.226 1.62 1.74 8.E3 1.35 1.E5 1.70 386.228 1.76 1.86 9.E2 0.15 9.E3 1.84MS ES- :TIC
max. intensity: 1.7E7 mAu
25
50
75
100
0 0.48 0.95 1.43 1.9
Peak_ID Peak Area Area% Height Time Mass Found12 0.78 0.89 8.E3 0.48 9.E4 0.87 386.214 0.89 0.97 6.E2 0.04 1.E4 0.9323 1.01 1.83 2.E6 99.35 4.E6 1.4930 1.85 1.97 2.E3 0.13 3.E4 1.93
15Nature Chemical Biology: doi:10.1038/nchembio.1184

Sample: 18 Date: 17-Dec-2010 Page 2.File: Ar37018ac_08 Time: 08:40:57 AMRI code: ALB-H01959680Vial: H/2 Description: 10749349 Vial label: B156L-087Column: Acquity (Waters)BEHC18, 1.7 micron50 x 2.1 mmSolvent: Aqueous 0.05% v/v Trifluoroacetic acid;Acetonitrile 0.05% v/v Trifluoroacetic acid;pH= 2
MS ES- :385.2max. intensity: 1.3E5 mAu
25
50
75
100
0 0.48 0.95 1.43 1.9
Peak_ID Peak Area Area% Height Time Mass Found7 0.34 0.68 3.E2 0.7 2.E3 0.5410 0.68 1.01 7.E3 15.26 5.E4 0.85 386.222 1.09 1.99 4.E4 84.04 9.E4 1.43DAD: 220
max. intensity: 1.3E6 mAu
25
50
75
100
0 0.48 0.95 1.43 1.9
Peak_ID Peak Area Area% Height Time Mass Found4 0.38 0.42 6.E1 0.21 3.E3 0.415 0.42 0.46 4.E1 0.13 2.E3 0.4210 0.82 0.89 3.E4 97.26 1.E6 0.85 386.213 0.89 0.93 3.E2 0.91 2.E4 0.9015 0.93 0.95 5.E1 0.17 4.E3 0.94 386.216 0.95 0.98 3.E1 0.11 2.E3 0.96 386.217 1.03 1.06 3.E1 0.11 2.E3 1.0518 1.06 1.10 1.E2 0.36 6.E3 1.08 386.221 1.26 1.30 2.E2 0.65 1.E4 1.28 386.222 1.41 1.44 2.E1 0.08 1.E3 1.43ES+Peak_ID Time10 0.85Combine (42:43-(38:39+47:48))
0 250 500 750 1000
25
50
75
100
ES-Peak_ID Time10 0.85Combine (41:43-(37:39+46:48))
0 250 500 750 1000
25
50
75
100
16Nature Chemical Biology: doi:10.1038/nchembio.1184

Supplementary Figure 14Shh10-Biotin Peptide Reverse Phase HPLC
17Nature Chemical Biology: doi:10.1038/nchembio.1184

Supplementary Figure 15Shh10-Biotin Peptide MALDI MS
18Nature Chemical Biology: doi:10.1038/nchembio.1184