supplementary figures and tables serum microrna signature
TRANSCRIPT

1
Supplementary Figures and Tables
Serum microRNA Signature Is Capable of Early Diagnosis for Non-Small Cell
Lung Cancer
Xia Yang1, Qiuhong Zhang1, Ming Zhang1, Wenmei Su2, Zhuwen Wang3, Yali Li1,
Jie Zhang1, David G. Beer3, Shuanying Yang1, , Guoan Chen4,

2
Figure S1. The pairwise comparisons of 4 individual miRNAs (miR-146b, miR-205,
miR-29c and miR-30b) in 4 subgroups of our study: adenocarcinoma (AC), squamous
cell carcinoma (SCC), chronic obstructive pulmonary disease (COPD) or healthy
donors (Healthy). Mann-Whitney tests were performed to ascertain statistical
significance between the expression levels across each pairwise groups.
AC vs. SCC, p<0.0001; AC vs.
COPD, p<0.0001; AC vs. Healthy,
p<0.0001; SCC vs. COPD, p<0.0001;
SCC vs. Healthy, p<0.0001; COPD
vs. Healthy, p=0.0812.
AC vs. SCC, p=0.003; AC vs. COPD,
p<0.0001; AC vs. Healthy, p<0.0001;
SCC vs. COPD, p<0.0001; SCC vs.
Healthy, p<0.0001; COPD vs. Healthy,
p=0.3253.
AC vs. SCC, p<0.0001; AC vs. COPD,
p<0.0001; AC vs. Healthy, p<0.0001;
SCC vs. COPD, p<0.0001; SCC vs.
Healthy, p<0.0001; COPD vs. Healthy,
p=0.6653.
AC vs. SCC, p<0.0001; AC vs.
COPD, p<0.0001; AC vs. Healthy,
p<0.0001; SCC vs. COPD, p=0.0011;
SCC vs. Healthy, p=0.7514; COPD
vs. Healthy, p=0.0011.

3
Figure S2. Receiver–operator characteristic (ROC) curve analysis of 4 individual
miRNAs (miR-146b, miR-205, miR-29c and miR-30b) in distinguishing histological
subtypes of NSCLC patients: adenocarcinoma (AC, solid line), or squamous cell
carcinoma (SCC, dotted line) from all cancer-free controls.

4
Figure S3. The expression levels of 4 individual miRNAs (miR-146b, miR-205, miR-
29c and miR-30b) from NSCLC patients with different stages: stage I, stage II-III and
cancer-free controls. Mann-Whitney tests were performed to ascertain statistical
significance between the expression levels across groups. For all 4 individual miRNAs,
there has no significant difference between stage I and stage II-III NSCLC patients (all
p>0.05). On the contrast, all 4 miRNAs in serum from either stage I or stage II-III
NSCLC patients showed significantly higher expressions than those from cancer-free
controls (all p<0.05).

5
Figure S4. Receiver–operator characteristic (ROC) curve analysis of 4 individual
miRNAs (miR-146b, miR-205, miR-29c and miR-30b) in distinguishing NSCLC
patients with different stages: stage I (solid line) or stage II-III (dotted line) from all
cancer-free controls.

6
Figure S5. The expression levels of 4 individual miRNAs (miR-146b, miR-205, miR-
29c and miR-30b) from NSCLC patients with different T status: T1, T2, T3 and cancer-
free controls. Mann-Whitney tests were performed to ascertain statistical significance
between the expression levels across groups. For all 4 individual miRNAs, there has no
significant difference between T1, T2 or T3 NSCLC patients (all p > 0.05). On the
contrast, all 4 miRNAs in serum from either T1, T2 or T3 NSCLC patients showed
significantly higher expressions than those from cancer-free controls (all p < 0.001).
7
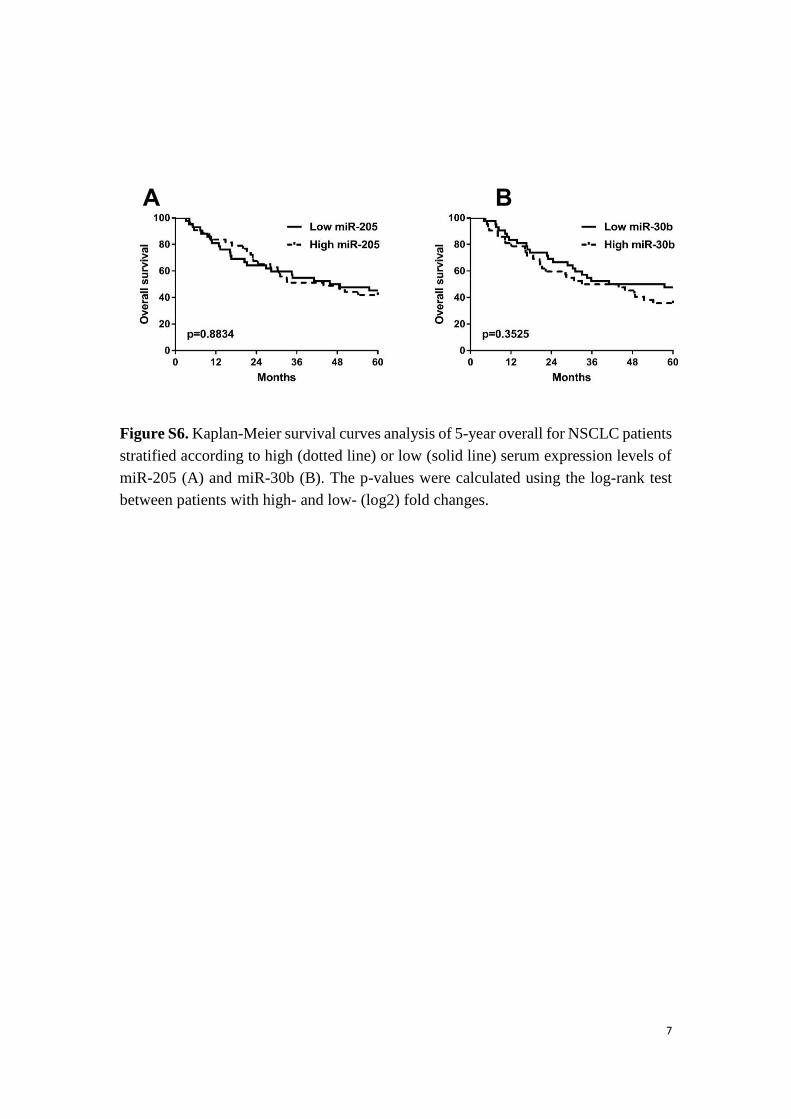
Figure S6. Kaplan-Meier survival curves analysis of 5-year overall for NSCLC patients
stratified according to high (dotted line) or low (solid line) serum expression levels of
miR-205 (A) and miR-30b (B). The p-values were calculated using the log-rank test
between patients with high- and low- (log2) fold changes.
A B

8
Figure S7. Kaplan-Meier survival curves analysis of 5-year overall for different
histological subtypes of NSCLC patients, stratified according to high (blue-colored line)
or low (red-colored line) serum expression levels of miR-146b (A-B) and miR-29c (C-
D) as well as the survival curves of different stages of NSCLC patients: stage I, II and
III. The p-values were calculated using the log-rank test between patients with relative
groups’ (log2) fold changes.
A B
C D
9
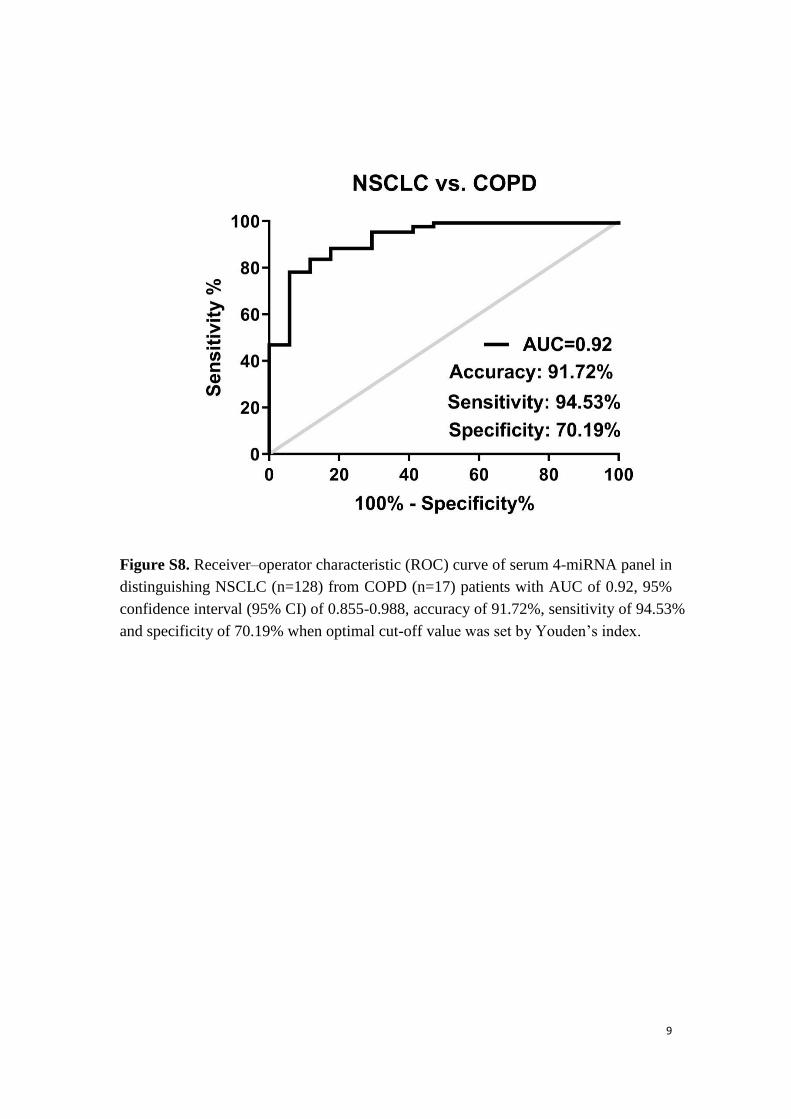
Figure S8. Receiver–operator characteristic (ROC) curve of serum 4-miRNA panel in
distinguishing NSCLC (n=128) from COPD (n=17) patients with AUC of 0.92, 95%
confidence interval (95% CI) of 0.855-0.988, accuracy of 91.72%, sensitivity of 94.53%
and specificity of 70.19% when optimal cut-off value was set by Youden’s index.

10
Figure S9. DAVID Gene Ontology analysis of miR-205 target genes
0 1 2 3 4 5 6 7
nervous system development
neg. reg. of macromolecule…
pos. reg. of macromolecule…
negative regulation of cellular…
regulation of macromolecule…
positive regulation of metabolic…
negative regulation of metabolic…
positive regulation of cellular…
negative regulation of cellular…
regulation of gene expression
regulation of transcription from…
positive regulation of biological…
anatomical structure…
positive regulation of gene…
regulation of metabolic process
regulation of primary metabolic…
transcription from RNA…
negative regulation of biological…
negative regulation of gene…
positive regulation of RNA…
positive regulation of nucleic acid-…
positive regulation of…
positive regulation of cellular…
positive regulation of RNA…
cardiovascular system development
P value (-log10)
GO BP term

11
Figure S10. DAVID Gene Ontology analysis of miR-30b target genes
0 2 4 6 8 10
cellular metabolic process
cellular macromolecule metabolic…
transcription, DNA-templated
cellular macromolecule…
nucleic acid-templated transcription
system development
regulation of cell communication
cellular biosynthetic process
regulation of signaling
macromolecule biosynthetic…
regulation of transcription, DNA-…
organic substance biosynthetic…
multicellular organism development
regulation of nucleic acid-…
regulation of macromolecule…
biosynthetic process
RNA biosynthetic process
regulation of RNA biosynthetic…
regulation of RNA metabolic…
regulation of cellular…
nervous system development
metabolic process
regulation of primary metabolic…
P value (-log10)
GO BP term

12
Figure S11. DAVID Gene Ontology analysis of miR-29C target genes
0 1 2 3 4 5 6
nervous system development
regulation of biological quality
system development
regulation of neurogenesis
single-multicellular organism…
positive regulation of biological…
multicellular organism…
regulation of neuron…
regulation of cell development
cognition
single-organism developmental…
neuron projection development
regulation of signaling
memory
regulation of neuron projection…
generation of neurons
regulation of cell communication
neurogenesis
negative regulation of cellular…
behavior
regulation of nervous system…
GO BP term
P value (-log10)

13
Table S1 Reported miRNAs changed in cancer
miRNA Deregulated
in cancers References
miR-146b Up [1-4]
miR-205 Up [5-8]
miR-29c Up [9-11]
miR-30b Up [12-14]
miR-31 Up [15-19]
miR-337 Up [20-22]
miR-411 Down [23-27]
miR-708 Down [28-32]
Reference:
1. Li J, Yang H, Li Y, et al. microRNA-146 up-regulation predicts the prognosis of non-small cell
lung cancer by miRNA in situ hybridization. Exp Mol Pathol. 2014; 96:195-199.
2. Li Y, Zhang H, Dong Y, et al. MiR-146b-5p functions as a suppressor miRNA and prognosis
predictor in non-small cell lung cancer. J Cancer. 2017; 8:1704-1716.
3. Patnaik SK, Kannisto E, Mallick R, et al. Overexpression of the lung cancer-prognostic miR-
146b microRNAs has a minimal and negative effect on the malignant phenotype of A549
lung cancer cells. PLoS One. 2011; 6: e22379.
4. Raponi M, Dossey L, Jatkoe T, et al. MicroRNA classifiers for predicting prognosis of
squamous cell lung cancer. Cancer Res. 2009; 69:5776-5783.
5. Sromek M, Glogowski M, Chechlinska M, et al. Changes in plasma miR-9, miR-16, miR-205
and miR-486 levels after non-small cell lung cancer resection. Cell Oncol (Dordr). 2017;
40:529-536.
6. Hu Y, Wang L, Gu J, et al. Identification of microRNA differentially expressed in three
subtypes of non-small cell lung cancer and in silico functional analysis. Oncotarget. 2017;
8:74554-74566.
7. Halvorsen AR, Bjaanaes M, LeBlanc M, et al. A unique set of 6 circulating microRNAs for
early detection of non-small cell lung cancer. Oncotarget. 2016; 7:37250-37259.
8. Li JH, Sun SS, Li N, et al. MiR-205 as a promising biomarker in the diagnosis and prognosis
of lung cancer. Oncotarget. 2017; 8:91938-91949.

14
9. Liu L, Bi N, Wu L, et al. MicroRNA-29c functions as a tumor suppressor by targeting VEGFA
in lung adenocarcinoma. Mol Cancer. 2017; 16:50.
10. Zhu W, He J, Chen D, et al. Expression of miR-29c, miR-93, and miR-429 as potential
biomarkers for detection of early stage non-small lung cancer. PLoS One. 2014; 9: e87780.
11. Zhan S, Wang C, Yin F. MicroRNA-29c inhibits proliferation and promotes apoptosis in non-
small cell lung cancer cells by targeting VEGFA. Mol Med Rep. 2018; 17:6705-6710.
12. Chen S, Li P, Yang R, et al. microRNA-30b inhibits cell invasion and migration through
targeting collagen triple helix repeat containing 1 in non-small cell lung cancer. Cancer Cell
Int. 2015; 15:85.
13. Zhong K, Chen K, Han L, et al. MicroRNA-30b/c inhibits non-small cell lung cancer cell
proliferation by targeting Rab18. BMC Cancer. 2014; 14:703.
14. Bianchi F, Nicassio F, Marzi M, et al. A serum circulating miRNA diagnostic test to identify
asymptomatic high-risk individuals with early stage lung cancer. EMBO Mol Med. 2011;
3:495-503.
15. Edmonds MD, Boyd KL, Moyo T, et al. MicroRNA-31 initiates lung tumorigenesis and
promotes mutant KRAS-driven lung cancer. J Clin Invest. 2016; 126:349-364.
16. Xu H, Ma J, Zheng J, et al. MiR-31 Functions as a Tumor Suppressor in Lung
Adenocarcinoma Mainly by Targeting HuR. Clin Lab. 2016; 62:711-718.
17. Tan X, Qin W, Zhang L, et al. A 5-microRNA signature for lung squamous cell carcinoma
diagnosis and hsa-miR-31 for prognosis. Clin Cancer Res. 2011; 17:6802-6811.
18. Zhang T, Wang Q, Zhao D, et al. The oncogenetic role of microRNA-31 as a potential
biomarker in oesophageal squamous cell carcinoma. Clin Sci (Lond). 2011; 121:437-447.
19. Wang YN, Chen ZH, Chen WC. Novel circulating microRNAs expression profile in colon
cancer: a pilot study. Eur J Med Res. 2017; 22:51.
20. Du L, Subauste MC, DeSevo C, et al. miR-337-3p and its targets STAT3 and RAP1A modulate
taxane sensitivity in non-small cell lung cancers. PLoS One. 2012; 7: e39167.
21. Yao Y, Suo AL, Li ZF, et al. MicroRNA profiling of human gastric cancer. Mol Med Rep. 2009;
2:963-970.
22. Kang HS, Kim J, Jang SG, et al. MicroRNA signature for HER2-positive breast and gastric
cancer. Anticancer Res. 2014; 34:3807-3810.

15
23. Wang SY, Li Y, Jiang YS, et al. Investigation of serum miR-411 as a diagnosis and prognosis
biomarker for non-small cell lung cancer. Eur Rev Med Pharmacol Sci. 2017; 21:4092-4097.
24. Xia LH, Yan QH, Sun QD, et al. MiR-411-5p acts as a tumor suppressor in non-small cell lung
cancer through targeting PUM1. Eur Rev Med Pharmacol Sci. 2018; 22:5546-5553.
25. Zhao Z, Qin L, Li S. miR-411 contributes the cell proliferation of lung cancer by targeting
FOXO1. Tumour Biol. 2016; 37:5551-5560.
26. van Schooneveld E, Wouters MC, Van der Auwera I, et al. Expression profiling of cancerous
and normal breast tissues identifies microRNAs that are differentially expressed in serum
from patients with (metastatic) breast cancer and healthy volunteers. Breast Cancer Res.
2012; 14:R34.
27. Wozniak MB, Scelo G, Muller DC, et al. Circulating MicroRNAs as Non-Invasive Biomarkers
for Early Detection of Non-Small-Cell Lung Cancer. PLoS One. 2015; 10: e0125026.
28. Jang JS, Jeon HS, Sun Z, et al. Increased miR-708 expression in NSCLC and its association
with poor survival in lung adenocarcinoma from never smokers. Clin Cancer Res. 2012;
18:3658-3667.
29. Molina-Pinelo S, Gutierrez G, Pastor MD, et al. MicroRNA-dependent regulation of
transcription in non-small cell lung cancer. PLoS One. 2014; 9: e90524.
30. Liu T, Wu X, Chen T, et al. Downregulation of DNMT3A by miR-708-5p Inhibits Lung Cancer
Stem Cell-like Phenotypes through Repressing Wnt/beta-catenin Signaling. Clin Cancer Res.
2018; 24:1748-1760.
31. Xing L, Todd NW, Yu L, et al. Early detection of squamous cell lung cancer in sputum by a
panel of microRNA markers. Mod Pathol. 2010; 23:1157-1164.
32. Leidinger P, Hart M, Backes C, et al. Differential blood-based diagnosis between benign
prostatic hyperplasia and prostate cancer: miRNA as source for biomarkers independent
of PSA level, Gleason score, or TNM status. Tumour Biol. 2016; 37:10177-10185.

16
Table S2: miRNAs differentially expressed in the training or testing set, or the two sets combined, together with the relative ROC analysis
miRNA AUC 95% CI Sensitivity (%) Specificity (%)
Training set (TR)
miR-146b 0.87 0.7826 to 0.9548 84.62 86.67 miR-205 0.88 0.8074 to 0.9582 70.31 93.33 miR-29c 0.94 0.8951 to 0.9917 88.89 93.33 miR-30b 0.72 0.617 to 0.8316 63.49 86.67 miR-337 0.71 0.5812 to 0.8453 61.9 80
Testing set (TS)
miR-146b 0.85 0.7718 to 0.9306 72.31 87.5 miR-205 0.92 0.8709 to 0.9748 81.82 93.75 miR-29c 0.89 0.8255 to 0.9552 84.62 84.38 miR-30b 0.76 0.6646 to 0.8551 73.85 62.5 miR-337 0.69 0.5811 to 0.7939 63.08 68.75
Two sets combined (TR+TS)
miR-146b 0.85 0.7942 to 0.9154 73.85 87.23
miR-205 0.91 0.8655 to 0.9501 81.54 87.23
miR-29c 0.91 0.862 to 0.9516 83.59 87.23
miR-30b 0.74 0.6683 to 0.8147 64.16 82.98
miR-337 0.69 0.6053 to 0.7705 63.28 72.34
Table S3: ROC analysis of 4 individual miRNAs in adenocarcinoma (AC) and squamous cell carcinoma (SCC) subgroup patients.
miRNA AUC 95% CI Sensitivity (%) Specificity (%)
AC (n=66) vs. cancer-free
controls (n=47)
miR-146b 0.93 0.8884 to 0.9794 87.23 89.39
miR-205 0.93 0.8844 to 0.9837 97.87 84.85
miR-29c 0.98 0.953 to 0.9973 91.49 92.42
miR-30b 0.87 0.8054 to 0.9344 85.11 80.3
SCC (n=62) vs. cancer-
free controls (n=47)
miR-146b 0.77 0.6828 to 0.8601 78.72 70.97
miR-205 0.88 0.8134 to 0.9402 80.85 80.65
miR-29c 0.83 0.7578 to 0.9103 87.23 70.97
miR-30b 0.60 0.4996 to 0.7101 82.98 40.32

17
Table S4: Clinicopathological characteristics of the 128 NSCLC patients, 17 COPD patients and 30 healthy subjects recruited in this study
NSCLC patients COPD patients Healthy individuals
Variables n (%) n (%) n (%)
Number 128 17 30
Age (years)
Mean ± SD 67.6± 9.5 65.0 ±9.4 63.6 ±9.1
Gender
Male 68 (53%) 10 (59%) 15 (50%) Female 60 (47%) 7 (41%) 15 (50%)
Smoking status
Nonsmoker 10 (8%) 4 (24%) 11 (37%) Smoker 118 (92%) 13 (76%) 19 (63%) >50p/y 53 (44%) 6 (35%) 7 (23%) <50p/y 65 ((56%) 11 (65%) 23 (77%)
Histological type
Adenocarcinoma (AC) 66 (52%) N/A N/A Squamous cell carcinoma 62 (48%) N/A N/A
TNM stage
I 75 (59%) N/A N/A II 33 (26%) N/A N/A III 20(15%) N/A N/A
Histological grade
Well 16 (12%) N/A N/A Moderate 53 (42%) N/A N/A Poor 44 (34%) N/A N/A Unknown 15 (12%) N/A N/A
Table S5: Univariate logistic regression analysis on the training and testing set for 5 individual miRNAs
miRNA
Training set (n=78) Testing set (n=97)
Regression coefficient (β)
95% CI p-value Regression
coefficient (β) 95% CI p-value
miR-146b 0.63 0.53-0.74 5.89E-06 0.49 0.39-0.58 3.82152E-10
miR-205 0.55 0.44-0.67 1.05E-07 0.37 0.28-0.46 4.47107E-16
miR-29c 0.53 0.42-0.64 5.13E-09 0.44 0.33-0.54 1.15544E-10
miR-30b 0.77 0.68-0.87 0.0293 0.62 0.53-0.71 3.89786E-05
miR-337 0.79 0.7-0.88 0.0457 0.63 0.54-0.73 0.0039