serum microrna signature as a diagnostic and therapeutic
TRANSCRIPT

Serum microRNA signature as a diagnostic and therapeutic marker in patients with psoriatic arthritis
Sarah M. Wade1,2, Trudy McGarry1,2, Siobhan C. Wade1, Ursula Fearon1,2, Douglas J. Veale2*.
1 Molecular Rheumatology, School of Medicine, Trinity Biomedical Sciences Institute, Trinity College Dublin, Dublin 2, Ireland.
2 The Centre for Arthritis and Rheumatic Disease, St. Vincent's University Hospital, and University College Dublin, Dublin 4, Ireland.
All correspondence to:
Prof Douglas Veale,
The Centre for Arthritis and Rheumatic Disease, St. Vincent's University Hospital, and University College Dublin, Dublin 4, Ireland.
.
Email: [email protected]
Phone: 00 353 1 896 2659
Running title: Serum miRNA in PsA
Page 1 of 24
Acc
epte
d A
rtic
le
This
arti
cle
has b
een
acce
pted
for p
ublic
atio
n in
The
Jour
nal o
f Rhe
umat
olog
y fo
llow
ing
full
peer
revi
ew. T
his v
ersi
on h
as n
ot g
one
thro
ugh
prop
er c
opye
ditin
g,
proo
frea
ding
and
type
setti
ng, a
nd th
eref
ore
will
not
be
iden
tical
to th
e fin
al p
ublis
hed
vers
ion.
Rep
rints
and
per
mis
sion
s are
not
ava
ilabl
e fo
r thi
s ver
sion
. Pl
ease
cite
this
arti
cle
as d
oi 1
0.38
99/jr
heum
.190
602.
Thi
s acc
epte
d ar
ticle
is p
rote
cted
by
copy
right
. All
right
s res
erve
d.
www.jrheum.orgDownloaded on December 11, 2021 from

Objective: MicroRNAs (miRNAs) are small endogenous regulatory RNA molecules, which
have emerged as potential therapeutic targets and biomarkers in autoimmunity. Here, we
investigated serum miRNA levels in Psoriatic arthritis (PsA) patients and further assessed a
serum miRNA signature in therapeutic responder versus non-responder PsA patients.
Methods: Serum samples were collected from healthy controls (n=20) and PsA (n=31) and
clinical demographics obtained. To examine circulatory miRNA in serum from HC and PsA
patients a focussed immunology miRNA panel was analysed utilising a miRNA Fireplex assay.
MiRNA expression was further assessed in responders versus non responders according to the
EULAR response criteria
Results: Six miRNA (miR-221-3p, miR-130a-3p, miR-146a-5p, miR-151-5p, miR-26a-5p and
miR-21-5p) were significantly higher in PsA compared to healthy controls (all p<0.05), with
high specificity and sensitivity determined by receiver operating characteristic (ROC) curve
analysis. Analysis of responder vs non-responders demonstrated higher baseline levels of miR-
221-3p, miR-130a-3p, miR-146a-5p, miR-151-5p and miR-26a-5p were associated with
therapeutic response.
Conclusion: This study identified a six-serum microRNA signature that could be attractive
candidates as non-invasive markers for PsA, and may help to elucidate the disease
pathogenesis.
Page 2 of 24
Acc
epte
d A
rtic
le
This
acc
epte
d ar
ticle
is p
rote
cted
by
copy
right
. All
right
s res
erve
d.
www.jrheum.orgDownloaded on December 11, 2021 from

Introduction
Small non-coding RNAs called microRNA (miRNA), that function as post-
transcriptional regulators of target genes, have become increasingly recognised as key
regulators in the development of autoimmune disease1. In addition to being capable of
modulating numerous auto-immunity-related genes2–4, several studies have also reported the
potential utilisation of circulating miRNA (serum, plasma and PBMC) as predicative non-
invasive biomarkers of therapeutic response5,6.
As a complex, chronic, multifaceted and progressive autoinflammatory disease,
psoriatic arthritis (PsA) would greatly benefit from markers of early diagnosis and therapeutic
intervention, to effectively suppress inflammation and control disease progression7,8. The
multifaceted presentation of synovial inflammation, joint destruction, enthesitis, axial disease
and skin manifestations often makes diagnosis difficult, with as many as 15-21% of patients
remaining undiagnosed in dermatology clinics9. Diagnostic delays as short as six months might
result in elevated bone erosion rates and significant deterioration in long-term physical
function10. While the treatment of PsA has greatly improved in recent years11, up to 47% of
patients show evidence of bone erosions within the first two years of initial diagnosis, despite
the use of conventional disease modifying agents12.
miRNAs have been shown to be altered in the synovial tissue and PBMC of PsA
patients13,14, supporting miRNA as possible diagnostic and prognostic biomarkers for PsA.
However, no studies have evaluated serum miRNA profiles in early PsA patients compared to
healthy controls (HC) or assessed the ability of baseline miRNA expression to stratify patient
outcomes to treatment. Therefore, the present study was designed to evaluate the expression
profile of circulating miRNAs, specifically focusing on a defined immunology miRNA panel,
in patients with PsA, to identify miRNAs associated with the disease and response to therapy.
Page 3 of 24
Acc
epte
d A
rtic
le
This
acc
epte
d ar
ticle
is p
rote
cted
by
copy
right
. All
right
s res
erve
d.
www.jrheum.orgDownloaded on December 11, 2021 from

Methods
Patient Recruitment
31 patients with PsA were recruited from the outpatient clinics at the Centre for Arthritis and
Rheumatic Diseases, St Vincent’s University Hospital. All patients fulfilled the CASPAR
criteria for the classification of PsA15. All patients were naïve to treatment and had active
inflammation in one or both knees at the time of assessment. The control group consisted of 20
healthy individuals who were negative for autoimmune diseases.
Baseline clinical and laboratory assessments included C-reactive protein (CRP), erythrocytes
sedimentation rates (ESR), swollen joint count (SJC) and tender joint count (TJC).
A group of 31 patients with follow up clinical data were classified as good, moderate and non-
responders to treatment according to the EULAR response criteria as previously described16–
19. Assessments were made independent of treatment type (disease-modifying anti-rheumatic
drugs) or time (3 months, 6 months and 9 months). Macroscopic synovitis and vascularity were
quantified under direct visualisation at arthroscopy using a well-established visual analogue
scale (VAS) 1–100 mm as previously described20.
All research was performed in accordance with the Declaration of Helsinki, and approval for
this study was granted by the St. Vincent’s University Hospital Medical Research and Ethics
Committee (RHEV7_09/16). All patients gave fully informed written consent prior to
inclusion.
FirePlex serum miRNA expression analysis
Peripheral blood was collected in anticoagulant-free tubes for obtaining serum. All bloods were
processed within 1 hr of collection. Samples were centrifuged at 2000 g for 10 min at room
temperature. Isolated serums were transferred to RNAse and DNAse free tubes and stored at -
Page 4 of 24
Acc
epte
d A
rtic
le
This
acc
epte
d ar
ticle
is p
rote
cted
by
copy
right
. All
right
s res
erve
d.
www.jrheum.orgDownloaded on December 11, 2021 from

80 °C until required for further analysis. Rather than performing a exploratory study examining
100s of miRNA, we performed a focussed immunology panel, designed based on a detailed
analysis of published miRNA data by the Abcam Fireplex miRNA Biofluid Assay (FirePlex
Bioworks Inc., Cambridge, MA, USA), as previously described21. Briefly a focussed panel 68
miRNA were analysed in 20 μL of serum by the Abcam Fireplex miRNA Biofluid Assay
(FirePlex Bioworks Inc., Cambridge, MA, USA. Target miRNA were hybridised to miRNA
target sequences on hydrogel FirePlex particles (35μL) at picomolar sensitivity and high
specificity following incubation at 37 °C for 60 min with shaking. Bound miRNA were labelled
with fluorescent adaptor molecules (75μL of Labelling Buffer) and incubated at room
temperature for 60 min with shaking. Eluted miRNA/adaptor complexes were amplified using
single step universal primer RT-amplification consisting of 27 cycles of PCR amplification
followed by 6 cycles of asymmetric amplification. Amplified products were re-hybridised and
incubated with 75μL of Reporting Buffer at room temperature for 15 min with shaking.
Following the addition of 175μL of Run Buffer, miRNA particles were quantitatively detected
on an EMD Millipore Guava 8HT flow cytometer and analysed by the FirePlex Analysis
Workbench (FirePlex Bioworks, USA). Red blood cell contamination was assessed by miRNA
haemolysis makers: hsa-miR-451a and hsa-miR-486-5p22. Samples were also corrected for
background signals determined by positive, negative and blank control wells. The GeNorm
normalisation strategy was used for normalisation23. Heatmaps were generated in FirePlex
Analysis Workbench and hierarchical clustering was performed with weighted and Ward’s
linkage. Six statistically significant miRNA (Bonferroni-corrected, p≤0.02) were chosen for
further analysis.
Statistical Analysis
Page 5 of 24
Acc
epte
d A
rtic
le
This
acc
epte
d ar
ticle
is p
rote
cted
by
copy
right
. All
right
s res
erve
d.
www.jrheum.orgDownloaded on December 11, 2021 from

The statistical significance of intergroup differences were determined by Kruskal-Wallis one-
way ANOVA test comparing the median values among all groups. Datasets for pair-wise
analysis were assessed using the D’Agostino & Pearson, and/or Shapiro-Wilk normality test to
confirm Gaussian distribution, followed by Student T-Tests to determine statistical
significance. Unsupervised two-way hierarchical clustering algorithm based on Ward linkage,
and Weighted linkage correlation metric was performed based on the normalized expression
profiles from the top 20 of the most variable microRNAs across all samples. The predicted
probability of being a good, moderate or non-responder was used to construct receiver
operating characteristic (ROC) curves. Area under the ROC curve (AUC) with 95% confidence
interval (CI), sensitivity, specificity and likelihood ratios were calculated to determine the
accuracy index for evaluating the predictive performance of the selected miRNA. Spearman’s
rank correlation coefficient was used to evaluate the association between miRNA levels and
clinical parameters.
Results
Distinct miRNA expression profile in PsA patient serum compared to healthy controls
To evaluate the relationship of serum miRNA expression profiles in early PsA patients and
HC, we profiled miRNA signatures in 31 early PsA patients naïve to treatment and 20 HC
subjects (Fig. 1). The baseline characteristics of the patients are provided in Supplementary
Table S1. Using the high throughput Firefly Bioworks miRNA-profiling technology, we
focussed on a 68 miRNA immunology panel based on their association with immune
dysfunction (Supplementary Table S2). Unsupervised hierarchical clustering of the 20 most
differentially expressed miRNA between PsA and HC serum showed independent clustering
of PsA patient and HC groups (Fig. 2), suggesting distinct miRNA serum profiles in PsA
patients compared to HC, with only 3 of the 31 PsA patients incorrectly clustered within the
HC cluster. In this profile, 14 miRNA showed elevated expression, while 6 miRNAs were
Page 6 of 24
Acc
epte
d A
rtic
le
This
acc
epte
d ar
ticle
is p
rote
cted
by
copy
right
. All
right
s res
erve
d.
www.jrheum.orgDownloaded on December 11, 2021 from

decreased compared to HC (Supplementary Table S3). Among the identified miRNAs, 6
miRNAs were significantly over-expressed in PsA compared to HC and further analysed: miR-
221-3p, miR-130a-3p, miR-146a-5p, miR-151-5p, miR-26a-5p (all p<0.001) and miR-21-5p
(p<0.01) (Fig. 3). Receiver operating characteristics (ROC) analysis were performed to
determine the sensitivity and specificity of these miRNA to discriminate between PsA and HC
(Fig. 4). Levels of miR-130a-3p and miR-26a-5p showed strong statistical separation between
PsA and controls with an AUC of 0.866 and 0.894, respectively. Multivariate analysis for the
strongest performing miRNA and the complete 6 miRNA signature, did not improve the
predictive value as compared to the individual miRNA (Supplementary Figure S3).
Furthermore, to ensure that the differential expression of miR-221-3p, miR-130a-3p, miR-
146a-5p, miR-151-5p, miR-26a-5p and miR-21-5p observed in PsA serum is due to disease-
specific associations, miRNA serum expression was compared to the non-specific markers of
inflammation, ESR and CRP (Supplementary Figure S1 and S2). Among the 6 differentially
expressed miRNA only miR-130a-3p and miR-146a-5p expression levels correlated with CRP
levels (p=0.004, r=0.52 and p=0.03, r=0.41, respectively), with no significant correlation
observed between these differentially expressed miRNA and the ESR.
Baseline serum miRNA expression predict treatment response
Treatment response was determined according to the EULAR response criteria as previously
described 16–19, independent of type or duration of medication. Baseline characteristics of the
study population separated according to their follow-up treatment response status are presented
in Supplementary Table 4. We found that demographic variables (age, sex), clinical scores
(SJC, TJC, VAS) and markers of synovial inflammation (synovitis and vascularity) were not
significantly different across good/moderate and non-responder PsA patients at baseline. In
contrast to this, we demonstrated that baseline serum expression of miR-130a-3p (P<0.01),
Page 7 of 24
Acc
epte
d A
rtic
le
This
acc
epte
d ar
ticle
is p
rote
cted
by
copy
right
. All
right
s res
erve
d.
www.jrheum.orgDownloaded on December 11, 2021 from

miR-221-3p, miR-146a-5p, miR-151a-5p and miR-26a-5p (all p<0.05) discriminated PsA
responders and non-responders to treatment, with a good therapeutic response associated with
a higher baseline miRNA expression (Fig. 5). This discrimination was found to be independent
of disease duration as miRNA levels did not correlate with disease duration. Among the
patients analysed, 49% were receiving DMARD treatment, while 51% were being treated with
biologic agents. Further analysis demonstrated that any significant difference in baseline
expression of miR-130a-3p, miR-221-3p, miR-146a-5p, miR-151a-5p and miR-26a-5p and the
response rates did not differ between the two treatment classes.
To further support these observations, ROC analysis was performed to evaluate the
performance of baseline serum miRNA expression to discriminate patient treatment responses.
The best performing miRNA for separation between good- and moderate/non-responder
treatment outcomes were miR-221-3p, miR-130-3p and miR-146a-3p, with AUC values of
0.747, 0.760 and 0.717 respectively (Fig. 6). Multivariate analysis did not improve the
prognostic value of this 6-miRNA signature in distinguishing patients according to treatment
response (Supplementary Figure S4).
Discussion
The identification of non-invasive, convenient and reliable biomarkers for the early diagnosis
and prediction of treatment response outcomes in autoimmune disease is an area of intensive
investigation. In the present study, we identified serum-derived miRNAs as potential
biomarkers that can support the early diagnosis of PsA patients and retrospectively stratify
patients as good/moderate and non-responders to treatment. The levels of miR-221-3p, miR-
130a-3p, miR-146a-5p, miR-151-5p, miR-26a-5p and miR-21-5p were differentially expressed
in PsA patients when compared to healthy control subjects, with higher levels observed in
patients with higher disease activity. Lower baseline levels of miR-221-3p, miR-130a-3p, miR-
146a-5p, miR-151-5p and miR-26a-5p but not miR-21-5p were observed in PsA with a poor
Page 8 of 24
Acc
epte
d A
rtic
le
This
acc
epte
d ar
ticle
is p
rote
cted
by
copy
right
. All
right
s res
erve
d.
www.jrheum.orgDownloaded on December 11, 2021 from

therapeutic response compared to good and/or moderate responders. Among them, miR-221-
3p, miR-130a-3p and miR-146a-3p exhibited the highest accuracy in the stratification of patient
response.
A number of clinical trials have recently assessed circulating miRNA as biomarkers of disease
diagnosis and treatment response in a number of diseases, including cancer and type 2
diabetes24–26. Recent efforts to identify serum-based biomarkers have increased as advances in
technology have occurred. In addition to their stability across repeated freeze-thaw cycles27,
the ability of serum miRNA to correlate with disease activity scores are also feasible.
Therefore, we hypothesised that serum miRNA could be utilised as potential biomarkers of
both PsA diagnosis and treatment response. In this study, we identified for the first time several
differentially expressed serum-derived miRNA in the PsA patient compared to healthy control
subjects. Hierarchical clustering revealed a distinguished two-cluster miRNA heatmap profile,
with most of the healthy control subjects clustering together in cluster 1 and PsA patients
separating out into cluster 2, supporting clear miRNA expression differences between PsA and
control serum. By focusing on miRNA with a significant fold change of >1.5 and previous
associations with immunological functionalities, we identified 9 miRNAs of special interest:
miR-130a-3p, miR-146a-5p, miR-221-3p, miR-744-5p, miR-33a-5p, miR-151-5p, miR-26a-
5p, miR-494-3p and miR-21-5p. Interestingly, elevated levels of these miRNA were also found
in early PsA patients with low disease activity, suggesting that the potential value of these
miRNA as biomarkers of early disease diagnosis. Many of these miRNAs are also elevated in
the circulation of patients with other inflammatory driven autoimmune diseases, such as
ulcerative colitis, RA and multiple sclerosis28–30, but have not been previously reported as a
serum miRNA biomarker for PsA diagnosis. Consistent with a recent miRNA expression
profile in the plasma and peripheral blood of early PsA patients13, serum based miR-21-5p was
significantly increased in early PsA patients compared to healthy controls. Previous studies
Page 9 of 24
Acc
epte
d A
rtic
le
This
acc
epte
d ar
ticle
is p
rote
cted
by
copy
right
. All
right
s res
erve
d.
www.jrheum.orgDownloaded on December 11, 2021 from

have revealed that elevated miR-21-5p is involved in psoriasis related inflammation and
modulates keratinocyte proliferation, represses T-cell apoptosis and promotes angiogenesis
mechanisms31–33. A recent study demonstrated that inhibition of miR-21 ameliorated dermal
thickness in patient-derived psoriatic skin xenografts and psoriasis models34, which indicate
that miR-21-5p plays a pivotal role in psoriasis development and progression. However, further
experiments are required to elucidate the pathogenic mechanism of action of miR-21-5p in PsA
pathogenesis. In support of the observations made in the present study, recent reports
demonstrate elevated expression of miR-146a-5p in CD14+ monocytes from patients with PsA
compared to both PsO patients and HC35, and that a single nucleotide polymorphism in the
miR-146a gene was associated with the progression of PsA36, an association that appears to be
functional in PsA but not RA patients37. Furthermore, in terms of therapeutic response, elevated
serum levels of miR-130a-3p in patients with ovarian cancer have been associated with
therapeutic resistance to cisplatin38, which is consistent with other reports in glioblastoma
patients and their response to a temazolamide treatment regimen6. Similarly, serum expression
of miR-26a was significantly decreased in patients with PsO following effective treatment with
the anti-TNFα agent, etanercept39. While our findings are similar to these external validation
studies, larger multicentre studies will be required to validate our findings. As the majority of
PsA patients develop PsO first, future studies to evaluate the association between this 6-
miRNA signature and PsO may also further understanding of their pathogenic role in disease
progression.
Another novel aspect of this work is the utilisation of the more clinically amenable, FirePlex
Biofluids miRNA Assay. Previous protocols employed to detect circulating miRNA in
inflammatory arthritis patients relied on laborious isolation techniques, high sample volume to
obtain sufficient miRNA or pooled patient samples13,40–42. These approaches exhibit high yield
variability amongst commercial isolation kits, require rigorous post-hoc confirmation analysis
Page 10 of 24
Acc
epte
d A
rtic
le
This
acc
epte
d ar
ticle
is p
rote
cted
by
copy
right
. All
right
s res
erve
d.
www.jrheum.orgDownloaded on December 11, 2021 from
and fail to provide individual patient information43. As such, none of these approaches have
led to clinical use to date. In contrast to this, the FirePlex platform allows for miRNA detection
in just 20 μL of crude non-isolated serum that can be measured by conventional flow cytometry
machines and allows for statistical analysis on individual patient miRNA levels to stratify
disease groups and potentially inform clinical decisions.
Effective management in the early stages of disease will slow progression and have significant
implications for improving patient quality of life, yet it remains a great challenge to identify
“at risk” or “high-priority” patients by currently available routine clinical parameters. Here, we
identify a set of 6 miRNA (miR-221-3p, miR-130a-3p, miR-146a-5p, miR-151-5p, miR-26a-
5p and miR-21-5p) which distinguished good/moderate and non-responders in early PsA,
independent of treatment type or duration. Interestingly, serum miRNAs better stratified
patients according to treatment response compared to routine parameters of disease activity. In
particular, our study revealed that higher baseline levels of miR-130-3p, miR-146a-3p and
miR-221-3p, were associated with more optimal treatment responses. Consistent with these
observations, miR-221-3p expression has been previously associated with patient prognosis
and sensitivity to therapy in cancer44,45. Moreover, miR-130a-3p was reported to modulate
TNF-related apoptosis-inducing ligand sensitivity in non-small cell lung cancer through MET-
meditated regulation of miR-221/22246. These data support the potential ability of these
miRNA to improve the identification of treatment responders in early disease. However, these
findings require confirmation in larger study populations. Future studies might also analyse the
usefulness of serum miRNA as pharmacodynamic biomarkers to monitor response to
treatment. Furthermore, identification of the cellular source of these circulating miRNAs could
offer deeper insights into the functional roles of these miRNA in the pathogenesis of PsA and
treatment response.
Page 11 of 24
Acc
epte
d A
rtic
le
This
acc
epte
d ar
ticle
is p
rote
cted
by
copy
right
. All
right
s res
erve
d.
www.jrheum.orgDownloaded on December 11, 2021 from

In conclusion, serum-based expression of miR-221-3p, miR-130a-3p, miR-146a-5p, miR-151-
5p, miR-26a-5p and miR-21-5p discriminated PsA patients with early disease from healthy
controls and successfully stratified treatment response groups from baseline levels, supporting
serum miRNA as potential diagnostic and prognosistic markers in PsA.
Acknowledgements
The authors would like to acknowledge the financial support from the Maeve Binchy Funding
for Arthritis Research and the IRC post-graduate fellowship. We are grateful to Dr. Carl Orr,
Michael R Tackett and Francis Young for assistance with this study.
References
1. Pauley KM, Cha S, Chan EKL. MicroRNA in autoimmunity and autoimmune diseases. J Autoimmun NIH Public Access; 2009;32:189-94.
2. O’Connell RM, Chaudhuri AA, Rao DS, Baltimore D. Inositol phosphatase SHIP1 is a primary target of miR-155. Proc Natl Acad Sci U S A National Academy of Sciences; 2009;106:7113-8.
3. Taganov KD, Boldin MP, Chang K-J, Baltimore D. NF- B-dependent induction of microRNA miR-146, an inhibitor targeted to signaling proteins of innate immune responses. Proc Natl Acad Sci 2006;103:12481-6.
4. Wang K, Zhang S, Weber J, Baxter D, Galas DJ. Export of microRNAs and microRNA-protective protein by mammalian cells. Nucleic Acids Res 2010;38:7248-59.
5. Kleivi Sahlberg K, Bottai G, Naume B, Burwinkel B, Calin GA, Borresen-Dale A-L, et al. A Serum MicroRNA Signature Predicts Tumor Relapse and Survival in Triple-Negative Breast Cancer Patients. Clin Cancer Res 2015;21:1207-14.
6. Chen H, Li X, Li W, Zheng H. miR-130a can predict response to temozolomide in patients with glioblastoma multiforme, independently of O6-methylguanine-DNA methyltransferase. J Transl Med 2015;13:69.
7. Gladman DD, Thavaneswaran A, Chandran V, Cook RJ. Do patients with psoriatic arthritis who present early fare better than those presenting later in the disease? Ann Rheum Dis 2011;70:2152-4.
8. Coates LC, Moverley AR, McParland L, Brown S, Navarro-Coy N, O’Dwyer JL, et al. Effect of tight control of inflammation in early psoriatic arthritis (TICOPA): a UK multicentre, open-label, randomised controlled trial. Lancet 2015;386:2489-98.
Page 12 of 24
Acc
epte
d A
rtic
le
This
acc
epte
d ar
ticle
is p
rote
cted
by
copy
right
. All
right
s res
erve
d.
www.jrheum.orgDownloaded on December 11, 2021 from

9. Villani AP, Rouzaud M, Sevrain M, Barnetche T, Paul C, Richard M-A, et al. Prevalence of undiagnosed psoriatic arthritis among psoriasis patients: Systematic review and meta-analysis. J Am Acad Dermatol 2015;73:242-8.
10. Bergman M, Lundholm A. Mitigation of disease- and treatment-related risks in patients with psoriatic arthritis. Arthritis Res Ther 2017;19:63.
11. Saber TP, Ng CT, Renard G, Lynch BM, Pontifex E, Walsh CAE, et al. Remission in psoriatic arthritis: is it possible and how can it be predicted? Arthritis Res Ther 2010;12:R94.
12. Kane D, Stafford L, Bresnihan B, FitzGerald O. A prospective, clinical and radiological study of early psoriatic arthritis: an early synovitis clinic experience. Rheumatology 2003;42:1460-8.
13. Ciancio G, Ferracin M, Saccenti E, Bagnari V, Farina I, Furini F, et al. Characterisation of peripheral blood mononuclear cell microRNA in early onset psoriatic arthritis. Clin Exp Rheumatol 2017;35:113-21.
14. Wade SM, Trenkmann M, McGarry T, Canavan M, Marzaioli V, Wade SC, et al. Altered expression of microRNA-23a in psoriatic arthritis modulates synovial fibroblast pro-inflammatory mechanisms via phosphodiesterase 4B. J Autoimmun 2019;96:86-93.
15. Taylor W, Gladman D, Helliwell P, Marchesoni A, Mease P, Mielants H. Classification criteria for psoriatic arthritis: development of new criteria from a large international study. Arthritis Rheum 2006;54:2665-73.
16. Fransen J, van Riel PLCM. The Disease Activity Score and the EULAR Response Criteria. Rheum Dis Clin North Am 2009;35:745-57.
17. Glintborg B, Østergaard M, Krogh NS, Andersen MD, Tarp U, Loft AG, et al. Clinical Response, Drug Survival, and Predictors Thereof Among 548 Patients With Psoriatic Arthritis Who Switched Tumor Necrosis Factor α Inhibitor Therapy: Results from the Danish Nationwide DANBIO Registry. Arthritis Rheum 2013;65:1213-23.
18. Ademowo OS, Hernandez B, Collins E, Rooney C, Fearon U, van Kuijk AW, et al. Discovery and confirmation of a protein biomarker panel with potential to predict response to biological therapy in psoriatic arthritis. Ann Rheum Dis 2016;75:234-41.
19. Collins ES, Butt AQ, Gibson DS, Dunn MJ, Fearon U, van Kuijk AW, et al. A clinically based protein discovery strategy to identify potential biomarkers of response to anti-TNF-α treatment of psoriatic arthritis. Proteomics Clin Appl 2016;10:645-62.
20. Ng CT, Biniecka M, Kennedy A, McCormick J, FitzGerald O, Bresnihan B, et al. Synovial tissue hypoxia and inflammation in vivo. Ann Rheum Dis 2010;69:1389-95.
21. Chapin SC, Appleyard DC, Pregibon DC, Doyle PS. Rapid microRNA Profiling on Encoded Gel Microparticles. Angew Chem Int Ed 2011;50:2289-93.
22. Pritchard CC, Kroh E, Wood B, Arroyo JD, Dougherty KJ, Miyaji MM, et al. Blood Cell Origin of Circulating MicroRNAs: A Cautionary Note for Cancer Biomarker Studies. Cancer Prev Res 2012;5:492-7.
23. Vandesompele J, De Preter K, Pattyn F, Poppe B, Van Roy N, De Paepe A, et al. Accurate normalization of real-time quantitative RT-PCR data by geometric averaging
Page 13 of 24
Acc
epte
d A
rtic
le
This
acc
epte
d ar
ticle
is p
rote
cted
by
copy
right
. All
right
s res
erve
d.
www.jrheum.orgDownloaded on December 11, 2021 from

of multiple internal control genes. Genome Biol 2002;3:research0034.1.
24. Bagnoli M, Canevari S, Califano D, Losito S, Maio M Di, Raspagliesi F, et al. Development and validation of a microRNA-based signature (MiROvaR) to predict early relapse or progression of epithelial ovarian cancer: a cohort study. Lancet Oncol 2016;17:1137-46.
25. Montani F, Marzi MJ, Dezi F, Dama E, Carletti RM, Bonizzi G, et al. miR-Test: A Blood Test for Lung Cancer Early Detection. J Natl Cancer Inst 2015;107.
26. Zhu H, Leung SW. Identification of microRNA biomarkers in type 2 diabetes: a meta-analysis of controlled profiling studies. Diabetologia 2015;58:900-11.
27. Balzano F, Deiana M, Giudici S, Oggiano A, Baralla A, Pasella S, et al. miRNA Stability in Frozen Plasma Samples. Molecules 2015;20:19030-40.
28. Wu F, Guo NJ, Tian H, Marohn M, Gearhart S, Bayless TM, et al. Peripheral blood microRNAs distinguish active ulcerative colitis and Crohn’s disease. Inflamm Bowel Dis 2011;17:241-50.
29. Stanczyk J, Pedrioli DML, Brentano F, Sanchez-Pernaute O, Kolling C, Gay RE, et al. Altered expression of MicroRNA in synovial fibroblasts and synovial tissue in rheumatoid arthritis. Arthritis Rheum 2008;58:1001-9.
30. Gandhi R, Healy B, Gholipour T, Egorova S, Musallam A, Hussain MS, et al. Circulating MicroRNAs as biomarkers for disease staging in multiple sclerosis. Ann Neurol 2013;73:729-40.
31. Ichihara A, Jinnin M, Yamane K, Fujisawa A, Sakai K, Masuguchi S, et al. microRNA-mediated keratinocyte hyperproliferation in psoriasis vulgaris. Br J Dermatol 2011;165:1003-10.
32. Liu L-Z, Li C, Chen Q, Jing Y, Carpenter R, Jiang Y, et al. MiR-21 Induced Angiogenesis through AKT and ERK Activation and HIF-1α Expression. PLoS One 2011;6:e19139.
33. Meisgen F, Xu N, Wei T, Janson PC, Obad S, Broom O, et al. MiR-21 is up-regulated in psoriasis and suppresses T cell apoptosis. Exp Dermatol 2012;21:312-4.
34. Guinea-Viniegra J, Jimenez M, Schonthaler HB, Navarro R, Delgado Y, Jose Concha-Garzon M, et al. Targeting miR-21 to Treat Psoriasis. Sci Transl Med 2014;6:225
35. Lin S-H, Ho J-C, Li S-C, Chen J-F, Hsiao C-C, Lee C-H. MiR-146a-5p Expression in Peripheral CD14+ Monocytes from Patients with Psoriatic Arthritis Induces Osteoclast Activation, Bone Resorption, and Correlates with Clinical Response. J Clin Med 2019;8.
36. Maharaj AB, Naidoo P, Ghazi T, Abdul NS, Dhani S, Docrat TF, et al. MiR-146a G/C rs2910164 variation in South African Indian and Caucasian patients with psoriatic arthritis. BMC Med Genet 2018;19:48.
37. Xiao Y, Liu H, Chen L, Wang Y, Yao X, Jiang X. Association of microRNAs genes polymorphisms with arthritis: a systematic review and meta-analysis. Biosci Rep 2019;39.
38. Chen C, Wang H, Yang L-Y, Jia X, Xu P, Chen J, et al. [Expression of MiR-130a in
Page 14 of 24
Acc
epte
d A
rtic
le
This
acc
epte
d ar
ticle
is p
rote
cted
by
copy
right
. All
right
s res
erve
d.
www.jrheum.orgDownloaded on December 11, 2021 from

Serum Samples of Patients with Epithelial Ovarian Cancer and Its Association with Platinum Resistance]. Journal of Sichuan University 2016;47:60-3.
39. Pivarcsi A, Meisgen F, Xu N, Ståhle M, Sonkoly E. Changes in the level of serum microRNAs in patients with psoriasis after antitumour necrosis factor-α therapy. Br J Dermatol 2013;169:563-70.
40. Castro-Villegas C, Pérez-Sánchez C, Escudero A, Filipescu I, Verdu M, Ruiz-Limón P, et al. Circulating miRNAs as potential biomarkers of therapy effectiveness in rheumatoid arthritis patients treated with anti-TNFα. Arthritis Res Ther 2011;17.
41. Hruskova V, Jandova R, Vernerova L, Mann H, Pecha O, Prajzlerova K, et al. MicroRNA-125b: association with disease activity and the treatment response of patients with early rheumatoid arthritis. Arthritis Res Ther 2016;18:124.
42. Murata K, Yoshitomi H, Tanida S, Ishikawa M, Nishitani K, Ito H, et al. Plasma and synovial fluid microRNAs as potential biomarkers of rheumatoid arthritis and osteoarthritis. Arthritis Res Ther 2010;12.
43. Moldovan L, Batte KE, Trgovcich J, Wisler J, Marsh CB, Piper M. Methodological challenges in utilizing miRNAs as circulating biomarkers. J Cell Mol Med 2014;18:371-90.
44. Khella HWZ, Butz H, Ding Q, Rotondo F, Evans KR, Kupchak P, et al. miR-221/222 Are Involved in Response to Sunitinib Treatment in Metastatic Renal Cell Carcinoma. Mol Ther American Society of Gene & Cell Therapy 2015;23:1748-58.
45. Garofalo M, Quintavalle C, Romano G, Croce CM, Condorelli G. miR221/222 in cancer: their role in tumor progression and response to therapy. Curr Mol Med 2012;12:27-33.
46. Acunzo M, Visone R, Romano G, Veronese A, Lovat F, Palmieri D, et al. miR-130a targets MET and induces TRAIL-sensitivity in NSCLC by downregulating miR-221 and 222. Oncogene 2012;31:634-42.
Page 15 of 24
Acc
epte
d A
rtic
le
This
acc
epte
d ar
ticle
is p
rote
cted
by
copy
right
. All
right
s res
erve
d.
www.jrheum.orgDownloaded on December 11, 2021 from
Author Contributions
U.F., T.M. and S.M.W. conceived study and designed experiments. D.J.V., S.C.W. and S.M.W.
Patient recruitment and sample collection. S.M.W., U.F. and D.J.V. Data analysis and
interpretation. S.M.W., U.F. and D.J.V. wrote the manuscript. All authors read and approved
the final manuscript.
Additional Information
Competing financial interests: The authors declare no competing financial interests.
Figure Legends
Figure 1 Process of PsA patient serum miRNA analysis. PsA patients naïve to treatment
were recruited at baseline and their clinical progression followed. Fireplex Biofluid miRNA
assays with 68 immune associated miRNA were used to identify candidate diagnostic
biomarkers in a quick and easy step-wise protocol. Baseline miRNA levels were retrospectively
stratified to identify potential serum miRNA biomarkers of treatment response in early disease.
DAS28, Disease activity score; CRP, C-reactive protein; ESR, erythrocyte sedimentation rate;
SJC, swollen joint count; TJC, tender joint count. Image has been modified with permission
from the FirePlex miRNA Assay technical note. Copyright © 2017 Abcam.
Figure 2 Hierarchical clustering analysis of miRNA expression for the top 20
differentially expressed miRNAs in early PsA. Heatmap of individual serum miRNA
expression in 31 patients with PsA and 20 healthy controls. Each column represents single
miRNA and each row represents individual samples. The colour key indicates the degree of
differential expression: green, lower expression; black, no change and red, higher expression.
Page 16 of 24
Acc
epte
d A
rtic
le
This
acc
epte
d ar
ticle
is p
rote
cted
by
copy
right
. All
right
s res
erve
d.
www.jrheum.orgDownloaded on December 11, 2021 from

Two major clusters were identified by unsupervised two-way hierarchical miRNA (weighted
linkage) and sample (ward’s linkage) clustering analysis.
Figure 3 The expression of the 6 most differentially expressed miRNA in the serum from
patients with early PsA compared to healthy controls. Relative expression of a group of 6
serum mRNA in PsA patients (n-=31) versus HC subjects (n=20). P values were determined
using student t-test when comparing the differences between two groups. *p<0.05, significantly
different to comparator.
Figure 4 Receiver operating characteristic (ROC) curve analysis for PsA diagnosis. ROC
curves of PsA patients (n=31) based on miRNA expression in serum compared to HC subjects
(n=20). Area under the curve (AUC) was calculated with 95% confidence limits.
Figure 5 Relative expression of baseline serum miRNAs in PsA patients with good,
moderate and non-response to treatment. Relative expression of a group of 6 baseline serum
miRNA plotted as a function of treatment response. Non-responding patients (n=19) tended to
have lower baseline serum miRNA levels than in those with a good - moderate response (n=16).
P values were determined using student t-test when comparing the differences between two
groups. *p<0.05, significantly different to comparator.
Figure 6 ROC curve analysis for baseline serum miRNA as a predictor of treatment
response. Area under the curve (AUC) estimation for serum miRNA in responders (n=16)
compared to non-responders (n=19). Area under the curve (AUC) was calculated with 95%
confidence limits.
Page 17 of 24
Acc
epte
d A
rtic
le
This
acc
epte
d ar
ticle
is p
rote
cted
by
copy
right
. All
right
s res
erve
d.
www.jrheum.orgDownloaded on December 11, 2021 from

Page 18 of 24
Acc
epte
d A
rtic
le
This
acc
epte
d ar
ticle
is p
rote
cted
by
copy
right
. All
right
s res
erve
d.
www.jrheum.orgDownloaded on December 11, 2021 from

Figure 1 Process of PsA patient serum miRNA analysis. PsA patients naïve to treatment were recruited at baseline and their clinical progression followed. Fireplex Biofluid miRNA assays with 68 immune associated miRNA were used to identify candidate diagnostic biomarkers in a quick and easy step-
wise protocol. Baseline miRNA levels were retrospectively stratified to identify potential serum miRNA biomarkers of treatment response in early disease. DAS28, Disease activity score; CRP, C-reactive protein;
ESR, erythrocyte sedimentation rate; SJC, swollen joint count; TJC, tender joint count. Image has been modified with permission from the FirePlex miRNA Assay technical note. Copyright © 2017 Abcam.
254x190mm (300 x 300 DPI)
Page 19 of 24
Acc
epte
d A
rtic
le
This
acc
epte
d ar
ticle
is p
rote
cted
by
copy
right
. All
right
s res
erve
d.
www.jrheum.orgDownloaded on December 11, 2021 from
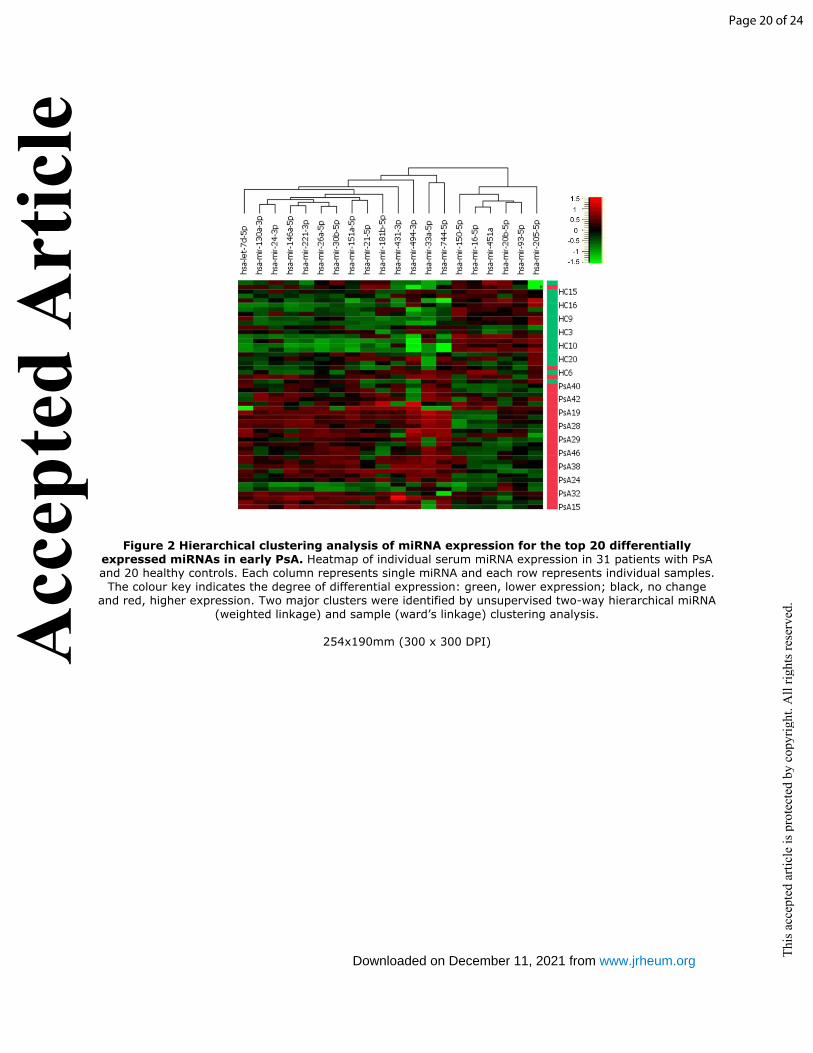
Figure 2 Hierarchical clustering analysis of miRNA expression for the top 20 differentially expressed miRNAs in early PsA. Heatmap of individual serum miRNA expression in 31 patients with PsA and 20 healthy controls. Each column represents single miRNA and each row represents individual samples.
The colour key indicates the degree of differential expression: green, lower expression; black, no change and red, higher expression. Two major clusters were identified by unsupervised two-way hierarchical miRNA
(weighted linkage) and sample (ward’s linkage) clustering analysis.
254x190mm (300 x 300 DPI)
Page 20 of 24
Acc
epte
d A
rtic
le
This
acc
epte
d ar
ticle
is p
rote
cted
by
copy
right
. All
right
s res
erve
d.
www.jrheum.orgDownloaded on December 11, 2021 from
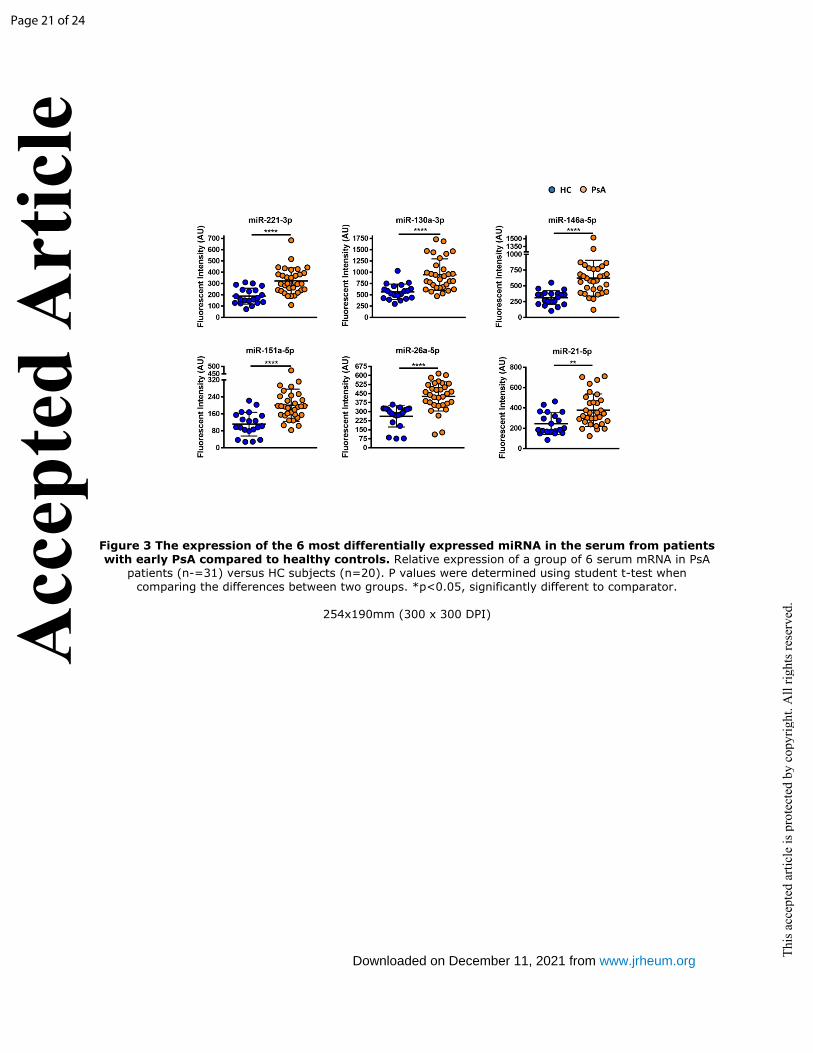
Figure 3 The expression of the 6 most differentially expressed miRNA in the serum from patients with early PsA compared to healthy controls. Relative expression of a group of 6 serum mRNA in PsA
patients (n-=31) versus HC subjects (n=20). P values were determined using student t-test when comparing the differences between two groups. *p<0.05, significantly different to comparator.
254x190mm (300 x 300 DPI)
Page 21 of 24
Acc
epte
d A
rtic
le
This
acc
epte
d ar
ticle
is p
rote
cted
by
copy
right
. All
right
s res
erve
d.
www.jrheum.orgDownloaded on December 11, 2021 from

Figure 4 Receiver operating characteristic (ROC) curve analysis for PsA diagnosis. ROC curves of PsA patients (n=31) based on miRNA expression in serum compared to HC subjects (n=20). Area under the
curve (AUC) was calculated with 95% confidence limits.
254x190mm (300 x 300 DPI)
Page 22 of 24
Acc
epte
d A
rtic
le
This
acc
epte
d ar
ticle
is p
rote
cted
by
copy
right
. All
right
s res
erve
d.
www.jrheum.orgDownloaded on December 11, 2021 from

Figure 5 Relative expression of baseline serum miRNAs in PsA patients with good, moderate and non-response to treatment. Relative expression of a group of 6 baseline serum miRNA plotted as a function of treatment response. Non-responding patients (n=19) tended to have lower baseline serum miRNA levels than in those with a good - moderate response (n=16). P values were determined using student t-test when comparing the differences between two groups. *p<0.05, significantly different to
comparator.
254x190mm (300 x 300 DPI)
Page 23 of 24
Acc
epte
d A
rtic
le
This
acc
epte
d ar
ticle
is p
rote
cted
by
copy
right
. All
right
s res
erve
d.
www.jrheum.orgDownloaded on December 11, 2021 from

Figure 6 ROC curve analysis for baseline serum miRNA as a predictor of treatment response. Area under the curve (AUC) estimation for serum miRNA in responders (n=16) compared to non-responders
(n=19). Area under the curve (AUC) was calculated with 95% confidence limits.
254x190mm (300 x 300 DPI)
Page 24 of 24
Acc
epte
d A
rtic
le
This
acc
epte
d ar
ticle
is p
rote
cted
by
copy
right
. All
right
s res
erve
d.
www.jrheum.orgDownloaded on December 11, 2021 from