supplementary figures 1 – 4 supplementary table...
TRANSCRIPT
1
Physiologically-based pharmacokinetic modelling (PBPK) with dynamic PET data to study the in vivo effects of transporter inhibition on hepatobiliary clearance in mice
Supplementary Figures 1 – 4 Supplementary Table 1
Marco F. Taddio 1, Linjing Mu 2, Claudia Keller 1, Roger Schibli 1, Stefanie D. Krämer 1
1 Radiopharmaceutical Science and Biopharmacy, Institute of Pharmaceutical Sciences, Department of Chemistry and Applied Biosciences, ETH Zurich, Zurich, Switzerland
2 Department of Nuclear Medicine, University Hospital Zurich, Switzerland
Corresponding author:
Stefanie Krämer Radiopharmaceutical Science and Biopharmacy Institute of Pharmaceutical Sciences Department of Chemistry and Applied Biosciences ETH Zurich Vladimir-Prelog-Weg 4 CH-8093 Zurich Switzerland [email protected]
2
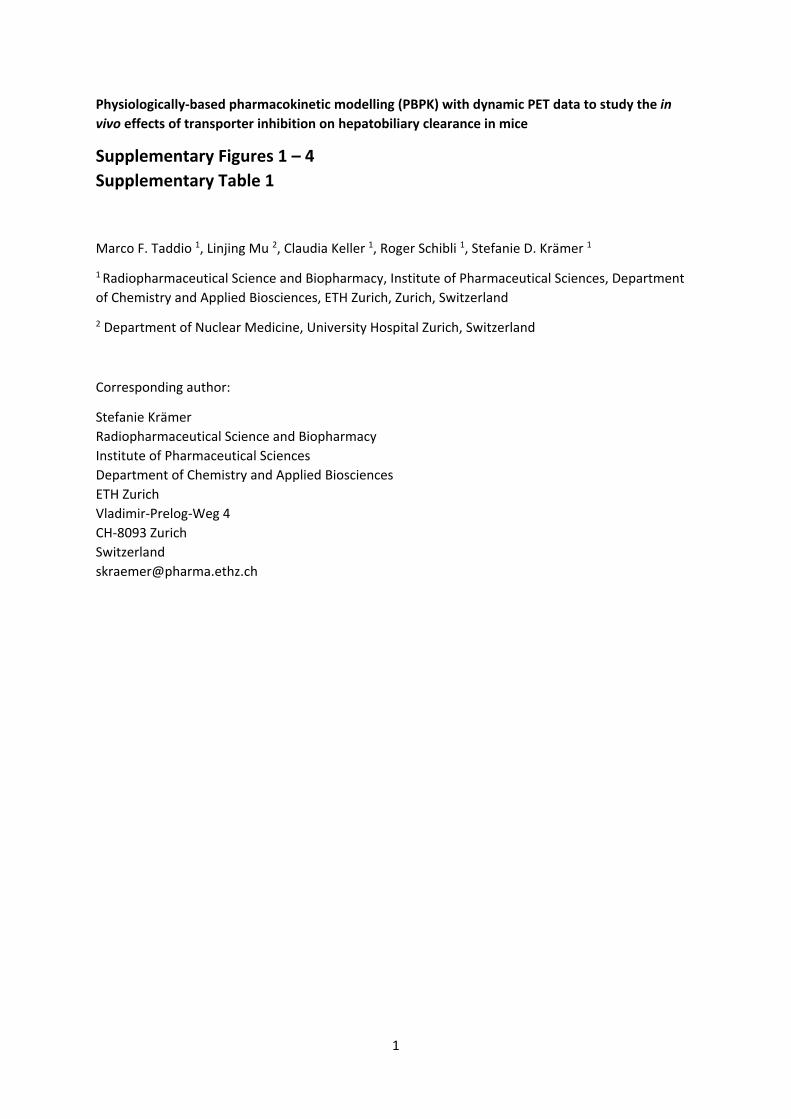
Supplementary Figure 1. Volumes of interest for the kinetic modelling. The heart left ventricle volume was generated with the PSEG module of the software PMOD as described in the section “Time activity curves”. All other volumes of interest were generated with the VOI tools of PMOD.
3
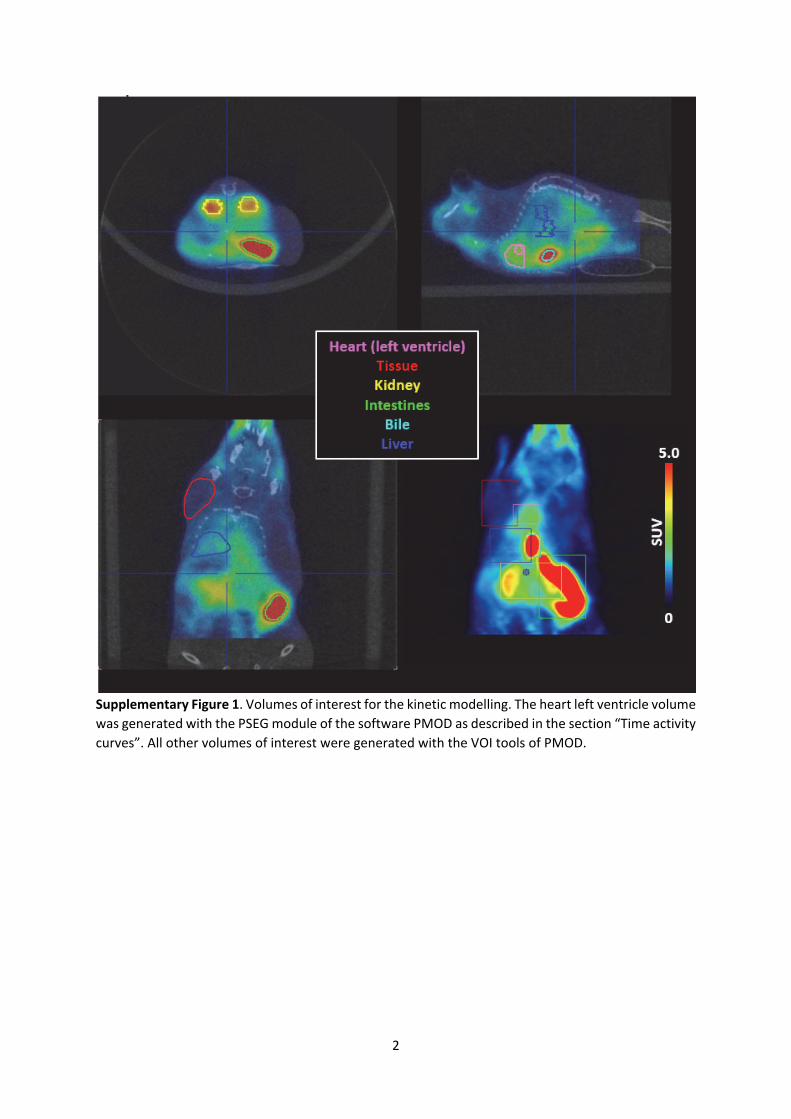
Supplementary Figure 2. PET images (maximal intensity projections) of mice with A) [11C]MT107, B) [11C]MT107 after cyclosporine administration (50 mg/kg i.v.). Same data as in Figure 4 but averaged for the complete scan duration. G, gallbladder; H, heart; I, intestines; K, kidney; L, liver; U, urinary bladder.
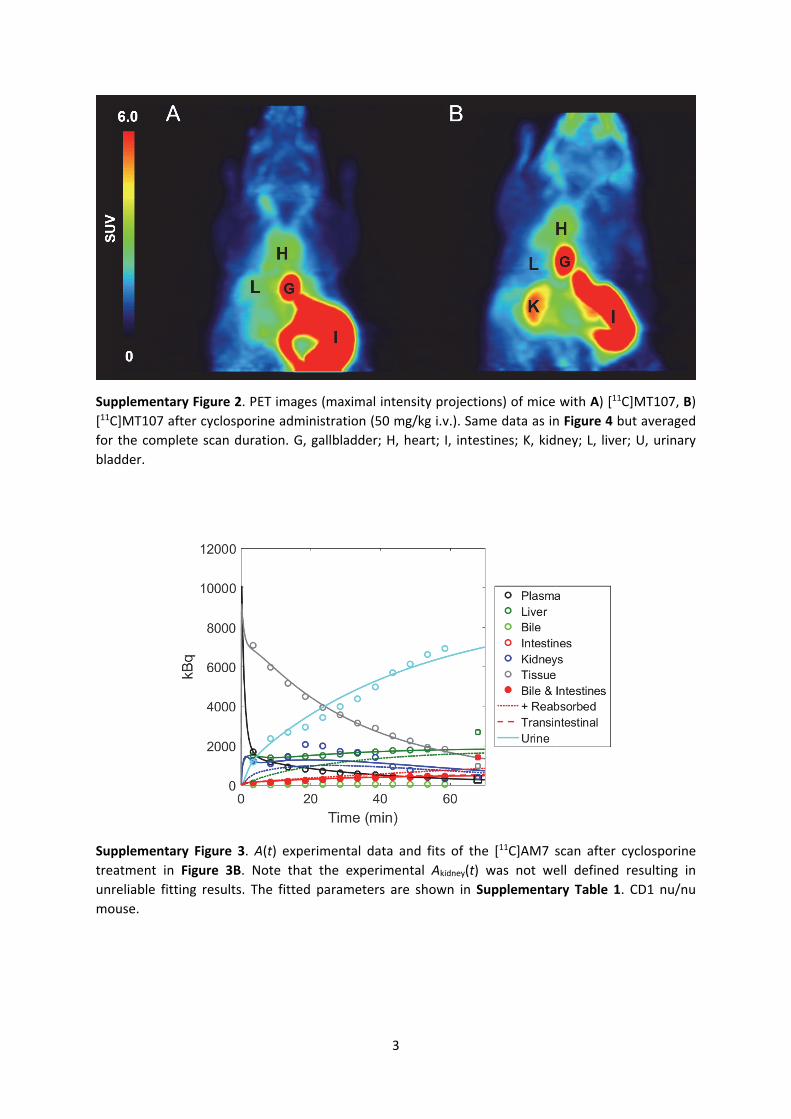
Supplementary Figure 3. A(t) experimental data and fits of the [11C]AM7 scan after cyclosporine treatment in Figure 3B. Note that the experimental Akidney(t) was not well defined resulting in unreliable fitting results. The fitted parameters are shown in Supplementary Table 1. CD1 nu/nu mouse.
4
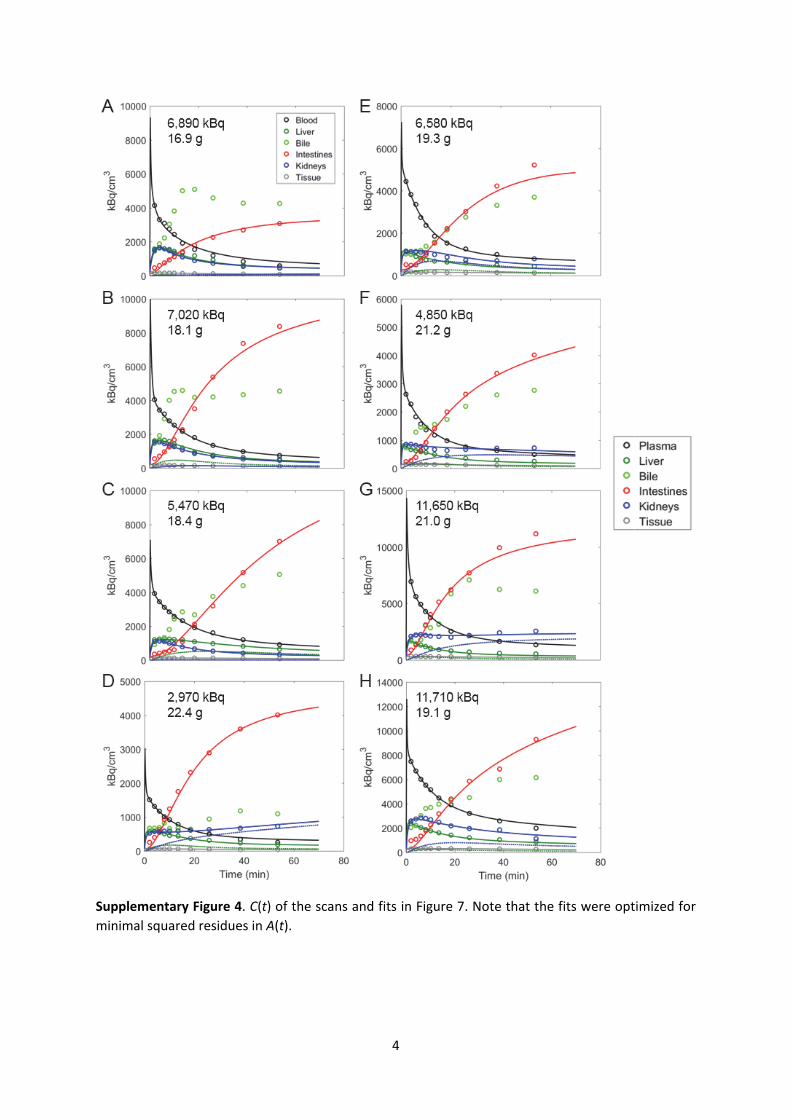
Supplementary Figure 4. C(t) of the scans and fits in Figure 7. Note that the fits were optimized for minimal squared residues in A(t).

Supplementary Table 1. Fit parameters Parameters from bi-exponential fit of CPlasma(t) Calculated parameters from modelling
BW kBH1 KH1B kH1H2 kBR1 kR1B kR1R2 kBT kT1B 1-fBT1 kT2B kH2G kBG kGH1 kR2R1 kR1U vPlasma TVTissue/BW
Sum normalized squared residues V1 Vz l1 lz
CL from CPlasma(t) CLR CLH CL BG CL total CLH/CLR Dtissue E CLR/GFR
AM7 ControlFig. 6A 24.4 0.2595 0.2306 0.1569 0.3819 0.2497 0 0.8149 163.382 0.3038 0.1222 0.0193 0.0236 0.0397 0.2676 0.2796 0.033 0.15 0.6001 1.1925 3.0316 10.3465 0.1963 0.0234 241.854 161.258 83.97 18.826 264.054 0.637 0.114 0.084 1.008Fig. 6B 19.7 0.5099 0.3992 0.208 0.4691 0.2939 0.0035 0.4235 110.3334 1 0.1948 0.0145 0.0107 0.0226 0.0655 0.4241 0.033 0.15 0.6 3.572 2.2853 9.3597 0.2955 0.0271 253.191 178.824 112.742 6.888 298.454 0.63 0.119 0.113 1.118
AM7 CyclosporinSuppl.Fig. 3 25.3 0.1757 0.2414 0.062 0.2939 0.4502 0.1798 0.5934 146.4993 1 0.1516 0.0037 0.0093 0.0161 0.0459 0.3665 0.033 0.15 0.745 3.7216 4.1679 8.0049 0.2044 0.0206 164.996 109.306 29.737 7.69 146.732 0.272 0.172 0.03 0.683
MT107 control k1H k2H k3H k1R k2R k3R k5H k4 k5Fig. 7A 16.9 0.3825 0.3087 0.0716 0.1178 0.3626 0.0023 1.7587 2.3107 0.0344 0.0425 1.9446 0 0.0096 0.0002 0.1172 0.033 0.15 0.7781 0.8004 1.4672 2.9144 0.1156 0.0217 63.178 15.935 39.853 0 55.788 2.501 0.091 0.04 0.1Fig. 7B 18.1 0.5365 0.666 0.0843 0.1185 0.4322 0.012 0.5458 0.7509 0.1141 0.0327 0.1573 0 0.0047 0.0642 0.1318 0.033 0.15 0.6198 0.3567 1.546 2.7537 0.1102 0.0204 56.041 16.427 35.74 0 52.167 2.176 0.135 0.036 0.103Fig. 7C 18.4 0.5769 0.942 0.0572 0.1108 0.5968 0.0045 1.1588 3.6017 0.0474 0.0312 0.0509 0 0.0052 0.1438 0.1009 0.033 0.15 0.769 0.097 1.2381 1.9231 0.1345 0.0198 37.989 9.664 19.915 0 29.579 2.061 0.088 0.02 0.06Fig. 7D 22.4 1.0984 1.6095 0.0959 0.1654 0.9025 0.0633 1.0125 2.3428 0.0797 0.037 0.1601 0 0.0113 0.0003 0.0424 0.033 0.15 0.8033 0.1801 1.6977 3.0572 0.1244 0.022 67.37 5.445 45.348 0 50.793 8.329 0.105 0.045 0.034Average 18.95 0.6486 0.8815 0.0773 0.1281 0.5735 0.0205 1.119 2.2515 0.0689 0.0359 0.5782 0 0.0077 0.0521 0.0981 0.033 0.15 0.7425 0.3586 1.4872 2.6621 0.1211 0.021 56.145 11.868 35.214 0 47.082 3.767 0.105 0.035 0.074Stdev 2.39 0.3114 0.5502 0.0167 0.0251 0.2403 0.0288 0.5002 1.1671 0.0357 0.005 0.9123 0 0.0033 0.0682 0.0392 0 0 0.0831 0.3138 0.1917 0.508 0.0107 0.0011 12.976 5.274 10.932 0 11.857 3.047 0.021 0.011 0.033
MT107 CiclosporinFig. 7E 19.3 1.4079 3.1816 0.0529 0.2 1.6135 0.1559 1.8242 4.78 0.0499 0.03 0.0736 0 0.0126 0.0806 0.4096 0.033 0.15 0.693 0.6393 1.2217 4.105 0.1222 0.0089 36.526 25.599 14.546 0 40.146 0.568 0.161 0.015 0.16Fig. 7F 21.2 1.1645 2.396 0.0688 0.161 0.8661 0.0634 0.7726 0.9772 0.153 0.0335 0.1381 0 0.0048 0.0243 0.208 0.033 0.15 0.9224 0.5452 1.4899 3.7155 0.1589 0.0151 56.088 21.657 22.589 0 44.246 1.043 0.149 0.023 0.135Fig. 7G 21 0.6413 1.6058 0.079 0.0874 0.3313 0.054 0.3913 0.5014 0.2265 0.031 0.2424 0 0.01 0.0107 0.1526 0.033 0.15 0.7706 0.8965 1.3982 3.2283 0.1558 0.0159 51.185 18.963 20.681 0 39.643 1.091 0.147 0.021 0.119Fig. 7H 19.1 1.4933 2.5142 0.0286 0.1821 0.886 0.0471 2.1846 5.0072 0.0369 0.0397 0.1761 0 0.0049 0.0759 0.1194 0.033 0.15 0.7816 0.3211 1.4007 2.2637 0.121 0.0161 36.363 13.536 10.498 0 24.034 0.776 0.103 0.01 0.085Average 20.15 1.1767 2.4244 0.0573 0.1576 0.9242 0.0801 1.2932 2.8165 0.1166 0.0335 0.1576 0 0.008 0.0479 0.2224 0.033 0.15 0.7919 0.6005 1.3776 3.3281 0.1395 0.014 45.04 19.939 17.078 0 37.017 0.869 0.14 0.017 0.125Stdev 1.1 0.3832 0.6461 0.022 0.0495 0.5265 0.051 0.8487 2.4081 0.0898 0.0043 0.0706 0 0.0039 0.0356 0.13 0 0 0.0955 0.2382 0.1124 0.7951 0.0207 0.0034 10.126 5.064 5.569 0 8.898 0.244 0.025 0.006 0.032
ttest 0.397 0.0762 0.0109 0.1982 0.3284 0.2711 0.0881 0.7356 0.6876 0.3621 0.511 0.3933 0.898 0.9158 0.1168 0.4653 0.2653 0.3618 0.2077 0.166 0.008 0.2259 0.0694 0.0254 0.2234 0.1068 0.0779 0.0254 0.0694
vPlasma 0.03276 ml/gQH 1000 µl/minQR 730 µl/minGFR 160 µl/min