high throughput pbpk: evaluating epa’s open-source data
TRANSCRIPT

High-Throughput PBPK: Evaluating EPA’s Open-Source Data and
Tools for Dosimetry and Exposure Reconstruction.
The views expressed in this presentation are those of the author and do not necessarily reflect the views or policies of the U.S. EPA
Figure includes image from ThinkstockORCID: 0000-0002-4024-534X
John Wambaugh National Center for Computational Toxicology
Office of Research and DevelopmentU.S. Environmental Protection Agency
“Lost in Translation: Bringing the Real World to In Vitro Data”Society of Toxicology Annual MeetingBaltimore, MD
March 14, 2017

Office of Research and Development2 of 28
Conflict of Interest Statement
I have no conflicts of interest to disclose
The views expressed in this presentation are those of the author and do not necessarily reflect
the views or policies of the U.S. EPA

Office of Research and Development3 of 28
Introduction
In order to address greater numbers of chemicals we collect in vitro, high throughput toxicokinetic (HTTK) data
The goal of HTTK is to provide a human dose context for in vitro concentrations from HTS
• This allows direct comparisons with exposure
A key application of HTTK has been reverse dosimetry
• Allows in vitro – in vivo extrapolation (What dose causes a bioactive concentration?)
• Allows exposure reconstruction (What dose is consistent with a biomarker?)

Office of Research and Development4 of 28
Endocrine Disruptor Screening Program (EDSP) Chemical List
Number ofCompounds
Conventional Active Ingredients 838
Antimicrobial Active Ingredients 324
Biological Pesticide Active Ingredients 287
Non Food Use Inert Ingredients 2,211
Food Use Inert Ingredients 1,536
Fragrances used as Inert Ingredients 1,529
Safe Drinking Water Act Chemicals 3,616
TOTAL 10,341
EDSP Chemical Universe10,000
chemicals(FIFRA & SDWA)
EDSP List 2 (2013)
107Chemicals
EDSP List 1 (2009)
67 Chemicals
So far 67 chemicals have completed testing and an additional 107 are being tested
December, 2014 Panel: “Scientific Issues Associated with Integrated Endocrine Bioactivity and Exposure-Based Prioritization and Screening“ DOCKET NUMBER: EPA–HQ–OPP–2014–0614
• Park et al. (2012): At least 3221 chemicals in humans, many appear to be exogenous
Scale of the Problem

Office of Research and Development5 of 28
High Throughput Risk Prioritization
• High throughput risk prioritization relies on three components:
1. high throughput hazard characterization2. high throughput exposure forecasts3. high throughput toxicokinetics (i.e.,
dosimetry)• While advances have been made in toxicity and
exposure screening, TK methods applicable to 100s of chemicals are needed

Office of Research and Development6 of 28
Concentration
Resp
onse
In vitro Assay AC50
Concentration (µM)
Assay AC50with Uncertainty
High-Throughput Bioactivity
Tox21: Examining >10,000 chemicals using ~50 assays intended to identify interactions with biological pathways (Schmidt, 2009)
ToxCast: For a subset (>1000) of Tox21 chemicals ran >500 additional assays (Judson et al., 2010)
Most assays conducted in dose-response format (identify 50% activity concentration – AC50 – and efficacy if data described by a Hill function, Filer et al., 2016)
All data is public: http://actor.epa.gov/

Office of Research and Development7 of 28
0
50
100
150
200
250
300
ToxCast Phase I (Wetmore et al. 2012) ToxCast Phase II (Wetmore et al. 2015)
ToxCast ChemicalsExaminedChemicals withTraditional in vivo TKChemicals with HighThroughput TK
• Studies like Wetmore et al. (2012,2015) used in vitro methods to provide TK for >500 chemicals to date
The Need for In Vitro Toxicokinetics
• Ongoing data collection by ToxCast contractor Cyprotex,• Upcoming publication of ~300 new compounds• Work by Derek Angus, Maria Bacolod, Jon Gilbert, Chris Strock

Office of Research and Development8 of 28
Reverse Dosimetry to Convert µM to mg/kg/day
Predict physiological quantities
Tissue massesTissue blood flowsGFR (kidney function)Hepatocellularity
New population simulator based on NHANES biometrics
SexRace/ethnicityAgeHeightWeightSerum creatinine
Regression equations from literature
(+ residual marginal variability)
(Similar approach used in SimCYP [Jamei et al. 2009], GastroPlus, PopGen [McNally et al. 2014], P3M [Price et al. 2003], physB [Bosgra et al. 2012], etc.)
Ring et al. (submitted)httk v1.5

Office of Research and Development9 of 28
Life-stage and Demographic Specific Predictions
• Wambaugh et al. (2014) predictions of exposure rate (mg/kg/day) for various demographic groups
• Can use HTTK to calculate margin between bioactivity and exposure for specific populations
Change in Risk
Ring et al. (submitted)httk v1.5
Change in Activity:Exposure Ratio

Office of Research and Development10 of 28
In vivo Predictive Ability and Domain of Applicability
In drug development, HTTK methods estimate therapeutic doses for clinical studies – predicted concentrations are typically on the order of values measured in clinical trials (Wang, 2010)
For environmental compounds, there will be no clinical trials
Uncertainty must be well characterized ideally with rigorous statistical methodology We will use direct comparison to in vivo data in order to get an
empirical estimate of our uncertainty Any approximations, omissions, or mistakes should work to increase
the estimated uncertainty when evaluated systematically across chemicals

Office of Research and Development11 of 28
Statistical Analysis of High Throughput Toxicokinetics
https://cran.r-project.org/web/packages/httk/Can access this from the R GUI: “Packages” then “Install Packages”
Ongoing refinements:High log P, ionization (Pearce et al., in preparation)
“httk” R Package for reverse dosimetry and PBTK 543 Chemicals to date 100’s of additional chemicals being studied Pearce et al. package documentation manuscript accepted at
Journal of Statistical Software
Inhaled Gas
Qliver
Qgut
Qgut
Kidney Blood
Gut BloodGut Lumen
QGFRKidney Tissue
Liver BloodLiver Tissue
Qrest
Lung BloodLung Tissue Qcardiac
Qmetab
Body Blood
Rest of Body
Qkidney
Arterial BloodVeno
us B
lood

Office of Research and Development12 of 28
Using in vivo Data to Evaluate HTTK
Wambaugh et al. (2015)
• When we compare the Css predicted from in vitro HTTK with in vivo Css values determined from the literature we find limited correlation (R2 ~0.34)
• The dashed line indicates the identity (perfect predictor) line: • Over-predict for 65• Under-predict for
22• The white lines indicate
the discrepancy between measured and predicted values (the residual)

Office of Research and Development13 of 28
Toxicokinetic Triage
Through comparison to in vivo data, a cross-validated (random forest) predictor of success or failure of HTTK has been constructed
Add categories for chemicals that do not reach steady-state or for which plasma binding assay fails
All chemicals can be placed into one of seven confidence categories
Office of Research and Development
Wambaugh et al. (2015)

Office of Research and Development14 of 28
Reasons for Css Over-prediction -Opportunities for Refinement
• Not all routes of metabolic clearance are captured• Extrahepatic (intestinal, renal, etc.) metabolism• Non-hepatocyte-mediated clearance
• Hepatocyte suspensions unable to detect clearance of low turnover compounds
• Absorption / Bioavailability assumed 100%
• Restrictive vs. Nonrestrictive clearance
• Conservative assumptions drive poor predictive ability for chemicals known to be rapidly cleared in vivo
Slide from Barbara Wetmore
Office of Research and Development15 of 28
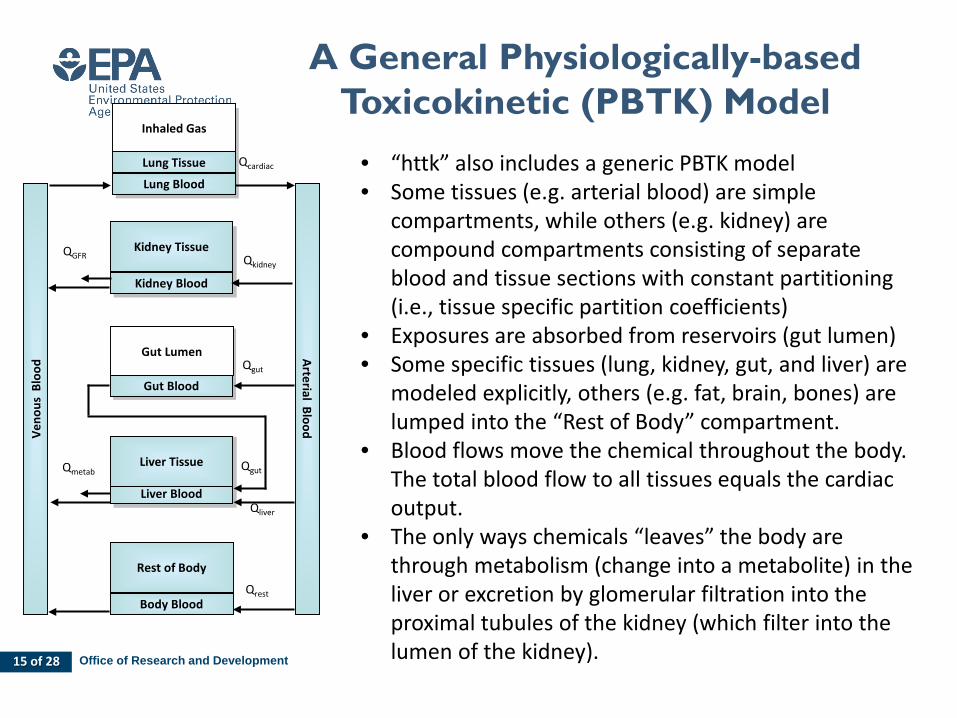
A General Physiologically-based Toxicokinetic (PBTK) Model
• “httk” also includes a generic PBTK model• Some tissues (e.g. arterial blood) are simple
compartments, while others (e.g. kidney) are compound compartments consisting of separate blood and tissue sections with constant partitioning (i.e., tissue specific partition coefficients)
• Exposures are absorbed from reservoirs (gut lumen)• Some specific tissues (lung, kidney, gut, and liver) are
modeled explicitly, others (e.g. fat, brain, bones) are lumped into the “Rest of Body” compartment.
• Blood flows move the chemical throughout the body. The total blood flow to all tissues equals the cardiac output.
• The only ways chemicals “leaves” the body are through metabolism (change into a metabolite) in the liver or excretion by glomerular filtration into the proximal tubules of the kidney (which filter into the lumen of the kidney).
Inhaled Gas
Qliver
Qgut
Qgut
Kidney Blood
Gut Blood
Gut Lumen
QGFRKidney Tissue
Liver Blood
Liver Tissue
Qrest
Lung Blood
Lung Tissue Qcardiac
Qmetab
Body Blood
Rest of Body
Qkidney
Arterial BloodVeno
us B
lood

Office of Research and Development16 of 28
Evaluating HT-PBTK Predictions with In Vivo Data
PBTK predictions for the AUC (time integrated plasma concentration or Area Under the Curve)
in vivo measurements from the literature for various treatments (dose and route) of rat.
Predictions are generally conservative – i.e., predicted AUC higher than measured
Oral dose AUC ~6.4x higher than intravenous dose AUC
16Wambaugh et al. (2015)

Office of Research and Development17 of 28
Analyzing New In Vivo Data (Rat)
Oral and iv studies for 26 ToxCast compounds
• Collaboration with NHEERL (Mike Hughes and Jane Ellen Simmons)
• Additional work by Research Triangle Institute (Tim Fennell)
Can estimate• Fraction absorbed• Absorption Rate• Elimination Rate• Volume of Distribution
17

Office of Research and Development18 of 28
Analyzing New In Vivo Data (Rat):Oral Absorption
18
In silico methods do not correctly predict absorption
Oral and iv studies for 26 ToxCast compounds• Collaboration with
NHEERL (Mike Hughes)
• Additional work by Research Triangle Institute
Can estimate:• Fraction absorbed• Absorption Rate• Elimination Rate• Volume of
DistributionBioavailability prediction from Nisha Sipes, Steve Ferguson, John DiBella

Office of Research and Development19 of 28
Analyzing New In Vivo Data (Rat)
19
Oral and iv studies for 26 ToxCast compounds
• Collaboration with NHEERL (Mike Hughes and Jane Ellen Simmons)
• Additional work by Research Triangle Institute (Tim Fennell)
Can estimate• Fraction absorbed• Absorption Rate• Elimination Rate• Volume of Distribution
• Cyprotex is now measuring bioavailability (CACO2) for all HTTK chemicals• Work by Derek Angus and Chris Strock

Office of Research and Development20 of 28
Analyzing Old In Vivo Data (Rat)
Curating literature for measurements of chemical-specific partition coefficients (PC) in rat• 945 tissue-specific PC• 137 unique chemicals
Calibrating in silico predictors (Schmitt, 2008) to actual performance• Tissue-specific estimates of
predictor bias and uncertainty Research initiated by Woody
Setzer and Jimena Davis, ongoing analysis by Robert Pearce
Figure from Robert Pearce

Office of Research and Development21 of 28
Evaluation of Calibrations to Rat In Vivo Data
After Model Refinements and Calibrations to In Vivo Measured Partition Coefficients
Figure from Robert Pearce
• Partition coefficient calibrations were evaluated with human measured volumes of distribution for 498 chemicals from Obach (2008)
• Volume of distribution calculated as sum of tissues weighted by partition coefficients
• Calibration to in vivo rat data improved 106 chemicals by at least a factor of 3
• Additional model refinements improved 61 by more than a factor of 10

Office of Research and Development22 of 28
Further Evaluation with New in vivo Data
Refined and Calibrated Model
Figure from Robert Pearce

Office of Research and Development23 of 28
Further Evaluation with New in vivo Data
Refined and Calibrated Model
Figure from Robert PearceCSS Rapid Exposure and Dosimetry

Office of Research and Development24 of 28
Further Evaluation with New in vivo Data
Refined and Calibrated Model No Calibrations
Figure from Robert Pearce

Office of Research and Development25 of 28
ToxCast-derived Receptor Bioactivity Converted to mg/kg/day with HTTK
ExpoCastExposure Predictions
December, 2014 Panel:“Scientific Issues Associated with Integrated Endocrine Bioactivity and Exposure-Based Prioritization and Screening“
ToxCast Chemicals
Application to High Throughput Risk Prioritization
Near FieldFar Field
mg/kg BW/day
DOCKET NUMBER:EPA–HQ–OPP–2014–0614
More Plausible Biologically Active Exposures

Office of Research and Development26 of 28
Propagating Measurement Uncertainty
26
Relative contributions of uncertainty and variability
Office of Research and Development

Office of Research and Development27 of 28
Propagating Measurement Uncertainty
27
Office of Research and Development

Office of Research and Development28 of 28
Summary
Toxicokinetics (TK) provides a bridge between HTS and HTE by predicting tissue concentrations due to exposure
HTTK methods developed for pharmaceuticals have been adapted to environmental testing
A primary application of HTTK is “Reverse Dosimetry” or RTK• Can infer daily doses that produce plasma concentrations equivalent
to the bioactive concentrations and reconstruct exposure from biomarkers, but:
We must consider “domain of applicability”. One way is to evaluate against in vivo data for large numbers of chemicals• Collected new PK data from in vivo studies (EPA/NHEERL and Research
Triangle Institute)• Organizing data from literature studies into computable format
R package “httk” freely available on CRAN allows statistical analyses

NCCTChris GrulkeGreg Honda*Richard JudsonAndrew McEachran*Robert Pearce*Ann RichardParichehr Saranjampour*
Risa Sayre*Woody SetzerRusty ThomasJohn WambaughAntony Williams
NERLCraig BarberNamdi Brandon*Peter EgeghyJarod Grossman*Hongtai Huang*Brandall Ingle*Kristin IsaacsSarah Laughlin-Toth*Aurelie Marcotte*Seth NewtonKatherine Phillips
Paul PriceJeanette Reyes*Jon SobusJohn Streicher*Mark StrynarMike Tornero-VelezElin UlrichDan ValleroBarbara Wetmore
*Trainees
Chemical Safety for Sustainability (CSS) Rapid Exposure and Dosimetry (RED) Project
NHEERLLinda AdamsChristopher EcklundMarina EvansMike HughesJane Ellen Simmons
NRMRLYirui Liang*Xiaoyu Liu
Arnot Research and ConsultingJon ArnotBattelle Memorial InstituteAnne Louise SumnerAnne GreggChemical Computing GroupRocky GoldsmithCyprotexDerek AngusMaria BacolodJon GilbertChris StrockNIEHS National Toxicology ProgramMike DevitoSteve FergusonNisha SipesResearch Triangle InstituteTimothy FennellScitoVationHarvey ClewellChantel NicolasSilent Spring InstituteRobin DodsonSouthwest Research InstituteAlice YauKristin FavelaSummit ToxicologyLesa AylwardTox StrategiesCaroline RingUniversity of California, DavisDeborah BennettHyeong-Moo Shin University of MichiganOlivier JollietUniversity of North Carolina, Chapel HillAlex Tropsha
Collaborators
The views expressed in this presentation are those of the authors and do not necessarily reflect the views or policies of the U.S. EPA
Lead CSS Matrix Interface:John Kenneke (NERL)

Office of Research and Development30 of 28
ReferencesJamei, et al. “The Simcyp® population-based ADME
simulator.” Expert opinion on drug metabolism & toxicology 2009b;5:211-223McNally, et al., “PopGen: a virtual human population
generator.” Toxicology 2014Park, Youngja, H., et al. “High-performance metabolic
profiling of plasma from seven mammalian species for simultaneous environmental chemical surveillance and bioeffect monitoring.” Toxicology 295:47-55 (2012)Pearce, Robert, et al. “httk: R Package for High-
Throughput Toxicokinetics.” Journal of Statistical Software, in press.Price et al., “Instructions for Use of Software Physiological
Parameters for PBPK Modeling Version 1.3 (P3MTM 1.3).” 2003Ring , Caroline, et al., “Identifying populations sensitive to
environmental chemicals by simulating toxicokinetic variability”, submitted.Wambaugh, John F., et al. "Toxicokinetic triage for
environmental chemicals." Toxicological Sciences (2015): kfv118.
Wang, Y.-H. (2010). “Confidence Assessment of the Simcyp Time-Based Approach and a Static Mathematical Model in Predicting Clinical Drug-Drug Interactions for Mechanism-Based CYP3A Inhibitors.” Drug Metabolism and Disposition 38(7), 1094-1104Wetmore, Barbara A., et al. "Integration of dosimetry,
exposure and high-throughput screening data in chemical toxicity assessment." Tox. Sciences (2012)Wetmore, Barbara A., et al. “Relative Impact of
Incorporating Pharmacokinetics on Predicting In Vivo Hazard and Mode of Action from High-Throughput In Vitro Toxicity Assays.” Toxicological Sciences 132(2), 327-346Wetmore, Barbara A., et al., “Incorporating population
variability and susceptible subpopulations into dosimetry for high-throughput toxicity testing. Toxicological sciences 2014;142:210-224Wetmore, Barbara A., et al. "Incorporating High-
Throughput Exposure Predictions with Dosimetry-Adjusted In Vitro Bioactivity to Inform Chemical Toxicity Testing." Toxicological Sciences 148.1 (2015): 121-136.Yoon, M., et al. (2014). “Evaluation of simple in vitro to in
vivo extrapolation approaches for environmental compounds.” Toxicology in Vitro 28(2), 164-170.

Office of Research and Development31 of 28
Visit EPA’s Exhibit Booth #319
Demos by Our Scientists• ECOTOX• SeqAPASS• HTTK Package• CPDat• AOP Wiki• CompTox Chemistry Dashboard• ToxCast Dashboard and Data
Downloads• GenRA
Meet the Directors Sessions• EPA Lab, Center and Office Directors• Informal- 1 Hour Sessions
epa.gov/research/2017-sotFor full list of events and materials