supplement for chapter 1
DESCRIPTION
By Cheng Few Lee Joseph Finnerty John Lee Alice C Lee Donald Wort. Supplement for Chapter 1. Introduction. Chapter Outline. Financial Markets The Money Market The Bond Market Equity Securities Derivative Markets The Mutual Fund Markets The Hedge Fund Markets Summary. - PowerPoint PPT PresentationTRANSCRIPT
Supplement for Chapter 1
Introduction
ByCheng Few LeeJoseph Finnerty
John LeeAlice C Lee
Donald Wort
Chapter OutlineA. Financial Markets
B. The Money Market
C. The Bond Market
D. Equity Securities
E. Derivative Markets
F. The Mutual Fund Markets
G. The Hedge Fund Markets
H. Summary
2
3
Introduction
Two important portions of financial markets
• Money market: short-term, marketable, liquid, low-risk debt securities. Cash equivalents.
• Capital markets: longer term and riskier securities. Subdivided into 1. longer term bond markets, 2. equity markets, and 3. the derivative markets for options and futures.
4
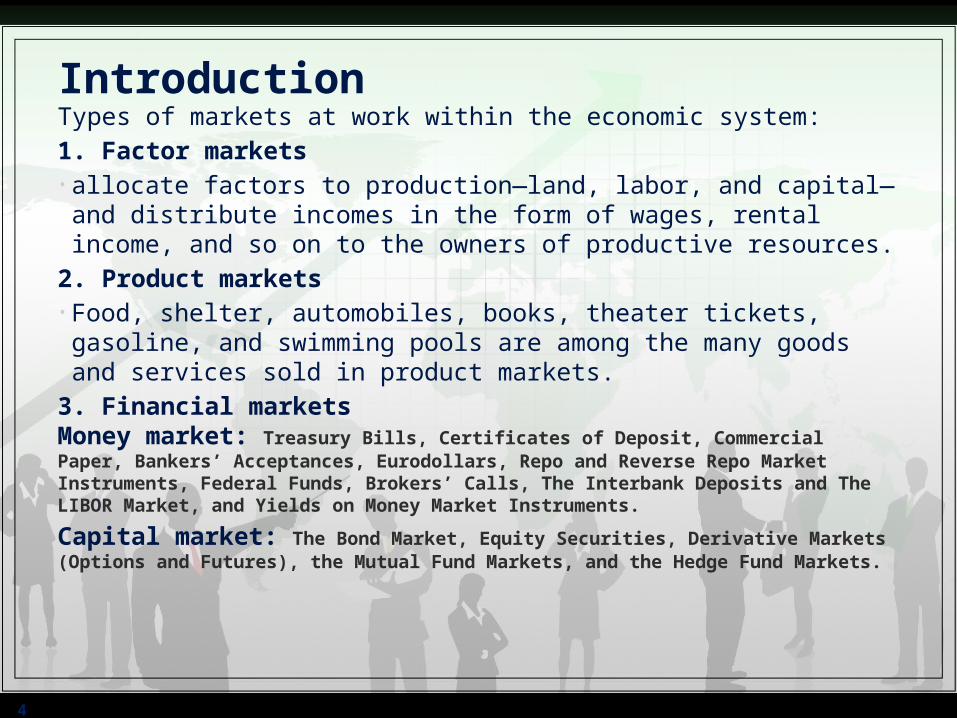
IntroductionTypes of markets at work within the economic system:
1. Factor markets• allocate factors to production—land, labor, and capital—and distribute
incomes in the form of wages, rental income, and so on to the owners of productive resources.
2. Product markets• Food, shelter, automobiles, books, theater tickets, gasoline, and
swimming pools are among the many goods and services sold in product markets.
3. Financial marketsMoney market: Treasury Bills, Certificates of Deposit, Commercial Paper, Bankers’ Acceptances, Eurodollars, Repo and Reverse Repo Market Instruments, Federal Funds, Brokers’ Calls, The Interbank Deposits and The LIBOR Market, and Yields on Money Market Instruments.
Capital market: The Bond Market, Equity Securities, Derivative Markets (Options and Futures), the Mutual Fund Markets, and the Hedge Fund Markets.

FINANCIAL MARKETSSection A
5
6
FINANCIAL MARKETS•These instruments are traded in different financial markets such as • (i) the money markets • (ii) the bond markets • (iii) the equity security markets• (iv) mutual fund markets.
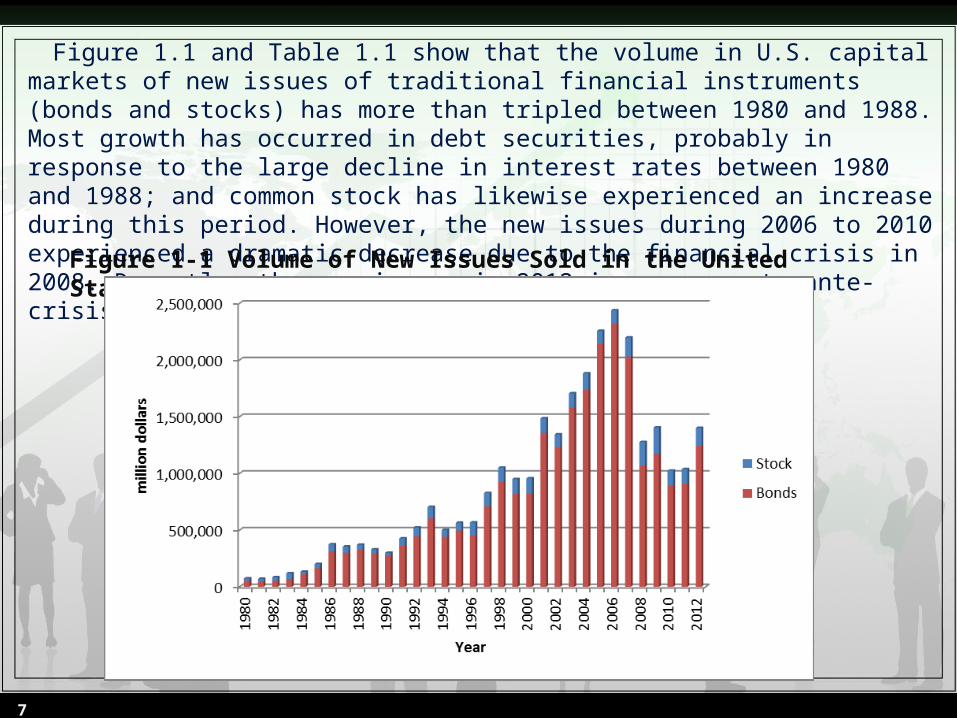
Figure 1.1 and Table 1.1 show that the volume in U.S. capital markets of new issues of traditional financial instruments (bonds and stocks) has more than tripled between 1980 and 1988. Most growth has occurred in debt securities, probably in response to the large decline in interest rates between 1980 and 1988; and common stock has likewise experienced an increase during this period. However, the new issues during 2006 to 2010 experienced a dramatic decrease due to the financial crisis in 2008. Recently, the new issues in 2012 increase up to ante-crisis level.
7
Figure 1-1 Volume of New Issues Sold in the United States, 1980–2012
8
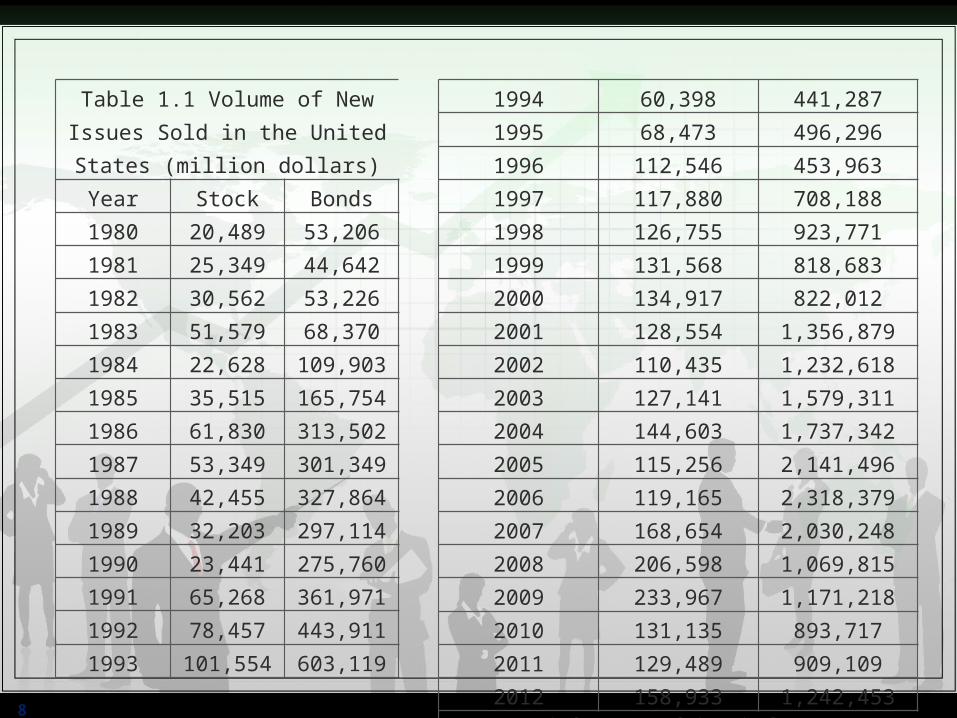
Table 1.1 Volume of New Issues Sold in the United States (million dollars)
Year Stock Bonds
1980 20,489 53,206
1981 25,349 44,642
1982 30,562 53,226
1983 51,579 68,370
1984 22,628 109,903
1985 35,515 165,754
1986 61,830 313,502
1987 53,349 301,349
1988 42,455 327,864
1989 32,203 297,114
1990 23,441 275,760
1991 65,268 361,971
1992 78,457 443,911
1993 101,554 603,119
1994 60,398 441,2871995 68,473 496,2961996 112,546 453,9631997 117,880 708,1881998 126,755 923,7711999 131,568 818,6832000 134,917 822,0122001 128,554 1,356,8792002 110,435 1,232,6182003 127,141 1,579,3112004 144,603 1,737,3422005 115,256 2,141,4962006 119,165 2,318,3792007 168,654 2,030,2482008 206,598 1,069,8152009 233,967 1,171,2182010 131,135 893,7172011 129,489 909,1092012 158,933 1,242,453
Source: Board of Governors of the Federal Reserve System, Federal Reserve Bulletin
(http://www.federalreserve.gov/econresdata/releases/corpsecure/current.htm)
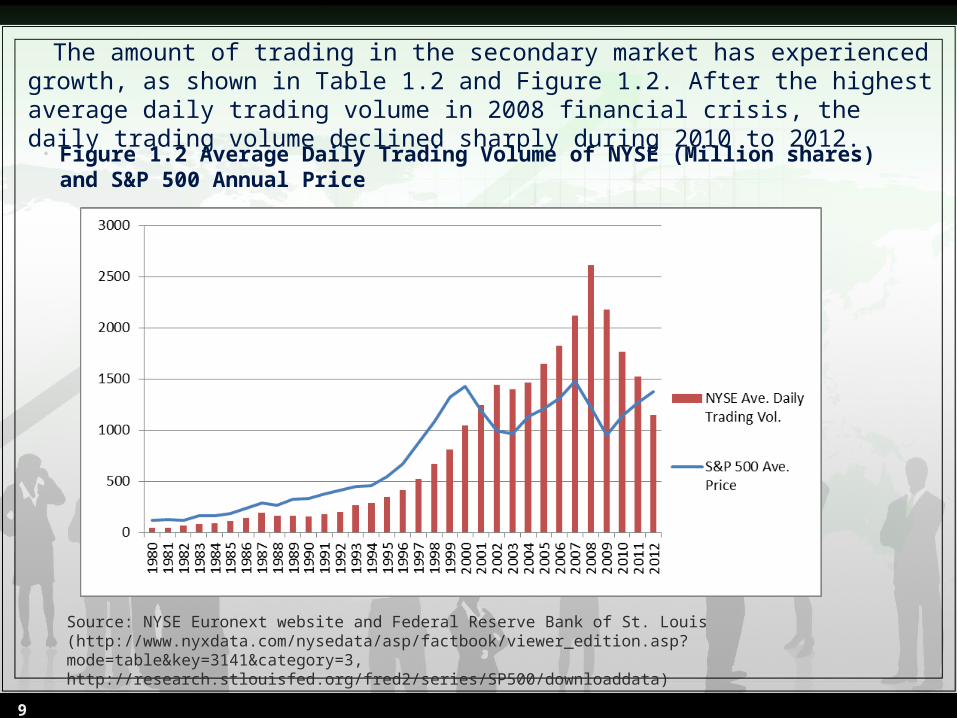
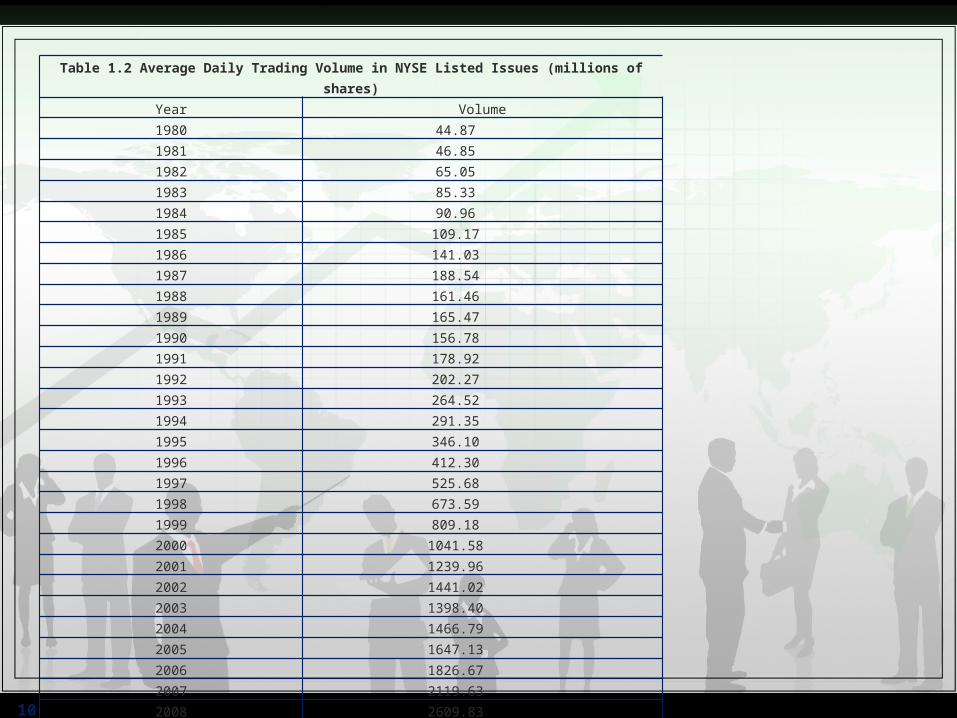
The amount of trading in the secondary market has experienced growth, as shown in Table 1.2 and Figure 1.2. After the highest average daily trading volume in 2008 financial crisis, the daily trading volume declined sharply during 2010 to 2012.
9
• Figure 1.2 Average Daily Trading Volume of NYSE (Million shares) and S&P 500 Annual Price
Source: NYSE Euronext website and Federal Reserve Bank of St. Louis (http://www.nyxdata.com/nysedata/asp/factbook/viewer_edition.asp?mode=table&key=3141&category=3, http://research.stlouisfed.org/fred2/series/SP500/downloaddata)
10
Table 1.2 Average Daily Trading Volume in NYSE Listed Issues (millions of shares)Year Volume1980 44.871981 46.851982 65.051983 85.331984 90.961985 109.171986 141.031987 188.541988 161.461989 165.471990 156.781991 178.921992 202.271993 264.521994 291.351995 346.101996 412.301997 525.681998 673.591999 809.182000 1041.582001 1239.962002 1441.022003 1398.402004 1466.792005 1647.132006 1826.672007 2119.632008 2609.832009 2179.782010 1764.492011 1523.282012 1147.18
Source: NYSE Euronext website (http://www.nyxdata.com/nysedata/asp/factbook/viewer_edition.asp?mode=table&key=3141&category=3)
THE MONEY MARKETSection B
11
B.1 Treasury BillsB.2 Certificates of DepositB.3 Commercial PaperB.4 Bankers’ AcceptancesB.5 EurodollarsB.6 Repo and Reverse Repo Market Instruments B.7 Federal FundsB.8 Brokers’ CallsB.9 The Interbank Deposits and The LIBOR MarketB.10 Yields on Money Market Instruments
12
Introduction
• Money-market instruments: short-term debt instruments with a maturity typically inferior or equal to 1 year.
• Three categories of issuers: 1. Government (at both the federal and local levels), 2. Banks and 3. Corporations.
• The Central Bank
13
B.1 Treasury Bills
• Treasury Bills are Treasury securities with a maturity below or equal to 1 year
• Entail no default risk because they are backed by the full faith and creditworthiness of the government
• Bear no interest rate and are quoted using the yield on a discount basis or on a money-market basis depending on the country considered.
• Highly liquid• Minimum denominations of $100 • Income earned on T-bills is exempt from all state and local
taxes
14
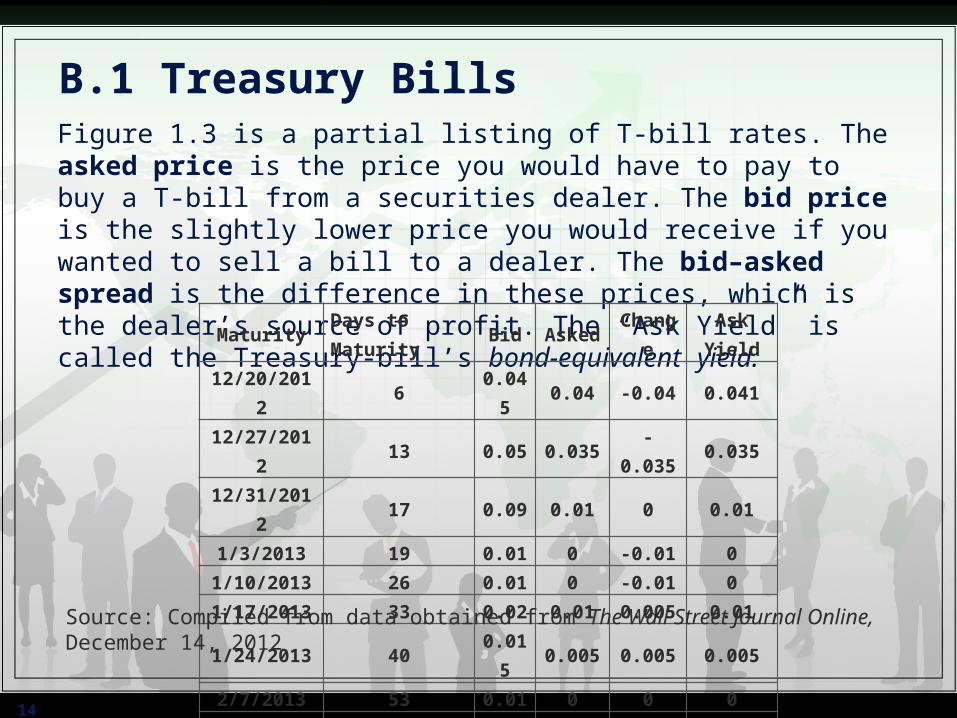
B.1 Treasury BillsFigure 1.3 is a partial listing of T-bill rates. The asked price is the price you would have to pay to buy a T-bill from a securities dealer. The bid price is the slightly lower price you would receive if you wanted to sell a bill to a dealer. The bid–asked spread is the difference in these prices, which is the dealer’s source of profit. The “Ask Yield” is called the Treasury-bill’s bond-equivalent yield.
Maturity Days to Maturity Bid Asked ChangeAsk
Yield12/20/2012 6 0.045 0.04 -0.04 0.04112/27/2012 13 0.05 0.035 -0.035 0.03512/31/2012 17 0.09 0.01 0 0.01
1/3/2013 19 0.01 0 -0.01 01/10/2013 26 0.01 0 -0.01 01/17/2013 33 0.02 0.01 0.005 0.011/24/2013 40 0.015 0.005 0.005 0.0052/7/2013 53 0.01 0 0 0
2/14/2013 60 0.02 0.01 0.005 0.012/21/2013 67 0.015 0.005 -0.005 0.005
Source: Compiled from data obtained from The Wall Street Journal Online, December 14, 2012
15
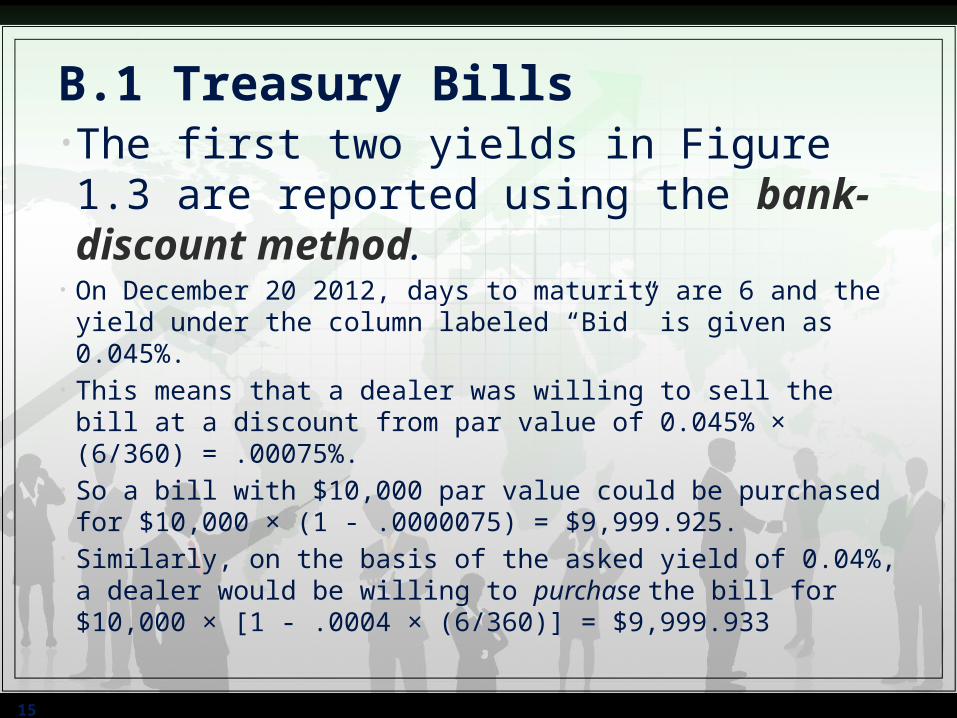
B.1 Treasury Bills•The first two yields in Figure 1.3 are reported using the bank-discount method.
• On December 20 2012, days to maturity are 6 and the yield under the column labeled “Bid” is given as 0.045%.
• This means that a dealer was willing to sell the bill at a discount from par value of 0.045% × (6/360) = .00075%.
• So a bill with $10,000 par value could be purchased for $10,000 × (1 - .0000075) = $9,999.925.
• Similarly, on the basis of the asked yield of 0.04%, a dealer would be willing to purchase the bill for $10,000 × [1 - .0004 × (6/360)] = $9,999.933
16
B.1 Treasury Bills• The yield on a discount basis denoted by is computed as
• (1.1)
• where F is the face value (redemption value), P the price, B the year-basis (360 or 365) and n the number of calendar days remaining to maturity.
•When you know the yield on a discount basis, you can retrieve the T-bill price using
• (1.2)
17
B.1 Treasury Bills•The yield on a money-market basis denoted by is computed as
• (1.3)
•When you know the yield on a money-market basis, you can retrieve the T-bill price using
• (1.4)
18
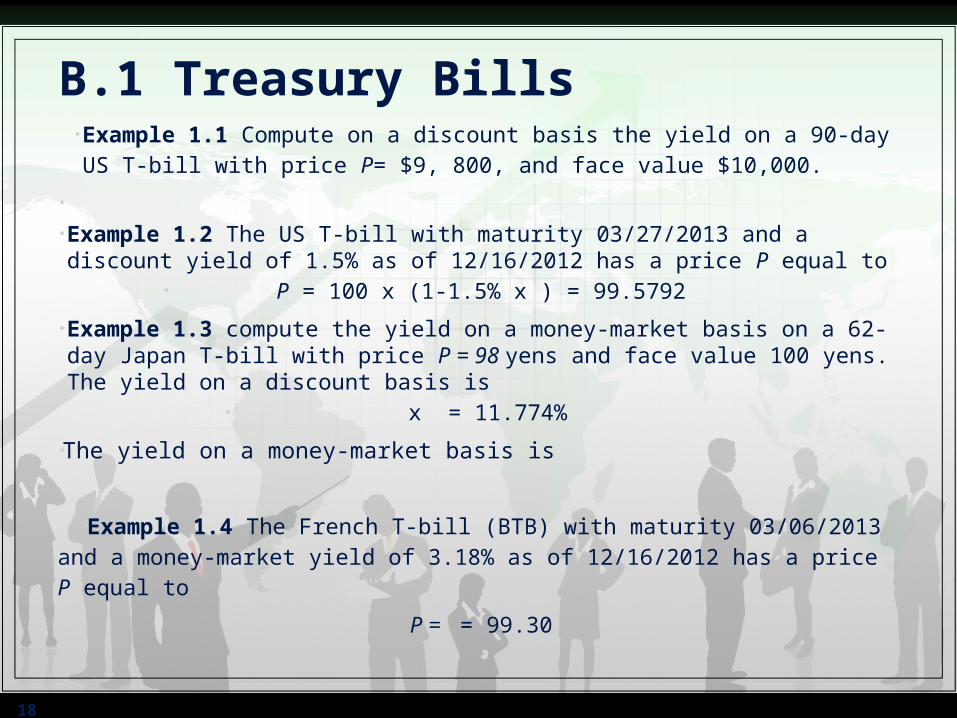
B.1 Treasury Bills• Example 1.1 Compute on a discount basis the yield on a 90-day US T-bill
with price P= $9, 800, and face value $10,000.
• • Example 1.2 The US T-bill with maturity 03/27/2013 and a discount yield of
1.5% as of 12/16/2012 has a price P equal to• P = 100 x (1-1.5% x ) = 99.5792
• Example 1.3 compute the yield on a money-market basis on a 62-day Japan T-bill with price P = 98 yens and face value 100 yens. The yield on a discount basis is
• x = 11.774%
•The yield on a money-market basis is
•Example 1.4 The French T-bill (BTB) with maturity 03/06/2013 and a money-market yield of 3.18% as of 12/16/2012 has a price P equal to
• P = = 99.30
19
B.2 Certificates of Deposit• Certificates of Deposit: debt instruments issued by banks in
order to finance their lending activity. • The price is computed using the following equation
• P = F x (1.5)
Where F is the face value, c the interest rate at issuance, is the number of days between issue date and maturity date, B is the year-basis (360 or 365), is the yield on a money-market basis, is the number of days between settlement and maturity.
20
Example 1.5The Certificate of Deposit issued by the French bank Credit Lyonnais on 07/26/2012, with maturity 05/02/2013, face value Eur90 million, an interest rate at issuance of 4.27% falling at maturity and a yield of 4.19% as of 08/13/2012, has a price P equal to
P = 100 x
which corresponds to a market value of Eur90.225million (90 million x 100.25%) on 08/13/2012.
Indeed, there are 276 calendar days between 07/26/2012 and 05/02/2013, and 259 calendar days between 08/13/2012 and 05/02/2013.
21
B.3 Commercial Paper• Commercial papers: unsecured short-term debt securities issued
by corporations including industrial and financial companies. • Maturities range from 2 to 270 days• Usually issued in multiples of $100,000• Bear no interest rate • Traded on a discount basis in the United States and on a money-
market basis in the Euro area• Entail the credit risk of the issuing entity• Corporations typically use them either as a way of raising short-
term funds or as interim loans to finance long-term projects while awaiting more attractive long-term capital market conditions, called bridge financing
22
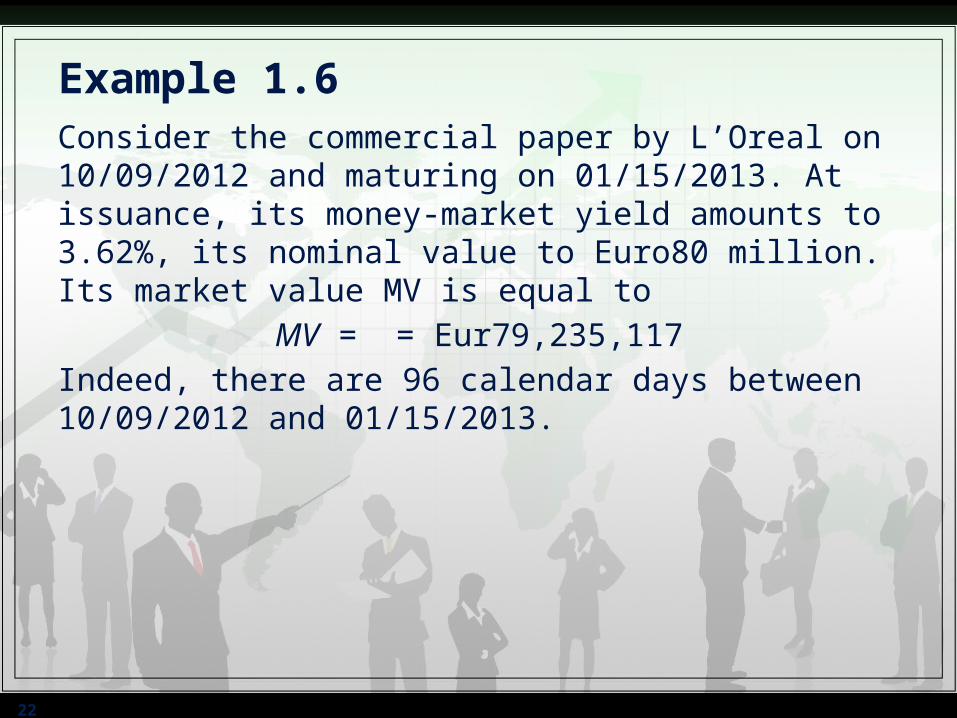
Example 1.6Consider the commercial paper by L’Oreal on 10/09/2012 and maturing on 01/15/2013. At issuance, its money-market yield amounts to 3.62%, its nominal value to Euro80 million. Its market value MV is equal to
MV = = Eur79,235,117
Indeed, there are 96 calendar days between 10/09/2012 and 01/15/2013.
23
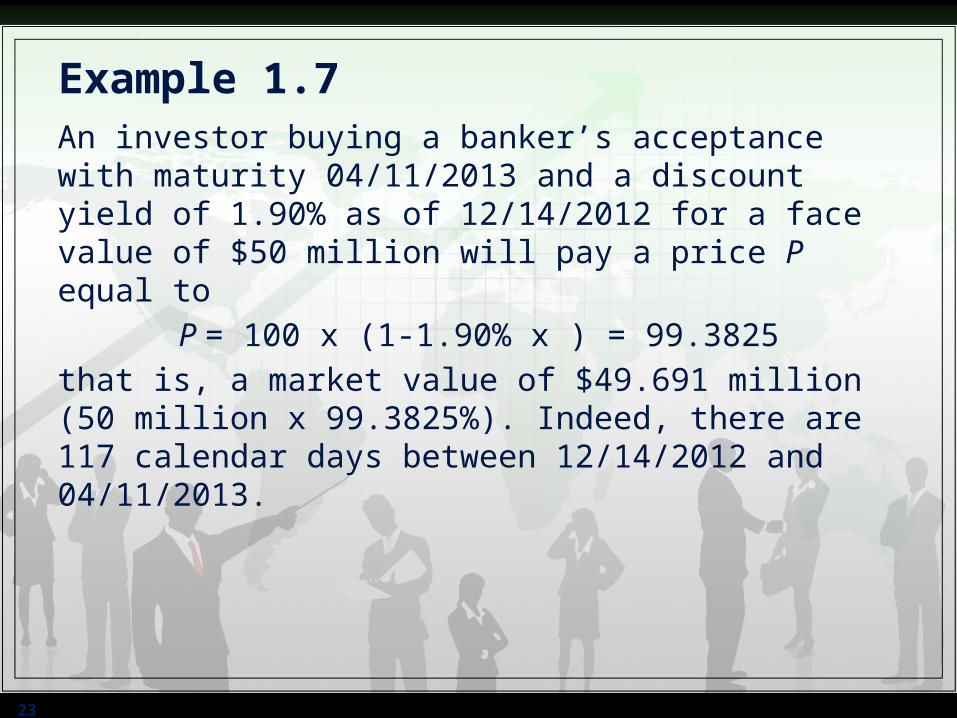
Example 1.7An investor buying a banker’s acceptance with maturity 04/11/2013 and a discount yield of 1.90% as of 12/14/2012 for a face value of $50 million will pay a price P equal to
P = 100 x (1-1.90% x ) = 99.3825
that is, a market value of $49.691 million (50 million x 99.3825%). Indeed, there are 117 calendar days between 12/14/2012 and 04/11/2013.
24
B.5 Eurodollars• Eurodollars: dollar-denominated deposits at foreign banks or
foreign branches of American banks. • Need not be in European banks, although that is where the
practice of accepting dollar-denominated deposits outside the United States began.
25
B.6 Repo and Reverse Repo Market Instruments • Repurchase (repo) and reverse repurchase (reverse repo)
agreement transactions are commonly used by traders and portfolio managers to finance either long or short positions (usually in government securities).
• A repo is for an investor a means to lend bonds in exchange for a loan of money, while a reverse repo is a means for an investor to lend money in exchange for a loan of securities
• Overnight repo: When the maturity of the loan is 1 day
Term repo: When the maturity exceeds 1 day• Repos are considered very safe in terms of credit risk because
the loans are backed by the government securities
26
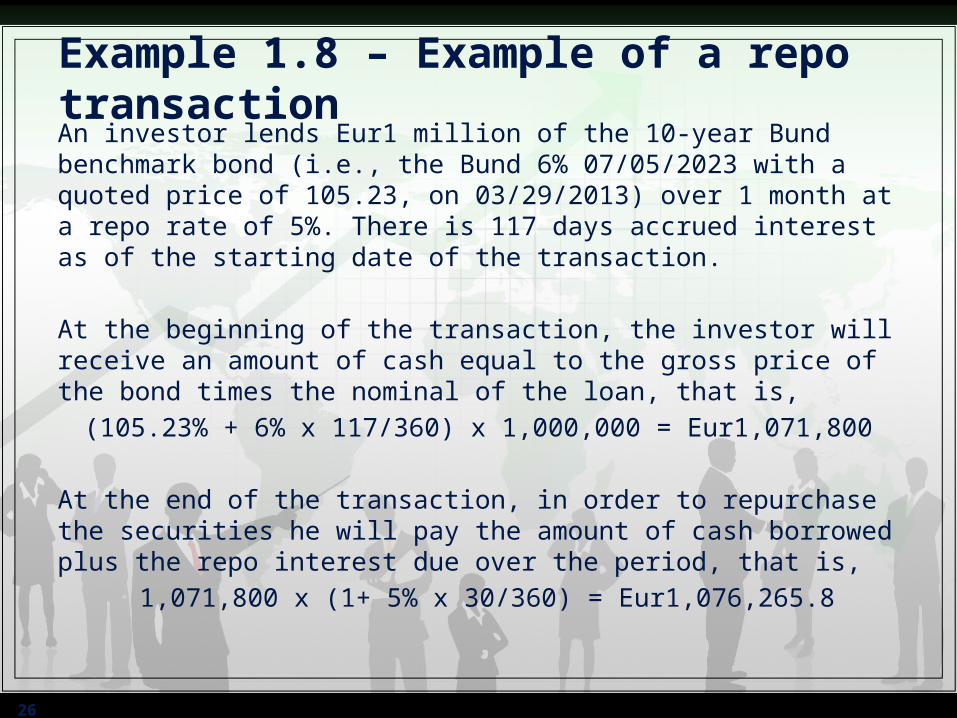
Example 1.8 – Example of a repo transactionAn investor lends Eur1 million of the 10-year Bund benchmark bond (i.e., the Bund 6% 07/05/2023 with a quoted price of 105.23, on 03/29/2013) over 1 month at a repo rate of 5%. There is 117 days accrued interest as of the starting date of the transaction.
At the beginning of the transaction, the investor will receive an amount of cash equal to the gross price of the bond times the nominal of the loan, that is,
(105.23% + 6% x 117/360) x 1,000,000 = Eur1,071,800
At the end of the transaction, in order to repurchase the securities he will pay the amount of cash borrowed plus the repo interest due over the period, that is,
• 1,071,800 x (1+ 5% x 30/360) = Eur1,076,265.8
27
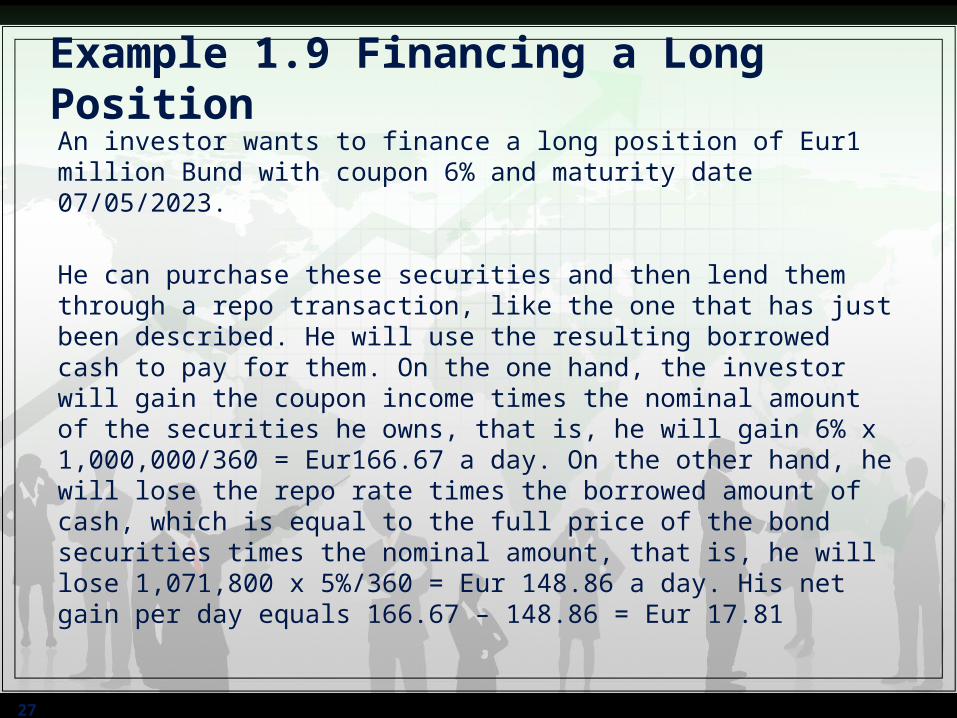
Example 1.9 Financing a Long Position
An investor wants to finance a long position of Eur1 million Bund with coupon 6% and maturity date 07/05/2023.
He can purchase these securities and then lend them through a repo transaction, like the one that has just been described. He will use the resulting borrowed cash to pay for them. On the one hand, the investor will gain the coupon income times the nominal amount of the securities he owns, that is, he will gain 6% x 1,000,000/360 = Eur166.67 a day. On the other hand, he will lose the repo rate times the borrowed amount of cash, which is equal to the full price of the bond securities times the nominal amount, that is, he will lose 1,071,800 x 5%/360 = Eur 148.86 a day. His net gain per day equals 166.67 – 148.86 = Eur 17.81
28
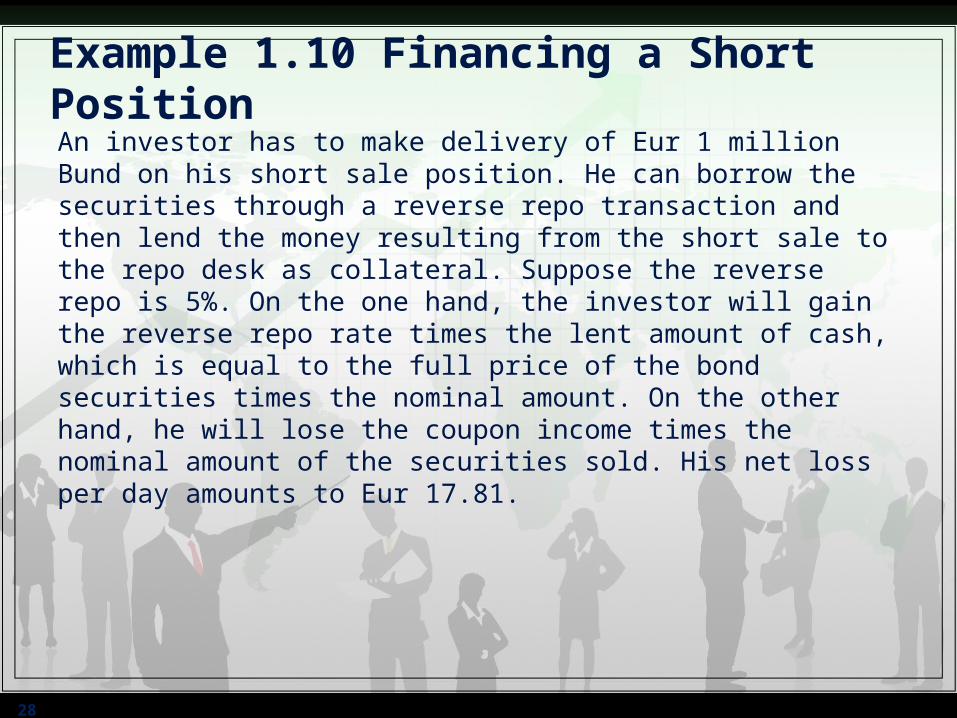
Example 1.10 Financing a Short PositionAn investor has to make delivery of Eur 1 million Bund on his short sale position. He can borrow the securities through a reverse repo transaction and then lend the money resulting from the short sale to the repo desk as collateral. Suppose the reverse repo is 5%. On the one hand, the investor will gain the reverse repo rate times the lent amount of cash, which is equal to the full price of the bond securities times the nominal amount. On the other hand, he will lose the coupon income times the nominal amount of the securities sold. His net loss per day amounts to Eur 17.81.
29
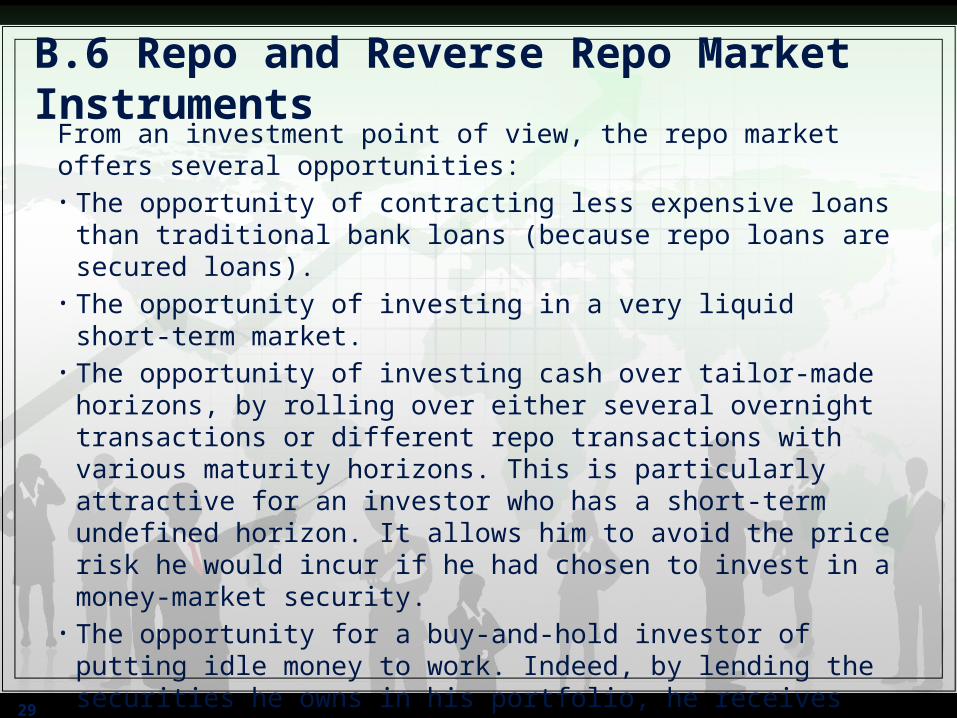
B.6 Repo and Reverse Repo Market Instruments From an investment point of view, the repo market offers several opportunities:• The opportunity of contracting less expensive loans than traditional bank
loans (because repo loans are secured loans).• The opportunity of investing in a very liquid short-term market.• The opportunity of investing cash over tailor-made horizons, by rolling over
either several overnight transactions or different repo transactions with various maturity horizons. This is particularly attractive for an investor who has a short-term undefined horizon. It allows him to avoid the price risk he would incur if he had chosen to invest in a money-market security.
• The opportunity for a buy-and-hold investor of putting idle money to work. Indeed, by lending the securities he owns in his portfolio, he receives some cash that he can invest in a money-market instrument. His gain will be the difference between the money-market income and the repo cost.
• The opportunity to take short positions that enable portfolio managers to construct alternative strategies by combining long and short positions
30
B.7 Federal Funds• Banks maintain deposits of their own at a Federal Reserve bank.
called federal funds, or fed funds• Banks with excess funds lend to those with a shortage, at a rate of
interest called the federal funds rate
31
B.8 Brokers’ Calls• Individuals who buy stocks on margin borrow part of the funds to pay
for the stocks from their broker. The broker in turn may borrow the funds from a bank, agreeing to repay the bank immediately (on call) if the bank requests it. The rate paid on such loans is usually about 1% higher than the rate on short-term T-bills.
32
B.9 The Interbank Deposits and The LIBOR Market• Interbank deposits: are short-term deposits made between
banks, which use them to place surplus funds. • London Interbank Offered Rate (LIBOR): the rate at which
large banks in London are willing to lend money among themselves, quoted on dollar- denominated loans.
• European Interbank Offered Rate (EURIBOR): rate at which banks in the euro zone are willing to lend euros among themselves.
33
Example 1.11
Consider an investor who deposits $100 million on 12/15/2012 at an interest rate of 4.35% until 03/15/2013. At maturity, he receives the amount of its deposit plus, the interest earned over the period, that is,
$100 million x (1+ 3.35% x 90/360 )
= $101.0875 million

34
B.10 Yields on Money Market Instruments
Figure 1.4 shows that bank CDs, for example, consistently have paid a premium over T-bills, and that premium increased with economic crises.
THE BOND MARKETSection C
35
C.1 Treasury Notes and BondsC.2 Inflation-Protected Treasury BondsC.3 Federal Agency DebtC.4 International BondsC.5 Municipal BondsC.6 Corporate BondsC.7 Mortgages and Mortgage-Backed Securities
36
C. The BOND market
• Bond: long-term fixed obligation of an issuer• Bond market includes: Treasury notes and bonds, corporate
bonds, municipal bonds, mortgage securities, and federal agency debt
• Types of bond issuers: U.S. Treasury, federal agencies, municipalities, and corporations
37
C.1 Treasury Notes and Bonds
• The U.S. government borrows funds in large part by selling Treasury notes and Treasury bonds• Both notes and bonds make semiannual interest payments called coupon payments
38
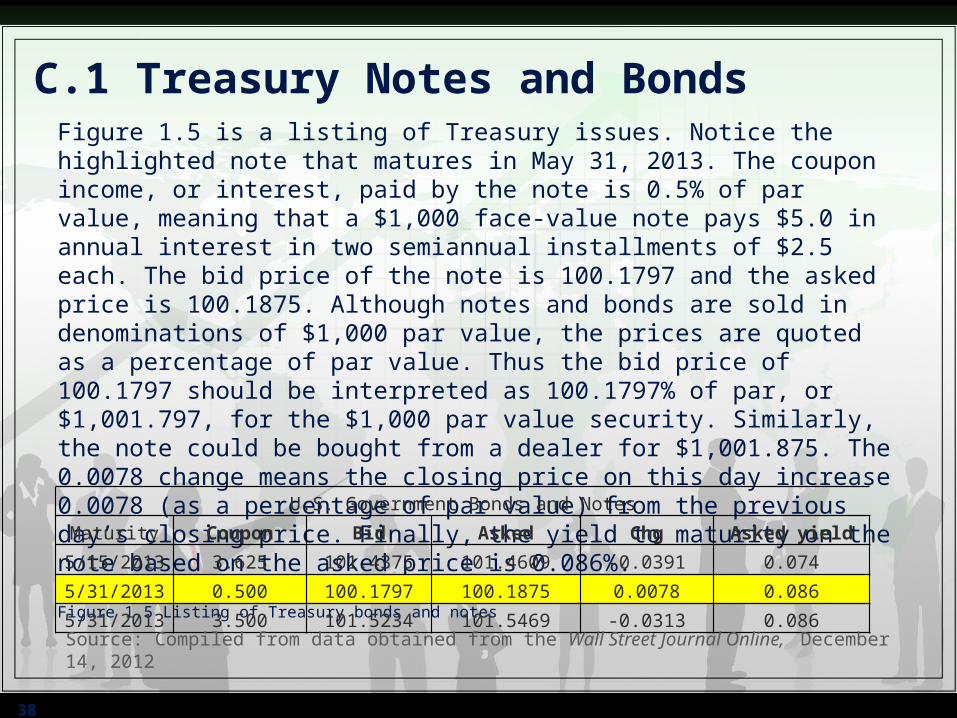
C.1 Treasury Notes and BondsFigure 1.5 is a listing of Treasury issues. Notice the highlighted note that matures in May 31, 2013. The coupon income, or interest, paid by the note is 0.5% of par value, meaning that a $1,000 face-value note pays $5.0 in annual interest in two semiannual installments of $2.5 each. The bid price of the note is 100.1797 and the asked price is 100.1875. Although notes and bonds are sold in denominations of $1,000 par value, the prices are quoted as a percentage of par value. Thus the bid price of 100.1797 should be interpreted as 100.1797% of par, or $1,001.797, for the $1,000 par value security. Similarly, the note could be bought from a dealer for $1,001.875. The 0.0078 change means the closing price on this day increase 0.0078 (as a percentage of par value) from the previous day’s closing price. Finally, the yield to maturity on the note based on the asked price is 0.086%.
Figure 1.5 Listing of Treasury bonds and notes
U.S. Government Bonds and NotesMaturity Coupon Bid Asked Chg Asked yield
5/15/2013 3.625 101.4375 101.4609 -0.0391 0.0745/31/2013 0.500 100.1797 100.1875 0.0078 0.0865/31/2013 3.500 101.5234 101.5469 -0.0313 0.086
Source: Compiled from data obtained from the Wall Street Journal Online, December 14, 2012
39
C.2 Inflation-Protected Treasury Bonds• In the United States inflation-protected Treasury bonds are called TIPS (Treasury Inflation-Protected Securities).
•The principal amount on these bonds is adjusted in proportion to increases in the Consumer Price Index.
•Therefore, they provide a constant stream of income in real (inflation-adjusted) dollars. Yields on TIPS bonds should be interpreted as real or inflation-adjusted interest rates.
40
C.3 Federal Agency Debt• Some government agencies issue their own securities to finance their activities.
•The major mortgage-related agencies are the Federal Home Loan Bank (FHLB), the Federal National Mortgage Association (FNMA, or Fannie Mae), the Government National Mortgage Association (GNMA, or Ginnie Mae), and the Federal Home Loan Mortgage Corporation (FHLMC, or Freddie Mac).
41
C.4 International Bonds• Eurobond: a bond denominated in a currency other than that of the country in which it is issued e.g. a dollar-denominated bond sold in Britain
• Think of them simply as international bonds.
•In contrast to bonds that are issued in foreign currencies, many firms issue bonds in foreign countries but in the currency of the investor.
•For example, a Yankee bond is a dollar-denominated bond sold in the United States by a non-U.S. issuer.
42
C.5 Municipal Bonds• Municipal bonds: those issued by states, counties, cities, and state and local government-established authorities (nonfederal agencies). • 2 types of municipal bonds: 1. General-Obligation Bonds (GOBs). GOBs
are backed by the “full faith and credit” of the issuing governmental unit, which basically means that the unit may tax its constituents to the legal limit, if necessary, to pay the principal and interest on the bonds. 2. Revenue Bonds are backed only by the revenues generated by the project being financed.
• Federal income-tax exempted•Equivalent taxable yield (ETY) of a tax-exempt issue is
• (1.6)•where = the marginal tax rate of the investor. So an investor in the 30% tax bracket would consider a 9% municipal bond to be equivalent to a 13% taxable bond [9/(1 − 0.3) = 13].
43
C.5 Municipal Bonds• We also can use Equation 1.6 to find the tax bracket at which investors are indifferent between taxable and tax-exempt bonds.
• The cutoff tax bracket is given by solving Equation 1.6 for the tax bracket at which after-tax yields are equal:• (1.7)
• Thus the yield ratio rm / ETY is a key determinant of the attractiveness of municipal bonds.
44
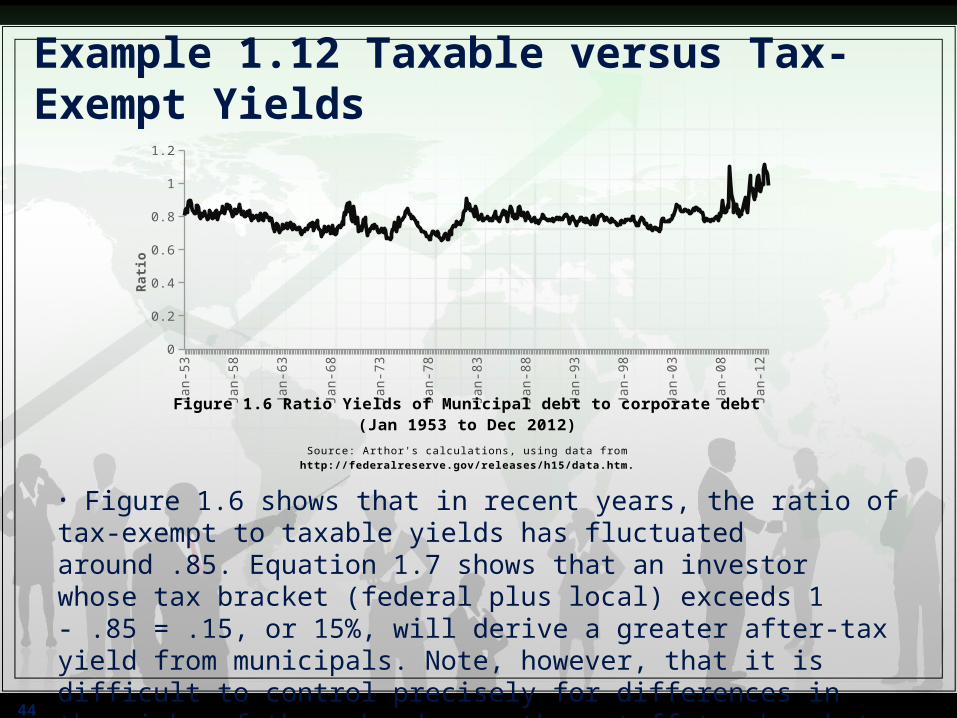
Example 1.12 Taxable versus Tax-Exempt Yields
• Figure 1.6 shows that in recent years, the ratio of tax-exempt to taxable yields has fluctuated around .85. Equation 1.7 shows that an investor whose tax bracket (federal plus local) exceeds 1 - .85 = .15, or 15%, will derive a greater after-tax yield from municipals. Note, however, that it is difficult to control precisely for differences in the risks of these bonds, so the cutoff tax bracket must be taken as approximate.
Jan-
53
Jan-
58
Jan-
63
Jan-
68
Jan-
73
Jan-
78
Jan-
83
Jan-
88
Jan-
93
Jan-
98
Jan-
03
Jan-
08
Jan-
12
0
0.2
0.4
0.6
0.8
1
1.2R
atio
Figure 1.6 Ratio Yields of Municipal debt to corporate debt (Jan 1953 to Dec 2012)Source: Arthor's calculations, using data from http://federalreserve.gov/releases/h15/data.htm.
45
C.6 Corporate Bonds• Corporate bonds are the means by which private firms borrow money directly from the public• Secured bonds: have specific collateral backing them in the event of firm bankruptcy• Unsecured bonds (debentures): have no collateral; and subordinated debentures, which have a lower priority claim to the firm’s assets in the event of bankruptcy.•Callable bonds give the firm the option to repurchase the bond from the holder at a stipulated call price. •Convertible bonds give the bondholder the option to convert each bond into a stipulated number of shares of stock.
46
C.7 Mortgages and Mortgage-Backed Securities
•A mortgage-backed security is either an ownership claim in a pool of mortgages or an obligation that is secured by such a pool. •These claims represent securitization of mortgage loans.
EQUITY SECURITIESSection D
47
D.1 Common Stock as Ownership SharesD.2 Characteristics of Common StockD.3 Stock Market ListingsD.4 Preferred StockD.5 Depository ReceiptsD.6 Stock Market IndexesD.7 Bond Market Indicators

48
D.1 Common Stock as Ownership Shares•Common stocks, also known as equity securities or equities, represent ownership shares in a corporation. •Each share of common stock entitles its owner to one vote on any matters of corporate governance that are put to a vote at the corporation’s annual meeting and to a share in the financial benefits of ownership
49
D.2 Characteristics of Common Stock•The two most important characteristics of common stock as an investment are its residual claim and limited liability features.
• Residual claim means that stockholders are the last in line of all those who have a claim on the assets and income of the corporation.
• Limited liability means that the most shareholders can lose in the event of failure of the corporation is their original investment.
50
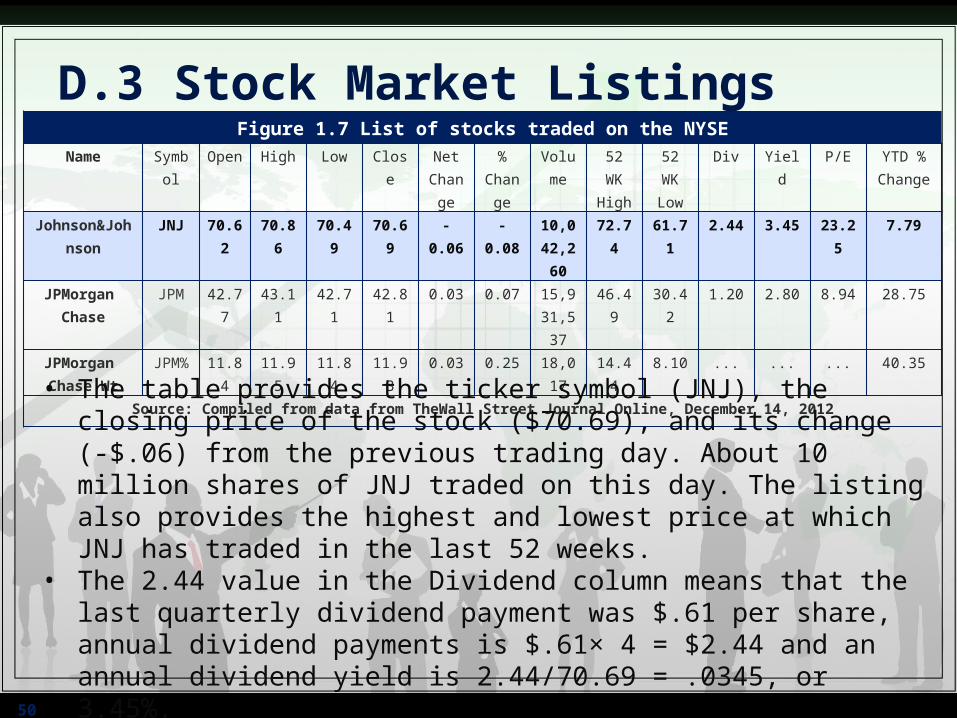
D.3 Stock Market ListingsFigure 1.7 List of stocks traded on the NYSE
Name Symbol
Open High Low Close Net Chang
e
% Chang
e
Volume
52 WK High
52 WK Low
Div Yield P/E YTD % Change
Johnson&Johnson
JNJ 70.62 70.86 70.49 70.69 -0.06 -0.08 10,042,260
72.74 61.71 2.44 3.45 23.25 7.79
JPMorgan Chase
JPM 42.77 43.11 42.71 42.81 0.03 0.07 15,931,537
46.49 30.42 1.20 2.80 8.94 28.75
JPMorgan Chase Wt
JPM% 11.84 11.95 11.84 11.93 0.03 0.25 18,017 14.44 8.10 ... ... ... 40.35
Source: Compiled from data from TheWall Street Journal Online, December 14, 2012
• The table provides the ticker symbol (JNJ), the closing price of the stock ($70.69), and its change (-$.06) from the previous trading day. About 10 million shares of JNJ traded on this day. The listing also provides the highest and lowest price at which JNJ has traded in the last 52 weeks.
• The 2.44 value in the Dividend column means that the last quarterly dividend payment was $.61 per share, annual dividend payments is $.61× 4 = $2.44 and an annual dividend yield is 2.44/70.69 = .0345, or 3.45%.
• The P/E ratio, or price–earnings ratio, is the ratio of the current stock price to last year’s earnings per share.
51
D.4 Preferred Stock• Preferred stock has features similar to both equity and debt.• • Like a bond, it promises to pay to its holder a fixed amount of
income each year. In this sense preferred stock is similar to an infinite-maturity bond, that is, a perpetuity.
• Like a equity, the firm retains discretion to make the dividend payments to the preferred stockholders; it has no contractual obligation to pay those dividends. Instead, preferred dividends are usually cumulative.
• Preferred stock is issued in variations similar to those of corporate bonds. It may be callable by the issuing firm, in which case it is said to be redeemable.
52
D.5 Depository Receipts• American Depository Receipts, or ADRs, are certificates traded in U.S. markets that represent ownership in shares of a foreign company.
• Each ADR may correspond to ownership of a fraction of a foreign share, one share, or several shares of the foreign corporation.
• ADRs were created to make it easier for foreign firms to satisfy U.S. security registration requirements.
• They are the most common way for U.S. investors to invest in and trade the shares of foreign corporations.

53
D.6 Stock Market Indexes• Market-index values have also been commonly used to provide insights into such economic variables as the growth of economic output and corporate returns.
• In this section, we will introduce • Dow Jones Industrial Average (DJIA) • Standard & Poor’s Composite 500 (S&P 500) stock
index • Quantity-Weighted Indexes • Foreign and International Stock Market Indexes
54
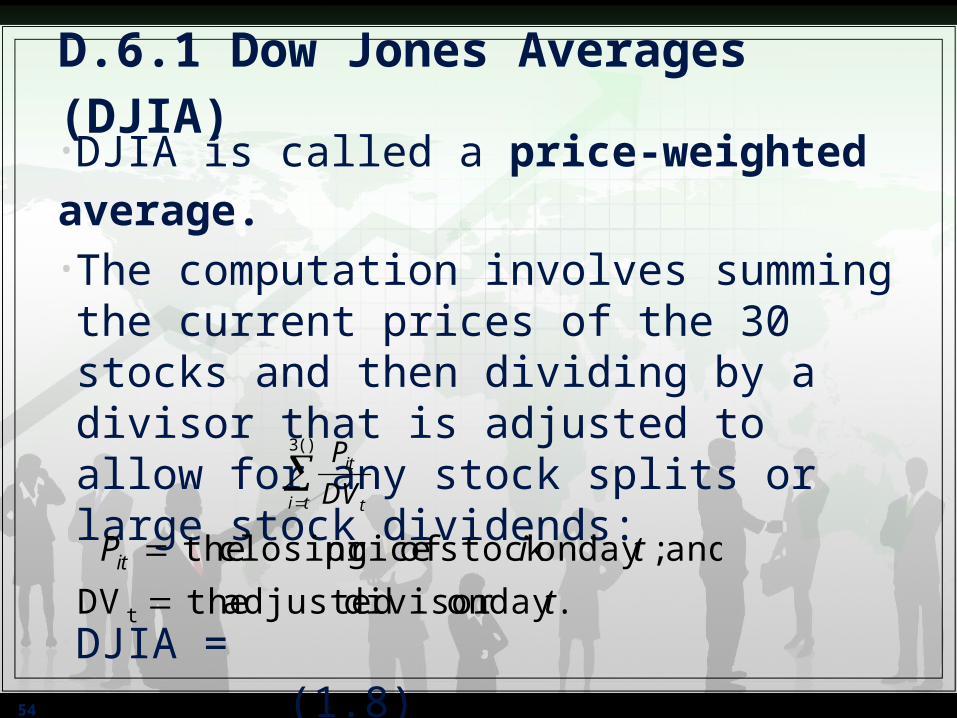
D.6.1 Dow Jones Averages (DJIA)•DJIA is called a price-weighted average.•The computation involves summing the current prices of the 30 stocks and then dividing by a divisor that is adjusted to allow for any stock splits or large stock dividends:
•DJIA = (1.8)
()3
ti t
it
DV
P
.day on divisor adjusted theDV
and ; day on stock of price closing the
t t
tiPit
55
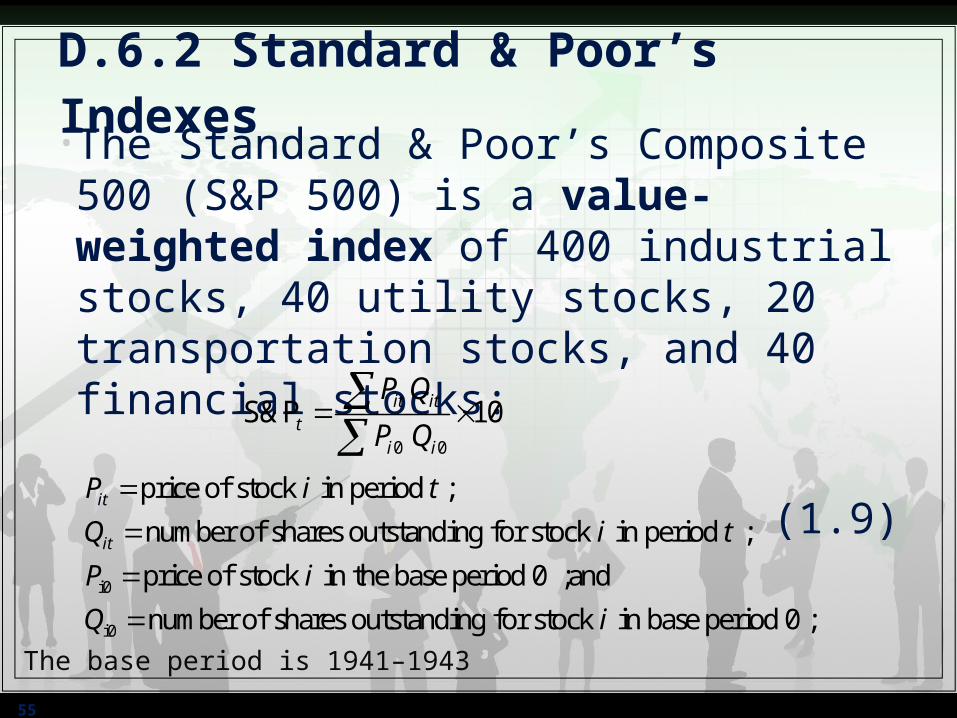
D.6.2 Standard & Poor’s Indexes•The Standard & Poor’s Composite 500 (S&P 500) is a value-weighted index of 400 industrial stocks, 40 utility stocks, 20 transportation stocks, and 40 financial stocks:
• (1.9)0 0
S&P 10it itt
i i
P Q
P Q
i0
i0
price of stock in period ;
number of shares outstanding for stock in period ;
price of stock in the base period 0 ;and
number of shares outstanding for stock in base period 0 ;
it
it
P i t
Q i t
P i
Q i
The base period is 1941–1943
56
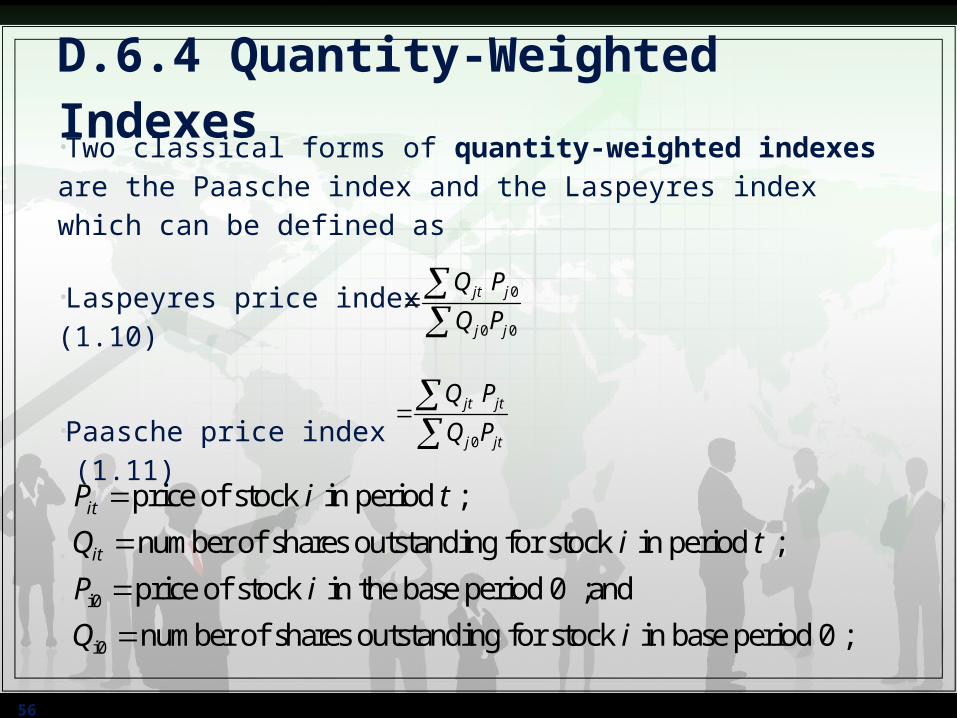
D.6.4 Quantity-Weighted Indexes•Two classical forms of quantity-weighted indexes are the Paasche index and the Laspeyres index which can be defined as
•Laspeyres price index (1.10)
•Paasche price index (1.11)
•
•
•
0
0 0
jt j
j j
Q P
Q P
0
jt jt
j jt
Q P
Q P
i0
i0
price of stock in period ;
number of shares outstanding for stock in period ;
price of stock in the base period 0 ;and
number of shares outstanding for stock in base period 0 ;
it
it
P i t
Q i t
P i
Q i

57
Example 1.14• The data in Tables 1.4 and 1.5 indicate the price and volume of four
pharmaceutical companies:
• The total cost of purchasing the quantities in first week (base period) and second week are
• Laspeyres price index (Eq 1.10) is 100(2,761.00/2,704.08)=102.10
Table 1.4 Prices of Stock in Four Pharmaceutical Corporations for the First 12 Weeks of 2013, with the Unweighted Aggregate Index of Prices
Week Date JNJ MRK PFE BMY Average Index of Average1 2013/1/2 70.45 41.19 25.32 32.81 42.44 100.00 2 2013/1/7 71.24 42.43 25.86 33.58 43.28 101.97
Table 1.5 Volume of Transactions in Shares of Four Pharmaceutical Corporations for the First 12 Weeks of 2013 (million shares)
Week Date JNJ MRK PFE BMY1 2013/1/2 11.37 18.31 31.96 10.36 2 2013/1/7 8.94 12.29 30.59 8.49
(70.45)(11.37) (41.19)(18.31) (25.32)(31.96) (32.81)(10.36) $2,704.08
71.24 11.37 42.43 18.31 25.86 31.96 33.58 10.36 $2,761.00
58
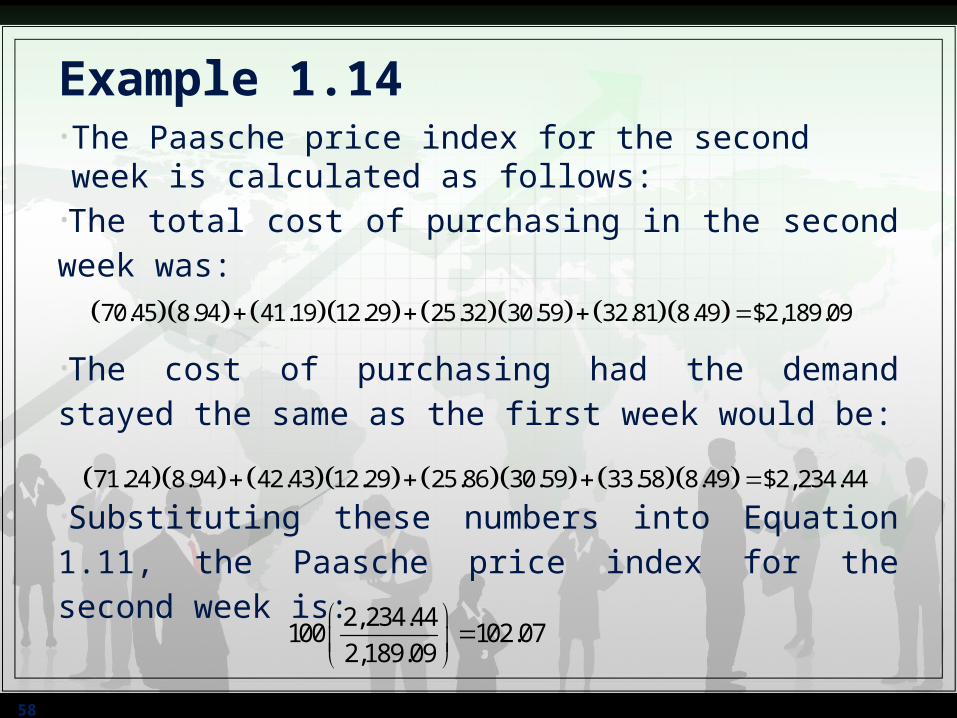
Example 1.14 • The Paasche price index for the second week is calculated as follows:•The total cost of purchasing in the second week was:
•The cost of purchasing had the demand stayed the same as the first week would be:
•Substituting these numbers into Equation 1.11, the Paasche price index for the second week is:
70.45 8.94 41.19 12.29 25.32 30.59 32.81 8.49 $2,189.09
71.24 8.94 42.43 12.29 25.86 30.59 33.58 8.49 $2,234.44
2, 234.44100 102.07
2,189.09
59
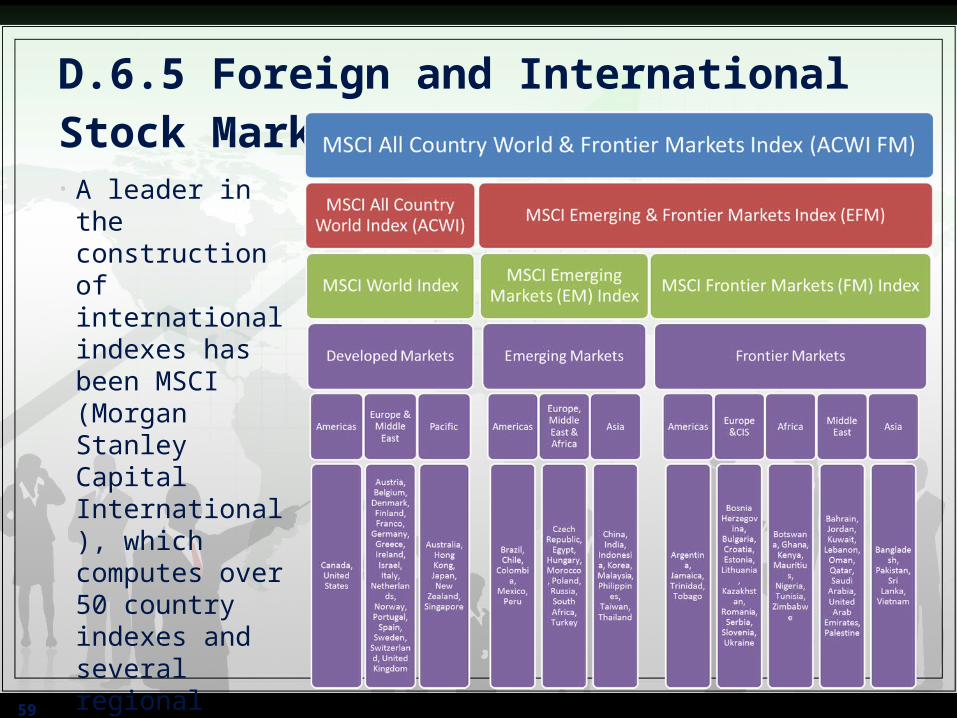
D.6.5 Foreign and International Stock Market Indexes• A leader in the
construction of international indexes has been MSCI (Morgan Stanley Capital International), which computes over 50 country indexes and several regional indexes (Fig. 1.9).
•
•
60
D.7 Bond Market Indicators•Just as stock market indexes provide guidance concerning the performance of the overall stock market, several bond market indicators measure the performance of various categories of bonds.
•The three most well-known groups of indexes are those of Merrill Lynch, Barclays (formerly, Barclays Capital Aggregate Bond Index which used to be called the Lehman Aggregate Bond Index), and Salomon Smith Barney (now part of Citigroup).
•Most bonds are not listed on the major exchanges but trade in the over-the-counter market (OTC).

DERIVATIVE MARKETSSection E
61
E.1 Futures ContractsE.2 Options
62
E.1 Futures Contracts• A key element necessary for the existence of futures markets is the balance between the number of hedgers and speculators who are willing to transfer and accept risk.
• A future contract is a standardized legal agreement between a buyer and a seller, who promise to exchange a specified amount of money for goods or services at a future time.
• The long position is held by the trader who commits to purchasing the asset on the delivery date. The trader who takes the short position commits to delivering the asset at contract maturity.
63
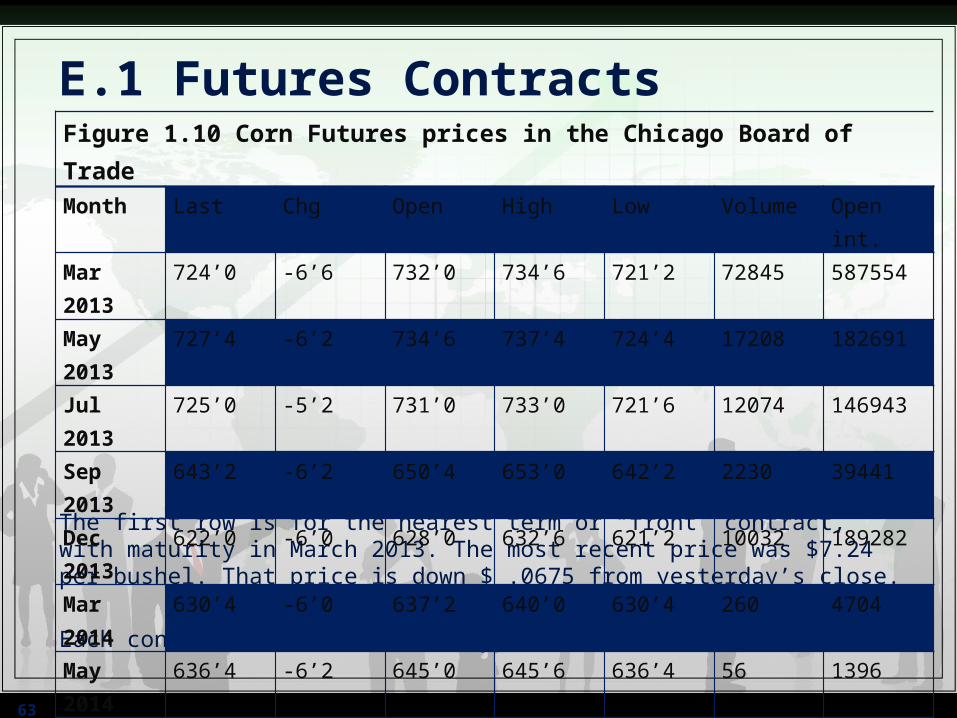
E.1 Futures Contracts
• The first row is for the nearest term or “front” contract, with maturity in March 2013. The most recent price was $7.24 per bushel. That price is down $ .0675 from yesterday’s close.
• Each contract calls for delivery of 5,000 bushels
Figure 1.10 Corn Futures prices in the Chicago Board of Trade Month Last Chg Open High Low Volume Open int.Mar 2013 724’0 -6’6 732’0 734’6 721’2 72845 587554May 2013 727’4 -6’2 734’6 737’4 724’4 17208 182691Jul 2013 725’0 -5’2 731’0 733’0 721’6 12074 146943Sep 2013 643’2 -6’2 650’4 653’0 642’2 2230 39441Dec 2013 622’0 -6’0 628’0 632’6 621’2 10032 189282Mar 2014 630’4 -6’0 637’2 640’0 630’4 260 4704May 2014 636’4 -6’2 645’0 645’6 636’4 56 1396Jul 2014 637’6 -6’4 647’0 647’0 637’6 68 1342Sep 2014 597’0 -3’0 600’0 600’0 597’0 16 106Dec 2014 595’0 -3’0 598’0 600’0 595’0 200 8243Source: The Wall Street Journal Online, December 17, 2012
64
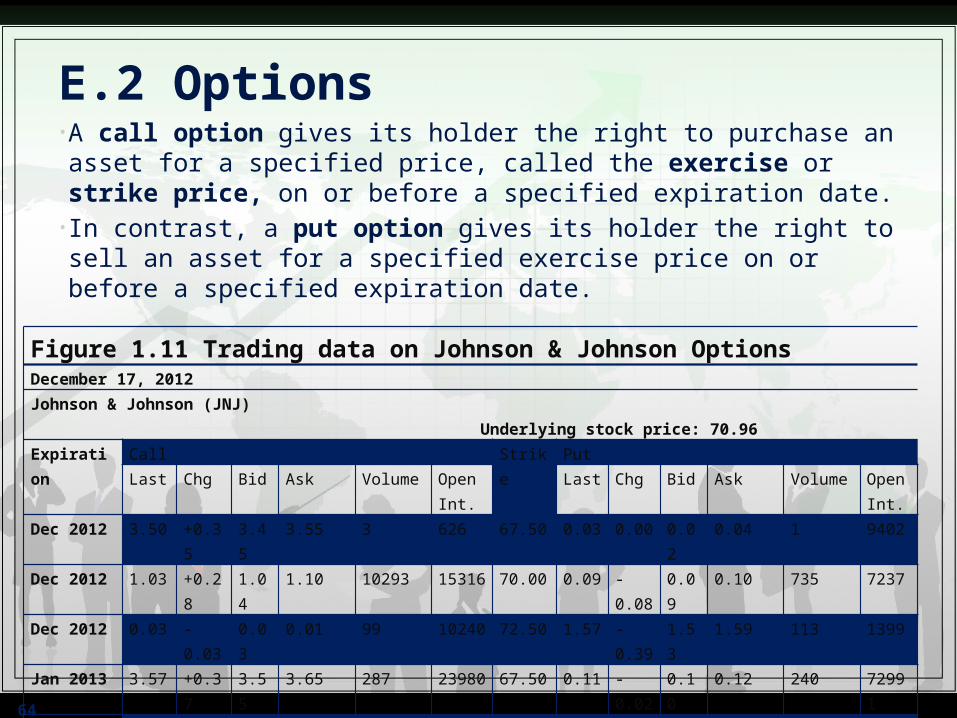
E.2 Options• A call option gives its holder the right to purchase an asset for a
specified price, called the exercise or strike price, on or before a specified expiration date.
• In contrast, a put option gives its holder the right to sell an asset for a specified exercise price on or before a specified expiration date.
Figure 1.11 Trading data on Johnson & Johnson OptionsDecember 17, 2012
Johnson & Johnson (JNJ) Underlying stock price: 70.96
Expiration Call Strike PutLast Chg Bid Ask Volume Open
Int.Last Chg Bid Ask Volume Open
Int.Dec 2012 3.50 +0.35 3.45 3.55 3 626 67.50 0.03 0.00 0.02 0.04 1 9402Dec 2012 1.03 +0.28 1.04 1.10 10293 15316 70.00 0.09 -0.08 0.09 0.10 735 7237Dec 2012 0.03 -0.03 0.03 0.01 99 10240 72.50 1.57 -0.39 1.53 1.59 113 1399Jan 2013 3.57 +0.37 3.55 3.65 287 23980 67.50 0.11 -0.02 0.10 0.12 240 72991Jan 2013 1.42 +0.21 1.41 1.43 313 70004 70.00 0.46 -0.15 0.46 0.47 444 10940Jan 2013 0.27 +0.03 0.25 0.27 1188 33215 72.50 1.82 -0.32 1.78 1.83 308 7645Mar 2013 6.20 +0.65 6.05 6.15 3 2418 65.00 0.26 -0.07 0.25 0.26 235 25415Mar 2013 3.85 +0.30 3.80 3.85 53 47303 67.50 0.57 -0.14 0.56 0.58 179 12726Mar 2013 1.92 +0.20 1.89 1.92 416 13686 70.00 1.34 -0.18 1.31 1.33 120 5866
THE MUTUAL FUND MARKETS
Section F
65
66
F.The Mutual Fund Markets•Mutual funds are one of the most important investments for
individual investors.
•The investment objectives of mutual funds can be classified into four categories as (1) Growth, (2) Income and growth, (3) Income and (4) Income, growth, and stability (balanced fund).
• •Based upon investment policy, mutual funds can also be
classified into: 1. money market funds, 2. equity funds, 3. sector funds, 4. bond funds, 5. international funds, 6. balanced funds, 7. asset allocation and flexible funds and 8. index funds.
67
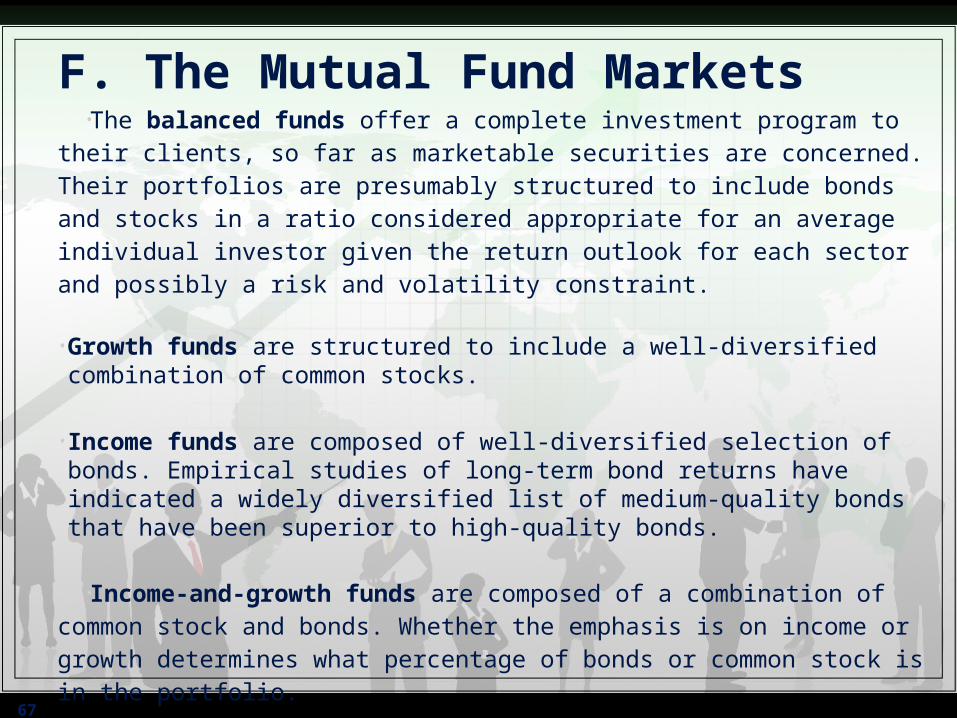
F. The Mutual Fund Markets•The balanced funds offer a complete investment program to their
clients, so far as marketable securities are concerned. Their portfolios are presumably structured to include bonds and stocks in a ratio considered appropriate for an average individual investor given the return outlook for each sector and possibly a risk and volatility constraint.
• Growth funds are structured to include a well-diversified combination of common stocks.
• Income funds are composed of well-diversified selection of bonds. Empirical studies of long-term bond returns have indicated a widely diversified list of medium-quality bonds that have been superior to high-quality bonds.
•Income-and-growth funds are composed of a combination of common stock and bonds. Whether the emphasis is on income or growth determines what percentage of bonds or common stock is in the portfolio.
THE HEDGE FUND MARKETS*Section G
68
*This portion is contributed by John Longo, Finance & Economics Department, Rutgers Business School. Source: The material in this segment is adapted from the J. Longo, “Hedge Funds: Overview, Strategies, and Trends,” in Encyclopedia of Finance, 2nd Edition, Ed. C.F. Lee and A. Lee, Springer, 2013
69
G. The Hedge Fund Markets• Hedge funds are quite likely the most important investment vehicles in the
financial markets today since they control roughly $2 trillion in assets and account for the bulk of trading volume across many asset classes.
• In order to get some sense of how a hedge fund may work, it may be helpful to discuss the original hedge fund exposure model created by A.W. Jones. His fund commenced in 1949 and lost capital in only three of the thirty-four years of its operation. Jones’ Model may be expressed as follows:
• Net Exposure (%) = ($ Long - $ Short) / $ Equity (1.12)• where:• $ Long = the dollar value of long positions held by the fund• $ Short = the dollar value of short positions held by the fund• $ Equity = the net equity in the fund

SUMMARY
Section H
70
71
H. SUMMARY• In this chapter, we first discuss financial markets, and then we discuss
several markets as follows.• In money market section, we discuss Treasury bills, certificates of deposit,
commercial papers and bankers’ acceptances. • In the bond market section, we include treasury notes and bonds, inflation-
protected treasury bonds, federal agency debt, international bonds, municipal bonds, corporate bonds, and mortgages and mortgage-backed securities.
• In equity securities section, we discuss common stock as ownership shares, characteristics of common stock, stock market listings, preferred stock, depository receipts, stock market indexes and bond market indicators.
• Furthermore, option and future contracts and the examples are illustrated in derivative markets section.
• The mutual fund markets section includes balanced funds, growth funds, income funds, and income-and-growth funds.
• Finally, we discuss hedge fund exposure model in the hedge fund markets section to show how a hedge fund may work.