supermarkets, international trade and farmers in ... international trade and... · supermarkets,...
TRANSCRIPT
Supermarkets, International Trade and Farmers in Developing
Countries:
Evidence from Madagascar
Bart Minten, Lalaina Randrianarison and Johan F.M. Swinnen
September 2005
Abstract
Global retail companies (“supermarkets”) have an increasing influence on developing
countries, through foreign investments and/or through the imposition of their private
standards. The impact on developing countries and poverty is often assessed as negative.
In this paper we show the opposite, based on an analysis of primary data collected to
measure the impact of supermarkets on small contract farmers in Madagascar, one of the
poorest countries in the world. Almost 10,000 farmers in the Highlands of Madagascar
produce vegetables for supermarkets in Europe. In this global supply chain, small
farmers’ micro-contracts are combined with extensive farm assistance and supervision
programs to fulfill complex quality requirements and phyto-sanitary standards of
supermarkets. Small farmers that participate in these contracts have higher welfare,
more income stability and shorter lean periods. We also find significant effects on
improved technology adoption, better resource management and spillovers on the
productivity of the staple crop rice. The small but emerging modern retail sector in
Madagascar does not (yet) deliver these benefits as they do not (yet) request the same
high standards for their supplies.
ISSN1936-5071

1
Supermarkets, International Trade and Farmers in Developing
Countries: Evidence from Madagascar
1. Introduction
Globalization, trade liberalization and the lowering of barriers to trade has generally led
to an increased inflow of foreign investments and the establishment of multinationals in
developing countries. Critics argue that this type of investments cause more harm than
good as they exploit the workers in developing countries and might lead to permanent
environmental damage. Countries eager to attract multinationals offer tax concessions
and let poor countries compete among themselves such that the country that allows those
firms in, end up losers. On the other hand, other studies show that there are significant
beneficial effects, i.e. the learning of productivity-enhancing techniques from foreign
firms with better technology and management practices (Bhagwati, 2004).
A particularly interesting area to study these developments is in the agricultural and food
sector, and more specifically the production, marketing and trade of fresh and processed
fruits and vegetables, one of the most dynamic segments of developing country
participation in world markets (Diop and Jaffee, 2005).1 Given the high labor
requirements in this sector, the low land costs and longer cultivation periods in
developing countries as well as the trade incentives given by some developed countries,
developing countries have been able to capture a significantly increased share of world
trade (Diop and Jaffee, 2005).2 However, modern retailing companies increasingly
dominate international and local markets in fruits and vegetables and set the standards for
food quality and safety in this sector (Reardon et al., 2003; Reardon and Berdegué, 2002;
Reardon and Swinnen, 2004; Weatherspoon and Reardon, 2003; Reardon and Barrett,
2000). There is thus considerable debate and uncertainty on the impacts of these
developments for farmers and poverty in developing countries.
1 World trade reached $71.6 billion in 2001, an increase by 30% compared to 1990. 2 While fresh and processed fruit and vegetable products accounted for 17% of total exports from developing countries in 1980/1, this share increased to 22% in 2000/1 and this despite a significant price decrease over the same period (Diop and Jaffee, 2005).

2
Available evidence on Africa points mostly at negative implications for small farmers.
Several studies indicate that small farmers are left behind in the supermarket-driven
horticultural marketing and trade (Key and Runsten, 1999; Reardon and Barrett, 2000;
Reardon et al., 2003; Kirsten and Sartorius, 2002; Delgado, 1999; Weatherspoon et al.,
2001). For example, UK supermarkets have been buying increasingly from estates
instead from smallholders in Kenya (Gibbon, 2003; Dolan and Humphrey; 2001;
Humphrey et al., 2004; Kherallah, 2000). While Minot and Ngigi (2004) confirm this
decline in the importance of smallholders for exports, they however still estimate that half
of Kenya’s fruits and vegetables exports are grown by smallholders. This is in contrast
with Côte d’Ivoire where most of the fruit and vegetables exports are grown on large
industrial estates. Weatherspoon and Reardon (2003) find that the rise of supermarkets in
Southern Africa is hardest for the small producers who are excluded from dynamic urban
markets due to the tough quality and safety standards.
In this paper we present very different findings from a study on small farmers in
Madagascar producing for supermarkets. We find that, given the right incentives and
contracting systems, small farmers in developing countries - and in Africa in particular -
can participate successfully in these emerging value chains. Thousands of small farmers
benefit because of a combination of effects, such as improved access to inputs, credit,
extension services, technology adoption, and from productivity spillover effects on other
crops and enhanced income stability.
The study analyzes the contracting of almost 10,000 small farmers in the Highlands of
Madagascar for the production of vegetables for supermarkets in Europe. The production
and marketing of these vegetables have grown rapidly over the last fifteen years despite
of the imposition of more stringent public and private safety and quality requirements
over time. The number of farmers of vegetables for export has grown in Madagascar,
despite major disadvantages of geography, bad local infrastructure, low rural education
levels, and high compliance and transaction costs. We document the contract mechanism
in the supply chains that have been used sustainably and flexibly adopted to new niche
markets over the last fifteen years and analyze the effects of these contracts on farming

3
practices and on welfare of the local farmers. The paper also discusses how recent
investments in supermarkets in Madagascar have affected local demand for high quality
vegetables and its implications.
The structure of the paper is as follows. First, we explain the methodology and present
the set-up of the survey that was used for primary data collection. In the third section, we
give background information on Madagascar, on government and EU trade policy, and on
the incentives and constraints on vegetable production in Madagascar. In section four, we
discuss the supply chain under study and the structure of the value chain. In section five,
the influence of supermarkets on standards and on the contractual arrangements is
described. In section six and seven, we look at the impact of the contract on farming
practices and on the welfare of the farmers respectively. We finish with the conclusions.
2. Data and methodology
The analysis of the vegetable supply chain is based on interviews at various levels of the
supply chain and a representative supplier (farm household) survey. First, at the
processing and marketing level, several interviews were held with the managers of the
main processing company regarding their strategy, activities, the value chain of the
products that they sell and purchase, the constraints that they face in a very poor
developing country such as Madagascar, the type of contracts that they put in place, the
requirements of supermarkets and importing countries and how it has changed over time,
and its impact on their functioning and their management structure. We also discussed
with them in advance the design and the sampling frame of a primary survey that we
organized with their contract farmers. During a debriefing session, the results were
presented and further discussed.
Second, the supplier (farm household) survey was organized during the months of June
and July 2004. Four fivondronona (districts) were selected from the region where
vegetable suppliers were active. Two fivondronona were chosen that were at a close
distance to the capital. Two were selected that were further away (i.e. given that it was

4
still in the area where vegetables for exports were produced). The second stratum
criterium was accessibility. Two communes were then selected in each fivondronona.
Twenty-five households per commune were randomly chosen among those households
that had contracts for vegetable production and that had ricefields under contract. Two-
hundred farmers were interviewed in total.
A comprehensive survey was implemented where questions were asked on the
demographic situation of the household, land assets, the nature of the contract, the
relationships with the firm, control and supervision practices of the firm, the benefits and
disadvantages of working with contracts, the perceived effects on welfare, and the level
of inputs and output on the contracted plots. We asked the enumerators and the farmers
also to select one lowland plot with a contract with the firm and a second lowland plot
without off-season crops and contracts as to measure the spillover effects on non-
contracted crops.
3. Constraints and incentives for production, marketing, and exporting in
Madagascar
Madagascar, an island country with 16 million inhabitants, located off the coast of Africa
has similar economic and social characteristics as most African countries. Poverty is high
and especially so in rural areas: while the overall poverty headcount ratio was evaluated
at 70% in 2001, it was as high as 77% in rural areas compared to 44% in urban areas.
Education levels are low and it is estimated that only about half of the population is able
to read and write. Malnutrition levels are equally high and 45% of the children under
three are growth-retarded (Instat, 2005). Madagascar is largely an agricultural economy:
agriculture counted for about a quarter of GDP and 80% of employment in 2002.
However, agricultural performance has been sluggish over the years.3
3 For example, the yields of its main staple rice are about two tons per hectare and have been at this level for the last forty years. This low level has often to do with the lack of replenishment of nutrients, bad water management and the low adoption of improved technologies (Minten and Barrett, 2005; World Bank, 2003).

5
Farm sizes in Madagascar are small, even for the relatively large landowners: the median
area owned per household is estimated, based on the national household survey (EPM) of
2001, at about 1 ha. Large mechanized agricultural farms are rare. Fraslin (2002)
estimates that its number is between 100 and 200 and that they occupy less than 2% of
the cultivated agricultural land of the country as a whole. With a Gini-coefficient of 0.57,
the distribution of land is considered moderately equitable (World Bank, 2003). The
median size of an average agricultural plot is 20 are.
Infrastructure is bad and strongly related with agricultural performance (Stifel and
Minten, 2003). This hinders export.4 However, it is not the only constraint in
competitiveness. Largely due to a poor scoring on indices of governance and institutional
quality, Madagascar ranked last out of 25 countries on an index of competitiveness in
2000 (World Bank, 2004).5 In a recent investment climate analysis, it is found that
unskilled Malagasy workers earn one of the lowest wages compared to other surveyed
countries in sub-Saharan Africa and Asia. Worker productivity, measured as value-added
per worker, is also very low. However, Malagasy firms remain competitive
internationally when looking at both wages and productivity (Boccardo et al., 2005).
In an effort to allow the poorest countries to better participate in international trade,
Madagascar has been given preferential access to European and US markets. Under the
Everything but Arms (EBA) initiative, relevant for trade in fruits and vegetables, 48 UN-
defined least developed countries – including Madagascar - have duty-free and quota-free
access into the European Union (EU). Before this initiative, Madagascar had already
easier access to the European markets as under the EU-ACP Lomé conventions,
unilateral preferential access is given to 75 African, Caribbean and Pacific (ACP)
countries. Madagascar also enjoys preferential access to the US market through the
African Growth Opportunity Act (AGOA). 4 For example, comparing clothes coming from Sri Lanka with those coming from Madagascar (both destined for Paris) indicates a transport cost about a third higher for Madagascar. The cost from Hong Kong, the better-connected location, is less than half the cost from Madagascar even though the distance is about the same between both sources (World Bank, 2004). 5 It ranked higher in the Transparency International Corruption Perception index in 2003 (88th out of 133 countries).

6
With the aim to encourage exports, the government established in 1989 an export
processing zone (EPZ) or Zone Franche modeled after the successful experience of
neighboring Mauritius. Enterprises in the EPZ enjoy benefits including tax holidays from
the corporate income tax ranging from 2 to 15 years (and a fixed level of 10% for all the
years after), exemptions from import duties and taxes and liberty in access and
movements of foreign exchange (Cadot and Nasir, 2001; Razafindrakoto and Roubaud,
2002; Glick et al., 2004). To be eligible for EPZ status, firms need to export at least 95%
of their production.
A good part of the economic growth at the end of 90s in Madagascar was due to the
expansion of export earnings, reflecting (in addition to the increase in international prices
for vanilla) the rapid expansion of activity in Madagascar’s new EPZ (Glick et al., 2004).
Output in EPZ enterprises increased by about 20% annually from 1997-2001 as foreign
investors took advantage of the country’s low labor costs as well as the incentives
provided by trade initiatives (in particular, the U.S.’s Africa Growth and Opportunity
Act) (Glick et al., 2004). By 2001, EPZ firms accounted for about half of all secondary
sector employment in the country. The sector consists mostly of textile and apparel
manufacturing firms, located primarily in the capital city Antananarivo and the city of
Antsirabe. Some firms invested in agriculture. The most important ones started activities
in the shrimp and the fishery sector.6 A few firms produce agricultural produce for export
under the EPZ regime. High value vegetable exports to the EU, and to its retailers, are the
most important sector in these agricultural exports.
The estimated benefits of EPZ firms for the country as a whole are controversial. Critics
argue that the state does not benefit at all from these enterprises as they are not taxed and
that these firms create unfair competition with local firms, exploit local labor and are
weakly integrated in the local economy (Razafindrakoto and Roubaud, 2002). Others
6 This led to a dramatic increase in exports in the primary sector. For example, it is estimated that total shrimp production has risen by more than 40% from 1997-2001 (World Bank, 2003). Malagasy shrimp is known for its quality in Europe. However, part of export growth in this sector is also explained by the preferential access that Madagascar has into the markets of the European Union.

7
argue that there are strong benefits. Glick et al. (2004) and Razafindrakoto and Roubaud
(2002) show that salaries and working conditions are significantly better in EPZ firms
than in other sectors while Nicita and Razzaz (2003) find that a sustained 5 year growth
of 20% per year of the textile sector would raise the consumption expenditures of more
than 1 million Malagasy by an average of 24%.
More recently, foreign retailers have made a series of investments in supermarkets in
Madagascar, particular in the capital Antananarivo and in some regional capitals. Foreign
retail investors include the South-African chain Shoprite and the French chains
Leaderprice and Score. The expectation was that this would create a domestic demand for
high quality and high value fruit and vegetable production.
4. The vegetable supply chain
Processing, marketing, and exporting
The main vegetable exports from Madagascar sold in supermarkets are hand-picked and
hand-handled fine French beans. Because these beans are hand-picked, quality is
perceived superior and it fetches a price in European supermarkets that is twice or three
times higher than the price for the more industrial produced French beans in Europe.
Given the intensive labor requirements, most of these French beans are produced outside
Europe and mostly in developing countries. Exports from Madagascar currently account
for around 10% of the processed French bean market in Europe. The other major
exporters to the Western European market - most importantly France, Belgium, the U.K.
and the Netherlands - are Morocco7, which started more recently in this market but
became very quickly important, Kenya and China.8
7 Morocco has a location advantage compared to other African countries to transport beans by refrigerated trucks through Spain. 8 China, that entered the market about 8 years ago, lost recently market share for several reasons. First, as the companies that produced these French beans were state-owned and cared relatively little about prices and profitability, their prices were significantly lower and this despite the import duties that it had to pay to get into the European market -- in contrast with most African exporters which are exempt from import duties under the EBA agreements or pay reduced import duties under the EU-ACP Lomé agreements. However, most of these Chinese firms have recently been privatized which led to a price surge. Second,
8
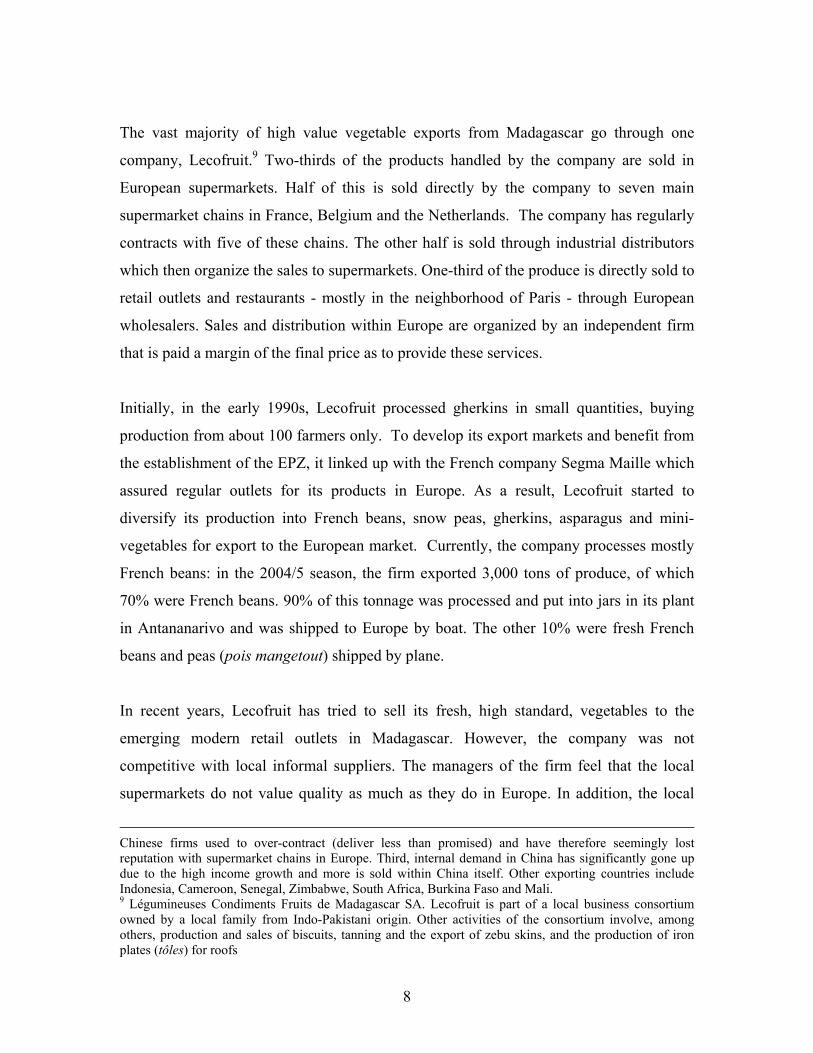
The vast majority of high value vegetable exports from Madagascar go through one
company, Lecofruit.9 Two-thirds of the products handled by the company are sold in
European supermarkets. Half of this is sold directly by the company to seven main
supermarket chains in France, Belgium and the Netherlands. The company has regularly
contracts with five of these chains. The other half is sold through industrial distributors
which then organize the sales to supermarkets. One-third of the produce is directly sold to
retail outlets and restaurants - mostly in the neighborhood of Paris - through European
wholesalers. Sales and distribution within Europe are organized by an independent firm
that is paid a margin of the final price as to provide these services.
Initially, in the early 1990s, Lecofruit processed gherkins in small quantities, buying
production from about 100 farmers only. To develop its export markets and benefit from
the establishment of the EPZ, it linked up with the French company Segma Maille which
assured regular outlets for its products in Europe. As a result, Lecofruit started to
diversify its production into French beans, snow peas, gherkins, asparagus and mini-
vegetables for export to the European market. Currently, the company processes mostly
French beans: in the 2004/5 season, the firm exported 3,000 tons of produce, of which
70% were French beans. 90% of this tonnage was processed and put into jars in its plant
in Antananarivo and was shipped to Europe by boat. The other 10% were fresh French
beans and peas (pois mangetout) shipped by plane.
In recent years, Lecofruit has tried to sell its fresh, high standard, vegetables to the
emerging modern retail outlets in Madagascar. However, the company was not
competitive with local informal suppliers. The managers of the firm feel that the local
supermarkets do not value quality as much as they do in Europe. In addition, the local
Chinese firms used to over-contract (deliver less than promised) and have therefore seemingly lost reputation with supermarket chains in Europe. Third, internal demand in China has significantly gone up due to the high income growth and more is sold within China itself. Other exporting countries include Indonesia, Cameroon, Senegal, Zimbabwe, South Africa, Burkina Faso and Mali. 9 Légumineuses Condiments Fruits de Madagascar SA. Lecofruit is part of a local business consortium owned by a local family from Indo-Pakistani origin. Other activities of the consortium involve, among others, production and sales of biscuits, tanning and the export of zebu skins, and the production of iron plates (tôles) for roofs

9
supermarkets were hesitant to engage in contracts which the firm needs for their
planning. As a result, the firm has for the moment abandoned the modern local retail
market, and it does thus not fill the 5% quota for the local market that it would be
allowed to use.10
These findings seem to contrast with other studies which argue that the emerging modern
supermarket sector has difficulties finding local supplies which fulfill their high standards
(Weatherspoon and Reardon, 2003). In Madagascar, the high standards suppliers find the
modern retail chains not (yet ?) interested in their products.
Production
Lecofruit itself buys vegetables from more than 9,000 small farmers based on contracts.
The total household area cultivated by contracted farmers is a little below 1 hectare on
average in the survey (Table 1), about the national average farm size in Madagascar
(Minten et al., 2003). One-third of the total household area is in the more valuable
lowland used for rice cultivation. On average, households own 3 rice plots of which 1.3
lowland plots are under contract with the firm while 1.7 lowland plots are not under
contract.
The contracting farm households in the survey have on average six members (Table 1).
Half of the members are less than 15 years old. 7% of the households are female-headed.
The average age of the household head is 37 years. The households that have contracts
with the firm are considerably higher educated than the average Malagasy household:
64% of them had finished primary schools, and only 1% of them did not do any studies at
all. This compares to almost half of the national population that is analphabet
(Razafindravonona et al., 2001).11 27% of the contractors are member of a farmers’
10 Under the EPZ rules, firms are allowed to sell a maximum of 5% of their production to local outlets. 11 However, analysis of national census data of 1993 of the fivondronana where the contracting farmers are located indicates that ‘only’ 39% of the people did not finish primary school, similar to the numbers of our survey. This illustrates the long-standing well-known bias in education investments towards the Highlands.
10
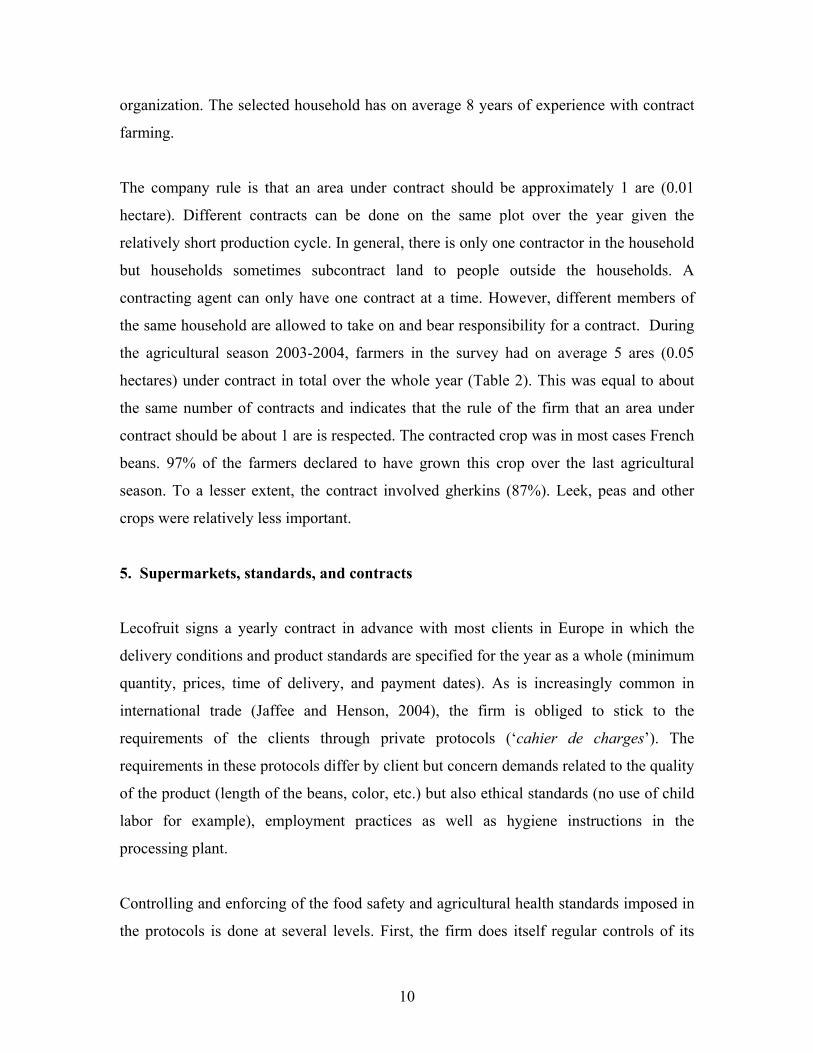
organization. The selected household has on average 8 years of experience with contract
farming.
The company rule is that an area under contract should be approximately 1 are (0.01
hectare). Different contracts can be done on the same plot over the year given the
relatively short production cycle. In general, there is only one contractor in the household
but households sometimes subcontract land to people outside the households. A
contracting agent can only have one contract at a time. However, different members of
the same household are allowed to take on and bear responsibility for a contract. During
the agricultural season 2003-2004, farmers in the survey had on average 5 ares (0.05
hectares) under contract in total over the whole year (Table 2). This was equal to about
the same number of contracts and indicates that the rule of the firm that an area under
contract should be about 1 are is respected. The contracted crop was in most cases French
beans. 97% of the farmers declared to have grown this crop over the last agricultural
season. To a lesser extent, the contract involved gherkins (87%). Leek, peas and other
crops were relatively less important.
5. Supermarkets, standards, and contracts
Lecofruit signs a yearly contract in advance with most clients in Europe in which the
delivery conditions and product standards are specified for the year as a whole (minimum
quantity, prices, time of delivery, and payment dates). As is increasingly common in
international trade (Jaffee and Henson, 2004), the firm is obliged to stick to the
requirements of the clients through private protocols (‘cahier de charges’). The
requirements in these protocols differ by client but concern demands related to the quality
of the product (length of the beans, color, etc.) but also ethical standards (no use of child
labor for example), employment practices as well as hygiene instructions in the
processing plant.
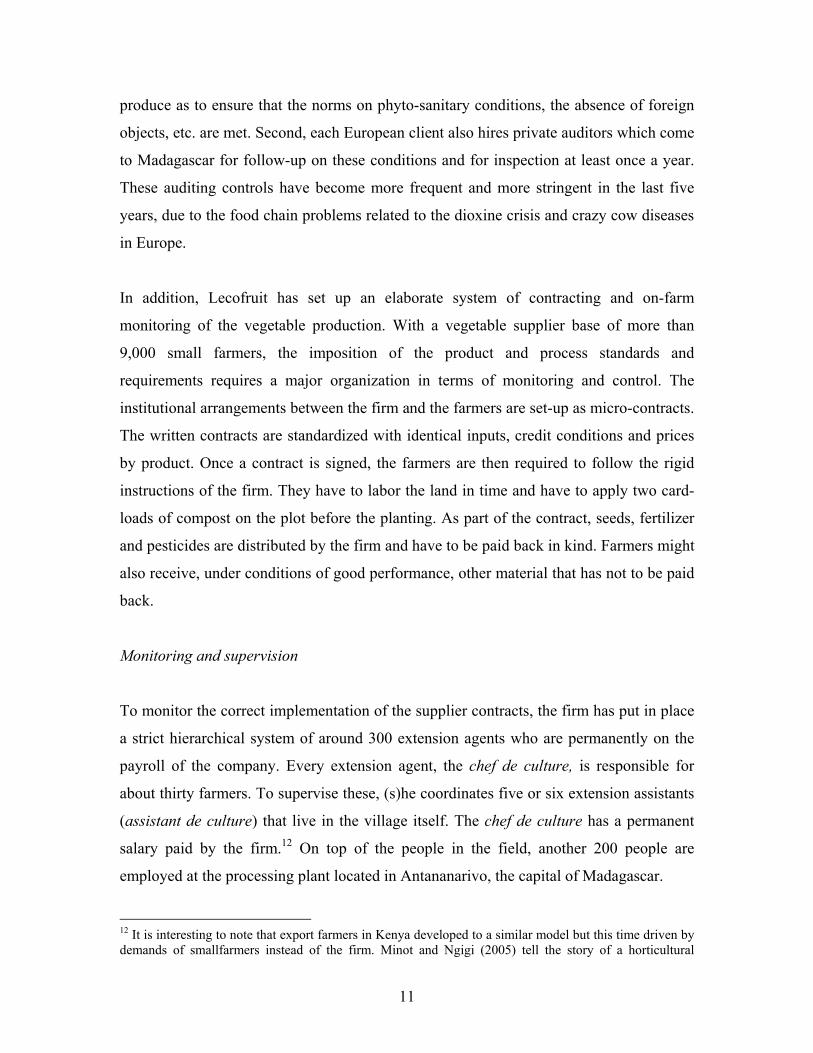
Controlling and enforcing of the food safety and agricultural health standards imposed in
the protocols is done at several levels. First, the firm does itself regular controls of its
11
produce as to ensure that the norms on phyto-sanitary conditions, the absence of foreign
objects, etc. are met. Second, each European client also hires private auditors which come
to Madagascar for follow-up on these conditions and for inspection at least once a year.
These auditing controls have become more frequent and more stringent in the last five
years, due to the food chain problems related to the dioxine crisis and crazy cow diseases
in Europe.
In addition, Lecofruit has set up an elaborate system of contracting and on-farm
monitoring of the vegetable production. With a vegetable supplier base of more than
9,000 small farmers, the imposition of the product and process standards and
requirements requires a major organization in terms of monitoring and control. The
institutional arrangements between the firm and the farmers are set-up as micro-contracts.
The written contracts are standardized with identical inputs, credit conditions and prices
by product. Once a contract is signed, the farmers are then required to follow the rigid
instructions of the firm. They have to labor the land in time and have to apply two card-
loads of compost on the plot before the planting. As part of the contract, seeds, fertilizer
and pesticides are distributed by the firm and have to be paid back in kind. Farmers might
also receive, under conditions of good performance, other material that has not to be paid
back.
Monitoring and supervision
To monitor the correct implementation of the supplier contracts, the firm has put in place
a strict hierarchical system of around 300 extension agents who are permanently on the
payroll of the company. Every extension agent, the chef de culture, is responsible for
about thirty farmers. To supervise these, (s)he coordinates five or six extension assistants
(assistant de culture) that live in the village itself. The chef de culture has a permanent
salary paid by the firm.12 On top of the people in the field, another 200 people are
employed at the processing plant located in Antananarivo, the capital of Madagascar.
12 It is interesting to note that export farmers in Kenya developed to a similar model but this time driven by demands of smallfarmers instead of the firm. Minot and Ngigi (2005) tell the story of a horticultural

12
During the cultivation period of the vegetables under contract, the contractor is visited on
average more than once (1.3 times) a week (Table 3). This intensive monitoring is to
ensure correct production management as well as to avoid ‘side-selling’. The intensity of
the monitoring is illustrated by statements of the farmers: 99% of the farmers say that the
firm knows the exact location of the plot; 92% of the farmers say that the firm will even
know approximately or exactly the number of plants that are on the plot.
For some crucial aspects of the vegetable production process, representatives of the
company will even intervene in the production management to ensure it is rightly done.
The latter is particularly important for pesticide use. For example, to export into Europe,
the produce has to fulfill the norms on MRL (Maximum Residue Levels) of the country
that it is exported to. Given that these requirements are not harmonized for all products
across European countries, the firm adheres to the most severe one.13 The MRL norms
have become stricter over time – leading to a reduction in the active ingredients in
pesticides - and Lecofruit is continuously adjusting the packages that are distributed at
the farmer level. Given the implication for potential rejection as well as for its reputation,
the pesticide application has to be monitored very closely. Only the recommended doses
can be applied and the timing of pesticide application matters since it cannot be done in
the period just before the harvest.14 In the survey, 34% of the farmers report that
representatives of the firm will themselves put the pesticides on the crops to ensure that it
is rightly done.
To measure the effect of the supervision on the management of the production process,
we estimated how labor and compost use by suppliers were affected by supervision in the
farmers’ group in Kenya that were formed in part by a desire to eliminate brokers and to deal directly with exporters. The group employed itself a field supervisor charged with the responsibility of supervising and monitoring production practices to ensure that the farmer members follow the prescribed methods. The supervisor was trained by the exporter. 13 The European Union pesticide legislation is under review. The setting of MRL is based on the work done by Codex Alimentarius, an international standards-setting group based in Rome. 14 While products are sterilized, the firm recently started requiring farmers to wash their hands before starting to harvest the products. They also gave recently gloves to the 1,500 farmers (assistant de culture) that treat the harvest of all the farmers in the field.

13
production of French beans. A simple production function estimation shows that labor,
surface and compost all matter significantly for output (Table 4).15 To evaluate the
importance of different determinants, we then run a reduced input demand function on
the use of labor and compost (Table 4). First, labor demand is not affected by supervision
and control. However, a major significant determinant is seasonality. The later the
contract starts in the calendar year, the lower labor allocation. As at the end of the year
the rainy season starts, competing labor demands for ricefield preparation increase and
households choose to allocate less to contract farming.16 Second, compost application,
which is crucial for the production process, is significantly affected by the supervision
that is done by representatives of the firm: the more supervision, the higher the quantities
of compost used. The length of the experience with the firm is not significant.
Supervision thus matters to assure that the right procedures are followed, even for
farmers that have worked for a longer period for the firm.17
The firm will only pay for the products that fulfill the quality norms on size and length
set by the firm. This control is done by the assistants de culture in the field as well as in
the plant itself. The produce that is not bought by the firm is sold on the local market,
used for own consumption or given as feed to animals. The prices that the firm offers are
most often higher than those in local markets. 61% of the farmers believe that the
contract price is on average lower on the local market. 21% and 13% of the farmers
thinks that it is higher or the same respectively. When comparing the actual price offered
by the firm and the price fetched on the market for the rejected produce at the time of the
survey, the market price was found to be significantly lower.18
15 Given that the seeds, pesticides and fertilizer are given in standardized forms by the firm, there was not enough variation as to include them in the regression. 16 Managers of the firm estimates that yields drop by 30% during the rainy season. However, this is also partly caused by the higher incidence of diseases during that period. 17 Moser and Barrett (2001) also found that availability of extension agents was an important determinant in the success of the adoption of a new rice cultivation method, SRI, in the same areas as we studied. 18 Prices for French beans that were offered by the firm in the 2003-2004 agricultural season were 310 Ariary/kg, i.e. 0.25$/kg. This is significantly lower than, for example, in Kenya where Minot and Ngigi (2004) report a price of 45 Ksh/kg, i.e. 0.60$/kg in 2000. However, the firm in Madagascar faces higher transportation costs to the European markets. Green beans are sold in wholesale markets in Europe at about 2.5 Euro per kg for fine beans (3.5 Euro per kg for the extra-fine beans).

14
Supplier assistance packages and contract enforcement
As in other modern supply chains where the processor or trader provides inputs to farms
which are constrained in their access to these essential inputs (Swinnen, 2004), Lecofruit
distributes seeds, fertilizer and pesticides as part of the contract. The value of these pre-
financed inputs has to be paid back in kind. The average input value per contract is
estimated at about 10,000 Ariary or 5 US dollar (Table 2). This compares to an average
value of produce sold under one contract of 15 US dollar. The first harvests that come in
are used for re-imbursements of these inputs. The firm only starts to pay the peasants
mostly from the 4th week of harvest on.
The firm has high pay-back rates and during the year of the survey, about 98% of the
farmers expected to pay the full credit back to the firm (Table 2).19 When asked what
would happen if they would be unable to pay back the credit, all of the farmers believe
that there will be no judicial implications. However, there will be pressure from the chef
de zone to pay. Social pressure is less used and 38% of the farmers believe that, even if
they would not be able to pay back, they would still be able to do contracts with the firm
afterwards.
While there is a written agreement, these contracts are seldom legally enforceable in
practice, as often the case in other developing and transition countries (Kirsten and
Sartorius, 2002; Gow et al., 2000). The poorly developed legal institutions, the small
amount involved, and potential souring relationships between agri-business and farming
communities makes that the only threat at the disposal of the firm is to discontinue the
contract with the farmers. To be able to follow up on farmers on their performance and
pay habits, the firm keeps a meticulous database of all the farmers that it works and has
worked with.
19 This co-incides with the declaration of the manager who said that every year, only 0.5 to 1% of the peasants do not manage to reimburse the inputs advanced by the firm.

15
Another enforcement problem is avoiding ‘side-selling’ – a problem which is a general
concern in modern supply chains with contracts (Gow and Swinnen, 2001). To assess the
extent of this problem, we estimated the determinants of the quantity sold to the firm as a
function of the area under contract as well as other characteristics of the firm (Table 5).
We find few significant determinants except for areas. The quantity sold is as expected a
significant function of the contracted area. The coefficient-elasticity is not significant
different from one. Interestingly, the area of French beans not under contract is also a
significant determinant of the quantity sold to the firm (Twenty percent of the farmers
reported to have planted French beans on top of the contracted area).20 Given the fact that
prices offered by the company were generally considerably above local market prices
(see previous section), side-selling problems are apparently much less a problem than in
environments where this is not the case. In fact, quite the opposite happens. As the prices
offered during the years of the survey by Lecofruit were highly profitable, it seems that
some farmers used produce of other plots and sold it to the firm.21
6. The impact on technology adoption and land use
One of the benefits of contracting with Lecofruit is that it teaches farmers how to make
compost. The compost consists of a mixture of manure and vegetable matter. Its main
benefit on the fields is in maintaining the soil structure, to provide nitrogen and other
minerals that promote healthy crop growth and in providing the ability of the soil to
retain moisture (Jacoby et al., 2004). The use of compost is long-lasting and can have an
effect on the fertility of the soil for some years and might therefore be the cause of
spillover effects.22 The compost that the farmer makes is then combined with chemical
fertilizer.23
20 As confirmed by anecdotic evidence told by enumerators. 21 The opposite was seen a year later when inflation was high and contract prices became suddenly significantly lower than market prices. The firm had to adjust their prices as it noticed a significant decrease in the quantity supplied. 22 Some of the interviewed farmers described it as ‘better than pig manure’. 23 The farmers estimate the time required to produce a card-load of compost at about 8 hours.
16
Farmers were asked to what extent the requirements on the making of compost and the
use of chemical fertilizer has changed the way they are farming and would be farming in
the future (Table 6). The majority of the farmers state that they are using compost on
their plots and that they did not do so before the contract with the firm started. They also
report that they are currently using compost on other plots than those plots that are under
contract.24 In the case that the firm would stop the contract, they report they would
continue to produce compost and apply it to their fields.25
It was then further asked to what extent the contract with the processing firm has changed
their agricultural practices (Table 6). 93% of the farmers report that they have changed
the way they cultivate their other off-season crops. More than 90% of the farmers report
to use compost and inputs on these plots. About 70% of the farmers state that they do also
more weeding. It thus seems that the contracts with the firm have led to significant
changes in the way farmers do off-season crops and it seems to have a lasting impact.
However, when asked about changes in the cultivation of rice, only 6% of the farmers
report to have changed the way they cultivate rice since the start of the contract. This is
not surprising given the stark differences in the cultivation of rice and off-season crops.
Unconditional land productivity differences for rice between the two types of plots, one
without a contract in the off-season and one with a contract, were calculated. The results
indicate that rice productivity is 64% higher on the plots with a contract compared to
those plots without a contract and off-season crops: yields increase from 3,6 to 6,0 ton
per hectare.26 There are thus significant spillovers from contract farming on the
production of rice, Madagascar’s major staple, probably due to the organic and chemical
fertilizer use in the off-season.
24 We tested this statement for the one riceplot which was not under contract and on which we asked detailed information. Compost was used on a high 60% of the plots where off-season crops were grown. 25 While the teaching of the use of compost might seem as a small contribution, this is a clear illustration of technology improvement in rural areas in a country where the state never succeeded in providing decent agricultural extension services and where most of the agriculture is still done as it was centuries ago. 26 A t-test shows that these differences are largely significant. Regressions were then further run as to explain to what extent differences in rice productivity were driven by changes in labor or capital allocations to the contracted field. However, no statistically significant differences were found and most of the productivity differences are thus explained by spillover effects on rice productivity of the use of off-season crops on the ricefields (for more details, see Minten et al., 2005).

17
7. The impact on welfare
Although the areas that are cultivated are relatively small, the income that contract
farmers get out of the contract is relatively important. For the average household, the
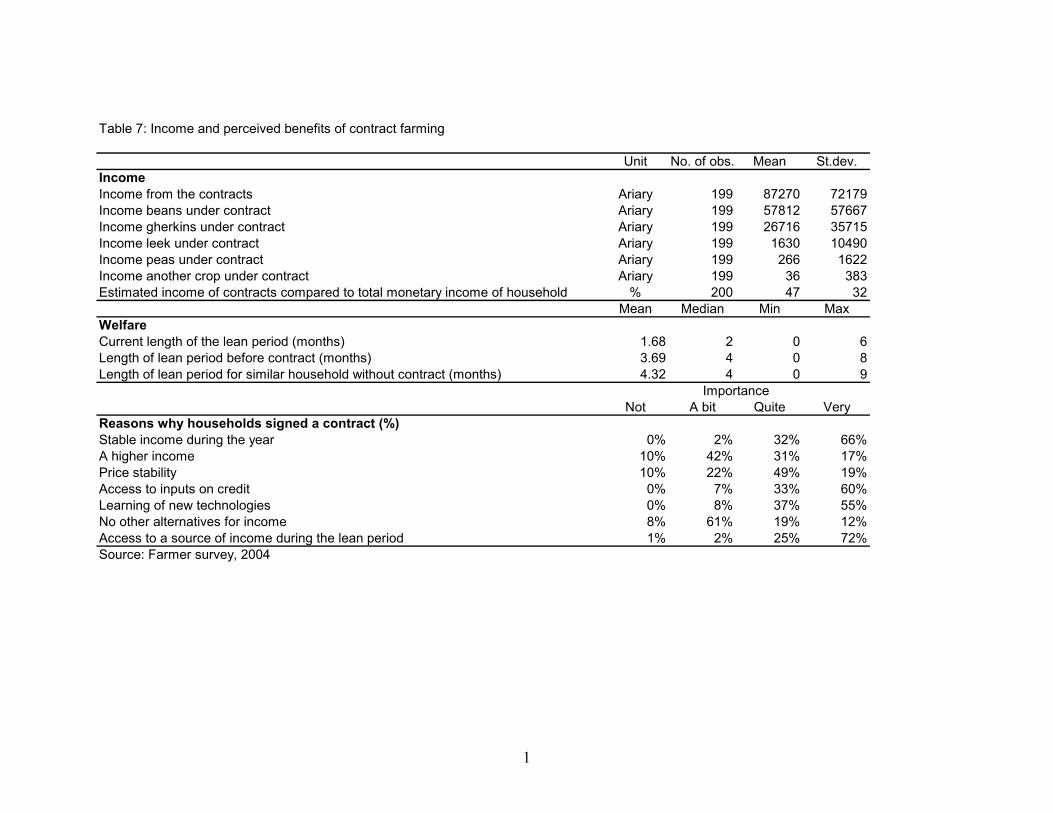
contract income represents almost 50% of their monetary income (Table 7). As expected,
French beans are the most important, representing 66% of the total contract income. The
total average contract income that the contractors earned during the season 2003-2004
amounted to about 87,000 Ariary (or 45 US dollars).27
Contract farmers perceive the contracts to be good for welfare, especially for seasonality
smoothing. High seasonality in production and consumption is a major characteristic in
rural areas in Madagascar (Minten and Zeller, 2000). As a significant number of
households are constrained to reduce consumption during the lean period, it is
characterized by higher incidences of disease and mortality (Waltisberger et al., 1998).
The length of this lean period varies between regions and by household but is estimated
in the province of Antananarivo, where the contract farmers are situated, to be around 4,4
months (Minten et al., 2003). The estimated length of the lean period of the contract
farmers is 1,7 months. The farmers were also asked about the length of the lean period
before they started contracts with the firm and to compare the lean period to households
similar to theirs but who have no contract. In both cases, the household believes it is
better off as lean periods are estimated to be respectively 3,7 and 4,3 months.
As to estimate the effect of different determinants, and especially the impact of access to
contracts, on the length of the lean period, a simple regression was run on the level and
the difference between the length of the lean period before the contract and now (Table
8). The length of the lean period is significantly and negatively determined by the land
owned and the share of the more valuable ricelands in total land area. Large households
27 While this might be low at first sight, one must remember that average agricultural household income (including auto-consumption) in Madagascar was estimated in 2001 at 315US dollars (Randrianarison, 2003). Given that the largest part of agricultural production is auto-consumed, this thus makes up an important part of monetary income, as stated by these farmers.
18
have longer lean periods. This is consistent with other poverty analysis in Madagascar
(Razafindravonona et al., 2001; Dorosh et al., 2003). People that have more contracts
with the firm have significantly shorter lean periods. To (imperfectly) control for
endogeneity, we look at changes over time in length of the lean period as dependent
variable and run the same specification as well as a short form. The results show that a
doubling of the number of micro-contracts reduces the lean period by half a month.
The importance of the reduction in risk and variability is also reflected in the reasons
given by the farmers themselves on why they signed a contact with the firm (Table 7).
Farmers were presented with different reasons why they could do so and had to rank
them from 1 to 4, reflecting a gradual change from ‘not important’ to ‘very important’.
About three quarters stated that access to a source of income during the lean period was
for them a major reason for the signing of the contract. 66% of the farmers found it very
important that they got a stable income during the year. Other major reasons that were
mentioned were access to inputs on credit and the learning of new technologies. A higher
income was mentioned by a relatively low number of contractors.
As to further get at the benefits of the contracts with the firm, a willingness-to-accept
question was asked on the level of the price gap between the local market and the
contract at which the contract farmers would refuse the contract and sell on the local
market. In a first scenario, farmers were asked if they would accept the contract if the
price of the contract was lower than the price on the market. In a second scenario, they
were asked if they would refuse the contract if the price on the market would be higher.
Before going to the valuation part, farmers were asked about the average price level on
the local markets compared to the contract last year. In line with the environmental
economics literature, the recommended Dichotomous Choice (DC) format question was
used (Arrow et al., 1993; Mitchell and Carson, 1989).28 The respondent was offered the
28 The benefits and disadvantages of this method are well studied. The advantages of this method are: 1/ It reveals more accurate values than in the open-ended format; 2/ It simplifies the task of the respondent; 3/ It resembles better the market place and more truthful answers are therefore expected. The disadvantages are the need for a large sample, the need for good framing of the question to avoid yea-saying and starting point bias and assumptions about the error term in regression analysis that might affect the parameter estimates (Arrow et al., 1993; Mitchell and Carson, 1989).
19
opportunity to accept the bid at one of 5 randomly assigned prices. Uncertainty was
included in both cases in the refusal category. To further reduce the effect of yea-saying,
a typical problem with this type of methodology, the respondents were asked how sure
they were of their answer. If they were not very sure, they were also assigned to the
refusal category.
The results show little price elasticity and show thus high loyalty of the producers
towards the firm (Figure 1). Even if prices set by the firm would be half the prices that
are observed on the local market, almost half of the contract farmers would still stick to
the contract of the firm. This peculiar behavior seems to be explained by high transaction
costs in local agricultural marketing (Fafchamps et al., forthcoming), the spillover effects
and probably habit formation. Price elasticities are asymmetrical and relatively larger if
the firm would decrease prices than in the case that market prices would increase. This is
consistent with the findings of Tversky and Kahneman (1981) and Thaler (1980) who
find that people attach less importance to the gain than to the loss.
In the econometric analysis, the probability that a household said ‘yes’ to the bid is
estimated as a probit model.29 With Y = 1 indicating yes, and Y = 0 indicating no, the
probability of saying yes is estimated as:
P(Y=1) = Φ(x’b)
where Φ is the standard normal distribution, x is a vector of explanatory variables and b
are parameters to be estimated. The measurement and interpretation of the variables used
as explanatory variables is straightforward. The results presented in Table 9 show, as
could be expected from the graph, that the bid level comes out only significantly in the
case where the firm decreases the price. The bid coefficient is insignificant in the case
that prices raise on the local markets.
The education coefficient is significant in both specifications. An extra year of education
would reduce the probability of bid acceptance by 3%. Better educated households might
29 The question on suitability of logit or probit models is unresolved. However, in most applications, it seems not to make much difference (Greene, p. 815).

20
be better aware of business opportunities and seem to move quicker in and out of
contracts when they are profitable to them. The household size is also an important
determinant in the acceptance of the bid. One more member in the household increases
the likelihood of the acceptance of the bid by 5%. Households that are characterized by
the longer lean periods before the contracts, are also more likely to accept the contract.
The poorest households might be more risk averse and dread a long lean period that they
know for sure that the contract will reduce. The number of years that the farmer has
worked with the firm and the number of plots under contract do not influence the
likelihood of the acceptance of the contract. These farmers will look equally hard at the
conditions that the firm offers as the other farmers.
Conclusions and policy implications
Global retail companies (“supermarkets”) have an increasing influence on developing
countries, through foreign investments and/or through the imposition of their private
standards. The impact on developing countries and poverty is often assessed as negative.
In this paper we show the opposite, based on an analysis of primary data collected to
measure the impact of supermarkets on small contract farmers in Madagascar, one of the
poorest countries in the world. Almost 10,000 farmers in the Highlands of Madagascar
produce vegetables for supermarkets in Europe. In this global supply chain, small
farmers’ micro-contracts are combined with extensive farm assistance and supervision
programs to fulfill complex quality requirements and phyto-sanitary standards of
supermarkets. Small farmers that participate in these contracts have higher welfare, more
income stability and shorter lean periods. We also find significant effects on improved
technology adoption, better resource management and spillovers on the productivity of
the staple crop rice.
These findings raise several issues for further analysis and have important implications.
An important issue is whether the benefits of this model can be extended to allow a larger
share of poor farmers in Madagascar to benefit. It seems that the major constraints are the
high transport and transaction costs in Madagascar. Transaction costs are even higher
21
than in competing developing countries, seemingly contributing to lower producer prices
than in competing countries.
A first constraint for expansion for this type of activity in Madagascar is the bad road
infrastructure. The firm thus only has contracts with farmers in a 120 km radius around
the capital Antananarivo where its processing plant and export units are situated but the
recent rural road improvement – the priority of the government in its PRSP30 - has
allowed the firm to expand the number of contracting farmers by almost 1,000 in just one
year. However, as to allow the trucks to pass, the firm itself is obliged to continuously
organize road maintenance.
The second constraint is low human capital, causing high training costs and long duration
required for training of the assistants de culture which organize and supervise the
contracting farmers in the field. It is estimated that it takes on average two to three years
until the firm will be able to give him/her full responsibility in the field. This slows down
growth and expansion.31
Third, transactions costs are large because of individual contracts. If farmers would be
able to constitute farmers groups, internalize the verification system and provide as such
economies of scale, more firms might be attracted to invest in Madagascar. This type of
group has shown to be successful in other countries (Winters et al., 2005; Kirsten and
Sartorius, 2002). However, while there are significant interventions of donors and the
government as to get such groups going, they have overall a weak track record in
Madagascar, especially related to export agriculture, given the difficulty to overcome
moral hazard and asymmetric information problems.
30 Poverty Reduction Strategy Paper 31 The lack of skills is also becoming an issue in urban based EPZ firms. Glick et al. (2003) found that the average year of schooling of Antananarivo’s EPZ workers decreased from 9.4 in 1995 to 7.8 in 2001.This suggests a possible demand shortage of the semi-skilled laborers needed for the enterprises working on the EPZs. These findings are corroborated with anecdotic evidence and findings from other studies (Cadot and Nasir, 2001).

22
Another important implication from the study is the importance of trade agreements and
export zones. The results indicate that the tax incentives make a difference for enterprise
development in the poorest countries. The preferential access in European and American
markets are important determinants for firms to do activities in countries such as
Madagascar. Given the temporary nature of these interventions (AGOA) as well as the
broadening of these measures (WTO), it remains however to be seen if countries such as
Madagascar will still be able to continue to compete in these markets in the near future.
Finally, the study suggests that effects on farmers from investments by global retailers in
supermarkets in Madagascar have not materialized yet. The expectation was that this
would create a domestic demand for high quality and high value vegetable production.
However, local supermarkets seem to purchase mostly from local, informal, suppliers
rather than from companies selling high standard vegetables. Local supermarkets do not
value quality and standards sufficiently and are hesitant to engage in contracts which are
needed for producing such standards. These results seem to contrast with other studies
which argue that the emerging modern supermarket sector has difficulties finding local
supplies which fulfill their high standards as we find that the high standards suppliers find
the modern retail chains in Madagascar not (yet ?) interested in their products.
References
Arrow, K., Solow, R., Potney, P.R., Leamer, E.E., Radner, R, Schuman, H. (1993), Report of the NOAA Panel on contingent valuation, Federal Register, 58(10), pp. 4601-4614 Bhagwati, J. (2004), In Defense of Globalization, Oxford University Press Boccardo, J., Cotton, L., Habyarimana, J., Rossignol, I., Shah, M.K. (2005), Preliminary results: Madagascar Investment Climate Assessment, World Bank Cadot, O., Nasir, J. (2001), Incentives and Obstacles to Growth: Lessons from Manufacturing Case Studies in Madagascar, Regional Program in Enterprise Development No. 117, World Bank Delgado, C. (1999), Sources of growth in smallholder agriculture in sub-Saharan Africa: the role of vertical integration of smallholders with processors and marketers of high value-added items, Agrekon, 38, 165-189

23
Diop, N., Jaffee, S.M. (2005), Fruits and Vegetables: Global Trade and Competition in Fresh and Processed Product Markets, in (eds), Aksoy, M.A, Beghin, J.C., Global Agricultural Trade and Developing Countries, World Bank, pp. 237-257 D’Haese, M., Van Huylenbroeck, G. (2005), The rise of supermarkets and changing expenditure patterns of poor rural households: Case study in the Transkei area, South Africa, Food Policy, 30, 97-113 Dolan, C., Humphrey, J. (2000), Governance and Trade in Fresh Vegetables: The Impact of UK Supermarkets on the African Horticulture Industry, Journal of Development Studies, 37(2), pp. 147-176
Dorosh, P., S. Haggblade, C. Lungren, T. Razafimanantena and Z. Randriamiarana (2003), Moteurs Economiques pour la Réduction de la Pauvreté à Madagascar, Antananarivo : INSTAT
Fafchamps, M., Gabre-Madhin, E., Minten, B., Increasing returns and market efficiency in agricultural trade, Journal of Development Economics, forthcoming
Fraslin, J.H. (2002), Quel avenir pour les paysans de Madagascar ?, Afrique contemporaine, No. 202-203, pp. 93-110
Gibbon, P. (2003), Value-Chain Governance, Public Regulation and Entry Barriers in the Global Fresh Fruit and Vegetable Chain in the EU, Development Policy Review, Vol. 21, No. 5-6, pp. 615-625
Glick, P., Roubaud, F., Randrianasolo, J.B. (2004), The Urban Labor Market in Madagascar through Growth and Crisis, 1993-2002, Ilo program, INSTAT/Cornell University, Antananarivo
Gow, H., Streeter, D. and J. Swinnen, 2000, "How Private Contract Enforcement Mechanisms Can Succeed Where Public Institutions Fail: The Case of Juhosucor A.S." Agricultural Economics, 23(3): 253-265.
Gow, H. and J. Swinnen, 2001, “Private Enforcement Capital and Contract Enforcement in Transition Countries” American Journal of Agricultural Economics, 83(3): 686-690
Greene, W.H., Econometric Analysis, Prentice Hall, New Jersey, 2000
Humphrey, J., McCulloch, N., Ota, M. (2004), The Impact of European Market Changes on Employment in the Kenyan Horticulture Sector, Journal of International Development, vol. 16(1), pp. 63-80
Instat (2005), Enquête Démographique et de Santé: 2003-2004, Antananarivo
Jacoby, H.G., Mancuri, G. (2004), The (in)efficiency of share tenancy revisited: Evidence from Pakistan, mimeo. Jaffee, S.M., Henson, S. (2004), Standards and Agro-Food Exports from Developing Countries: Rebalancing the Debate, World Bank Policy Research Working Paper 3348

24
Key, N., Runsten, D. (1999), Contract farming, smallholders, and rural development in Latin America: the organization of agroprocessing firms and the scale of outgrower production, World Development, 27(2), pp. 381-401
Kherralah, M. (2000), Access of smallholder farmers to the fruits and vegetables market in Kenya, IFPRI, mimeo
Kirsten, J., Sartorius, K. (2002), Linking agribusiness and small-scale farmers in developing countries: is there a new role for contract farming?, Development Southern Africa, Vol. 19, No. 4, pp. 503-529
Minot, N., Ngigi, M. (2004), Are Horticultural Exports a Replicable Success Story? Evidence from Kenya and Côte d’Ivoire, EPTD/MTID discussion paper, International Food Policy Research Institute
Minten, B., Barrett, C. (2005), Agricultural Technology, Productivity, Poverty and Food Security in Madagascar, Cornell University/World Bank, mimeo Minten, B. and M. Zeller (2000), Beyond Market Liberalization: Welfare, Income Generation and Environmental Sustainability in Rural Madagascar, Vermont: Ashgate. Minten, B., L. Randrianarison and C. Randrianarisoa (2003), Agriculture, Pauvreté rurale et politiques économiques à Madagascar, Antananarivo: Cornell University/FOFIFA/INSTAT. Minten, B., Randrianarison, L., Swinnen, J. (2005), Spillovers from globalization on land use: Evidence from Madagascar, mimeo Mitchell, R.C., Carson, R.T. (1989), Using surveys to value public goods: the Contingent Valuation Method, Resources for the Future, Washington DC
Moser, C. and C.B. Barrett (2003), “The Disappointing Adoption Dynamics of a Yield-increasing, Low External Input Technology: the Case of SRI in Madagascar,” Agricultural Systems 76(3): 1085-1100. Nicita, A. and S. Razzaz (2003).”Who Benefits and How Much? How Gender Affects Welfare Impacts of a Booming Textile Industry”(WPS# 3029) World Bank. Randrianarison, L. (2003), Les revenus extra-agricoles, in Minten, B., Randrianarisoa, C., Randrianarison, L., Agriculture, Pauvreté Rurale et Politiques Economiques à Madagascar, Cornell University/FOFIFA/INSTAT, Antananarivo Razafindrakoto, M., Roubaud, F. (2002), Les enterprises franches à Madagascar: Atouts et contraintes d’une insertion réussie, Afrique contemporaine, No. 202-203, pp. 147-163 Razafindravonona, J., D. Stifel and S. Paternostro (2001), Changes in Poverty in Madagascar: 1993-1999, World Bank Africa Region Working Paper Series, No. 19. Washington, DC.

25
Reardon, T., Barrett, C.B. (2000), Agroindustrialisation, globalization and international development: an overview of issues, patterns and determinants, Agricultural Economics, 23:195-205 Reardon, T., Berdegué, J. (2002), The Rapid Rise of Supermarkets in Latin America: Challenges and Opportunities for Development, Development Policy Review, Vol. 20, No. 4, pp.371-88. Reardon, T., Timmer, C.P., Barrett, C., Berdegué, J. (2003), The Rise of Supermarkets in Africa, Asia, and Latin America, American Journal Agricultural Economics, Vol. 85, No. 5, pp. 1140-1146 Reardon and Swinnen, 2004,…
Stifel, D., Minten, B., Dorosh, P. (2003), Transactions Costs and Agricultural Productivity: Implications of Isolation for Rural Poverty in Madagascar, MSSD, Discussion Paper
Swinnen, 2004
Thaler, R. (1980), Towards a Positive Theory of Consumer Choice, Journal of Economic Behavior and Organization Tversky, A., Kahneman, D. (1981), The framing of decisions and the psychology of choice, Science, 211: 453-458 Transparency International (2002), Etude Nationale Sur L’Intégrité; Enquête Auprès Du Secteur Privé Waltisberger, D., Cantrelle, P., Ralijaona, O. (1998), La mortalité à Antananarivo de 1984 à 1995, Document et Manuel du CEPED No. 7, Paris Weatherspoon, D., Cacho, J., Christy, R. (2001), Linking globalization, economic growth and poverty: impacts of agribusiness strategies on sub-Saharan Africa, American Journal of Agricultural Economics, 83(3), pp. 722-729 Winters, P., Simmons, P., Patrick, I. (2005), Evaluation of a Hybrid Seed Contract between Smallholders and a Multinational Company in East Java, Indonesia, the Journal of Development Studies, Vol. 41, No. 1, pp. 62-89 World Bank (2003), Review of agricultural and environmental sector World Bank (2004), Madagascar: Development Policy Review

26
Figure 1: Percentage of farmers that will accept the contract with different gaps between market price and contract price
0
20
40
60
80
100
120
0 40 80 120 160 200
Ariary/kg
% o
f far
mer
s th
at a
ccep
t the
con
tract
Drop of price by the firmIncrease of market price

27
Table 1: Farm and farmer's characteristics
Variable Unit No of obs. Mean St.dev. Min MaxHead of householdAge years 200 37.5 10.6 19 65Sex % male 200 93%Member of a farmer's organization % 200 27%Education% that did not finish primary school % 36%% that finished at most primary education % 34%% that studied more than primary education % 30%Composition householdnumber of males age <15 number 199 1.3 1.1 0 4number of males age between 15-64 number 199 1.3 1.1 0 4number of males age >64 number 196 0.0 0.2 0 2number of females age <15 number 199 1.4 1.2 0 6number of females age between 15-64 number 199 1.4 1.0 0 10number of females age >64 number 194 0.0 0.2 0 2Land areaTotal area cultivated are 196 96.2 296.1 4 4083Lowland area cultivated are 196 35.4 35.6 2 202Number of plotsplots of lowland owned number 200 3.1 1.4 0 10plots of baiboho owned number 200 3.4 1.3 1 10plots of upland owned number 200 1.4 0.6 1 4plots of lowland cultivated number 200 0.6 0.9 0 4plots of baiboho cultivated number 200 0.6 0.9 0 4plots of upland cultivated number 200 0.4 0.7 0 4total number of plots cultivated number 200 5.8 2.4 1 16Contractsplots of lowland with contract number 200 2.1 1.4 0 8plots of baiboho with contract number 200 2.2 1.4 0 8plots of upland with contract number 200 1.1 1.1 0 5total number of plots with contract number 200 2.9 1.4 1 11Members of the hh with contract number 200 1.1 0.4 1 4Members outside hh with contract number 200 0.4 1.0 0 10Number of years that farmers work with the firm number 199 8.2 4.1 0 15Proportion of the farmers where interruption of contract share 197 0.2Source: Farmer survey, 2004

28
Table 2: Characteristics of the contract
Unit No. of obs. Mean St.dev.Season 2003-2004Area under contract ares 199 5.41 2.74Number of contracts number 197 4.53 2.93Number of products cultivated under contract number 199 2.07 0.68Proportion of farmers…… that grew beans under contract share 199 0.97… that grew gherkins under contract share 199 0.86… that grew leek under contract share 199 0.17… that grew peas under contract share 199 0.05… that grew another crop under contract share 199 0.02Inputs - credit Value of chemical fertilizer/pesticides per contract Ariary 405 10115 1958Kgs of the product to be paid back for the credit kgs 406 31.1 6.1Other material obtained from the firm (not to be paid back) Ariary 174 7058 25558Proportion of farmers that will pay back the full credit this year share 200 98%Proportion of farmers that can find same quality seeds themselves share 200 57%In case you do not pay back avances… the firm will not work with me anymore % 200 38%… there will pressure from the chef de zone to pay % 200 99%… there will be social pressure to pay % 200 22%… there will be judicial implications % 200 0%Source: Farmer survey, 2004

29
Table 3: Control and supervision by the firm
Unit No. of obs. Mean St.dev.Proportion of farmers…… where firm makes the choice of the crop share 199 0.23… where the firm makes the choice of the area under contract share 199 0.36… where the firm makes the choice of plot share 199 0.06… where the firm makes the choice on the technique to be used share 199 0.99… where the firm controls if right technologies are used share 196 0.98… where the firm puts the pesticides on the product share 199 0.34… where firm knows number of plants under contract All % 121 60 About % 64 32 Not quite % 10 5 No % 4 2… where firm knows exact location of plots share 199 0.99Number of visits of an extension agent per week number 199 1.33 0.90… that is visited less than once a week share 199 0.30 0.46… that is visited once a week share 199 0.30 0.46… that is visited more than once a week share 199 0.41 0.49Source: Farmer survey, 2004

30
Table 4: Determinants of the quantities of French beans sold
Variables* Unit Coefficient t-value Coefficient t-valuearea of French beans under contract log(ares) 0.97 13.60 0.60 2.69area of French beans not under contract log(ares) 0.20 2.33 0.74 2.66age log(years) 0.01 0.05 -0.70 -1.10gender head of household 1=male 0.05 0.52 0.22 0.72education head of household log(years) 0.12 0.72 -0.39 -1.12household size number 0.03 1.31 0.05 0.76total area cultivated log(ares) -0.01 -0.23 0.08 0.41share of rice in area ratio -0.17 -0.69 -0.20 -0.29contracts with firm last year log(number) 0.03 0.41 -0.16 -0.50intercept 3.92 5.82 6.23 2.64Number of observations 194 194F 18.2 7.8Prob > F 0 0R-squared 0.65 0.28Root MSE 0.50 1.91*: village dummies included but not reportedRobust standard errorsSource: Authors' calculations based on farmer survey, 2004
Sales to the firm Sales on the local market

31
Table 5: Determinants of production of French beans and of labor and compost use on these plots
UnitVariable* Coefficient t-value Coefficient t-value Coefficient t-valuelabor use log(hours) 0.42 1.90manure use log(cards) 0.05 0.42compost use log(cards) 0.21 1.80area log(are) 0.68 5.16 0.43 2.64 0.31 2.17age log(years) 0.15 1.23 -0.27 -2.33gender head of household 1=male 0.01 0.10 -0.06 -1.14education head of household log(years) -0.06 -0.73 0.06 0.68household size number 0.00 -0.11 0.01 1.48total area cultivated log(ares) 0.01 0.34 0.02 0.77share of rice in area ratio -0.19 -1.48 -0.03 -0.27contracts with firm last year log(number) 0.17 2.11 -0.05 -0.71visits by supervisor on field log(number) 0.05 1.32 0.07 2.45timing of planting month -0.08 -1.88 0.02 0.50experience with firm log(years) 0.01 0.22 0.09 1.35no contract 1=no contract -0.04 -0.16 -0.28 -1.79Intercept 2.05 1.63 5.66 7.56 1.38 2.24Number of observations 218 212 211F 11.55 3.14 3.85Prob > F 0 0 0R-squared 0.42 0.34 0.32Root MSE 0.51 0.33 0.31*: village dummies included but not reportedRobust standard errorsSource: Authors' calculations based on farmer survey, 2004
Log(kgs)
Production function Input demand functionsLabor use Compost use
Log(no of cards)Log(hours)

Table 6: Impact contract on technology adoption
% NumberUse of compostAre you obliged to produce compost and use it on your plots? 93 186Before you first contract with the firm, did you use already compost? 12 23Are you now using compost on other plots than those under contract? 87 168If the contract would be terminated for one reason or another, would you continue using compost? 95 184Suppose that there would be no contract with the firm, would you use more compost than before? 66 132Change in agricultural practicesDid you change the way you do other off-season crops cultivation because of the contract? 93 186 a. use of inputs (fertilizer, pesticides, manure) 91 172
b. use of compost 96 181c. use of a strict scheme 66 123d. more maintenance (weeding, watering) 72 135
Did you change the way you do other rice cultivation because of the contract? 6 13 a. use of inputs (fertilizer, pesticides, manure) 33 4
b. use of compost 50 6c. use of a strict scheme 58 7d. more maintenance (weeding, watering) 50 6
Farmers that agree
Source: Farmer survey, 2004
1
Table 7: Income and perceived benefits of contract farming
Unit No. of obs. Mean St.dev.IncomeIncome from the contracts Ariary 199 87270 72179Income beans under contract Ariary 199 57812 57667Income gherkins under contract Ariary 199 26716 35715Income leek under contract Ariary 199 1630 10490Income peas under contract Ariary 199 266 1622Income another crop under contract Ariary 199 36 383Estimated income of contracts compared to total monetary income of household % 200 47 32 Mean Median Min MaxWelfareCurrent length of the lean period (months) 1.68 2 0 6Length of lean period before contract (months) 3.69 4 0 8Length of lean period for similar household without contract (months) 4.32 4 0 9
Not A bit Quite VeryReasons why households signed a contract (%)Stable income during the year 0% 2% 32% 66%A higher income 10% 42% 31% 17%Price stability 10% 22% 49% 19%Access to inputs on credit 0% 7% 33% 60%Learning of new technologies 0% 8% 37% 55%No other alternatives for income 8% 61% 19% 12%Access to a source of income during the lean period 1% 2% 25% 72%Source: Farmer survey, 2004
Importance

2
Table 8: Determinants of the length of the lean period faced by households
Variable* Unit Coefficient t-value Coefficient t-value Coefficient t-valueage log(years) 0.07 0.17 -0.30 -1.04gender head of household 1=male 0.27 1.52 -0.07 -0.43education head of household log(years) -0.32 -1.29 -0.34 -1.39household size number 0.06 1.55 0.04 1.29total area cultivated log(ares) -0.38 -3.74 0.12 1.12share of rice in area ratio -0.83 -2.20 0.18 0.47contracts with firm last year log(number) -0.74 -3.37 0.44 1.98 0.47 2.05intercept 4.52 2.66 2.36 1.73 1.41 4.52Number of observations 195 195 195F 4.6 1.8 4.22Prob > F 0.00 0.02 0.04R-squared 0.22 0.12 0.02Root MSE 1.13 1.05 1.05*: village dummies included but not reported#: change in the lean period between the period before the contract started and the time of the surveyRobust standard errorsSource: Authors' calculations based on farmer survey, 2004
Change in length in lean period#in months in months
Length in lean period

3
Table 9: Determinants of willingness to accept/refuse contract under changing prices (Probit model)
Variables* Unit Coefficient dF/dX z-value Coefficient dF/dX z-valueBid level Log(bid) 2.115 0.728 3.920 -0.046 -0.012 -0.050age years -0.160 -0.055 -2.090 0.026 0.007 0.390age square years 0.002 0.001 1.870 0.000 0.000 -0.210education level years -0.087 -0.030 -1.830 0.107 0.029 2.300household size number 0.157 0.054 3.010 0.053 0.014 1.150total ares cultivated number -0.002 -0.001 -1.540 0.001 0.000 2.320length of lean period before contract months 0.169 0.058 2.490 -0.104 -0.028 -1.410experience with firm year 0.000 0.000 -0.010 -0.049 -0.013 -1.530plots under contract number 0.026 0.009 0.370 0.126 0.034 1.770Intercept -8.967 -2.700 -1.742 -0.270Number of observations 196 196Wald chi2(12) 39.21 22.51Prob > chi2 0.0001 0.0321Pseudo R2 0.1905 0.1002*: location dummies included but not reportedSource: Authors' calculations based on farmer survey, 2004
Accept when firm decrease price Refuses when market price increase