summer internship report: vibration energy harvesting using
TRANSCRIPT
Summer Internship Report:
Vibration Energy Harvesting using PEH25W
Peter Sam Raj
May - July 2011
Supervisor:
Professor Winston Seah
Published on: Feb 8, 2012

Contents
1 Introduction 4
2 Sources for Energy Harvesting 6
3 Energy Harvester : Piezoelectric Energy Harvester by MIDETechnologies Inc. 83.1 Commercially available Vibration Energy Harvesters . . . . . . . 8
3.1.1 PMG FSH by Perpetuum . . . . . . . . . . . . . . . . . . 93.1.2 VEH460 by Ferro Solutions . . . . . . . . . . . . . . . . . 93.1.3 ECO100 by Enocean . . . . . . . . . . . . . . . . . . . . . 103.1.4 PEH25W by MIDE Technologies . . . . . . . . . . . . . . 10
3.2 Piezoelectric Energy Harvester by MIDE . . . . . . . . . . . . . . 103.2.1 Introduction . . . . . . . . . . . . . . . . . . . . . . . . . 103.2.2 Tuning the PEH25W . . . . . . . . . . . . . . . . . . . . . 103.2.3 Tuning below 60Hz . . . . . . . . . . . . . . . . . . . . . . 113.2.4 Electrical Characteristics . . . . . . . . . . . . . . . . . . 133.2.5 Power Performance . . . . . . . . . . . . . . . . . . . . . . 133.2.6 Measuring Power . . . . . . . . . . . . . . . . . . . . . . . 13
4 Circuit Design 174.1 Maximum Power Transfer . . . . . . . . . . . . . . . . . . . . . . 174.2 LTC3588 . . . . . . . . . . . . . . . . . . . . . . . . . . . . . . . 184.3 TPS61200 . . . . . . . . . . . . . . . . . . . . . . . . . . . . . . . 204.4 S882Z . . . . . . . . . . . . . . . . . . . . . . . . . . . . . . . . . 204.5 Other options . . . . . . . . . . . . . . . . . . . . . . . . . . . . . 22
4.5.1 LTC3108 . . . . . . . . . . . . . . . . . . . . . . . . . . . 224.5.2 Cymbet CBC-EVAL-09 . . . . . . . . . . . . . . . . . . . 22
5 Locations used in Energy Harvesting and Data 235.1 Description of Locations . . . . . . . . . . . . . . . . . . . . . . . 235.2 Stairs at Alan McDarmid . . . . . . . . . . . . . . . . . . . . . . 255.3 Bridge between Kirk and Murphy . . . . . . . . . . . . . . . . . . 255.4 Parking Area . . . . . . . . . . . . . . . . . . . . . . . . . . . . . 295.5 Vibration Characteristics . . . . . . . . . . . . . . . . . . . . . . 29
1

5.5.1 Stairs at Alan McDarmid . . . . . . . . . . . . . . . . . . 295.5.2 Bridge between Kirk and Murphy . . . . . . . . . . . . . 365.5.3 Generalizations . . . . . . . . . . . . . . . . . . . . . . . . 43
6 Power Analysis 446.1 Maximum power for Stairs . . . . . . . . . . . . . . . . . . . . . . 446.2 Maximum power for Glass Panes . . . . . . . . . . . . . . . . . . 446.3 Maximum power for Table Tops . . . . . . . . . . . . . . . . . . . 45
7 Conclusion 467.1 Low Frequency Vibrations . . . . . . . . . . . . . . . . . . . . . . 46
7.1.1 Caution . . . . . . . . . . . . . . . . . . . . . . . . . . . . 477.2 Further Ideas . . . . . . . . . . . . . . . . . . . . . . . . . . . . . 477.3 Papers consulted . . . . . . . . . . . . . . . . . . . . . . . . . . . 47
2

List of Tables
2.1 Magnitude and frequency for various sources[14] . . . . . . . . . 7
3.1 Characteristics and maximum ratings for the PEH25W by MIDE 10
5.1 Vibration characteristics for Alan McDarmid stairs . . . . . . . . 335.2 Vibration characteristics for Table Tops . . . . . . . . . . . . . . 365.3 Vibration characteristics for Surface floor of Bridge . . . . . . . . 365.4 Vibration characteristics for Base of Seat . . . . . . . . . . . . . 365.5 Vibration characteristics for Vertical Base of Seat . . . . . . . . . 375.6 Vibration characteristics for top of the seat . . . . . . . . . . . . 375.7 Vibration characteristics for Window glass . . . . . . . . . . . . . 37
6.1 Power measurements for stairs . . . . . . . . . . . . . . . . . . . 446.2 Power measurements for glass panes . . . . . . . . . . . . . . . . 456.3 Power measurements for Table Top . . . . . . . . . . . . . . . . . 45
3

Chapter 1
Introduction
Powering of traditional electronic systems using non-traditional sustainable sourceshas become important due to the growing environmental concerns to save en-ergy and also because of the recent developments and extensive applications ofsuch systems in various areas. This has been occurring because of the growingawareness to preserve extinguishable natural resources and also because it isincreasingly becoming an advantage to have self-powered devices. Part of thereason for that is because the devices are getting smaller in size and larger innumber. And hence, the job of replenishing the energy sources of these devices,e.g. Wireless Sensor Nodes, in the form of batteries is made a more cumber-some and difficult process. In these circumstances, having systems which areself sustained and energy efficient are both an advantage and a necessity. De-velopers are consequently looking to non-traditional alternatives for poweringtheir devices in the form of solar energy, thermal energy, wind, vibrations, stress,etc. Their use coupled with the advancement in energy harvesting technologiespresents an attractive option for delivering power to small scale devices whichwork in environments which have potential for Energy Harvesting and wherethe more traditional methods of supplying power become unfavourable.
The focus of this project in particular is on energy harvesting using vibra-tions and using the harvested energy to power wireless sensor nodes [14]. It aimsto design and build a system for harvesting energy out of vibrations in partic-ular environments and using that energy to power Low Power Sensor Nodes(LPSN) and in the process conveying some information about the vibrationsto the receiver. The operation of the system in a typical application setting isthat in the occurrence of an event which produces sufficient vibrations in theenvironment, the system will come alive, derive power from the vibrations, usethe power to transmit packets to the receiver(which doesn’t have the energyconstraints, i.e. it is powered) and go back to either a dormant low powermode or will totally switch off. This will in turn let the receiver know that theevent has occurred and hence information is implicitly transmitted about thevibrations. The intensity or duration of vibrations can also be predicted usingvarious methods which might modulate the number of packets transmitted as a
4

function of amplitude or duration of the vibrations. Thus, certain informationabout vibrations can be obtained using this methodology which doesn’t use asensor for sensing vibrations but rather uses the occurrence of packet transmis-sion as an indication of the fact that the event has occurred and the number ofpackets to get further information about the event. Also, this system can poweran external sensor along with the LPSN for more accurate measurement of thevibration and subsequent transmission of the data by the LPSN’s transmitter.
This system can have applications in various situations where it is normallydifficult to install or maintain electronic systems and where the engineer isinterested in detecting or measuring vibrations. Examples for such areas can bethe beams or girders on the under-side of a bridge which vibrate when vehiclespass over the bridge; tall buildings which vibrate with winds or earthquakes;and also stairs which vibrate when people pass over it.
The structure of this document is as follows. Firstly, various sources ofvibration energy will be explored in Chapter 2. Next, the Energy Harvesterused for harvesting Vibration Energy will be described and characterised inChapter 3. This will also cover the modifications made to the device for thepurpose of experiments. The next chapter covers some of the circuits which wereconsidered and which can be used for storing and delivering energy to the LPSN.This includes some approaches that were considered and also some which canbe tried out for application.Chapter 5 covers the description of various locationschosen for experiments and also the data derived from the experiments in thoselocations. Chapter 6 finally analyses the experimental data and interprets themin terms of power available for the proposed circuits and in turn to the LPSN.Chapter 7 concludes the results and puts them in perspective of the real worldapplications at the chosen and other possible locations.
5

Chapter 2
Sources for EnergyHarvesting
This chapter deals with various possible environments where it is possible toharvest the vibration energy and use it for powering LPSNs. As would beobvious, the possible environments are those environments in which vibrationsoccur. Additionally, as we want to use the vibrations as implicit indicators ofsome event in the environment, these vibrations should occur only when suchevents occur. For this, the characteristics of the vibrations and their occurrencebecome crucial issues. When we look at a situation and want to harvest energyfrom vibrations in the environment, we basically are looking for key parameterswhich describe the vibrations. These parameters can then be used to design ormodify the devices used for the harvesting purposes.
Vibration Energy Harvesting has many prospective environments and situa-tions where it can be implemented. These environments range a wide variety oflocations and situations. A common place to find vibrations is mechanical parts:on machines or on auto-mobiles. Harvesting energy from the vibrations in suchenvironments provides a huge incentive in the sense that inaccessible machinerycan be easily monitored and needs no replacing of batteries, which would haveto be used in the absence of Energy Harvesting technologies. Other locations tolook for vibrations could be doors (after closing), a computer’s CPU vibratingbecause of the cooling fan inside, microwave casing, stairs while people walking,buildings during earthquakes, bridges with people and/or vehicles passing overthem, roads etc. As Roundy, Wright, Rabaey [14] have compiled, there are dif-ferent characteristics for each location and environment in which the vibrationsexist and this ought to be a key component in designing harvesting systems forthe concerned environments. Some of these characteristics are shown in Table2.1.
In the practical case, the task of characterizing the environment where vi-brations are found becomes an important one. Turner and Pretlove[17] havediscussed the method to model a bridge and consequently finding out the fun-
6

Vibration source Acceleration Peak Frequency(g = 9.8m/s2) (Fundamental mode)
Car engine compartment 1.22g 200HzBase of 3-axis machine tool 1.02g 70HzBlender casing 0.65g 121HzClothes dryer 0.35g 121HzPerson nervously tapping their heel 0.30g 1HzCar instrument panel 0.30g 13HzDoor frame just after door closes 0.30g 125HzSmall microwave oven 0.25g 121HzHVAC vents in office building 0.02g-0.15g 60HzWindows next to a busy road 0.07g 100HzCD on notebook computer 0.06g 75HzSecond story floor of busy office 0.02g 100Hz
Table 2.1: Magnitude and frequency for various sources[14]
damental frequency of a bridge due to the traffic that passes over it. For atypical highway bridge, a fundamental frequency of 11.7Hz is calculated. Astudy on the frequencies present in two earthquakes and ambient vibrationspresent in buildings is published by Kohler[10] mentioning upto the third modeof vibrations due to the causing agents. In the case of vibrations in roads dueto traffic, Hunt[8] developed a mathematical model for stochastic modelling ofroads with regard to traffic induced ground vibrations by modelling vehiclesaccordingly. Traffic-induced building vibrations are dealt with in the specificcase of Montreal by Hunaidi and Tremblay[7]. This paper gives extensive de-tails of the vibration characteristics due to various vehicles in different parts ofMontreal and can be useful for an estimate of building vibrations in an urbanenvironment. According to them, bus-induced vibrations lay between 10Hz to12.5Hz range and that each particular situation had its own cut-off frequency,below which there were no significant vibrations.
7
Chapter 3
Energy Harvester :Piezoelectric EnergyHarvester by MIDETechnologies Inc.
This chapter looks at the vibration energy harvester device which was usedin this project, i.e. the Piezoelectric Energy Harvester PEH25W by MIDETechnologies Inc. It begins with a brief overview of commercially availablevibration energy harvesters comparing them wherever applicable. Then thecharacteristics of the PEH25W are discussed including some SPICE models forthe device. After that, some modifications to the PEH25W are described whichcan bring the frequencies of resonance down to the desired values of operation.This allows for proper tuning of the device according to the conditions in whichit has to harvest vibration energy and also, it maximizes the power output. Twosuch modifications are discussed and results of the modifications are described.
3.1 Commercially available Vibration Energy Har-vesters
There are various types of Vibration Energy Harvesters and choosing one takesconsideration of application and power requirements. Most of these can be clas-sified as one of the following categories: Piezoelectric generators, Electromag-netic generators and Electrostatic generators. A survey of many commercialand non-commercial devices has been published by Beeby, Tudor and White[4]where one can find comparisons between some of the devices (though partlyoutdated) and also some of the approaches taken in vibration energy harvest-ing. Some of the commercially available devices are discussed in this section.
8

The reader is advised to refer to the datasheet of these devices for more detailedspecifications and characteristics.
3.1.1 PMG FSH by Perpetuum
Perpetuum has developed this electromagnetic vibration energy harvesting de-vice which acts as a current source which is proportional to the magnitude ofvibrations. The main features of this device are:
Mounting This device is mounted using a Magnetic mount or using a centerthrough hole.
Power output Maximum power output is 4mA at 5V which means 20mW at
Use Optimized for industrial machine asset condition based monitoring.
Connector The connector used in this device is a 3-pin IEC connector.
Weight Has a total mass of 1.075 kilograms.
Frequency This device is factory tuned and is available only for 50Hz and60Hz frequencies.
So, as it can be seen, this device produces high power and is useful at evenextremely low vibration amplitudes as it is a current source. The disadvantagesare basically the mass of the device and that it can’t be tuned to custom fre-quencies. This crucial inability to be customized in accordance to the variousvibration sources makes it low on the preference list for the particular situationswe try to deal with, i.e. bridge vibrations etc. which do not involve machinery.
3.1.2 VEH460 by Ferro Solutions
This is an electromechanical vibration energy harvester developed by Ferro So-lutions Inc. The features are:
Power output The device can apparently produce high energy compared tothe other devices for vibration energy harvesting to the tune of 0.3mW at0.025g at 60Hz. The datasheet claims that the device can produce upto5.2mW at vibrations as low as 0.1g at 60Hz.
Frequency The device is factory tuned to 60Hz but the power output falls to-3dB within 1.5Hz of the resonant frequency.
Dimensions The total volume of the device is 170cm3.
Weight Has a total mass of 430g, substantially lower than the PMG FSH.
9

Operating Temperature Range -40 to 90 CMaximum tip to tip deflection 3.81mmSingle Wafer Series Capacitance at 100Hz 130nFSingle Wafer Series Resistance at 100Hz 210Ω
Table 3.1: Characteristics and maximum ratings for the PEH25W by MIDE
3.1.3 ECO100 by Enocean
There is very less documentation for this device, but it is described as an energyconverter for linear motion. It has been used by the manufacturer to power radiomodules and such, hence can be an interesting device to work with once morerefined. It works by giving out an output pulse of around 5V when an actuatinglinear travel of 2mm is provided.
3.1.4 PEH25W by MIDE Technologies
This is a piezoelectric vibration energy harvester as opposed to the other twotypes which have been described till now. This project uses this device and it’sdescribed more in detail in the subsequent section.
3.2 Piezoelectric Energy Harvester by MIDE
3.2.1 Introduction
The device used in this project, the Piezoelectric Energy Harvester PEH25W isessentially two V25W raw Volture harvesters in series to each other packagedby Mide’s patented piezoelectric transducer packaging technology. This devicecan be used for industrial health monitoring network sensors which are basicallyvibration energy harvesting on industrial machinery which vibrates with certainknown frequencies. Some of features of the device are given in Table 3.1.
3.2.2 Tuning the PEH25W
For the method to tune the device, please refer to page 6 of the Volture Datasheet.Essentially there are two methods to tune the device, both of which are men-tioned therein and which utilize different methods to locate the fundamentalfrequency of the cantilevered beam that forms the piezoelectric unit of the de-vice. For tuning purposes, it is enough to know that the resonance frequency ofthe device is decreased either by decreasing the weight used on the cantileveredbeam or by decreasing the distance of the weight from the fixed end of thebeam. Basically, higher the torque provided by the mass, lesser the fundamen-tal frequency of the beam is. Any decrease in the torque will result in higherfrequencies. This concept can be used in a flexible manner, as will be seen inthe subsequent sections, to tune the PEH25W to very low frequencies and in
10

Figure 3.1: Relation between tip mass and natural frequency
the range of frequencies we are interested in. In Figure 3.1 a list of different tipmasses is given and the corresponding changes in the fundamental frequency ofthe beam are shown. The default frequency of resonance is around 62Hz witha single tip mass attached to the piezoelectric beam with bees wax.
3.2.3 Tuning below 60Hz
The PEH25W comes with a single tip mass attached to the end of the piezoelec-tric beam with bees wax. The modifications to the fundamental frequency thatone can make in the confines of the casing of the PEH25W and with a single tipmass are fairly limited. Thus, in order to tune the device to low frequencies, thedevice has to be significantly modified. The requirements of the project wereto have fundamental frequencies of 12Hz and 8Hz for two locations, namelythe bridge and the stairs respectively. Hence, more tuning masses were usedand the structure of the device as considerably customized for the purpose ofexperimentation and calculating power performance. Figures 3.3 and 3.2 showthe modified PEH25Ws. Note that the 8Hz version has a longer beam struc-ture and more masses on it, hence making the frequency go considerably low.Also, any such modification should be done with great caution and care so as tonot damage the beam. Specially at low frequencies, it is advised to excite thePEH25W at very low vibration levels as the amplitude increases considerablywith decrease in frequency for the same acceleration levels.
Figures 3.4 and 3.5 give the frequency domain plots of the vibration exci-tations at maximum outputs after tuning the PEH25W to above frequencies.
11

Figure 3.2: PEH25W tuned to 8Hz
Figure 3.3: PEH25W tuned to 12Hz
Figure 3.4: Frequency domain Z-axis
12

Figure 3.5: Frequency domain Z-axis
3.2.4 Electrical Characteristics
Electrically, the output of the V25W’s are combined in parallel and then condi-tioned using an internal electronics board which consists of a full wave rectifierand a 10µF capacitor parallel to the output terminals. Also, there is a 14.46VZener diode to limit the output voltage to a maximum of 14.46V. This can besummarized in the LTSpice Schematic in Figure 3.6. The voltage source shownin the schematic is the combination of the two V25W in parallel.
3.2.5 Power Performance
The power performance of the device can be evaluated by using the plots givenon page 9 of the Volture Datasheet. The plot for tuned device at 40Hz is repro-duced here in Figure 3.7. As one can observe, the power performance decreaseswith the vibration excitation amplitude and also varies with the operating volt-age. Hence, it is crucial for the voltage conditioning circuits to maintain thevoltage at the point where the maximum power can be transferred from thedevice to the external circuitry. These points are the maxima’s of the paraboliccurves that emerge when power generated is plotted against operating voltage.
3.2.6 Measuring Power
Although the documentation and MIDE suggest that Figure 3.6 is the circuitinternal to the PEH25W device, during experimentation, the device doesn’tbehave according to it. Simple simulations with varying loads or with differentexcitations on LTSpice can prove that the internal model for the PEH25W willhave to be more complex than the one suggested above in Figure 3.6. Knowingthe internal model of the device becomes a crucial issue in the case of maximumpower measurements. This is because maximum power transfer happens when
13
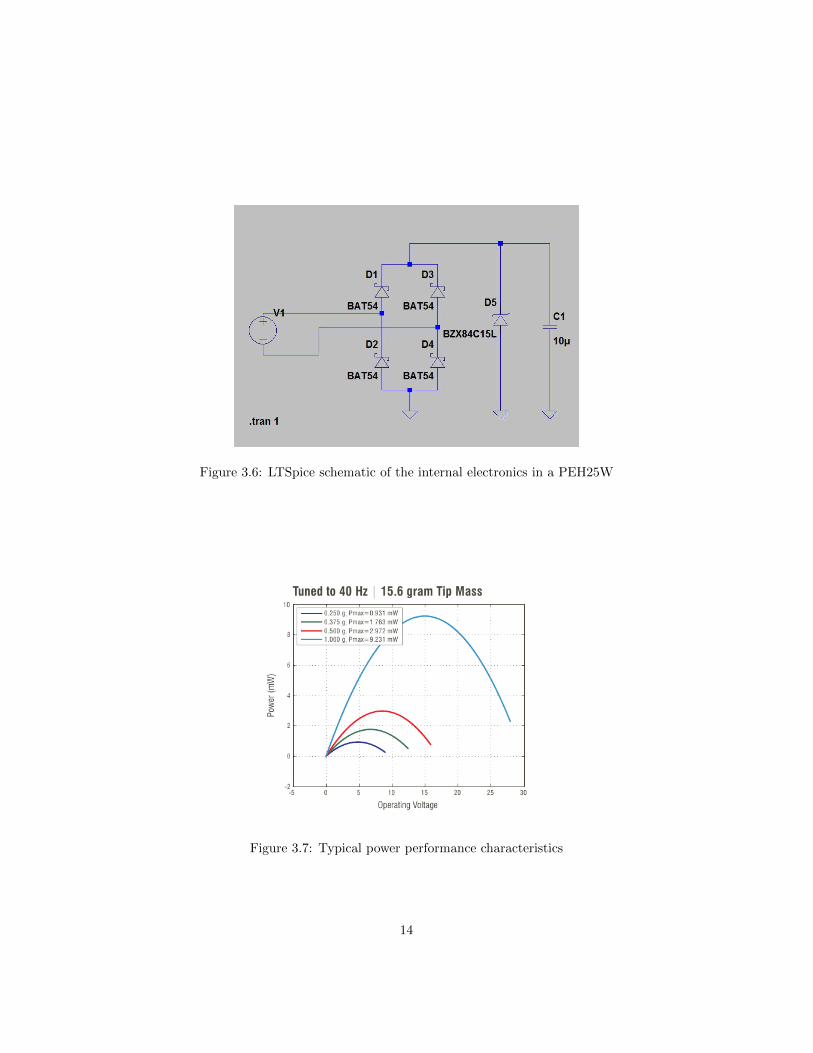
Figure 3.6: LTSpice schematic of the internal electronics in a PEH25W
Figure 3.7: Typical power performance characteristics
14
the internal thevenin impedance is matched to the load impedance by beingits complex conjugate. So, when Z is the internal thevenin impedance of thedevice, then a load impedance of Z∗ will cause the operating voltage to be halfthe open-circuit value and it will cause the maximum power transfer situation.Hence, when one wants to measure the maximum power the device is offeringat a particular excitation and frequency, two approaches may be taken. Oneapproach may be to predict accurately the internal impedance of the device andapplying the corresponding load impedance to the device. The other alternativecould be to just assume a resistive impedance and use a variable resistance onthe load side to bring down the voltage to half the open circuit voltage. In theparticular case of PEH25W, the second approach is easier as it is extremelydifficult to predict the internal model using the behaviour of the device.
One more consideration that has to be kept in mind while making powermeasurements is that of measuring voltages. The PEH25W can have extremelyhigh internal impedances in some situations, in the order of MΩ. When a mul-timeter or an oscilloscope is used in such a situation, the reading of voltage isincorrect as the scope(i.e. the multimeter or the oscilloscope) loads the deviceas well and the impedance of the multimeter also has to be taken into consid-eration. For this project, the oscilloscope used was the Tektronix TDS 2022Bwhich had a probe impedance of 1MΩ. The multimeter used was Fluke 179Digital Multimeter which had a probe impedance of 10MΩ. This affects themeasurements in two ways.
Open Circuit Voltage Measurement : When the scope is used to measurethe voltage across the two terminals coming out of the PEH25W withoutany other component connected, the multimeter’s input impedance loadsthe device and the voltage appearing on the multimeter display is notthe actual open-circuit voltage. For measuring this value accurately, themethod involved using the AutoHOLD feature on the Fluke 179 Multimeterwhich froze the display as soon as a stable display was detected. So,the multimeter was set to the AutoHOLD mode and the probes were notconnected to the device’s terminals until a sufficient time so that thecapacitor could get charged completely. So, after a sufficient amount oftime, the probes were connected and removed as soon as the AutoHOLD
detected a stable input and displayed it on the screen. Such removal of theprobes ensured that more charge did not dissipate through the multimeterand hence kept the loading effect of the multimeter to a minimum.Note: If the AutoHOLD feature is not available, then directly observe thefirst measurement value that pops up on the display as soon as the probesare touched to the leads and note the value as closest to open circuit value.Remove the probes though as soon as the value is noted.
Operating voltage Measurement with Load Resistance : When measur-ing the value of voltage across the terminals when a load is present, thevoltage displayed on the screen is the correct value, but it is the resistancevalue of the load that has to be corrected for power measurements. Theactual load is calculated by considering the scope impedance in parallel
15

with the load resistance and the result is taken for measuring power bythe formula V 2/R.
Thus, the following steps are recommended and were used in the measure-ments of maximum power throughout the course of this project.
Step 1 - Start the vibration excitation to the device using a shaker which canprovide determined amplitude and frequencies of vibrations. Allow forsufficient time for the capacitor to get charged fully or at least very nearto the open circuit voltage value.
Step 2 - Use the AutoHOLD feature on the multimeter to record the open circuitvalue. This is Voc.
Step 3 - Connect a variable resistance across the output terminals of the PEH25W.Also, permanently connect the scope probes to the terminals.
Step 4 - Vary the load resistance such that the voltage on the display of thescope is half the open circuit value measured in Step 1.
Step 5 - Measure the value of load resistance after disconnecting the variableresistance from the PEH25W. This is R
′
L.
Step 6 - Say the scope input impedance is given in the scope’s datasheet asRsc. Compute RL = R
′
L ‖ Rsc as the actual load resistance at half theopen circuit voltage.
Step 7 - Now calculate the maximum power as Pmax = V 2oc/4RL.
16

Chapter 4
Circuit Design
A basic system to harvest energy using the vibrations and then transmit packetsusing the harvested energy requires three stages. Firstly, the energy has to beefficiently harvested by the energy harvesting device. This involves tuning of thedevice by various methods and also proper positioning and attachment of thedevice according to the source of vibrations and its characteristics. Secondly,the harvested electrical power has to be conditioned so that it can be used bysensor nodes which are particularly optimized to work at low power conditions.Then finally, the third step is to actually use the energy and transmit packetsaccording to the need and the available power. This document deals with onlythe first two steps and this chapter in particular discusses some of the options forthe second step that were investigated. This includes unsuccessful tries as wellas some ideas which may be useful for the purpose of conditioning the circuit.
4.1 Maximum Power Transfer
One basic problem when working with harvesters which deliver very small poweris the point of getting maximum out of the device. In our case, it means gettingmaximum power from the device when it’s operating and producing voltagefrom the vibrations. For a fixed reactive source, the maximum power theoremmaximizes the real power delivered to the load by complex conjugate matchingthe load to the source. This means that if we apply a load that is the complexconjugate of the device’s internal impedance across the terminals, then we willbe drawing out maximum power from the device. The problem with our devicePEH25W is that even though MIDE suggests a model for the internals of thedevice (as in Figure 3.6), the device doesn’t agree experimentally with the sug-gested model and its internal impedance changes with the applied frequency ofvibration. While this is obvious as there is a capacitor inside across the outputterminals, the task of matching the impedance becomes complicated becauseof the reactive component of the internal impedance and its variation with thefrequency. To side-step these problems of unknown internal model of the device,
17

Figure 4.1: LTC3588 circuit using raw Volture unit
the approach thus used for maximum power extraction was brute-force method.This involved varying the load resistance to get the operating voltage to halfthe open circuit value and thus reaching the point of maximum power transfer.Note that this is just the optimal case in the sense that any circuit proposed tocondition the harvested electrical power will have to constantly keep the outputterminals at this maximum power transfer point which is a challenge in itself.
The following sections discuss some of the ICs investigated and their features.
4.2 LTC3588
The LTC3588 is called as the Piezoelectric Energy Harvesting Power Supply byLinear Technology. This IC is used in one of the application examples in theVolture datasheet on page 23. The applications note on the datasheet (Figure4.1) describes the use of the IC with the raw Volture as the input to the PZ1and PZ2 terminals of the IC. Some features of the IC which are of interest are:
Input Operating Range : 2.7V to 20V
Output Current : Upto 100mA
Output Voltage : Selectable of 1.8V, 2.5V, 3.3V, 3.6V
Quiescent Power : On page 3 of the LTC3588 datasheet, the second row givesthe typical quiescent currents at different voltage levels. It can be seen
18
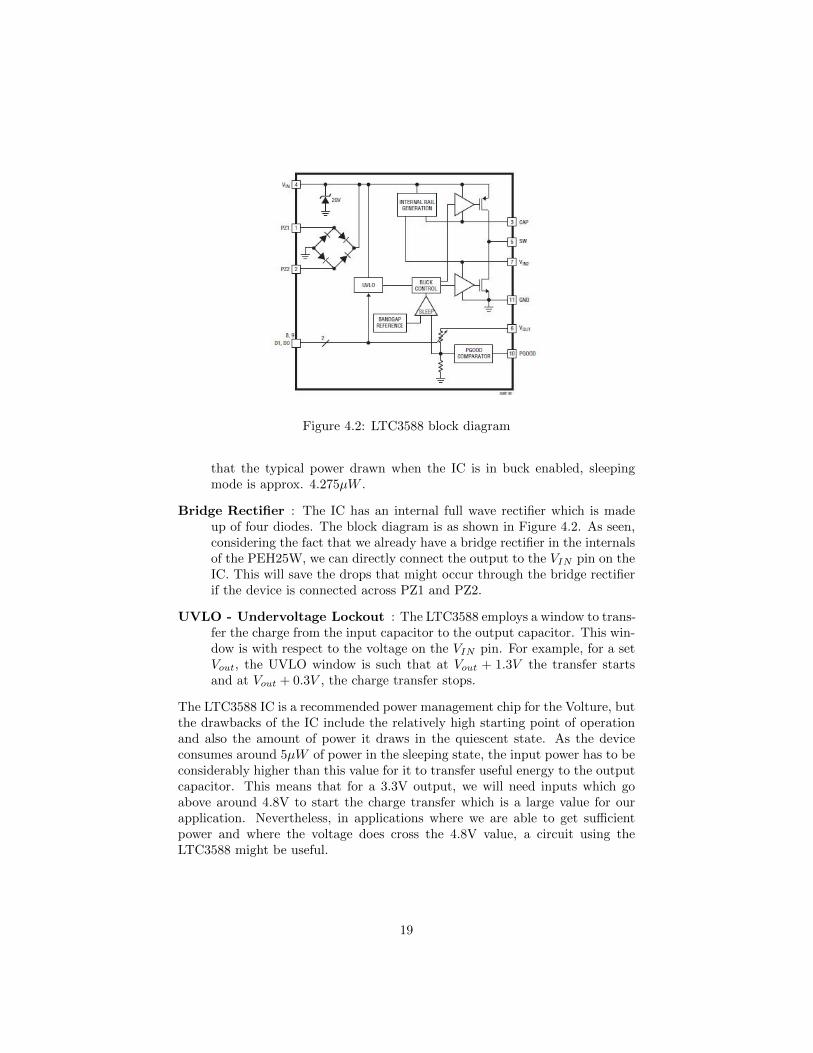
Figure 4.2: LTC3588 block diagram
that the typical power drawn when the IC is in buck enabled, sleepingmode is approx. 4.275µW .
Bridge Rectifier : The IC has an internal full wave rectifier which is madeup of four diodes. The block diagram is as shown in Figure 4.2. As seen,considering the fact that we already have a bridge rectifier in the internalsof the PEH25W, we can directly connect the output to the VIN pin on theIC. This will save the drops that might occur through the bridge rectifierif the device is connected across PZ1 and PZ2.
UVLO - Undervoltage Lockout : The LTC3588 employs a window to trans-fer the charge from the input capacitor to the output capacitor. This win-dow is with respect to the voltage on the VIN pin. For example, for a setVout, the UVLO window is such that at Vout + 1.3V the transfer startsand at Vout + 0.3V , the charge transfer stops.
The LTC3588 IC is a recommended power management chip for the Volture, butthe drawbacks of the IC include the relatively high starting point of operationand also the amount of power it draws in the quiescent state. As the deviceconsumes around 5µW of power in the sleeping state, the input power has to beconsiderably higher than this value for it to transfer useful energy to the outputcapacitor. This means that for a 3.3V output, we will need inputs which goabove around 4.8V to start the charge transfer which is a large value for ourapplication. Nevertheless, in applications where we are able to get sufficientpower and where the voltage does cross the 4.8V value, a circuit using theLTC3588 might be useful.
19

4.3 TPS61200
This IC is called as the Low Input Voltage Synchronous Boost Converter with1.3-A switches. This is a very versatile IC by Texas Instruments offering manypossibilities of modifications and customizations of operation and output. Spark-fun Electronics has a breakout board of a common application circuit of theTPS61200 which was used for the experimentation purpose. Unfortunately,the device draws too much power for our application and is not useful for fewµW power range. This inadequacy was discovered during experimentation andTPS61200 was rejected as a possible IC to be used. Nevertheless, some of thefeatures which might be interesting are:
Type of converter : TPS61200 is a buck-boost converter which has an auto-matic transition between the Boost Mode and the Buck/Down ConversionMode.
Operating Input Voltage Range : This is from 0.3V to 5.5V but can bemade lower by connecting the UVLO pin to the input directly. This willtake it down to 250mV. Also, according to some articles on eetimes.com,the input operating range can be taken all the way down to 0V by tyingthe UVLO pin to the output.
Efficiency : The efficiency plots on the datasheet from page 6 to 9 give thenature of efficiency that the IC delivers in different values of output cur-rent. As can be seen, at small values of output current, the efficiencydegrades considerably. As shown in Figure 3 on page 7 of the datasheet,the efficiency falls to around 40% at around 100µA itself.
The TPS61200 IC thus can not be used because of efficiency issues and alsobecause it requires a much higher amount to current in the operating range.This was verified experimentally.
4.4 S882Z
This is called as the ’ULTRA-LOW VOLTAGE OPERATION CHARGE PUMPIC FOR STEP-UP DC-DC CONVERTER START-UP’ by Seiko Instruments.The use of this IC with the Volture/PEH25W is described in the ApplicationsInformation on the Volture Datasheet on page 14. The circuit is basically aswitched capacitor boost circuit. Note that the S882Z IC is actually intendedto be a startup IC in the sense that it stores enough energy to start up aconventional DC-DC inductor based converter. S882Z is not intended to beused as a standalone booster chip because it has low efficiency compared tosome other methods. However, the chip should be able to work within therestrictions provided by our application as described in the Applications Notein Figure 4.3, but one of the areas where it presents a disadvantage is thatthe power bursts it provides are from 2.4V to around 2V whereas our LPSNcomponents would need something closer to 3.3V. Thus, the maxima of 2.4V
20

Figure 4.3: Volture output conditioned by S882Z
would not be able to suffice for this. If the requirement of maximum voltage isreduced on the LPSN, then this chip can be a potential IC to be used for theconditioning circuit. The IC wasn’t experimented with because it was present onthe CBC-EVAL-09 board which is an integrated board for Energy Harvestingpurposes. The Cymbet manufactured board does contain the chip but it isused as a startup chip and not as a standalone booster. Thus, the applicationnote given on the Volture datasheet can’t be realized using the CBC-EVAL-09board. The application note, as shown in Figure 4.3 is also available readymade on MIDE’s board EHE003. Unfortunately though, it is out of stock andthe reader is advised to keep informed about the availability of the board onMIDE’s website. The board features the entire circuit we talk about in thissection and can be used immediately for testing the customized PEH25W forlow frequency vibrations. Refer to page 14 to 17 of the Volture datasheet formore details on how to configure the burst width and on how to calculate theenergy values for a particular configuration. The plots given on page 16 of thedatasheet are for a V20W raw Volture tuned to 60Hz. But as we will see in thenext few chapters, our modified designs for lower frequencies will give a muchlarger power outputs at low acceleration values, similar to which we find inpractical locations like stairways and bridges. Some features of the Seiko S882Zchip are as follows:
Operating Voltage Range : Input voltage is from 0.3V to 3.0V. This meansthat to limit the voltage to 3.0V, we will have to put a Zener diode on theinput of the chip to prevent the output from going too much higher thanthe input limit. This is a necessary step because as we see in the followingchapters, the voltages in the 8Hz case do go up considerably higher than
21

3V and even upto 14.46V which is the highest voltage the PEH25W canoutput.
Discharging voltage range : This is selectable from 1.8V to 2.4V in 0.2Vsteps.
4.5 Other options
4.5.1 LTC3108
This IC can be used if we are able to access the raw Volture directly as itworks mainly on AC input and can go down to 20mV input voltage. A step uptransformer is used in the input side to amplify the voltage and providing theboosting. It would have to be taken care that the voltage at C1 pin can’t begreater than 50V and hence a Zener diode has to be used in the case where weinput using a raw Volture.
4.5.2 Cymbet CBC-EVAL-09
This is a Universal Energy Harvester Evaluation Kit which is an integratedplatform to harvest energy from different kind of sources. It has two types ofinputs, High Voltage and Low Voltage which are defined using a threshold of4.06V. The board is based on an on board rechargeable battery which is used bythe Energy Processor CBC915-ACA to power the output when the input poweris too low. When there is enough power from the input, the processor chargesthe batteries and thus replenishes the spent source of power on the board. Itremains to be seen whether the board can in some way be used to work withouta battery on it and directly power a LPSN using a harvester. Also, as thethreshold is 4.06V, a Zener diode has to be used to limit the PEH25W outputto this value.
22

Chapter 5
Locations used in EnergyHarvesting and Data
5.1 Description of Locations
For the purpose of this project, various locations in the University campus wereinvestigated and their vibration characteristics were compared. The locationscovered were:
1. Bridge between Kirk Building and Murphy building
2. Stairs in Alan McDarmid Building
3. Parking lot in Alan McDarmid Building
Figures 5.1, 5.2, 5.3 and 5.4 show the locations used for the vibration record-ings.
Figure 5.1: Bridge between Kirk and Murphy, Victoria University
23

Figure 5.2: Other side of bridge
Figure 5.3: Stairs between level 1 and 2 at Alan McDarmid building
24

Figure 5.4: Alternate view: Stairs at Alan McDarmid
5.2 Stairs at Alan McDarmid
The stairs at Alan McDarmid (in Figure 5.5 are concrete ones with metal tops,and produce vibrations when people walk up or down on it. The SlamStickwas attached to the sides of the stairs to avoid any contact with shoes whenpeople walked over them. Hence, the vibration measurements were of thosevibrations which propagated to the ends of the individual stairs. As shown inFigure 5.7, there are three locations where the SlamStick can be attached to getthe vibration measurements. The attached SlamStick devices are shown in 5.6.
5.3 Bridge between Kirk and Murphy
The bridge however had multiple locations where the vibration characteristicswere investigated. On the bridge, the locations where vibrations were measuredwere:
Base of Seat - A bed like seat was chosen to be analysed as it was heavy andseemed to vibrate a lot during passage of people. The pictures of thelocation can be found in Figures 5.8 and 5.9
Staff of Seat - Figure 5.10
Underside of Seat - Figure 5.11
Window Glasses - Figure 5.12
25

Figure 5.5: Stairs at Alan McDarmid building
Figure 5.6: SlamStick devices attached to the stairs
26

Figure 5.7: Three locations for the attachment of SlamStick devices
Figure 5.8: Base rod of seat
27

Figure 5.9: Base rod of seat
Figure 5.10: Vertical rod of seat
Figure 5.11: Top rod of seat
28

Figure 5.12: Window glasses on the bridge
Vertical beam - Figure 5.13
Metal Side Bar - Figure 5.14
Table Top - Figures 5.15 and 5.16
Floor - Part of the mat was scraped off and the SlamStick was attached to thebase surface of the bridge. Figure 5.17
5.4 Parking Area
The parking area on the ground floor of the Alan McDarmid building was alsoinvestigated but it did not produce vibrations enough for energy to be harvested.Thus, it is not discussed in detail here.
5.5 Vibration Characteristics
5.5.1 Stairs at Alan McDarmid
The SlamStick recordings for the vibrations for this location can be found atdatafiles/McDarmid stairs/sides/. There are nine .DAT files which are thedata files from the SlamStick. These should be split into individual recordingsand analysed using ss viewm.m as described in the User Manual for SlamStickRecorder by the author of this document. The file endings have the followingmeanings:(Refer to Figure 5.6 for examples)
’r’ - Means that the SlamStick was mounted on the dark rubber like surface onthe stairs.
’m’ - Means that the SlamStick was mounted on the metal surface on the stairs.
29

Figure 5.13: Vertical supporting beams for the bridge
Figure 5.14: Metal bar on the side of the bridge
30

Figure 5.15: Top of one of the tables stationed on the bridge
Figure 5.16: Positioning of the table for experiment
31

Figure 5.17: Surface of the bridge. The cushion was taken off and SlamStickwas attached to the solid surface
’c’ - Means that the SlamStick was mounted on the concrete surface on thestairs.
’cin’ - Means that the SlamStick was mounted very near the previous step’send, i.e. very near to the edge where two steps meet.
Thus, the analysis is done for the stairs and the results are summarized in Table5.1.
The plots for the above data are given in Figures 5.18 to 5.26.
32

File Axis Frequency Peak acceleration value1r.dat Z N.A. Negligible2r.dat Z 8.009Hz 0.018g4r.dat Z 8.009Hz 0.047g3m.dat Z 8.004Hz 0.040g6m.dat Z 8.009Hz 0.025g9m.dat Z 52.03Hz 0.052g
Z 8.005Hz 0.030g5c.dat Y 8.002Hz 0.029g7cin.dat Z 8.003Hz 0.013g8c.dat Z 8.002Hz 0.016g
Table 5.1: Vibration characteristics for Alan McDarmid stairs
33

Figure 5.18: Frequency domain plotfor 1r.dat
Figure 5.19: Frequency domain plotfor 2r.dat
Figure 5.20: Frequency domain plotfor 3m.dat
Figure 5.21: Frequency domain plotfor 4r.dat
Figure 5.22: Frequency domain plotfor 5c.dat
Figure 5.23: Frequency domain plotfor 6m.dat
34
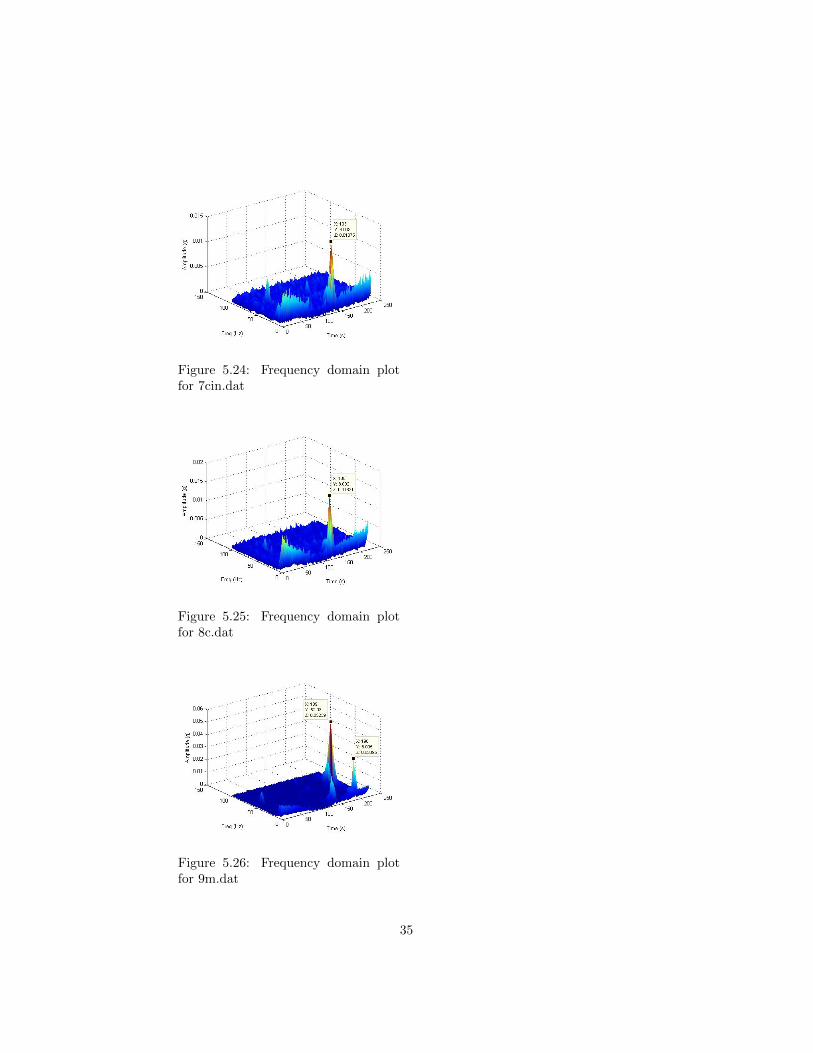
Figure 5.24: Frequency domain plotfor 7cin.dat
Figure 5.25: Frequency domain plotfor 8c.dat
Figure 5.26: Frequency domain plotfor 9m.dat
35
File Axis Frequency(Hz) Peak acceleration value(g)1.dat Z 40.05 0.081
Z 44.05 0.0692.dat Z 48.05 0.0843.dat Z 44.04 0.082
Z 44.04 0.0784.dat Z 44.02 0.075
Z 44.02 0.0735.dat Z 44.04 0.039
Z 48.04 0.0346.dat Z 44.03 0.045
Z 48.04 0.0437.dat Y 40.04 0.0898.dat Z 40.03 0.069
Z 44.03 0.054
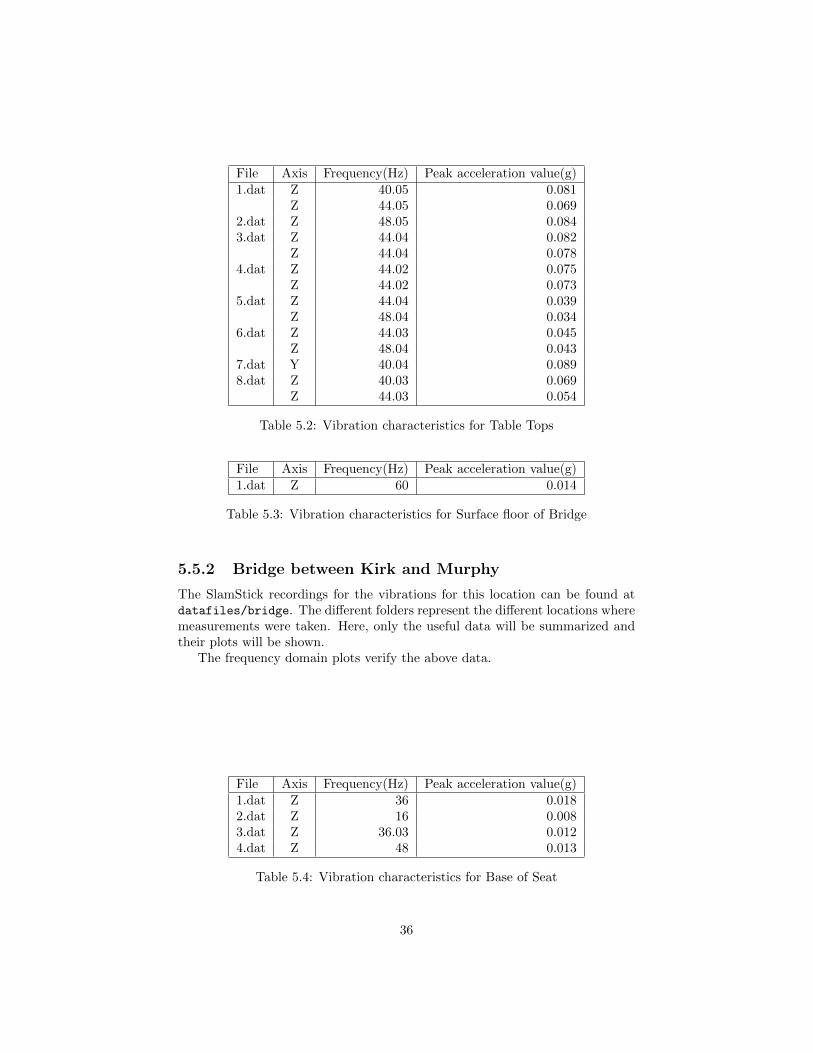
Table 5.2: Vibration characteristics for Table Tops
File Axis Frequency(Hz) Peak acceleration value(g)1.dat Z 60 0.014
Table 5.3: Vibration characteristics for Surface floor of Bridge
5.5.2 Bridge between Kirk and Murphy
The SlamStick recordings for the vibrations for this location can be found atdatafiles/bridge. The different folders represent the different locations wheremeasurements were taken. Here, only the useful data will be summarized andtheir plots will be shown.
The frequency domain plots verify the above data.
File Axis Frequency(Hz) Peak acceleration value(g)1.dat Z 36 0.0182.dat Z 16 0.0083.dat Z 36.03 0.0124.dat Z 48 0.013
Table 5.4: Vibration characteristics for Base of Seat
36

File Axis Frequency(Hz) Peak acceleration value(g)1.dat Z 12.01 0.0162.dat Z 12.01 0.0203.dat Z 12.00 0.009
Z 32.00 0.0134.dat Z 40.00 0.016
Table 5.5: Vibration characteristics for Vertical Base of Seat
File Axis Frequency(Hz) Peak acceleration value(g)1.dat Z 32.03 0.014
Table 5.6: Vibration characteristics for top of the seat
File Axis Frequency(Hz) Peak acceleration value(g)1.dat Z 12.01 0.0272.dat Z 12.00 0.0203.dat Z 12.01 0.0204.dat Z 12.00 0.0145.dat Z 12.01 0.0266.dat Z 12.01 0.0187.dat Y 12.01 0.0248.dat Z 12.01 0.019
Table 5.7: Vibration characteristics for Window glass
37
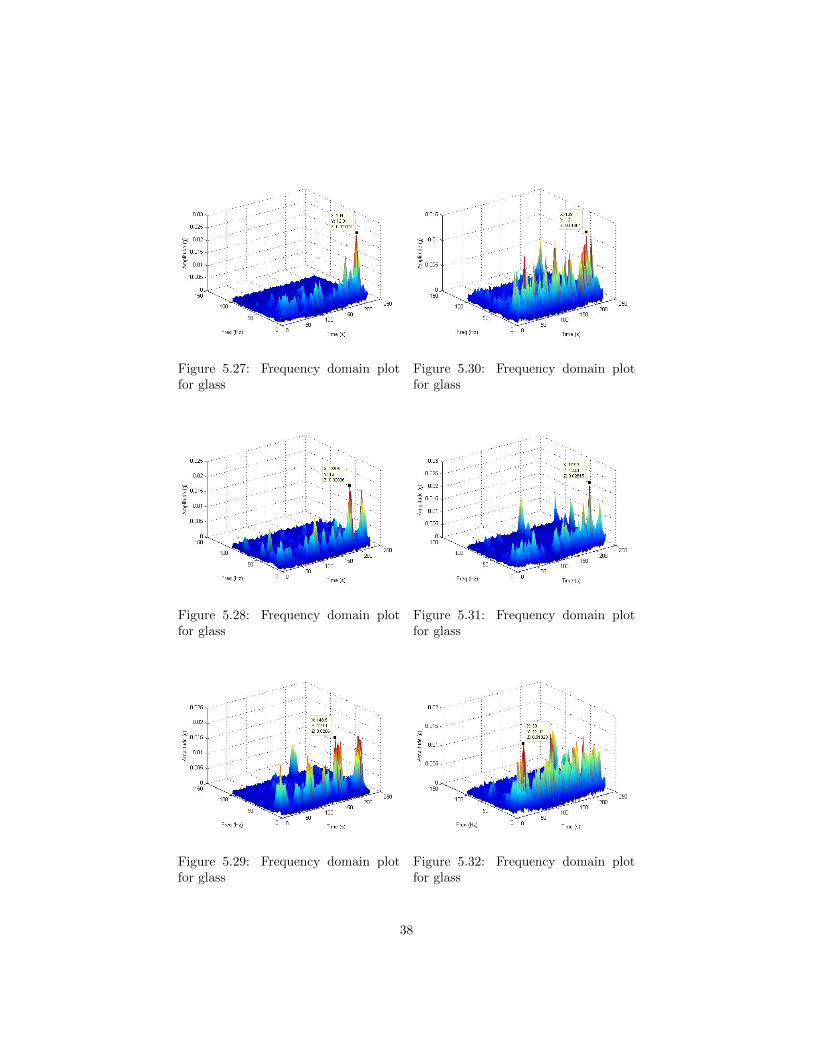
Figure 5.27: Frequency domain plotfor glass
Figure 5.28: Frequency domain plotfor glass
Figure 5.29: Frequency domain plotfor glass
Figure 5.30: Frequency domain plotfor glass
Figure 5.31: Frequency domain plotfor glass
Figure 5.32: Frequency domain plotfor glass
38
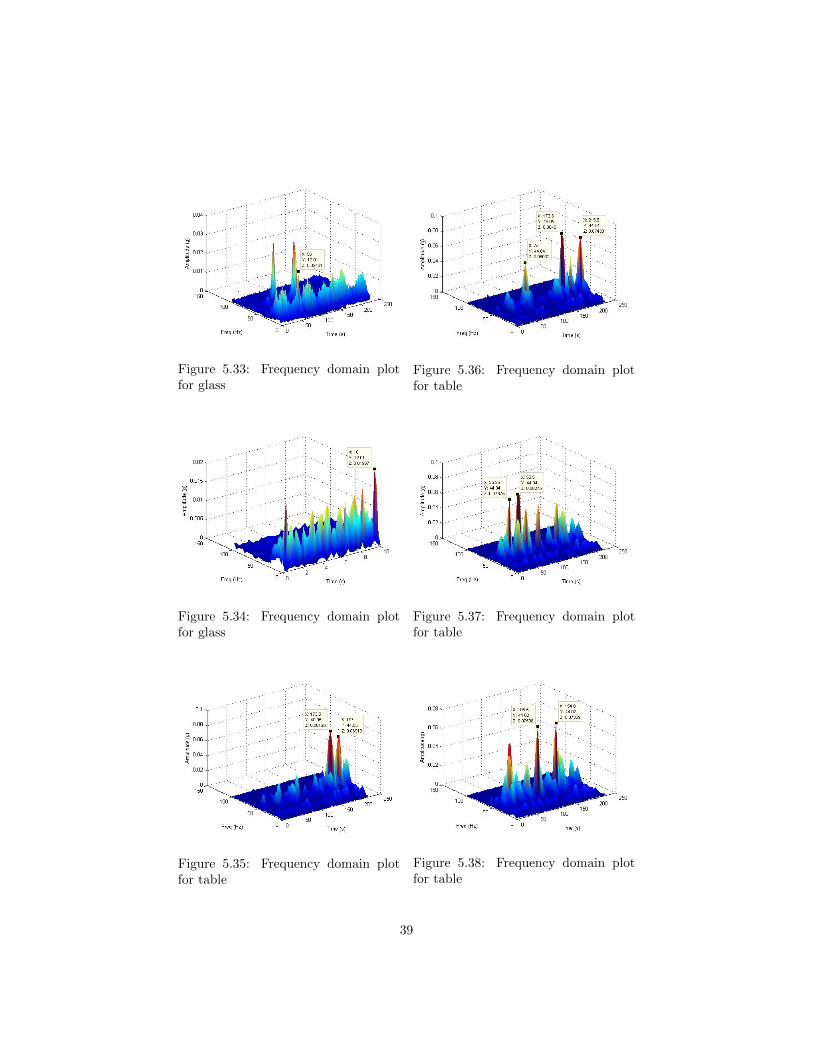
Figure 5.33: Frequency domain plotfor glass
Figure 5.34: Frequency domain plotfor glass
Figure 5.35: Frequency domain plotfor table
Figure 5.36: Frequency domain plotfor table
Figure 5.37: Frequency domain plotfor table
Figure 5.38: Frequency domain plotfor table
39
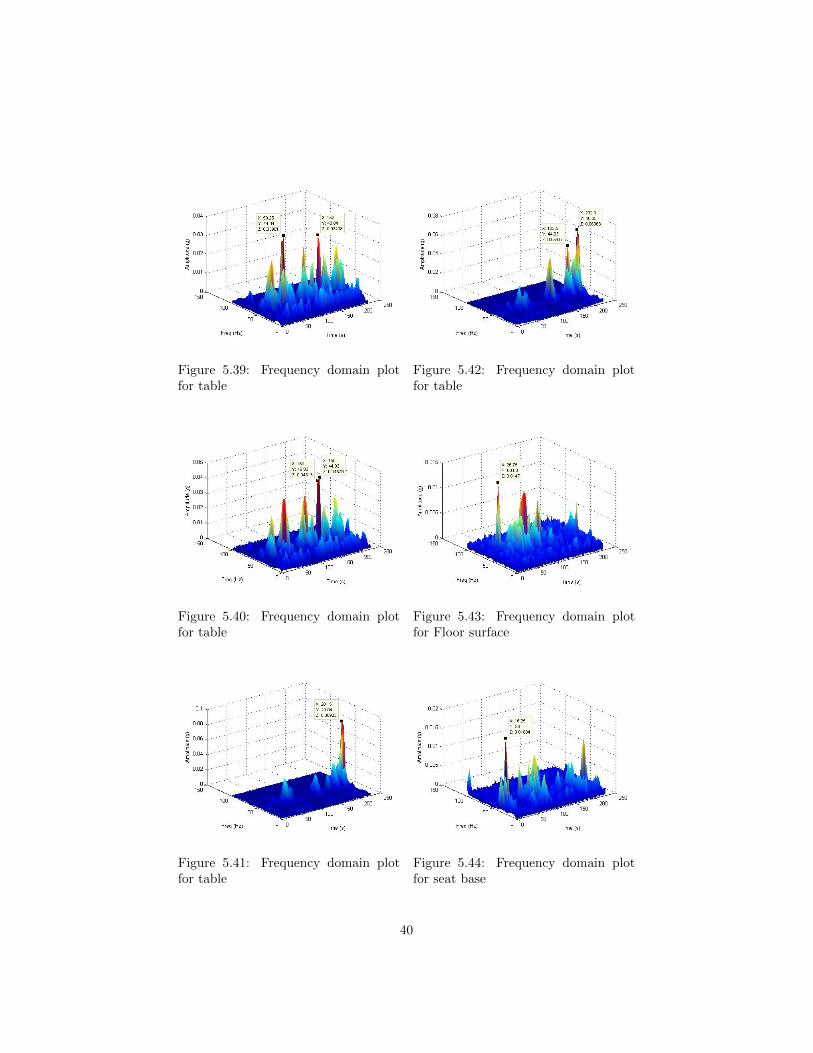
Figure 5.39: Frequency domain plotfor table
Figure 5.40: Frequency domain plotfor table
Figure 5.41: Frequency domain plotfor table
Figure 5.42: Frequency domain plotfor table
Figure 5.43: Frequency domain plotfor Floor surface
Figure 5.44: Frequency domain plotfor seat base
40

Figure 5.45: Frequency domain plotfor seat base
Figure 5.46: Frequency domain plotfor seat base
Figure 5.47: Frequency domain plotfor seat base
Figure 5.48: Frequency domain plotfor seat vertical support
Figure 5.49: Frequency domain plotfor seat vertical support
Figure 5.50: Frequency domain plotfor seat vertical support
41
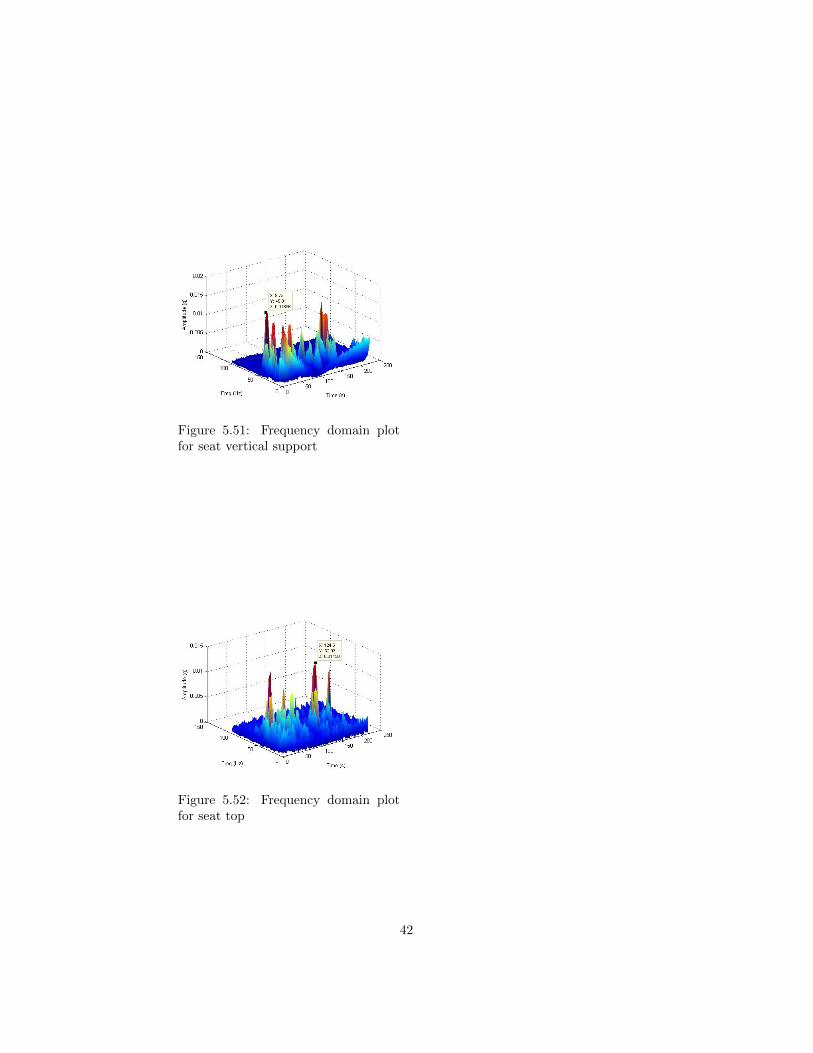
Figure 5.51: Frequency domain plotfor seat vertical support
Figure 5.52: Frequency domain plotfor seat top
42

5.5.3 Generalizations
Thus, after all the analysis of the vibration measurements, the data can beinterpreted and generalized. When observed carefully, one will find that thefrequency presence in the stairs is mostly dominant at 8Hz consistently. Thepeaks which appear on the plots are caused by the passage of people over thestairs and every time the passage produces an 8Hz vibration on the stairs.The magnitude however varies according to the location and the method ofattachment of the SlamStick devices, but they can be said to be consistentlyconcentrated on 8Hz. Similarly, on the bridge, the table tops are consistentaround the 44Hz region. Most of the deviations around it are at 40Hz and48Hz. Thus, the vibrations on the table can be considered to be concentratedat 44Hz. Another location where on the bridge more consistent results are foundare the glass panes on the windows. A careful observation will reveal that almostalways, there are 12Hz components of vibrations present on the glass panes alongwith some other frequency components. In the case of the windows, it has to befound out whether the vibrations are due to the wind/vehicle movement or thepeople. Some experiments in this regard revealed that the vibrations at 12Hzare indeed ones due to the people and not due to the wind and the vehicles.For this a control experiment was done in the absence of wind and vehicularmovement and still the 12Hz peaks were found when people passed through thebridge. Data files for those experiments can be found in the glasses 2 folder.
As the frequency components have been generalized, we can use our tunedPEH25W devices to harvest energy from these locations where 12Hz, 44Hz and8Hz are dominant frequencies.
43

Chapter 6
Power Analysis
After characterization of the vibration sources in the campus and selecting lo-cations where the frequency is consistent and the magnitude of vibrations con-siderable, the project involved calculating the power generated by the situationsbased on the data in Chapter 5. The procedure of making the power measure-ments has already been covered in 3.2.6. The reader is advised to go throughthe procedure to try to reproduce the data given in this chapter or to performnew experiments of her/his own. The power measurements are basically donein three locations: the table top, the glass panes and the stairs as these threelocations were the only ones where consistent frequencies were found.
6.1 Maximum power for Stairs
The Table 6.1 gives the observations from the experiments performed.
6.2 Maximum power for Glass Panes
The Table 6.2 gives the observations from the experiments performed.
a(g) Voc(V) Voc/2(V) R′
L in MΩ RL in MΩ Pmax in µW0.013 7.6 3.8 4.5 3.103 4.650.017 13.31 6.65 2.26 1.84 24.030.023 14.45 7.225 0.223 0.218 239.30.029 14.45 7.225 0.127 0.124 410.050.035 14.45 7.225 0.086 0.086 601.050.045 14.45 7.225 0.072 0.072 723.000.052 14.45 7.225 0.056 0.056 917.409
Table 6.1: Power measurements for stairs
44

a(g) Voc(V) Voc/2(V) R′
L in MΩ RL in MΩ Pmax in µW0.0144 2.9 1.45 6.41 3.92 0.530.0156 2.965 1.482 4.64 3.16 0.690.0172 2.747 1.373 6.41 3.92 0.480.0233 5.739 2.869 8.98 4.73 1.740.026 6.19 3.09 6.41 3.92 2.440.029 10.97 5.485 8.98 4.73 6.360.030 10.88 5.44 7.94 4.42 6.690.0367 14.44 7.22 1.43 1.25 41.700.084 14.46 7.23 0.434 0.434 120.44
Table 6.2: Power measurements for glass panes
a(g) Voc(V) Voc/2(V) R′
L in MΩ RL in MΩ Pmax in µW0.027 0.554 0.227 2.88 2.24 0.030.035 1.190 0.595 2.88 2.24 0.150.083 2.750 1.382 2.50 2.00 0.954
Table 6.3: Power measurements for Table Top
6.3 Maximum power for Table Tops
The Table 6.3 gives the observations from the experiments performed.As seen, considerable power is harvested only in the case of the stairs and
marginally in the case of glass panes. Table top measurements were not taken inmore number because at a considerably high acceleration still, it was producingtiny power lesser than 1µW .
45

Chapter 7
Conclusion
With the results of the previous chapter, we can see that considerable poweris generated by the PEH25W devices in the situation of stairs and to a certainextent on the bridge as well. Now this power has to be voltage conditionedso that it can be usefully fed to a LPSN to transmit packets. This process iscrucial as the intermediate circuitry can be one of low efficiency and cause theconsiderable part of the harvested energy to be lost. A high efficiency voltageconversion circuit will hence give enough power to the LPSN to send packets andrealize the goal of implicitly transmitting information about the occurrence ofthe event of vibration. Some of the ICs and the circuits involving them discussedin Chapter 4 can be solutions to this and can provide different efficiency levelsaccording to the design parameters.
7.1 Low Frequency Vibrations
It is seen in the course of the presented work that the low frequency vibrationsproduce high power at same acceleration values as compared to high frequencyvibrations. This is because the relation between acceleration, amplitude andfrequency is given by (assuming a simple harmonic model)a = ω2Awhere a is the acceleration, ω is the angular frequency of vibration and A isthe amplitude of vibration. Thus, for low ω, the same a means more ampli-tude A. This is a particularly favourable case in terms of applications whereone is interested in structural vibrations as in earthquakes etc. because thesevibrations are of extremely low frequency and contain lot of energy which canbe harvested by appropriately customized piezoelectric beams. In general, theearthquakes have their second mode of vibrations inside the 5Hz range. So, ifthe devices which harvest energy(in our case the PEH25W) can be tuned to afrequency lesser than 5Hz, the amount of energy produced will be quite enoughfor our applications.
46

7.1.1 Caution
A word of caution may be noted with the low vibrations. It is that because ofthe nature of tuning the PEH25W to lower frequencies, the beam length hasbeen extended considerably to a length almost double the initial length of thecantilevered beam. Thus, the tip displacement now is significant even at lowamplitude vibrations. Care has to be taken thus that the vibrations do not in-duce such high displacements that the piezoelectric beam cracks or is damagedin any way. For this, displacement limiters can be put on the path of the vibra-tion displacement of the tip of the beam to limit the vibrations to a maximum ofa particular value. This will not affect the power produced but will protect theequipment from being damaged in case of shock or abnormally high amplitudeof low frequency vibrations. The absolute maximum displacement values arepresent in the Volture datasheet, which may be referred for the positioning ofthese limiters.
7.2 Further Ideas
There are further ideas that were not implemented during the course of thisproject. Some of them could be done by the succeeding researcher in this fieldand they may produce some interesting information to consider. One of thethings which can be improved on is the locations which were surveyed for thepurpose of energy harvesting. Some other locations than those covered in thisdocument can be poles on the side of the roads with traffic, wooden floor of aroom or pathway etc. Also, a more careful attention to the civil engineeringliterature of earthquake and other type of vibrations on buildings will be usefuland may help crucially in the design of energy harvesting systems particularlyfor monitoring of buildings and other structures in case of such natural eventsetc.
7.3 Papers consulted
A list of literature surveyed in the course of this project and which in part orin whole helped in gaining new insights is given here.
Studies on vibrations : [17, 10, 8, 7]
Vibration Energy Harvesting sources : [4]
Vibration Energy Harvesting systems : [6, 3, 12, 15, 9, 2, 5]
Low power Electronics : [11, 12, 9, 16, 13, 1]
47

Bibliography
[1] R. Amirtharajah and A.P. Chandrakasan. Self-powered signal processingusing vibration-based power generation. Solid-State Circuits, IEEE Journalof, 33(5):687 –695, may 1998.
[2] S Beeby, M Tudor, R Torah, E Koukarenko, S Roberts, T O’Donnell, andC Saha. Macro and micro scale electromagnetic kinetic energy harvestinggenerators. In DTIP, 2006.
[3] S P Beeby, R N Torah, M J Tudor, P Glynne-Jones, T O’Donnell, C RSaha, and S Roy. A micro electromagnetic generator for vibration energyharvesting. Journal of Micromechanics and Microengineering, 17(7):1257–1265, July 2007.
[4] SP Beeby, MJ Tudor, and NM White. Energy harvesting vibrationsources for microsystems applications. Measurement Science and Tech-nology, 17(12):R175–R195, December 2006.
[5] Challa, Prasad, and Fisher. Resonant frequency tunable vibration energyharvesting device.
[6] Samuel C Chang. A 1-mW vibration energy harvesting system for mothflight-control applications. PhD thesis, Massachusetts Institute of Technol-ogy, 2010.
[7] Osama Hunaidi and Martin Tremblay. Traffic-induced building vibrationsin montral. Canadian Journal of Civil Engineering, 24:736–753, 1997.
[8] H. E. M. Hunt. Stochastic modelling of traffic-induced ground vibration.Journal of Sound and Vibration, 144(1):53 – 70, 1991.
[9] Seok-Min Jung and Kwang-Seok Yun. Energy-harvesting device with me-chanical frequency-up conversion mechanism for increased power efficiencyand wideband operation. 96(11):111906, 2010.
[10] Monica D. Kohler. Earthquake and ambient vibration monitoring of thesteel-frame ucla factor building. Earthquake spectra, 21:715, 2005.
48

[11] Ye-Sheng Kuo, Sonal Verma, Thomas Schmid, and Prabal Dutta. Hijackingpower and bandwidth from the mobile phone’s audio interface. In Proceed-ings of the First ACM Symposium on Computing for Development, ACMDEV ’10, pages 24:1–24:10, New York, NY, USA, 2010. ACM.
[12] Cheuk Yi Lam. A novel design in harvesting energy from operating ma-chines by converting their generated waste energies to electricity. Master’sthesis, City University of Hong Kong, 2008.
[13] Rajasekaran, Hande, and Bhatia. Buck-boost converter based power con-ditioning circuit for low excitation vibrational energy harvesting.
[14] Shad Roundy, Paul K. Wright, and Jan Rabaey. A study of low levelvibrations as a power source for wireless sensor nodes. Computer Commu-nications, 26:1131 –1144, July 2003.
[15] S. Scherrer, D.G. Plumlee, and A.J. Moll. Energy scavenging device in ltccmaterials. In Microelectronics and Electron Devices, 2005. WMED ’05.2005 IEEE Workshop on, pages 77 –78, april 2005.
[16] Y K Tan, J Y Lee, and S K Panda. Maximize piezoelectric energy har-vesting using synchronous charge extraction technique for powering au-tonomous wireless transmitter. 2008 IEEE International Conference onSustainable Energy Technologies, pages 1123–1128, 2008.
[17] J.D. Turner and A.J. Pretlove. A study of the spectrum of traffic-inducedbridge vibration. Journal of Sound and Vibration, 122(1):31 – 42, 1988.
49