summary - shodhgangashodhganga.inflibnet.ac.in/bitstream/10603/34182/17/17_summary.pdf · models on...
TRANSCRIPT
1
SUMMARY
of the thesis
SOUND TRANSMISSION THROUGH LIGHTWEIGHT PANELS
Submitted to the
CH. CHARAN SINGH UNIVERSITY, MEERUT
For the Award of the Degree of
DOCTOR OF PHILOSOPHY in
PHYSICS by
DHARM PAL SINGH
Under the Joint Supervision of
Supervisors:
Dr. R. S. UPADHAYAY Dr. MAHAVIR SINGH Associate Professor Principal Scientist Department of Physics, Acoustics, Ultrasonics & Vibration Section D. A. V. PG College, National Physical Laboratory Bulandshahr 203001 (UP) Dr. K. S. Krishnan Road New Delhi 110012
MAY 2012
2
DECLARATION
I (Dharm Pal Singh) hereby declare that the Thesis entitled “Sound
Transmission Through Lightweight Panels” to be submitted for the Degree
of Doctor of Philosophy in Physics is my original work and the Thesis has not
been formed the basis for the award of any degree, diploma, associateship,
fellowship of similar other titles. It has not been submitted to any other
University or Institution for the award of any degree or diploma.
Place: Bulandshahr Signature of the Scholar
Date: May 2012 (Dharm Pal Singh)
3
CONTENTS
DECLARATION 2 1 INTRODUCTION 4
2 LITERATURE REVIEW 4
2.1 Studies on Sound transmission prediction models 5
2.2 Material behaviour study of sound transmission 6
2.3 Sound Studies on using agricultural waste in building materials 9
3 OBJECTIVE AND SCOPE OF WORK 9
4 DESCRIPTION OF THE RESEARCH WORK
4.1 Experimental Investigation 10
4.2 Details of transmission loss suite 10
4.3 Details of instrumentation and experiments 11
4.4 Sound reduction index of the TL suite 15
4.5 Measurement of flanking transmission 16
4.6 Evaluation of Sound Reduction Index 17
4.7 Measurement of longitudinal wavespeed (cL) 18
4.8 Measurement of loss factor (η) 18
5 STUDIES ON TRANSMISSION OF SOUND TROUGH
MATERIALS AND BUILDING COMPONENTS
5.1 Material details 19
5.2 Test conditions 20
5.3 Theoretical prediction model using SEA 23
5.4 Real time simulation results using ODEON 26
6 RESULTS AND DISCUSSIONS 27
7 CONCLUSIONS 33
REFERENCES 34
LIST OF PUBLICATIONS 38

4
1. Introduction
Sound transmission in buildings is a problem that exists in many countries
and many different solutions are adopted to achieve acceptable levels of sound
insulation. In recent days usage of light weight building structures are widely used
by construction industry for easier and cost effective method. With the expansion of
real estate activities and newer building materials the need to attend the sound
insulation requirements for both structure borne and airborne sound also assumes
greater dimensions. The problem however is closely associated with several aspects
of building construction, which include its layout, types of materials used in
construction and other building service requirements. Apart from conventional
materials, studies have undergone with the use fibre reinforced ferrocement panels
in the construction. This type of construction exhibits easier and cost effective
optimized solutions. Fibres used with ferrocement panels provide better natural
performance on strength and thermal insulation behavior too. This property
enhances the energy efficient character of the building; nevertheless in an acoustical
sense the studies are not very informative which require deeper investigation.
Annoyance of structure borne and airborne sound are major problems that
are faced by people in buildings. Properly designed and constructed methods will
always provide a comfortable acoustical environment. All significant paths of
transmission must be considered for sound transmission within the building as well
as noise intrusion from outside the building.
2. Review of Literature:
Sound insulation of partitions has been a subject of systematic, scientific
investigation for the last 100 years. The early papers were concentrated on the
infinite walls, as they were easier to treat by analytical methods. The treatment of
finite size walls with cavities were first concentrated on the high frequency range
and statistical description of sound field (the concept of diffuse field) was
employed. The low frequency range was long considered as less important in the
context of building partitions, as the human sensitivity to sound decreases strongly
5
at low frequencies. However, the increased amount and efficiency of sources of low
frequency sound in buildings has drawn the attention of researchers and the
standardization committees to sound transmission. The use of mechanical
ventilation systems, increased amount of household appliances in dwellings,
improved efficiency of stereo systems, and the ever increasing density of traffic, all
contributed to the increase levels of noise in buildings. Some important studies
dealing with transmission of sound through structures are due to Cremer and Heckl
(1984) [10], Lyon and Dejong (1995) [28] and Craik (1998) [8, 9].
2.1. Studies on Sound transmission prediction models:
The sound insulation in buildings has been studied based on prediction
models on the concept of energy balance such as Statistical Energy Analysis (SEA).
This concept has been adopted for enhancing accuracy of sound transmission by
Craik (1982) [5].
Craik, (1998) [8, 9] investigated the structure borne sound transmission in
lightweight buildings using SEA. Reducing the mass as a means of sound
transmission in buildings led to the development of lightweight buildings. A higher
level of sound insulation was achieved by introducing discontinuities whilst
retaining structural integrity. For direct transmission through lightweight partitions
the nature of connection between the lightweight cladding and the frame determines
the nature of structural coupling. The coupling can be modeled as either a series of
point connections or line connections. If flanking transmission was included then
the complexity of model increases.
Vigran, (2010) [40] investigated a simple method to account for the effect of
point- and line-connections in double-leaf constructions in a transfer matrix setup.
To cover the frequency range above the critical frequency of the constituent plates,
some new developments as to the forced radiation from plates were considered. A
number of comparisons had been performed, mainly with the measured sound
reduction index of lightweight double walls with gypsum boards. Cases include
walls with cavity filling as well as with empty (air-filled) cavities. In the latter
6
cases, the energy losses of the cavity were simulated using a model of a porous
layer with a minute flow resistivity.
Ran Zhou (2010) [34] has studied the comparisons between the experimental
and predicted sound transmission loss values obtained from statistical energy
analysis are presented for two foam-filled honeycomb sandwich panels. The
accuracy of the prediction of the sound transmission loss using SEA greatly
depends on accurate estimates of: (1) the modal density, (2) the internal loss factor,
and (3) the coupling loss factor parameters of the structures. A theoretical
expression for the modal density of sandwich panels is developed from a sixth-order
governing equation. Measured modal density estimates of the two foam-filled
honeycomb sandwich panels are obtained by using a three-channel spectral method
with a spectral mass correction to allow for the mass loading of the impedance head.
The effect of mass loading of the accelerometer is corrected in the estimations of
both the total loss factor and radiation loss factor of the sandwich panels.
2.2. Material behaviour study of sound transmission:
In case of lightweight elements direct method was used to measure the
sound transmission and the magnitudes of inaccuracies involved in its use were
estimated. Testing was conducted on the anechoic chamber and the application of
the method to actual constructions was also tested.
There is a lack of published data on fibre reinforced ferrocement panels with
sound transmission class (STC) ratings. As part of consideration of Sound
transmission many materials like dry walls are attached to the structures to improve
their sound insulation. Measurements reported in the literature shows up to 100 Hz
or 125 Hz in case of ISO-140-3 (1995) [19]. Low frequency sound is equally
annoying and hence sound transmission loss at low frequency is also required.
Ferrocement panels are generally employed as internal partitions as well as
high performance walls separating internal to external environment. When properly
designed these partitions give reasonably good insulation (DIN4109-1989, [12].

7
Sometimes the sound reduction index gets affected by joints between the wall
structures.
Narang, (1992) [33] determined the acoustic performance of stud-framed
lightweight partition walls which are strongly affected by the presence or absence of
sound absorbing materials in the cavity. Fibreglass, a commonly used cavity
absorbent has come under criticism over potential health hazards owing to its
fibrous nature. Here some low cost alternatives that can be used for providing cavity
absorption in walls and offer sound insulation similar to fibreglass have been
studied. STC rating of 4 points was observed by using different cavity absorbents,
with options offering STC ratings similar to those achieved with conventional
fibreglass. The effect of adding an extra layer of plasterboard with a corresponding
equivalent sound reduction in the stud width was also studied.
The uses of rubber and plastic for sound insulation of party walls and floors
have been discussed by Craik, (1992) [7]. They are used as mainly in case of walls
and floors in buildings where in sound transmission takes place to a greater extent,
by using this material maximum amount of sound insulation is achieved. It was seen
that considerable reduction in weight of the building was achieved by the use of
resilient layers and these layers have to be designed carefully.
The number of components was relatively large as in the range of possible
designs. In either case the typical systems were to be identified and should be
included to determine the best method of modeling the coupling.
The consequence of lightweight buildings on sound transmission was
investigated by Craik, (1998) [8,9]. Changes in the building practice have led to an
increased use of lightweight components in modern buildings. Lightweight walls
and floors do not rely on mass to prevent sound transmission, which required the
knowledge of lightweight material used and the details of construction. Both
experimental and theoretical models are becoming important in the design of
lightweight buildings for sound transmission.
Sean Smith, (1997) [38] investigated the sound transmission through
lightweight parallel plates made of plasterboard and plasterboard combinations.

8
Double walls with plasterboard and line connected frame with chipboard and
plasterboard as parallel plates were studied using experiments and theoritical
approach such as SEA. Experiments were carried out to determine the sound
transmission into the double wall cavities and isolated cavities. Parametric surveys
were undertaken to analyse changes to the sound transmission through these
structures when the material or changes to the sound transmission through these
structures when the material or design parameter is altered.
Fringuellino and Sean Smith, (1999) [14] investigated the sound
transmission through hollow block walls. They investigated the characteristic
features of sound transmission through hollow walls. They used several different
types of wall of different thickness and materials and the sound reduction index of
the walls were recorded. The effects of additional plaster layers on the wall surface
were also discussed. The material properties of the block’s complex web structure
may strongly influence the sound reduction index at the low and high frequencies.
Kandaswamy (2003) [26, 27, ] has also investigated the sound transmission
through gypsum board panels, wood board panels, cavity ferrocement panels and
different type of walls and the sound reduction index, loss factor and transmission
loss are investigated.
Del Coz Díaz .J (2010) [11] investigated the most efficient numerical procedure
to predict the transmission loss (TL) through a multilayer wall for frequencies
ranging from 100 to 5000 Hz. The wall is made of lightweight concrete hollow
bricks joined by mortar, with gypsum lining on both faces. A set of tests using
source and receiving chambers have been modelled according to the basic
requirements of the ISO 140-1[18] standard rule and ISO 717-1[20] standard rule.
The convergence and accuracy of the proposed method are then assessed by
comparing FEM results with experimental measurements carried out by a certified
laboratory. Finally, the numerical procedures implemented in this work are used to
evaluate the acoustic behaviour for other structural building elements and reduce the
manufacturing time to develop new products in construction
9
2.3. Studies on using agricultural waste in building materials
Presently in India, about 960 million tonnes of agricultural waste is being
generated annually as by-products during industrial, mining, municipal, agricultural
and other processes. Of this 350 million tonnes are organic wastes from agricultural
sources; 290 million tonnes are inorganic waste of industrial and mining sectors and
4.5 million tonnes are hazardous in nature (Mannan et. al., 2001) [30]. Advances in
agricultural waste management resulted in alternative construction materials as a
substitute to traditional materials like bricks, blocks, tiles, aggregates, ceramics,
cement, lime, soil, timber and paint.
Researchers like Mannan, Daryl, Achyutha, Kurian have carried out in the
past used agriculture wastes such as saw dust ash, rice husk ash, palm-oil fuel ash
and bagasse ash as a replacement for cement. Natural fibres can be used in concrete
to produce particle boards, roofing sheets, and partition panels. Agricultural wastes
can also be used in non-load bearing concrete (Mannan et.al., 2001) [29] where
compressive strength is not important. Recently, an attempt has been made to use
Oil Palm Shell (OPS) as coarse aggregate in structural concrete (Mannan et.al.,
2001) [30]. In low-cost lightweight structures, agricultural waste as coarse
aggregate together with cement matrix can meet design specifications (Mannan
et.al., 2004) [31].
Although these researches are providing encouraging results, the lightweight
concrete mixes with coconut shell (CS) aggregate have not been investigated.
Concrete with CS as coarse aggregate can be used for the production of hollow-
blocks, ferrocement panels, and lightweight concrete and structural members of
low-cost houses. Hence, it is necessary to identify the potential use of coconut shell
for value added products.
3 OBJECTIVE AND SCOPE OF WORK
The principle objective of the work is to study the sound transmission
behavior of newer types of materials used in construction industry with respect to
acoustic insulation or transmission properties.
10
The scope of work includes;
(i) The design and construction of a transmission loss suite to study the
transmission properties of building elements.
(ii) The study is limited to the experimental investigation of acoustical
transmission behavior and sound insulation properties of coconut shell
impregnated hollow blocks and reinforced ferrocement panels and panels
lined with wood wool boards and fibre reinforced panels.
(iii) The study is extended to the properties and effects of T L and cross
junctions.
(iv) To develop a software program using the principles of Statistical Energy
Analysis.
4 DESCRIPTION OF THE RESEARCH WORK
4.1. Experimental Investigation
(Design of Transmission Loss Suite and Experiments)
This chapter deals with the details of the design and construction of
transmission loss suite, measurement details in respect of materials studied, and
other instrumentation aspects involved. Other than the construction of transmission
suite, principal measurements made are sound reduction index of different
construction materials, longitudinal wavespeeds in different materials, and loss
factors associated with them.
4.2 Details of Transmission Loss Suite (TL Suite)
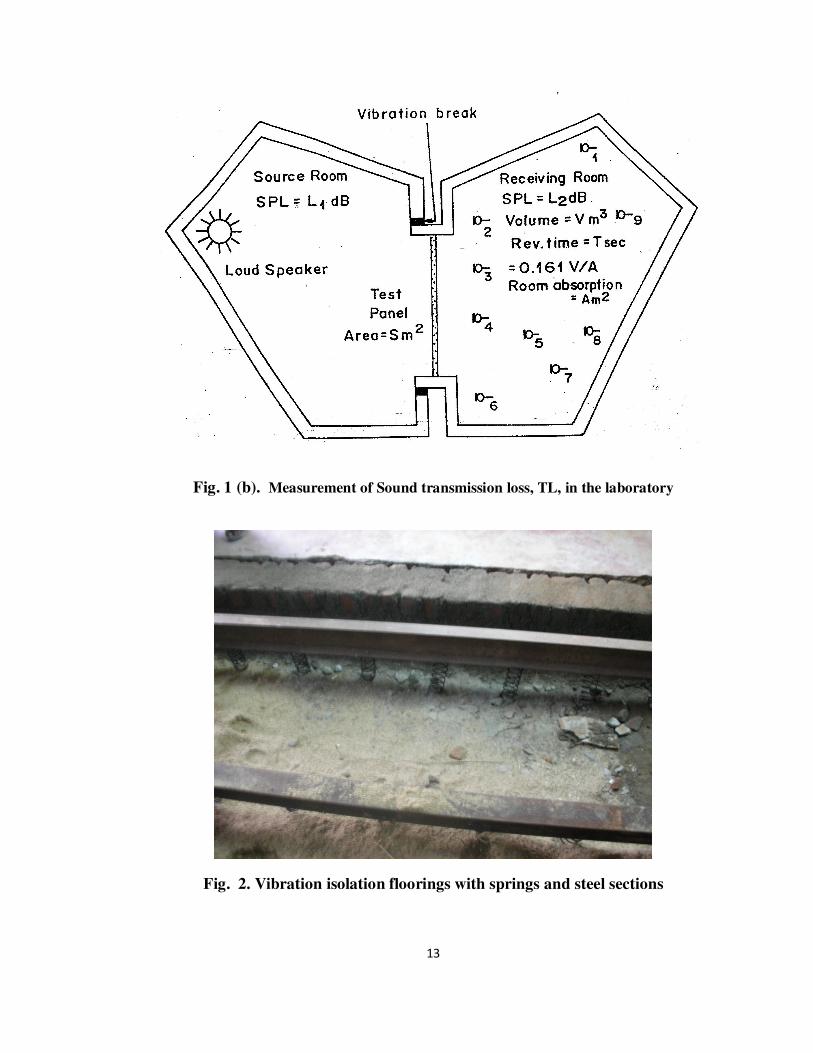
The plan and layout of the experimental set-up for sound transmission loss
suite designed and constructed for experimental investigations are shown in Fig
1(a). and 1(b). The dimensional details are indicated in figures. The TL
measurements were carried out by installing the specimens in the specimen frame of
normal size 0.94 x 0.64 m between the two reverberation rooms at the Acoustics
Section, National Physical Laboratory (NPL). Both the source room and receiving
room in the laboratory are irregular in shape with volumes of approximately 257 m3
and 271 m3 and are equipped with stationary diffusers. The floor of the receiver

11
room is vibration isolated to minimise the flanking transmission. Equipment
included a steady sound source of white noise was produced from noise generator
the noise signal was then fed in to and enhanced by a power amplifier and finally
emitted through a loudspeaker to produce a reverberant sound (diffused) field inside
the source room. Sound pressure levels inside the two rooms were sampled by
means of two sets of ½ inch calibrated microphones type 1220 each coupled with a
microphone pre-amplifier type 1201 and fed to a Norwegian Electronics type 830
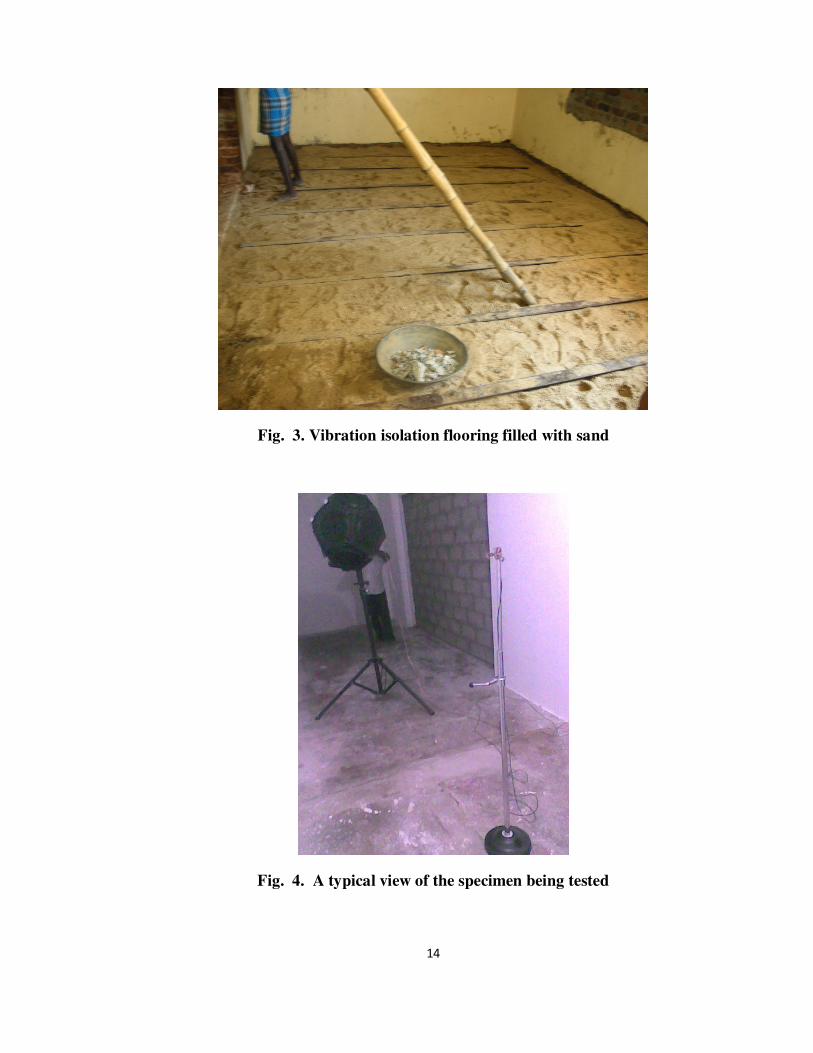
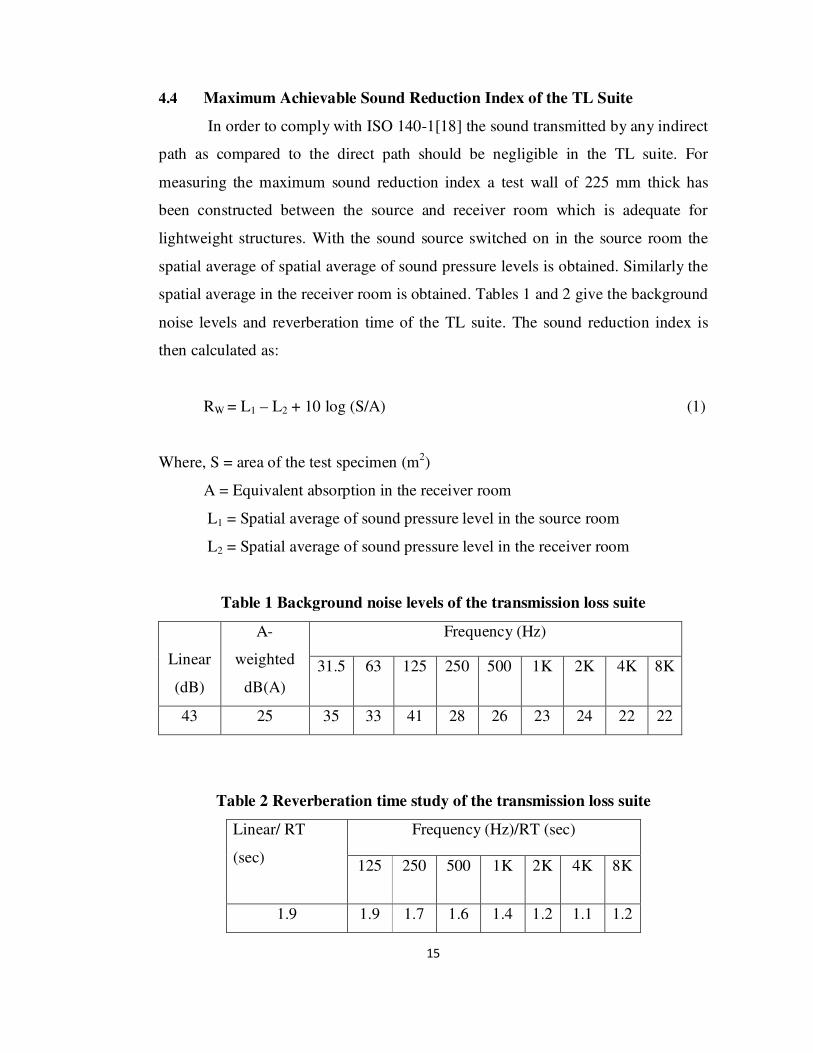
dual channel real-time analyzer (RTA-830) for 1/3 octave band spectrum analysis. This
arrangement is shown in Fig. 2. A sand layer has been laid over the joists and the
flooring is laid over the sand Fig. 3.
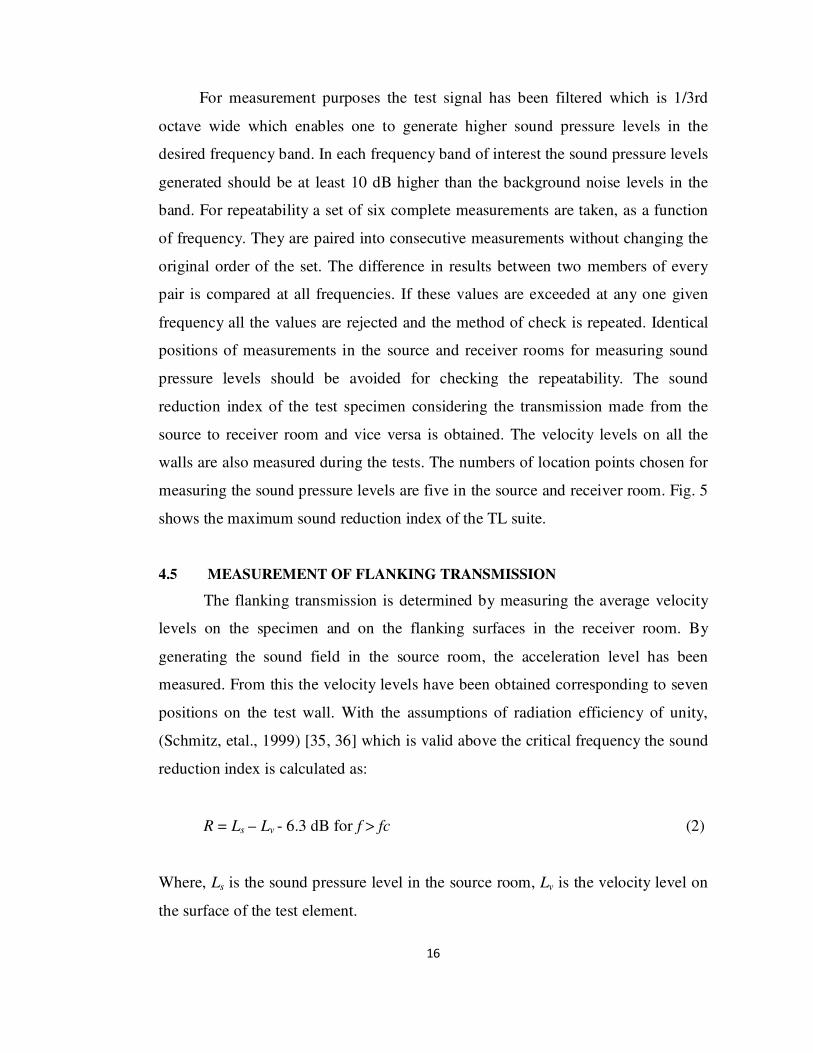
The common opening between the source and receiver room is made up of two
independent wall elements with a 15 mm gap. An acoustic caulking is provided in
the gap, which minimise the transmission of acoustic energy from source to receiver
room. All the experimental specimens have been cast in-situ and are built to the size
of the common opening Fig. 4. The other walls of the source and receiver rooms are
230 mm thick.
4.3 Details of Instrumentation and Experiments
The important equipment used in this study are:
� Sound source [Omni-Directional Speaker System]
� Sound level meter ( Lactron – SL 4001)
� Level recorder and Vibration meter [PHOTON II signal with FFT
analyser]
� ½” inch microphone (DACTRON)
� Accelerometers (DACTRON)
The output of the microphone is connected to the analyser and recorded the
signal using analyser software in personal computer and has been used primarily for
reverberation time measurements. For vibration velocity measurement includes Tri-
axial (sensitivity 10 mV/g) and uni-axial accelerometers (sensitivity 100 mV/g) and
12
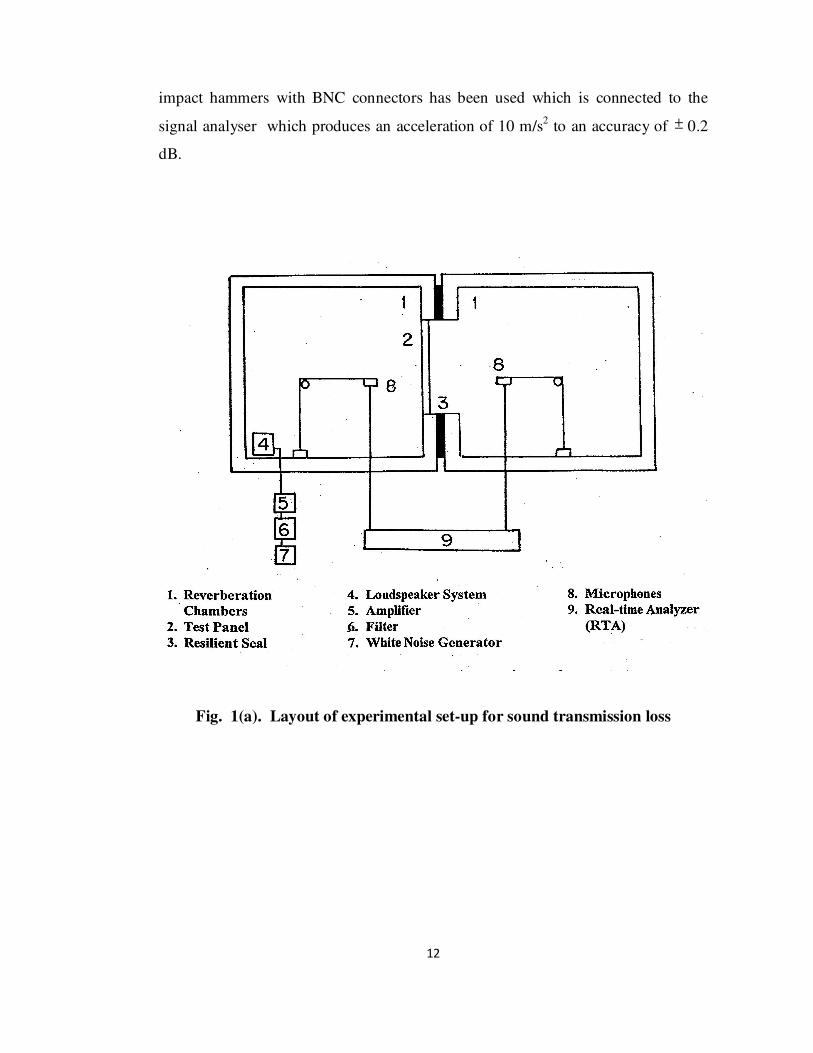
impact hammers with BNC connectors has been used which is connected to the
signal analyser which produces an acceleration of 10 m/s2 to an accuracy of ± 0.2
dB.
Fig. 1(a). Layout of experimental set-up for sound transmission loss
13
Fig. 1 (b). Measurement of Sound transmission loss, TL, in the laboratory
Fig. 2. Vibration isolation floorings with springs and steel sections
14
Fig. 3. Vibration isolation flooring filled with sand
Fig. 4. A typical view of the specimen being tested
15
4.4 Maximum Achievable Sound Reduction Index of the TL Suite
In order to comply with ISO 140-1[18] the sound transmitted by any indirect
path as compared to the direct path should be negligible in the TL suite. For
measuring the maximum sound reduction index a test wall of 225 mm thick has
been constructed between the source and receiver room which is adequate for
lightweight structures. With the sound source switched on in the source room the
spatial average of spatial average of sound pressure levels is obtained. Similarly the
spatial average in the receiver room is obtained. Tables 1 and 2 give the background
noise levels and reverberation time of the TL suite. The sound reduction index is
then calculated as:
RW = L1 – L2 + 10 log (S/A) (1)
Where, S = area of the test specimen (m2)
A = Equivalent absorption in the receiver room
L1 = Spatial average of sound pressure level in the source room
L2 = Spatial average of sound pressure level in the receiver room
Table 1 Background noise levels of the transmission loss suite
Linear
(dB)
A-
weighted
dB(A)
Frequency (Hz)
31.5 63 125 250 500 1K 2K 4K 8K
43 25 35 33 41 28 26 23 24 22 22
Table 2 Reverberation time study of the transmission loss suite
Linear/ RT
(sec)
Frequency (Hz)/RT (sec)
125 250 500 1K 2K 4K 8K
1.9 1.9 1.7 1.6 1.4 1.2 1.1 1.2
16
For measurement purposes the test signal has been filtered which is 1/3rd
octave wide which enables one to generate higher sound pressure levels in the
desired frequency band. In each frequency band of interest the sound pressure levels
generated should be at least 10 dB higher than the background noise levels in the
band. For repeatability a set of six complete measurements are taken, as a function
of frequency. They are paired into consecutive measurements without changing the
original order of the set. The difference in results between two members of every
pair is compared at all frequencies. If these values are exceeded at any one given
frequency all the values are rejected and the method of check is repeated. Identical
positions of measurements in the source and receiver rooms for measuring sound
pressure levels should be avoided for checking the repeatability. The sound
reduction index of the test specimen considering the transmission made from the
source to receiver room and vice versa is obtained. The velocity levels on all the
walls are also measured during the tests. The numbers of location points chosen for
measuring the sound pressure levels are five in the source and receiver room. Fig. 5
shows the maximum sound reduction index of the TL suite.
4.5 MEASUREMENT OF FLANKING TRANSMISSION
The flanking transmission is determined by measuring the average velocity
levels on the specimen and on the flanking surfaces in the receiver room. By
generating the sound field in the source room, the acceleration level has been
measured. From this the velocity levels have been obtained corresponding to seven
positions on the test wall. With the assumptions of radiation efficiency of unity,
(Schmitz, etal., 1999) [35, 36] which is valid above the critical frequency the sound
reduction index is calculated as:
R = Ls – Lv - 6.3 dB for f > fc (2)
Where, Ls is the sound pressure level in the source room, Lv is the velocity level on
the surface of the test element.
17
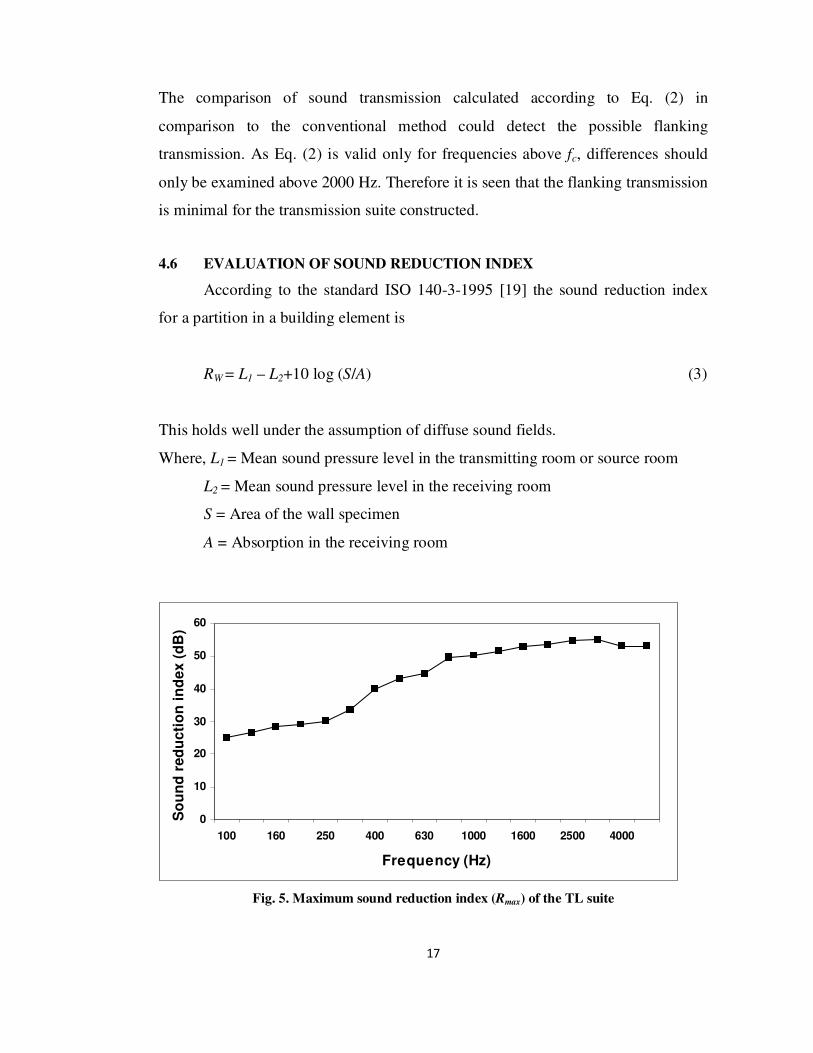
The comparison of sound transmission calculated according to Eq. (2) in
comparison to the conventional method could detect the possible flanking
transmission. As Eq. (2) is valid only for frequencies above fc, differences should
only be examined above 2000 Hz. Therefore it is seen that the flanking transmission
is minimal for the transmission suite constructed.
4.6 EVALUATION OF SOUND REDUCTION INDEX
According to the standard ISO 140-3-1995 [19] the sound reduction index
for a partition in a building element is
RW = L1 – L2+10 log (S/A) (3)
This holds well under the assumption of diffuse sound fields.
Where, L1 = Mean sound pressure level in the transmitting room or source room
L2 = Mean sound pressure level in the receiving room
S = Area of the wall specimen
A = Absorption in the receiving room
Fig. 5. Maximum sound reduction index (Rmax) of the TL suite
0
10
20
30
40
50
60
100 160 250 400 630 1000 1600 2500 4000
Frequency (Hz)
So
un
d r
ed
ucti
on
in
dex (
dB
)
18
By measuring the reverberation time T in the receiving room the absorption area in
the receiving room is
A = 0.163 (V /T) (4)
Fig.5. Shows the maximum sound reduction index of the TL suite.
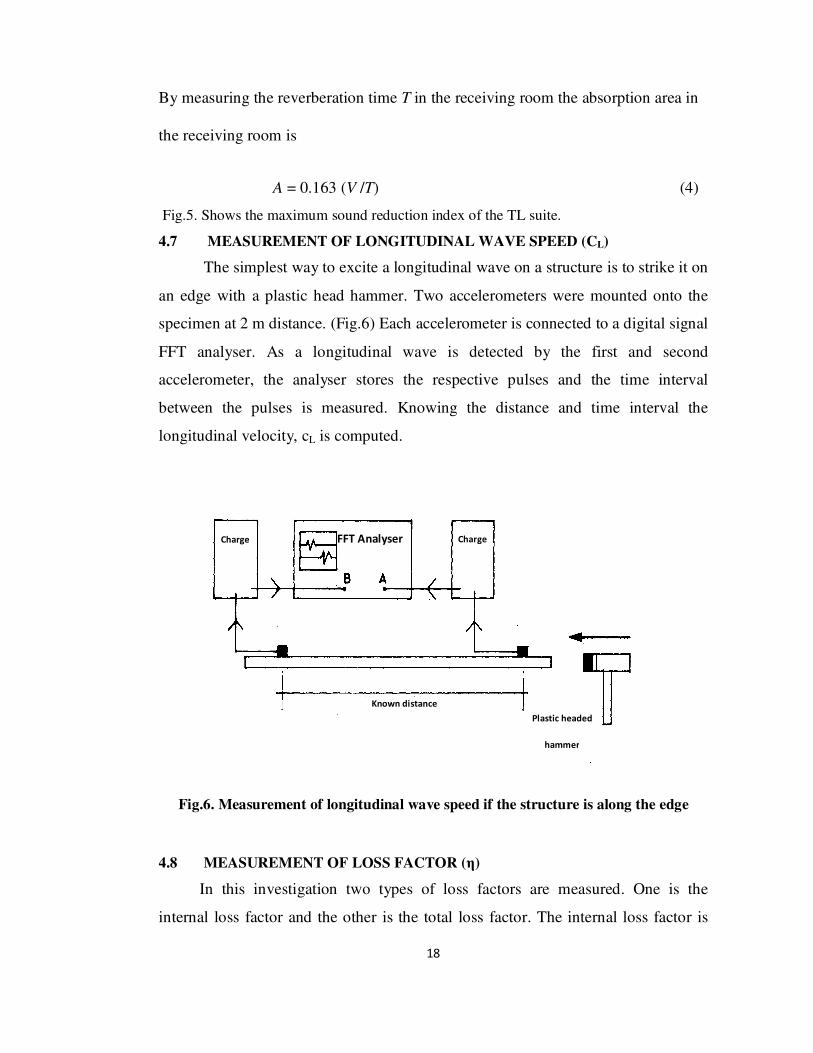
4.7 MEASUREMENT OF LONGITUDINAL WAVE SPEED (CL)
The simplest way to excite a longitudinal wave on a structure is to strike it on
an edge with a plastic head hammer. Two accelerometers were mounted onto the
specimen at 2 m distance. (Fig.6) Each accelerometer is connected to a digital signal
FFT analyser. As a longitudinal wave is detected by the first and second
accelerometer, the analyser stores the respective pulses and the time interval
between the pulses is measured. Knowing the distance and time interval the
longitudinal velocity, cL is computed.
Fig. 3.11 Measurement of longitudinal wave speed
Fig.6. Measurement of longitudinal wave speed if the structure is alo
Fig.6. Measurement of longitudinal wave speed if the structure is along the edge
4.8 MEASUREMENT OF LOSS FACTOR (η)
In this investigation two types of loss factors are measured. One is the
internal loss factor and the other is the total loss factor. The internal loss factor is
Oscilloscope Charge Charge
Known distance
Plastic headed
hammer
FFT Analyser

19
the fraction of energy lost as heat in one radian cycle whereas the total loss factor is
the sum of the coupling and internal loss factor. Fig. 7 shows the experimental
arrangement for measuring the internal loss factor. The accelerometer is fixed to the
panel by using beeswax or anabond glue. The panel is excited from a plastic head
hammer and the vibration velocity output is detected and recorded. The signal from
the accelerometer is fed into conditioning amplifier and passed through tunable
band bass filter. The signal is further fed to the recorder, which records the
structural reverberation time decay. The loss factor (η) is evaluated as
60
2.2
Tf=η (5)
Fig.7. Measurement of structural damping
5 Experimental studies on transmission of sound through materials
and building components
5.1. Materials Details
The materials studied in the TL suite for sound transmissions are:
(i) Coconut shell impregnated Hollow blocks (120 mm, 170 mm, 220 mm)
FFT Analyser
Charge
Plastic headed
Measuring
amp
Test sample
20
(ii) Coconut shell impregnated Hollow blocks (120 mm, 170 mm, 220 mm)
lined with absorbtive material
(iii) Coconut shell Hollow blocks (120 mm, 170 mm, 220 mm) double wall with
cavity thickness of (100 mm, 150 mm, 200 mm)
(iv) Coconut fibre impregnated Ferrocement lined with composite straw board
panels.
(v) Coconut fibre impregnated Ferrocement panels lined with wood wool
boards.
(vi) Coconut fibre impregnated Ferrocement panels lined with absorbtive
materials
(vii) Coconut fibre impregnated Ferrocement panels with cavity thickness of
(100 mm, 150 mm, 200 mm)
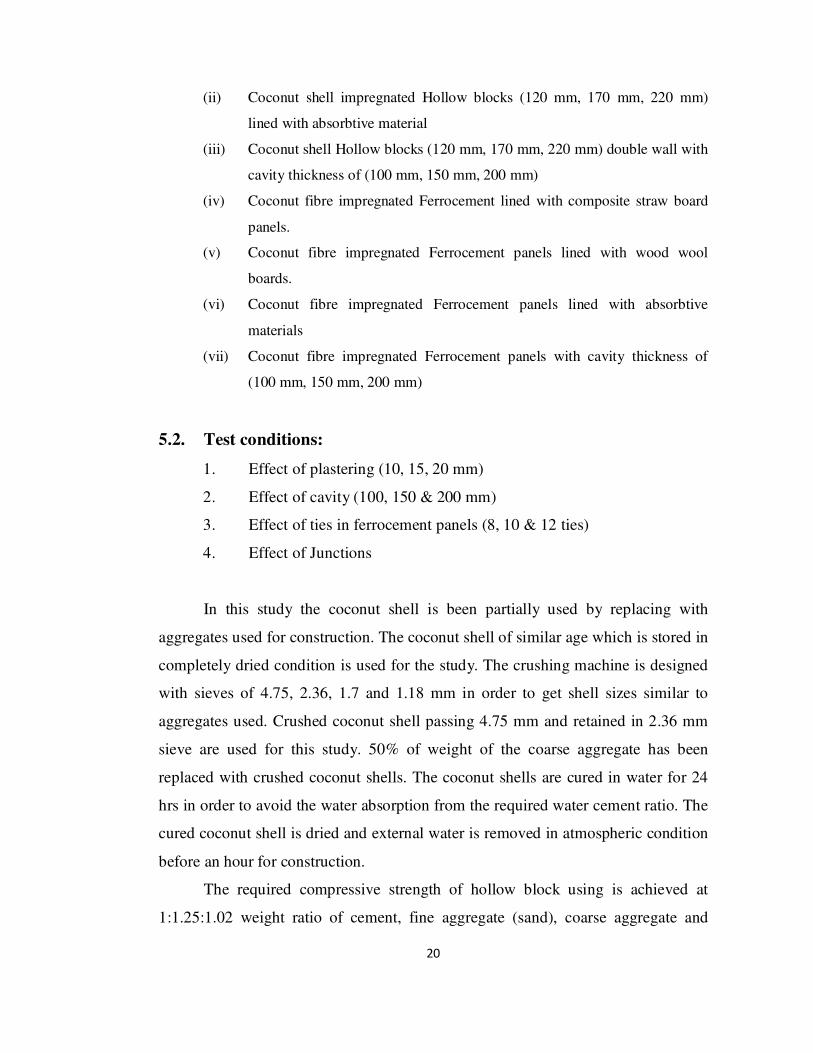
5.2. Test conditions:
1. Effect of plastering (10, 15, 20 mm)
2. Effect of cavity (100, 150 & 200 mm)
3. Effect of ties in ferrocement panels (8, 10 & 12 ties)
4. Effect of Junctions
In this study the coconut shell is been partially used by replacing with
aggregates used for construction. The coconut shell of similar age which is stored in
completely dried condition is used for the study. The crushing machine is designed
with sieves of 4.75, 2.36, 1.7 and 1.18 mm in order to get shell sizes similar to
aggregates used. Crushed coconut shell passing 4.75 mm and retained in 2.36 mm
sieve are used for this study. 50% of weight of the coarse aggregate has been
replaced with crushed coconut shells. The coconut shells are cured in water for 24
hrs in order to avoid the water absorption from the required water cement ratio. The
cured coconut shell is dried and external water is removed in atmospheric condition
before an hour for construction.
The required compressive strength of hollow block using is achieved at
1:1.25:1.02 weight ratio of cement, fine aggregate (sand), coarse aggregate and
21
water cement ratio of 0.4, where 10% of weight of cement is replaced with fly ash
and 51% of weight of coarse aggregate ie, quarry dust is being replaced with
coconut shell. The hollow blocks with standard dimensions of 380 mm x 190 mm
with thickness of 150 mm, 170 mm and 220 mm are made. The study focuses on the
sound reduction index characteristics of coconut shell impregnated hollow blocks
made with coconut shell. The sound reduction index (SRI) has been measured for
twelve different wall surfaces.
Sound reduction index measurements have been made on the samples
constructed inside the transmission loss suite. In case of block walls, studies have
been made on the samples with and without plastered layers and with and without
cavity. Sound reduction index is calculated by taking the spatial average of the
sound pressure levels both in the source and receiver rooms.
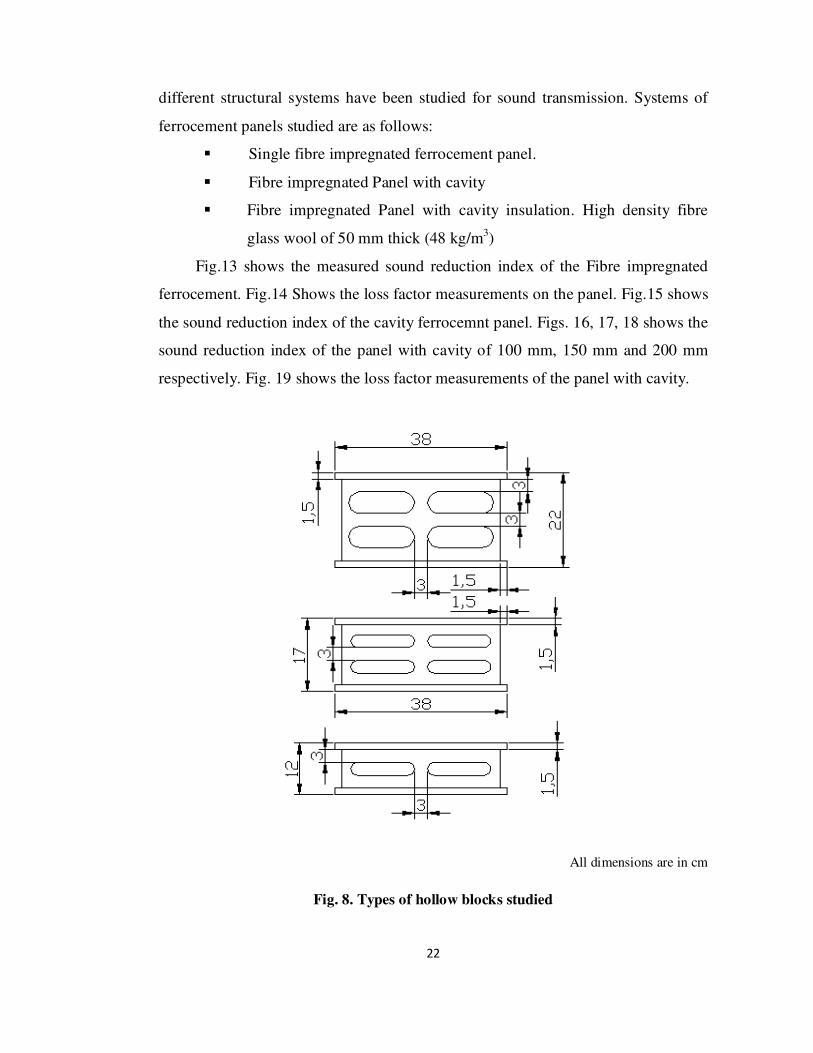
Hollow blocks: Hollow blocks made of using coconut shell of three different
thicknesses have been studied. The test walls have been assembled and constructed
inside the transmission loss suite. Fig.8. gives the types of hollow blocks with the
airspace configurations, which is the important feature influencing the sound
transmission. For plastering, mortar thickness of 10 mm, 15 mm and 20 mm thick
was applied on either sides of the wall. Figs.13, 14, 15 shows the sound reduction
index (SRI) of the hollow blocks. The straight web geometry of the blocks is
resulting in higher sound insulation which is in conformity with other work (Scholl
and Weber, 1998 [37]; Fischer et al, 1998 [13]).
Ferrocement Panels: Fibre impregnated ferrocement panels made of using
coconut shell are tested. The panels are cast in-situ and erected for experimentation.
The material by itself has a better performance than the conventional brickwork and
concrete of high flexural strength and modulus of elasticity. The panel consists of
two layers of chicken mesh of 22 gauge thick with hexagonal opening wound over
on the top of one layer of weld mesh of 10 mm x 10 mm opening (10 gauge thick).
Cement mortar of 1:2 ratios has been used in casting the specimens. The sizes of the
panels cast for testing are 3 mm x 2.1 mm x 20 mm thick. Ferrocement panels with
22
different structural systems have been studied for sound transmission. Systems of
ferrocement panels studied are as follows:
� Single fibre impregnated ferrocement panel.
� Fibre impregnated Panel with cavity
� Fibre impregnated Panel with cavity insulation. High density fibre
glass wool of 50 mm thick (48 kg/m3)
Fig.13 shows the measured sound reduction index of the Fibre impregnated
ferrocement. Fig.14 Shows the loss factor measurements on the panel. Fig.15 shows
the sound reduction index of the cavity ferrocemnt panel. Figs. 16, 17, 18 shows the
sound reduction index of the panel with cavity of 100 mm, 150 mm and 200 mm
respectively. Fig. 19 shows the loss factor measurements of the panel with cavity.
All dimensions are in cm
Fig. 8. Types of hollow blocks studied
23
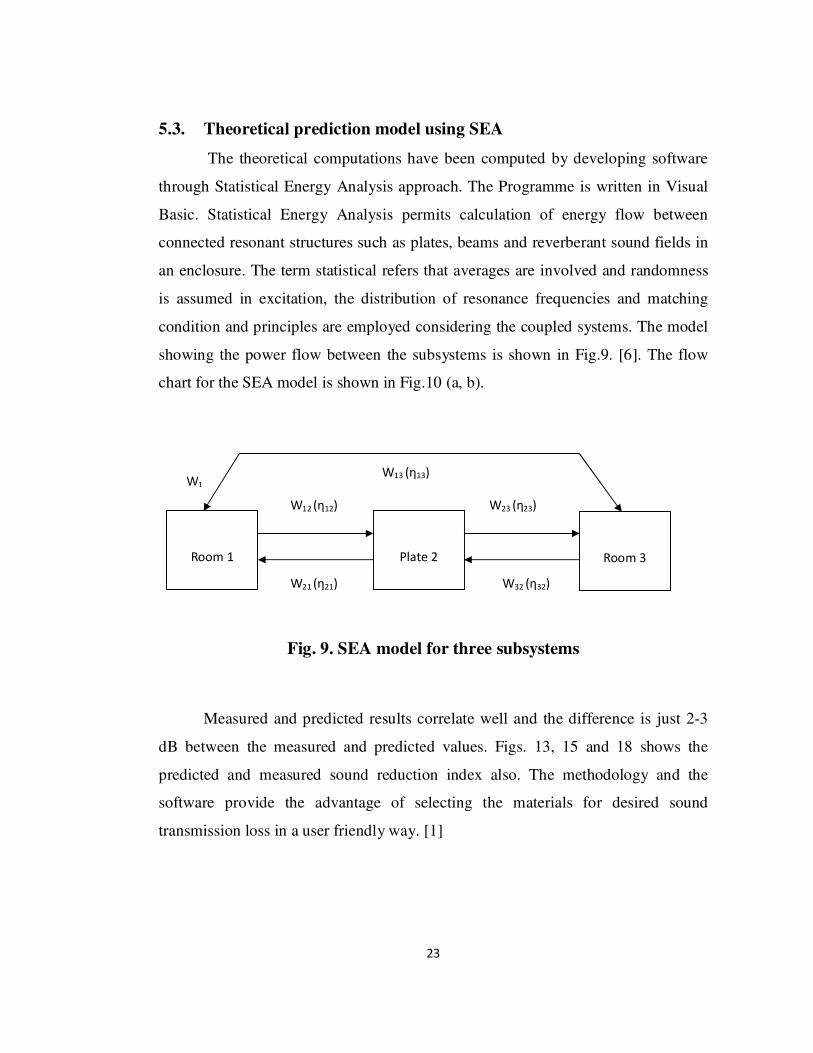
5.3. Theoretical prediction model using SEA
The theoretical computations have been computed by developing software
through Statistical Energy Analysis approach. The Programme is written in Visual
Basic. Statistical Energy Analysis permits calculation of energy flow between
connected resonant structures such as plates, beams and reverberant sound fields in
an enclosure. The term statistical refers that averages are involved and randomness
is assumed in excitation, the distribution of resonance frequencies and matching
condition and principles are employed considering the coupled systems. The model
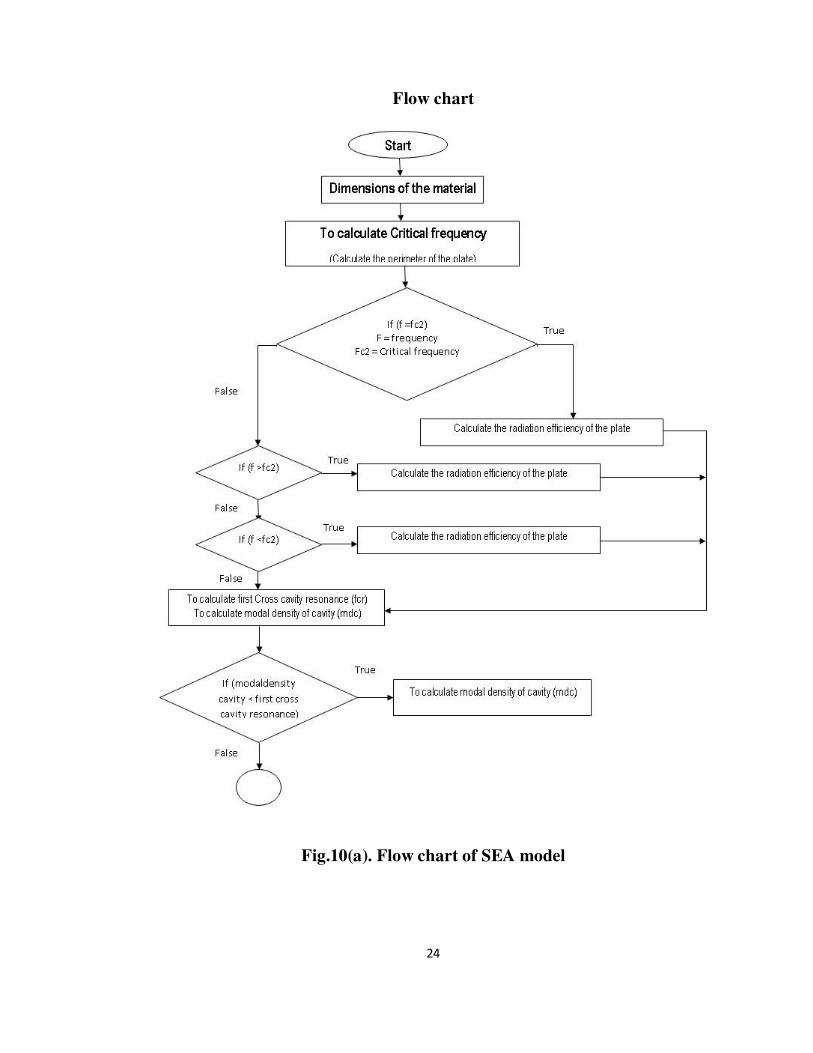
showing the power flow between the subsystems is shown in Fig.9. [6]. The flow
chart for the SEA model is shown in Fig.10 (a, b).
Fig. 9. SEA model for three subsystems
Measured and predicted results correlate well and the difference is just 2-3
dB between the measured and predicted values. Figs. 13, 15 and 18 shows the
predicted and measured sound reduction index also. The methodology and the
software provide the advantage of selecting the materials for desired sound
transmission loss in a user friendly way. [1]
Room 1
Plate 2
Room 3
W1
W12 (η12) W23 (η23)
W21 (η21) W32 (η32)
W13 (η13)
24
Flow chart
Fig.10(a). Flow chart of SEA model
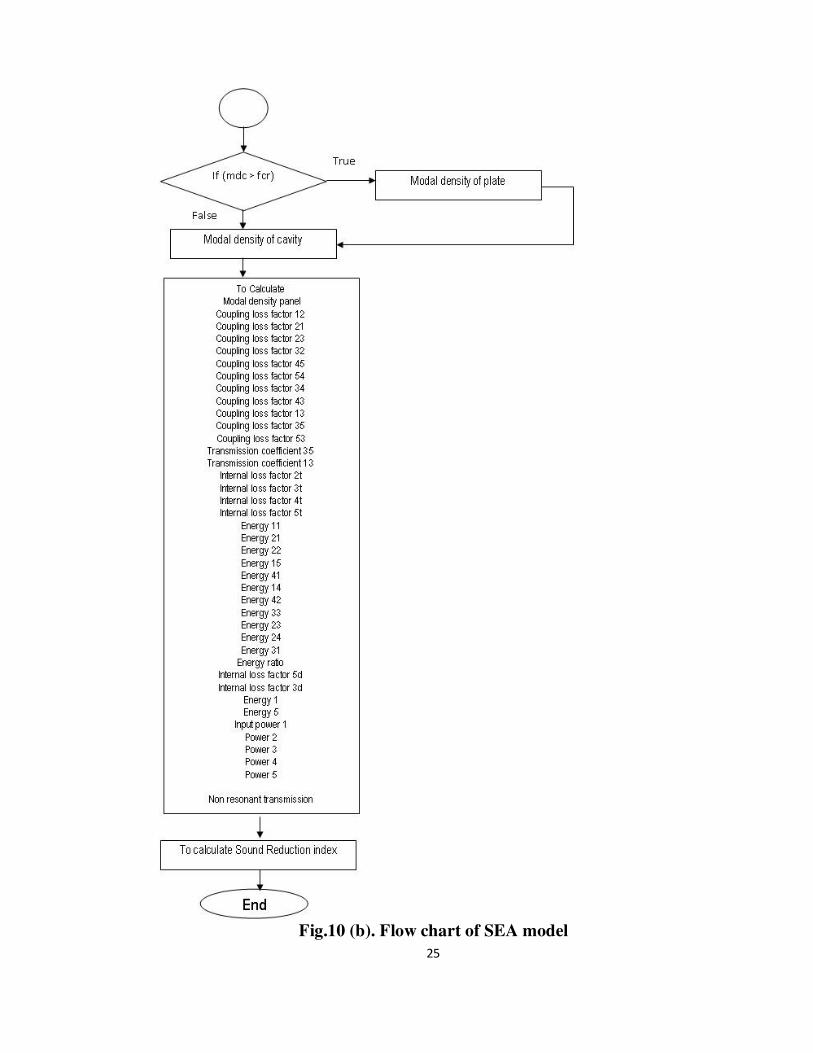
25
Fig.10 (b). Flow chart of SEA model
26
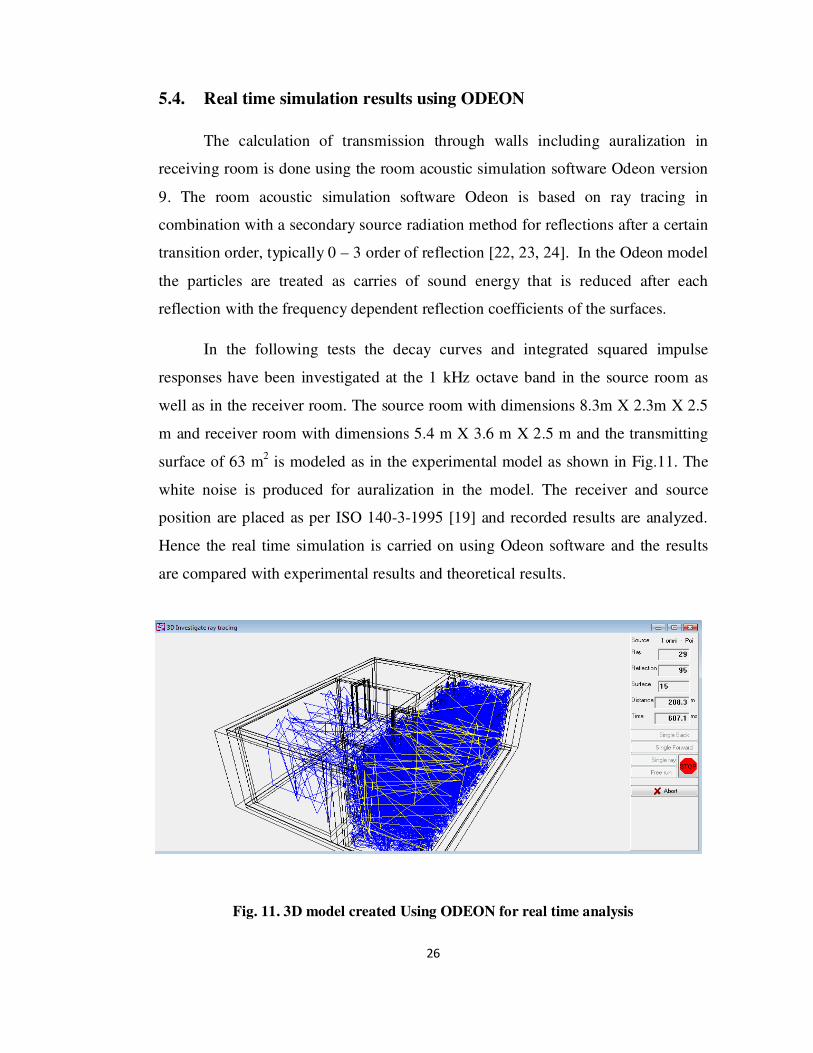
5.4. Real time simulation results using ODEON
The calculation of transmission through walls including auralization in
receiving room is done using the room acoustic simulation software Odeon version
9. The room acoustic simulation software Odeon is based on ray tracing in
combination with a secondary source radiation method for reflections after a certain
transition order, typically 0 – 3 order of reflection [22, 23, 24]. In the Odeon model
the particles are treated as carries of sound energy that is reduced after each
reflection with the frequency dependent reflection coefficients of the surfaces.
In the following tests the decay curves and integrated squared impulse
responses have been investigated at the 1 kHz octave band in the source room as
well as in the receiver room. The source room with dimensions 8.3m X 2.3m X 2.5
m and receiver room with dimensions 5.4 m X 3.6 m X 2.5 m and the transmitting
surface of 63 m2 is modeled as in the experimental model as shown in Fig.11. The
white noise is produced for auralization in the model. The receiver and source
position are placed as per ISO 140-3-1995 [19] and recorded results are analyzed.
Hence the real time simulation is carried on using Odeon software and the results
are compared with experimental results and theoretical results.
Fig. 11. 3D model created Using ODEON for real time analysis
27
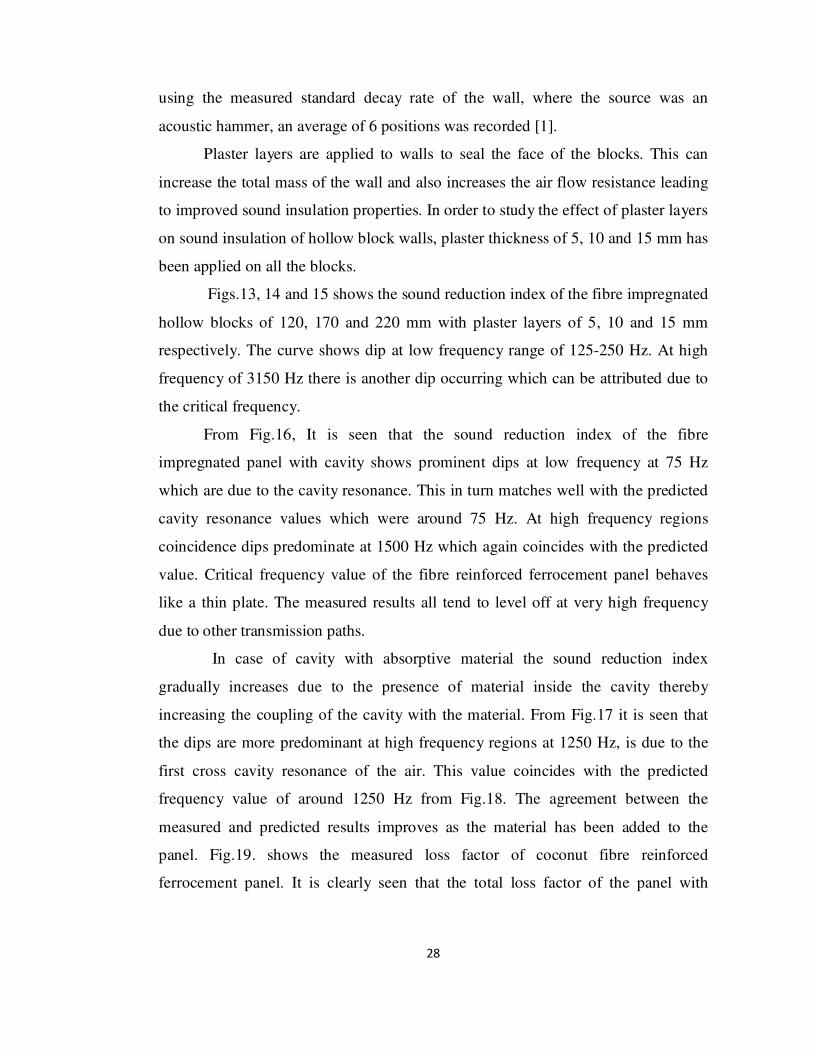
6. Results and Discussions
The sound insulation characteristics of fibre impregnated hollow block
depend on block design structure of the webs and holes. In study a constant web
thickness and holes are considered with varying thickness of block. Fig.12 shows
the sound reduction index for 120, 170 and 220 mm respectively. The sound
reduction index (SRI) for all the three thickness of the fibre impregnated hollow
block wall has a broader dip between 50 Hz to 250 Hz. At higher frequencies; there
is another dip at 1250 Hz, which is not very predominant for 170 and 220 mm. The
dip is attributed due to the coincident frequency associated with the thin surface
layers of fibres and the coconut shell which is used in hollow blocks. The SRI of
fibre impregnated hollow blocks exhibits 38, 40 and 43 dB at 500 Hz for 120, 170
and 220 mm respectively.
As expected when the total wall thickness decreases the critical frequency
increases and the overall sound insulation decreases. Similar dips appear at the
higher frequencies due to the thin surface layer of fibre impregnated hollow block.
All the three types of fibre impregnated hollow are made from the same
manufacture using same material and mixing ratios. Straight webs inside the fibre
impregnated hollow block provide higher bending stiffness.
Two important mechanisms for the fibre impregnated hollow block walls is
that the block undergoes pure bending and hence the bending wavespeed increases
with frequency due to the effect of fibres. The density and the curves in coconut
fibre decreases the intensity flow of longitudinal and bending waves which
increases the transmission loss factor of the hollow block and as well as the
ferrocement panels. The limit of regarding the block when the bending wavelength
is six times the plate thickness, given by f = cL/20h for homogenous plates.
Generally the bending wave speed is slightly lower than transverse wave speed [2]
where the difference is related by the poisson ratio.
Other important parameters include, total loss factor (TLF), the longitudinal
wavespeed of the panel and the acceleration level difference on either side of the
wall for an airborne source. The total damping (TLF) of the wall was calculated
28
using the measured standard decay rate of the wall, where the source was an
acoustic hammer, an average of 6 positions was recorded [1].
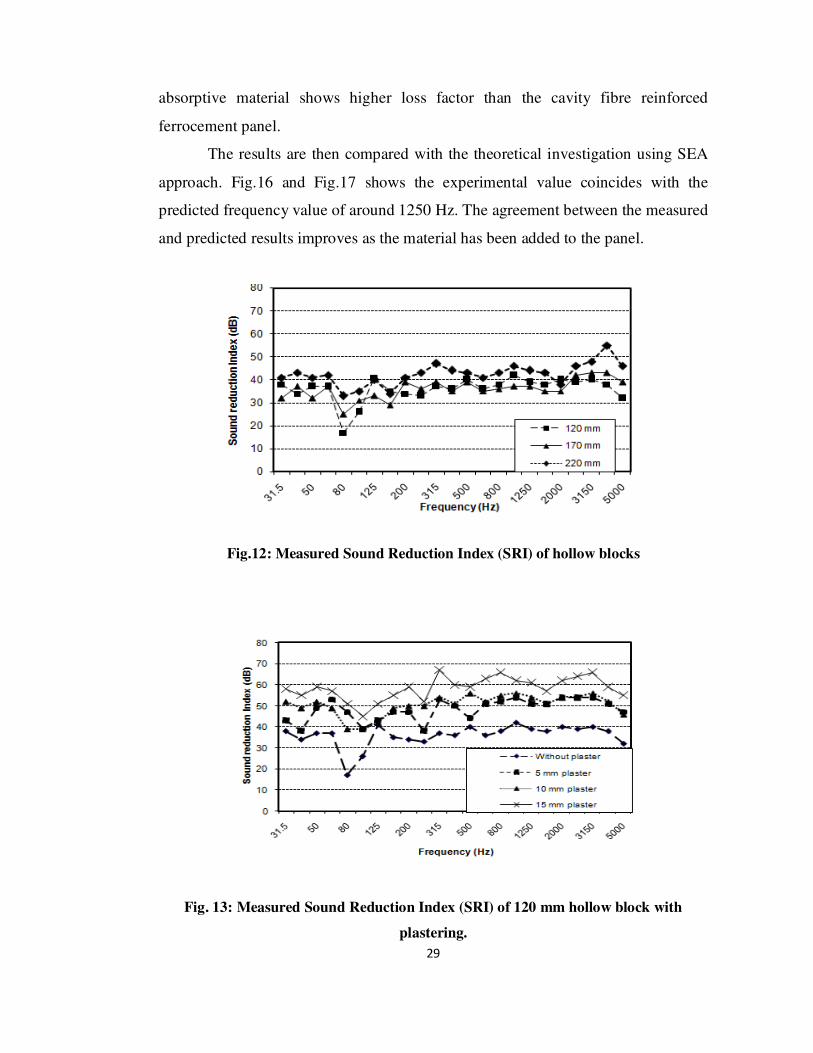
Plaster layers are applied to walls to seal the face of the blocks. This can
increase the total mass of the wall and also increases the air flow resistance leading
to improved sound insulation properties. In order to study the effect of plaster layers
on sound insulation of hollow block walls, plaster thickness of 5, 10 and 15 mm has
been applied on all the blocks.
Figs.13, 14 and 15 shows the sound reduction index of the fibre impregnated
hollow blocks of 120, 170 and 220 mm with plaster layers of 5, 10 and 15 mm
respectively. The curve shows dip at low frequency range of 125-250 Hz. At high
frequency of 3150 Hz there is another dip occurring which can be attributed due to
the critical frequency.
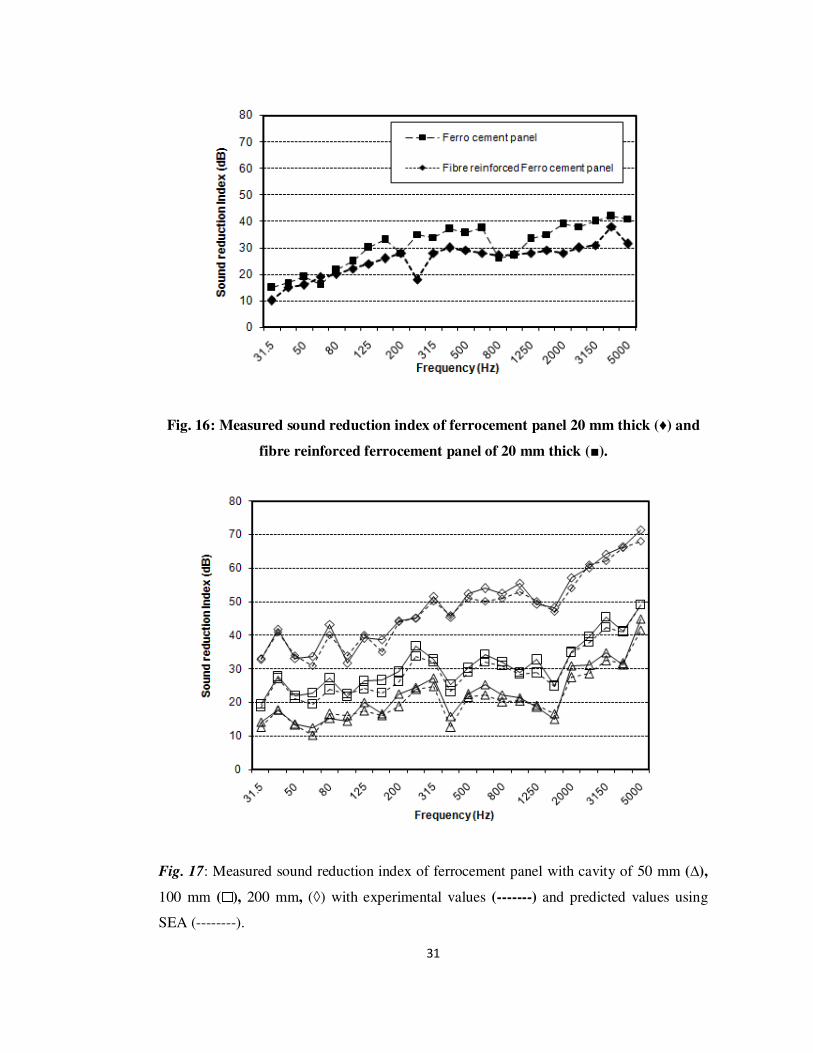
From Fig.16, It is seen that the sound reduction index of the fibre
impregnated panel with cavity shows prominent dips at low frequency at 75 Hz
which are due to the cavity resonance. This in turn matches well with the predicted
cavity resonance values which were around 75 Hz. At high frequency regions
coincidence dips predominate at 1500 Hz which again coincides with the predicted
value. Critical frequency value of the fibre reinforced ferrocement panel behaves
like a thin plate. The measured results all tend to level off at very high frequency
due to other transmission paths.
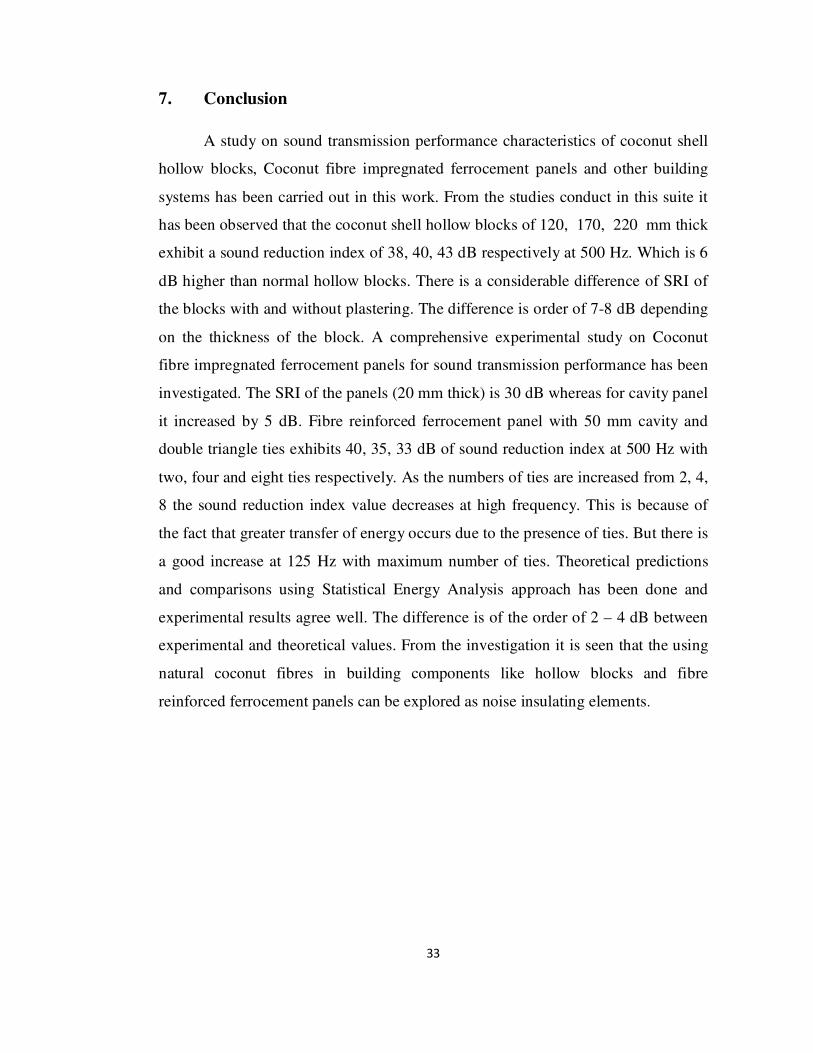
In case of cavity with absorptive material the sound reduction index
gradually increases due to the presence of material inside the cavity thereby
increasing the coupling of the cavity with the material. From Fig.17 it is seen that
the dips are more predominant at high frequency regions at 1250 Hz, is due to the
first cross cavity resonance of the air. This value coincides with the predicted
frequency value of around 1250 Hz from Fig.18. The agreement between the
measured and predicted results improves as the material has been added to the
panel. Fig.19. shows the measured loss factor of coconut fibre reinforced
ferrocement panel. It is clearly seen that the total loss factor of the panel with
29
absorptive material shows higher loss factor than the cavity fibre reinforced
ferrocement panel.
The results are then compared with the theoretical investigation using SEA
approach. Fig.16 and Fig.17 shows the experimental value coincides with the
predicted frequency value of around 1250 Hz. The agreement between the measured
and predicted results improves as the material has been added to the panel.
Fig.12: Measured Sound Reduction Index (SRI) of hollow blocks
Fig. 13: Measured Sound Reduction Index (SRI) of 120 mm hollow block with
plastering.

30
Fig. 14: Measured Sound Reduction Index (SRI) of 170 mm hollow block with
plastering
Fig. 15: Measured Sound Reduction Index (SRI) of 220 mm hollow block with
plastering
31
Fig. 16: Measured sound reduction index of ferrocement panel 20 mm thick (♦) and
fibre reinforced ferrocement panel of 20 mm thick (■).
Fig. 17: Measured sound reduction index of ferrocement panel with cavity of 50 mm (�),
100 mm ( ), 200 mm, (◊) with experimental values (-------) and predicted values using
SEA (--------).

32
Fig.18. Measured sound reduction index of coconut fibre reinforced ferrocement panel
with cavity and absorptive material 50 mm (∆), 100 mm (□), 200 mm (◊), with
experimental values (───) and predicted values using SEA (---------).
0
0.005
0.01
0.015
0.02
0.025
0.03
0.035
0.04
0.045
31.5 5
080
125
200
315
500
800
1250
2000
3150
5000
Fequency (Hz)
Loss facto
r (T
LF)
Fig.19: Measured loss factor of ferrocement panel (◊) and with absorptive material (□)
33
7. Conclusion
A study on sound transmission performance characteristics of coconut shell
hollow blocks, Coconut fibre impregnated ferrocement panels and other building
systems has been carried out in this work. From the studies conduct in this suite it
has been observed that the coconut shell hollow blocks of 120, 170, 220 mm thick
exhibit a sound reduction index of 38, 40, 43 dB respectively at 500 Hz. Which is 6
dB higher than normal hollow blocks. There is a considerable difference of SRI of
the blocks with and without plastering. The difference is order of 7-8 dB depending
on the thickness of the block. A comprehensive experimental study on Coconut
fibre impregnated ferrocement panels for sound transmission performance has been
investigated. The SRI of the panels (20 mm thick) is 30 dB whereas for cavity panel
it increased by 5 dB. Fibre reinforced ferrocement panel with 50 mm cavity and
double triangle ties exhibits 40, 35, 33 dB of sound reduction index at 500 Hz with
two, four and eight ties respectively. As the numbers of ties are increased from 2, 4,
8 the sound reduction index value decreases at high frequency. This is because of
the fact that greater transfer of energy occurs due to the presence of ties. But there is
a good increase at 125 Hz with maximum number of ties. Theoretical predictions
and comparisons using Statistical Energy Analysis approach has been done and
experimental results agree well. The difference is of the order of 2 – 4 dB between
experimental and theoretical values. From the investigation it is seen that the using
natural coconut fibres in building components like hollow blocks and fibre
reinforced ferrocement panels can be explored as noise insulating elements.

34
8. REFERENCES
1. Brown, K.T. and Norton, M.P., (1985), Some Comments on the
Experimental Determination of Modal Densities and Loss Factors using SEA,
Journal of Sound and Vibration, 102(4), pp: 588-594.
2. Craik, R.J.M. (1981), Damping of Building Structures, Applied Acoustics,
14, pp: 347-359.
3. Craik, R.J.M. and Steel, J.A., (1989), The Effect of Workmanship of Sound
Transmission through Buildings: Part1- Airborne Sound, Applied Acoustics,
27, pp: 57-63.
4. Craik, R.J.M. and Wilson, R., (1997), Sound Transmission through Parallel
Plates Coupled along a Line, Applied Acoustics, 49, pp: 353-372.
5. Craik, R.J.M., (1982), The Prediction of Sound Transmission through
Buildings using Statistical Energy Analysis, Journal of Sound and Vibration,
82(4), pp: 505-516.
6. Craik, R.J.M., (1990), Sound Transmission Paths through a Statistical Energy
Analysis Model, Applied Acoustics, 30, pp: 45-55.
7. Craik, R.J.M., (1992), The Use of Rubber and Plastic for Sound Insulation of
Party Walls and Floors, Journal of Plastics, Rubber and Composites: Processing
and Applications,18, pp: 31-34.
8. Craik, R.J.M., (1998), Structure-Borne Sound Transmission in Lightweight
Buildings, Proc. of ICA/ASA, Seattle, USA, pp: 1387-1390.
9. Craik, R.J.M., (1998), The Consequences of Light Weight Buildings on Sound
Transmission, Building Services Engineering Research and Technology,19, pp:
B1-4.
10. Cremer, L., Heckl, M., Ungar, E.E. (1984), Structure Borne Sound, Springer-
Verlag Pub. Berlin.
11. Del Coz Díaz, J.J., Álvarez Rabanal, F.P., García Nieto, P.J., Serrano
López, M.A., (2010), Sound transmission loss analysis through a multilayer
35
lightweight concrete hollow brick wall by FEM and experimental
validation, Building and Environment, Volume 45, Issue 11, pp: 2373-2386.
12. DIN 4109 Deutsche Norm (1989), Sound Insulation in Buildings-
Requirements and Testing.
13. Fischer, H.M., Weber, L., and Buckle, A., (1998), Schalldammung Von
Lochsteinen- Neue Erkenntnisse, Bauphysik, Heft 20(6), pp: 3-9
14. Fringuellino, M., and Sean Smith, R., (1999), Sound Transmission through
Hollow Blocks, Journal of Building Acoustics, 6(3/4), pp: 211-224.
15. Gerretsen, E., (1992), European Developments in Prediction Models for
Building Acoustics, Acta Acustica, 2, pp: 205-224.
16. Gerretsen, E., (1997), Vibration Reduction Index (Kij) for Junctions of Building
Elements with Cavities, Proc. Inter-noise 97, Budapest, Hungary, pp: 693-698.
17. Gerretsen, E., (1996), Vibration Reduction Index (Kij) a new Quantity for
Sound Transmission at Junctions of Building Elements, Proc. Inter-Noise 96,
25th
Anniversary Congress-Liverpool, UK, pp: 1475-1480.
18. ISO 140-1 (1995) Measurements of Sound Insulation in Buildings and of
Building Elements- Part 1: Requirements of laboratories.
19. ISO 140-3 (1995) Measurements of Sound Insulation in Buildings and of
Building Elements- Part 3: laboratory Measurements of Airborne Sound
Insulation of Building Elements.
20. ISO 717-1 (1997) Rating of Sound Insulation in Building and of Building
Elements-Part1- Airborne Sound Insulation.
21. J.H. Rindel., (1988) Prediction of Sound Transmission through Thick and Stiff
Panels. Part1- Proceeding, Institute of Acoustics, Vol. 10: Part 8, pp: 119 – 126.
22. J.H. Rindel., (1995), Computer Simulation Techniques for Acoustical Design
of Rooms. Acoustics Australia 1995, Vol. 23 pp: 81-86.
23. J.H. Rindel., (2000), The use of Computer modeling in room Acoustics.
Journal of Vibro engineering, 2000 No 3(4), pp: 219-224.
24. Jens Holger Rindel & Claus Lynge Christensen., (2008), Modelling
Airborne Sound Transmission between coupled rooms,
36
25. Kandaswamy, S., Ramachandraiah, A., (2001), Experimental Investigation
of sound transmission of hollow block walls using Statistical Energy Analysis,
Acoustics Letters, 24, No.7, pp: 129-132.
26. Kandaswamy, S., Ramachandraiah, A., (2003), Performance of sound
transmission on neocrete blocks using SEA, Paper accepted for publication in
International Journal for Housing Science and its Applications, 27, No.1.
27. Kandaswamy, S., Ramachandraiah, A., (2003), Experimental investigations
of sound transmission on cavity ferrocement panels with ties, Architectural
Science Review,. 46, No. pp: 55-60.
28. Lyon, R.H. and Dejong, R.G. (1995), Theory and Applications of Statistical
Energy Analysis, Butterworth- Heinemann Pub., Newyork.
29. Mannan, M.A. and Ganapathy, C. (2001), “Mix design for oil palm shell
concrete”, International Journal of Cement and Concrete Research, 31, pp:
1323–1325.
30. Mannan, M.A. and Ganapathy, C. (2001), “Long-term strengths of concrete
with oil palm shell as coarse aggregate”, International Journal of Cement and
Concrete Research, 31, pp: 1319–1321.
31. Mannan, M.A. and Ganapathy, C. (2004), “Concrete from an agricultural
waste – oil palm shell (OPS), International Journal of Building and
Environment, 39, pp: 441-448.
32. Mathur, V.K., (2006), “Composite materials from local resources”,
Construction and Building Materials, Vol. 20, pp: 470–477.
33. Narang, P.P., (1992), Low Cost Alternatives to Mineral Fibres for Acoustic
Insulation in Plasterboard Walls, Architectural Science Review, 35, pp: 89-95.
34. Ran Zhou, Malcolm J. Crocker., (2010), Sound transmission loss of foam-
filled honeycomb sandwich panels using statistical energy analysis and
theoretical and measured dynamic properties Original Research Article Journal
of Sound and Vibration, Volume 329, Issue 6, pp: 673-68.
37
35. Schmitz, A., Meier, A., and Raabe, G., (1999), Inter-Laboratory test of Sound
Insulation Measurements on Heavy Walls- Part 1- Preliminary Test , Journal of
Building Acoustics, 6(3/4), pp: 159-169.
36. Schmitz, A., Meier, A., and Raabe, G., (1999), Inter-Laboratory test of Sound
Insulation Measurements on Heavy Walls- Part 2- Results of Main Test ,
Journal of Building Acoustics, 6(3/4), pp: 171-186.
37. Scholl, W., and Weber, L., (1998), Influence of Perforation Pattern on direct
and Flanking Sound Transmission of Cored Block Masonry Walls (Results of a
Literature Study), Bauphysik, Heft 20(2), pp: 20-28.
38. Sean Smith, R., (1997), Sound Transmission through Lightweight Parallel
Plates, Ph.D. thesis, Heriot-Watt University, Edinburgh, UK.
39. Trevathan, J.W., Pearse J.R., (2008), The effect of workmanship on the
transmission of airborne sound through light framed walls Original Research
Article Applied Acoustics, Volume 69, Issue 2, pp: 127-13.
40. Vigran, T.E., (2010), Sound transmission in multilayered structures
Introducing finite structural connections in the transfer matrix
method, Original Research Article, Applied Acoustics, Volume 71, Issue 1, pp:
39-44.

38
Visible Research Output:
LIST OF PUBLICATIONS
1. Mahavir Singh, Omkar Sharma and Dharm Pal Singh, “Some Physical
Parameters Affecting Sound Transmission Loss” Proc. of National Symposium
On Acoustics (NSA 2008), Visakhapatnam, PP. 353 - 358, Dec. 2008.
2. Mahavir Singh, Omkar Sharma and Dharam Pal Singh, “Reduction of Sound
Transmission through Lightweight Gypsum Board Walls,” Proc. of 7th
International Conference on Advances in Metrology (AdMet – 2009), New
Delhi. PP. 120 – 122 Feb 2009.
3. Mahavir Singh, Omkar Sharma and Dharam Pal Singh, “Reducing Noise in
Your Apartment,” Proc. of 7th International Conference on Advances in
Metrology (Ad Met – 2009), New Delhi. PP. 123 – 125. Feb 2009.
4. Mahavir Singh, Omkar Sharma and Dharam Pal Singh, “Sound Transmission
through Single and double Leaf Partitions.” Journal of the acoustical Society of
India, 36(2), pp. 96 -101, Apr. 2009.
5. Mahavir Singh, Omkar Sharma and Dharam Pal Singh, “Sound Transmission
through Lightweight Concrete Walls” Proc. of 16th International Congress on
Sound and Vibration (ICSV16), Krakow, pp. 1 – 10, Jul. 2009.
6. Mahavir Singh, Omkar Sharma and Dharam Pal Singh, “Sound Transmission
through Both Lightweight and Masonry Single and Double Leaf walls,” Proc.
of 2nd
National Conference on Innovations in Indian Science Engineering &
Technology (NCISET 2009), New Delhi, pp. 1 – 7, Jul. 2009.
7. Mahavir Singh, Omkar Sharma and Dharm Pal Singh, “Sound Transmission
Loss of Lightweight Walls,” Proc. of 10th
Western Pacific Acoustics
Conference (WESPAC X), Beijing, PP. 1-10, Sep. 2009.
39
8. Mahavir Singh, Omkar Sharma and Dharam Pal Singh, “Sound Transmission
through Lightweight Partitions,” Proc. of ACOUSTICS High Tatras 2009 “34th
International Acoustical Conference - EAA Symposium,” Slovakia, pp.1-10,
Sep. 2009.
9. Mahavir Singh, Omkar Sharma and Dharam Pal Singh, “Sound Transmission
through Wall Elements,” Proc. of National Symposium on Acoustics
(NSA2009), Hyderabad, pp. 1-6, Nov. 2009.
10. M.Singh, D.P.Singh, and O.Sharma, “Airborne Sound transmission in
lightweight wall design structures for residential and commercial buildings,”
Accepted in Proc. of the 20th International Congress on Acoustics (ICA-2010)
Sydney, pp. 1-6, Aug. 2010.
11. Mahavir Singh, Omkar Sharma and Dharam Pal Singh, “Vibration in
Dwelling Units from Road Traffic” Proc. of National Symposium On Acoustics
(NSA 2010), Govt. PG College Rishikesh, pp. 66-72, Nov. 2010.
12. Mahavir Singh, Omkar Sharma and Dharam Pal Singh, “Controlling
Reverberant Noise in Rooms using Sound Absorptive Materials” Proc. of
National Symposium on Acoustics (NSA 2010), Govt. PG college Rishikesh,
pp. 73-78, Nov. 2010.
13. Mahavir Singh, Omkar Sharma and Dharm Pal Singh, “Room Acoustics –
Design for Internal Acoustic Quality,” Journal of the Acoustical Society of
India, 38(1), pp. 3-10, Jan. 2011.
14. Mahavir Singh, Dharm Pal Singh and Omkar Sharma, “Sound Transmission
through Building Elements,” Proc. of Indo-US Workshop on Nanosonic &
Ultrasound (IUWONU2011) and International Conference on Nanotechnology
& Ultrasound (ICNU2011), Trichy, pp-52-70, Jan.2011.
15. Mahavir Singh, Omkar Sharma and Dharam Pal Singh, “Experimental
Investigations of the Sound Transmission Loss of Window Panels” Proc. of 1st
National Conference on Advances in Metrology (AdMet-2011), Banglore, pp.
1-6, Feb. 2011.
40
16. Mahavir Singh, Omkar Sharma and Dharam Pal Singh, “Acoustic Comfort –
Noise Control for Buildings” New Dimensions of Physics of Proc. of National
Conference on Ultrasonics (NCU-2011), Jhansi, pp. 1-14, Mar. 2011.
17. Mahavir Singh, Omkar Sharma and Dharam Pal Singh, “Sound Transmission
through Cavity Walls Constructed from Gypsum Board,” GESTS Int’l Trans.
Acoustics Science and Engr., 15(3), pp. 107-112, Mar. 2011.
18. Mahavir Singh, Omkar Sharma and Dharam Pal Singh, “Experimental
Analysis of the Sound Transmission Loss of Single, Double and Triple Glazing
Window for Traffic Noise Reduction, Journal of the Acoustical Society of
India, 38(3), pp. 106-113, July. 2011.
19. Mahavir Singh, Dharam Pal Singh and Omkar Sharma, “Sound Insulation
Performance of Double-leaf Structure,” Acoustic Waves of Proc. of National
Symposium on Acoustics (NSA 2011), Bundelkhand University Jhansi, pp. 15-
24, Nov. 2011 (Received a Best Paper Award).
20. Mahavir Singh, Omkar Sharma and Dharam Pal Singh, “Sound Transmission
Loss of a New Designed Lightweight Partition,” Acoustic Waves of Proc. of
National Symposium on Acoustics (NSA-2011), Bundelkhand University
Jhansi, pp. 62-77, Nov. 2011.
21. Mahavir Singh, Omkar Sharma and Dharam Pal Singh, “Vibration in
Residential Environments due to Road Transporation,” Journal of the Sound
Vibration and Hardness, (in Press).
22. Mahavir Singh, Omkar Sharma and Dharam Pal Singh, “Experimental and
Theoretical Evaluation of Sound Transmission through Double Window
Panels,” GESTS Int’l Trans. Acoustics Science and Engr. (in Press).
23. Mahavir Singh, Omkar Sharma and Dharam Pal Singh, “Some Practical
Aspects of Absorption Measurements in Reverberation Room,” GESTS Int’l
Trans. Acoustics Science and Engr. (in Press).
24. Mahavir Singh, Omkar Sharma, Dharam Pal Singh and R.S.Upadhayay,
“Theoretical and Experimental Investigation for Sound Transmission through
41
Multi-layered Window Structures,” 2nd
National Conference on Advances in
Metrology (AdMet-2012), ARAI Pune, pp. 1-7, Feb. 2012.
25. Dharam Pal Singh, Mahavir Singh and R.S. Upadhayay, “Acoustic Properties
of Coconut Coir Fiber Sound Absorption Material,” Proc. of National Seminar
on Materials Characterization by Ultrasonic,(NSMCU), New Delhi, pp. 1-7,
Apr. 2012. (Received a Best Paper Award).