summary of safety and effectiveness … · abbott realtime idh2 is an in vitro polymerase chain...
TRANSCRIPT

PMA P170005: FDA Summary of Safety and Effectiveness Data Page 1
SUMMARY OF SAFETY AND EFFECTIVENESS DATA (SSED) I. GENERAL INFORMATION
Device Generic Name: Somatic Mutation PCR test Device Trade Name: Abbott RealTime IDH2 Device Procode: OWD Applicant’s Name and Address: Abbott Molecular Inc.
1300 E. Touhy Ave Des Plaines, IL 60018
Date(s) of Panel Recommendation: None Premarket Approval Application (PMA) Number: P170005 Date of FDA Notice of Approval: July 31, 2017
II. INDICATIONS FOR USE
Abbott RealTime IDH2 is an in vitro polymerase chain reaction (PCR) assay for the qualitative detection of single nucleotide variants (SNVs) coding nine IDH2 mutations (R140Q, R140L, R140G, R140W, R172K, R172M, R172G, R172S, and R172W) in DNA extracted from blood (EDTA) or human bone marrow (EDTA). Abbott RealTime IDH2 is for use with the Abbott m2000rt System. Abbott RealTime IDH2 is indicated as an aid in identifying acute myeloid leukemia (AML) patients with an isocitrate dehydrogenase-2 (IDH2) mutation for treatment with IDHIFA® (enasidenib).
III. CONTRAINDICATIONS
There are no known contraindications. IV. WARNINGS AND PRECAUTIONS
The warnings and precautions can be found in the Abbott RealTime IDH2 labeling. V. DEVICE DESCRIPTION
Abbott RealTime IDH2 detects single nucleotide variants (SNVs) coding nine IDH2 mutations (R140Q, R140L, R140G, R140W, R172K, R172M, R172G, R172S, and R172W) by using PCR technology with homogeneous real-time fluorescent detection.

PMA P170005: FDA Summary of Safety and Effectiveness Data Page 2
The assay uses human blood (EDTA) or bone marrow aspirate (EDTA) specimens and reports a qualitative result. Each kit contains reagents to test up 24 samples (patient specimens and/or assay controls. The following components comprise the overall device:
1. Abbott mSample Preparation SystemDNA Kit.
2. Abbott RealTime IDH2 Amplification Reagent Kit: • Abbott RealTime IDH2 Oligonucleotide Reagent 1: Contains synthetic
oligonucleotide forward and reverse primers which amplify the IDH2 R140 region and an endogenous internal control region (IC), and synthetic probes for R140Q and R140L mutations and IC in a buffered solution with a reference dye, dNTPs and the preservatives sodium azide and ProClin 950.
• Abbott RealTime IDH2 Oligonucleotide Reagent 2: Contains synthetic
oligonucleotide forward and reverse primers which amplify the IDH2 R140 region and an IC, and synthetic probes for R140G and R140W mutations and IC in a buffered solution with a reference dye, dNTPs and the preservatives sodium azide and ProClin 950.
• Abbott RealTime IDH2 Oligonucleotide Reagent 3: Contains synthetic oligonucleotide forward and reverse primers which amplify the IDH2 R172 region and an IC, and synthetic probes for R172K and R172M mutations and IC in a buffered solution with a reference dye, dNTPs and the preservatives sodium azide and ProClin 950.
• Abbott RealTime IDH2 Oligonucleotide Reagent 4: Contains synthetic oligonucleotide forward and reverse primers which amplify the IDH2 R172 region and an IC, and synthetic probes for R172S (AGT and AGC),R172G, and R172W mutations and IC in a buffered solution with a reference dye, dNTPs and the preservatives sodium azide and ProClin 950. The R172Sc (codon AGC) and R172St (codon AGT) specific mutations code for the amino acid R172S and are identified and reported by the assay as R172S in Abbott RealTime IDH2. Probes for R172Sc and R172St are labeled with the same fluorescent dye.
• Abbott RealTime IDH2 DNA Polymerase
• Abbott RealTime IDH2 Activation Reagent
3. Abbott RealTime IDH2 Control Kit

PMA P170005: FDA Summary of Safety and Effectiveness Data Page 3
The Abbott RealTime IDH2 Control Kit are used to establish run validity of the Abbott Realtime IDH2 assay. It consists of the following: • Abbott RealTime IDH2 Positive Control : The positive control consists of 3
plasmids and poly dA:dT in TE buffer. The plasmids contain the following sequences: IDH2 IC, R140Q and R172K mutations, and R140W and R172W mutations.
• Abbott RealTime IDH2 Negative Control: The negative control consists of the plasmid containing the IDH2 IC sequence and poly dA:dT in TE buffer.
4. Abbott RealTime IDH2 m2000rt Application CD-ROM.
• Software parameters specific to Abbott RealTime IDH2 are contained in an
assay application specification file, which is loaded onto the Abbott m2000rt instrument using the Abbott RealTime IDH2 m2000rt Application CD-ROM.
Specimen Preparation
EDTA anticoagulated blood or bone marrow aspirate specimens are processed manually using the Abbott mSample Preparation SystemDNA Kit. A minimum of 200 µL of EDTA anticoagulated blood or 100 µL of EDTA anticoagulated bone marrow is needed to perform the test. Cells are lysed at an elevated temperature in a lysis buffer containing guanidine isothiocyanate. DNA is captured on magnetic microparticles, and inhibitors are removed by performing a series of washes with wash buffers. The bound genomic DNA is eluted from the microparticles with elution buffer and is ready for PCR amplification. DNA eluates for specimens or controls can be stored at -25 to -15°C, and should not undergo more than 5 freeze/thaw cycles. Storage of thawed DNA eluate must not exceed a cumulative total of 24 hours at 15 to 30°C or 14 days at 2 to 8°C prior to PCR setup. PCR Amplification and Detection Abbott RealTime IDH2 Amplification Reagent Kit include reagents (Oligonucleotide Reagent 1, Oligonucleotide Reagent 2, Oligonucleotide Reagent 3, and Oligonucleotide Reagent 4) that are each manually combined with DNA Polymerase, and Activation Reagent to create 4 unique master mixes. These master mixes are added to 4 separate wells of the Abbott 96 Well Optical Reaction Plate with aliquots of the extracted DNA sample. After manual application of the Abbott Optical Adhesive Cover, the plate is transferred to the Abbott m2000rt instrument. The Abbott RealTime IDH2 master mix is used to amplify and detect 2 or 3 IDH2 amino acid mutations as seen in Table 1. In addition, each master mix amplifies and detects a region of the IDH2 gene outside of codon 140 and 172, which serves as an endogenous internal control (IC).

PMA P170005: FDA Summary of Safety and Effectiveness Data Page 4
Table 1. IDH2 Mutations Detected by each Master Mix Master Mix IDH2 Mutation SNV Oligonucleotide Reagent 1 R140Q CAG
R140L CTG Oligonucleotide Reagent 2 R140G GGG
R140W TGG Oligonucleotide Reagent 3 R172K AAG
R172M ATG Oligonucleotide Reagent 4 R172G GGG
R172S AGT and AGC R172W TGG The mutant nucleotide within each codon is underlined
During the amplification reaction on the Abbott m2000rt instrument, the target DNA is amplified by DNA Polymerase in the presence of primers, deoxyribonucleoside triphosphates (dNTPs), and magnesium chloride (MgCl2). During each round of thermal cycling, a high temperature is used to melt double-stranded DNA strands, followed by a low temperature where primers anneal to their respective targets and are extended to generate double-stranded DNA products. Exponential amplification of the products is achieved through repeated cycling between high and low temperatures. Amplification of IDH2 IC and mutation targets takes place simultaneously in the same PCR well. IDH2 products are detected during the annealing/extension step by measuring the real-time fluorescence signals of the IDH2 IC and mutation-specific probes, respectively. The IDH2 IC and mutation-specific probes are labeled with different fluorophores, allowing their signals to be distinguishable in a single PCR well. Instrument and Software The Abbott Realtime IDH2 assay uses the Abbott m2000rt System with System Software Version 8.0 or higher. The Abbott m2000rt System is an automated system for performing fluorescence-based PCR to provide quantitative and qualitative detection of nucleic acid sequences. The operator controls the system through the SCC that is equipped with Abbott m2000rt software. Final results are displayed on the Abbott m2000rt workstation. Interpretation of Results

PMA P170005: FDA Summary of Safety and Effectiveness Data Page 5
Abbott RealTime IDH2 is a qualitative assay for which specimen interpretations are reported as "Mutation Detected" or "Not Detected." For specimens with interpretations of "Mutation Detected", the identity of the IDH2 mutation detected is reported. For each patient sample, 1 PCR reaction is evaluated for each of the 4 oligonucleotide reagents which will allow the evaluation of all 9 IDH2 mutations that can be detected by the assay. For a given reaction to produce a valid result, the IC amplification must pass specifications that are primarily governed by predetermined MaxRatio (MR) and Cycle Number (CN) ranges. Other fluorescence channels in the reaction are used for the detection of specific IDH2 mutations. Amplification curves, if present, in any of the mutant-specific channels must fall within predetermined MR and CN ranges. The presence of an IDH2 mutant allele is determined by a final delta CN (dCN) calculation in which the CN of the IC amplification is subtracted from the CN of the mutant amplification. For a specific IDH2 mutation to be reported as “Mutation Detected” the dCN must be less than or equal to a predetermined threshold. The dCN threshold values for each mutation are shown in Table 2 below.
Table 2: dCN thresholds for mutation detection R140Q R140L R140G R140W R172K R172M R172S R172W R172G dCN Threshold 9.50 12.50 10.50 10.50 7.50 12.50 10.00 11.50 12.00
When two mutations are detected, the software calls the mutation which is present at the highest level. Test Controls A Positive Control and a Negative Control are required in each run to verify that the sample processing, the amplification, and the detection steps are performed correctly. The Abbott RealTime IDH2 controls are processed alongside the specimens prior to running the amplification portion of the assay. The Positive Control is formulated with DNA containing IDH2 mutation and IC sequences. R140Q, R140W, R172K, and R172W mutations should be detected for the Positive Control. In addition, the IC should be detected in all 4 reactions for the Positive Control. The Negative Control is formulated with DNA containing the IC sequence. Only the IC should be detected in all 4 reactions for the Negative Control. IDH2 mutations (R140Q, R140L, R140G, R140W, R172K, R172M, R172G, R172S, and R172W) should not be detected in the Negative Control. IDH2 mutations detected in the Negative Control are indicative of contamination from other samples or amplified product introduced during sample processing or during preparation of the Abbott 96-Well Optical Reaction Plate.

PMA P170005: FDA Summary of Safety and Effectiveness Data Page 6
If the result for the Negative Control or the Positive Control is out of range, the run is invalid and a flag is displayed for each specimen.
VI. ALTERNATIVE PRACTICES AND PROCEDURES
Currently, there are no other FDA approved IVD medical devices for the detection of IDH2 mutations.
VII. MARKETING HISTORY
The Abbott RealTime IDH2 assay has not been marketed in the United States or any foreign country.”
VIII. POTENTIAL ADVERSE EFFECTS OF THE DEVICE ON HEALTH
The risks of the Abbott RealTime IDH2 assay are associated with the potential mismanagement of patients resulting from false results of the assay. The device is a key part of diagnostic evaluation for AML patients in decisions regarding treatment with enasidenib. Failure of the device to perform as expected or failure to correctly interpret assay results may lead to incorrect IDH2 mutation results, and consequently improper treatment decisions for AML patients. A false positive assay result may lead to treatment being administered to a patient who may not benefit, and potentially any adverse side effects associated with treatment. A false negative assay result may lead to treatment being withheld from a patient who might have benefitted.
IX. SUMMARY OF NONCLINICAL STUDIES
A. Laboratory Studies
Samples: Bone marrow aspirate and blood were tested in all key analytical studies. For the most prevalent IDH2 mutations, AML clinical specimens were used, when possible, otherwise cell lines with IDH2 mutations were used. Select performance characteristics of the Abbott RealTime IHD2 test were determined in studies using bone marrow aspirates, blood and cell lines blended into DNA extracted from IDH2 mutation-negative subjects. Ten separate cell lines were used in the analytical studies. Each cell line contained a single IDH2 mutation and represented all 10 IDH2 mutations in DNA detected by the ReatTime IDH2 Assay including R142Q, R172K, R172S (AGT and AGC), R140L, R140G, R140W, R172M, R172G, and R172W. Functional equivalence studies were used to demonstrate that the contrived specimens had comparable performance as clinical specimens in terms of limit of detection and precision (see section IX.A.3.C). Pre-Analytical: The Abbott RealTime IDH2 assay is designed such that quantitation of DNA prior to PCR amplification and SNV mutation detection is not required. A fixed amount of eluate (15 μL) from sample extraction is used in each PCR reaction. In order

PMA P170005: FDA Summary of Safety and Effectiveness Data Page 7
to evaluate the typical DNA yield expected for the Abbott mSample Preparation System
DNA Kit, 127 AML clinical samples from either blood (n=52) or bone marrow aspirate (n=75) were tested and DNA amounts were measured. The DNA yield was similar for bone marrow and blood. The genomic DNA (gDNA) input range observed for bone marrow was 5 ng to 1998 ng per 15 μL of eluate and the gDNA input range observed for whole blood is 3 ng to 1182 ng per 15 μL of eluate. Table 3 lists the 5%, 25% 50% (median), 75% and 95% quantile for each analysis. The analytical studies were designed to validate this range of expected DNA input.
Table 3. gDNA yield by Sample Type
Combined (n=127)
Bone Marrow (n=75)
Whole Blood (n=52)
5 % quantile 19 ng 18 ng 18 ng 25% quantile 103 ng 115 ng 67 ng 50% quantile (median) 264 ng 354 ng 186 ng 75% quantile 639 ng 697 ng 573 ng 95% quantile 1123 ng 1215 ng 1086 ng
1. Comparison to an Orthogonal Method.
Accuracy of the Abbott RealTime IDH2 Assay was determined by comparing the results of the Abbott RealTime IDH2 Assay with two validated, NGS (Next Generation Sequencing) methods using specimens from patients enrolled into the trial. A retrospective correlation analysis was performed using a data set of 173 clinical subjects with valid IDH2 mutation testing results from both the Abbott RealTime IDH2 assay and one of two validated NGS sequencing methods. Both blood and bone marrow specimens were tested for each subject, if adequate specimens were available, resulting in testing 167 blood samples and 150 bone marrow samples. NGS test results for all specimens yielded valid results and no data was excluded from the analysis. The agreement rates were evaluated by sample type and included analyses of both the subject outcome (detected vs not-detected) and per specific mutation. The Abbott RealTime IDH2 assay demonstrated high agreement rates between Abbott RealTime IHD2 and the NGS methods in blood specimens (Table 4).The analysis demonstrated a 100.00% (91/91) Positive Percent Agreement (PPA) with a 95% exact CI of (96.03%, 100.00%). The analysis demonstrated a 98.68% (75/76) Negative Percent Agreement (NPA) with a 95% exact CI of (92.89%, 99.97%). The analysis of agreement by specific mutation in Table 5 demonstrated agreement for 166/167 patient samples.

PMA P170005: FDA Summary of Safety and Effectiveness Data Page 8
Table 4: Comparison of Abbott RealTime IDH2 assay with an NGS sequencing results using blood specimens
Abbott RealTime IDH2
NGS Method Total Mutation Detected
Not Detected
n n n
Mutation Detected 91 1 92 Not Detected 0 75 75 Total 91 76 167 Table 5: Comparison of Abbott RealTime IDH2 Mutation Identity with an NGS method in blood specimens
NGS Method
Total Not
Detected R140Q R140W R172K
Abbott RealTime IDH2 n n n n n
Not Detected 75 0 0 0 75
R140Q 0 71 0 0 71
R140W 0 0 1 0 1
R172K 1 1 0 18 20
Total 76 72 1 18 167
There were no samples with R140G, R140L, R172G, R172M, R172S, or R172W within this study.
The Abbott RealTime IDH2 assay demonstrated high agreement rates between Abbott RealTime IHD2 and the NGS methods in bone marrow specimens as well (Table 6). The analysis demonstrated a 100.00% (78/78) PPA with a 95% exact CI of (96.03%, 100.00%). The analysis demonstrated a 100% (72/72) NPA with a 95% exact CI of (92.89%, 99.97%). The analysis of agreement by specific mutation in Table 7 demonstrated agreement for 150/150 patient samples.

PMA P170005: FDA Summary of Safety and Effectiveness Data Page 9
Table 6: Comparison of Abbott RealTime IDH2 assay with an NGS sequencing results using bone marrow specimens
Abbott RealTime IDH2 Assay
NGS Method Total Mutation Detected
Not Detected
n n n Mutation Detected 78 0 78 Not Detected 0 72 72 Total 78 72 150 Table 7: Comparison of Abbott R ealTime IDH2 Mutation Identity with an NGS method in bone marrow specimens
NGS Method
Total Not
Detected R140Q R172K
Abbott RealTime IDH2 n n n N
Not Detected 72 0 0 72
R140Q 0 63 0 63
R172K 0 0 15 15
Total 72 63 15 150
There were no samples with R140G, R140L, R140W, R172G, R172M, R172S, or R172W within this study.
The pooled analysis of the 173 patient results demonstrated a 100.00% (93/93) PPA with a 95% exact CI of (96.11%, 100.00%) and a 98.75% (79/80) NPA with a 95% exact CI of (93.23%, 99.97%).
2. Concordance Between Peripheral Blood and Bone Marrow Results The Abbott RealTime IDH2 Assay is intended to be use on either blood or bone marrow aspirate. An analysis was performed to show concordance of results between matched peripheral blood and bone marrow specimen types. In this study, specimens from 213 AML patients were tested with the Abbott RealTime IDH2 Assay. Samples types included peripheral blood, peripheral blood mononuclear cell (PBMC) cell pellets, bone marrow aspirate and bone marrow

PMA P170005: FDA Summary of Safety and Effectiveness Data Page 10
mononuclear cell (BMMC) cell pellets. Specimens were only included in the study if there was at least one peripheral blood or PBMC sample and at least one bone marrow aspirate or BMMC from the same patient. Within-specimen type concordance was first evaluated. For the 120 patients with both peripheral blood and PBMC, 119 (99.2%) demonstrated concordant results (mutation detected vs. not detected) comparing peripheral blood and PBMC. For the 120 patients with both bone marrow aspirate and BMMC, 120 (100.0%) demonstrated concordant results (mutation detected vs. not detected) comparing bone marrow aspirate and BMMC. Concordance between bone marrow specimens and blood specimens was then determined at the subject level (detected vs. not detected) and at the mutation level. Results are shown below in Tables 8. There was one discordant call (R172K positive in blood was reported as mutation not detected in bone marrow). There was also one within-mutation detected discordant case (R140Q positive result in blood was reported as R172K positive in bone marrow (data not shown). These results demonstrate equivalency between samples types.
Table 8: Comparing Abbott RealTime IDH2 assay Results from Blood/PBMC versus Bone Marrow/BMMC
Bone Marrow/BMMC Blood/PBMC Total
Mutation Detected Not Detected
n N N Mutation Detected 142 1 143 Not Detected 0 70 70 Total 142 71 213 Average Positive Agreement = 99.65% (284/285); 95% CI = 98.87 – 100% Average Negative Agreement = 99.29% (140/141); 95% CI = 97.58 – 100% Overall Agreement = 99.53% (212/213); 95% CI = 97.41 – 99.99%
3. Analytical Sensitivity
A. Limit of Blank
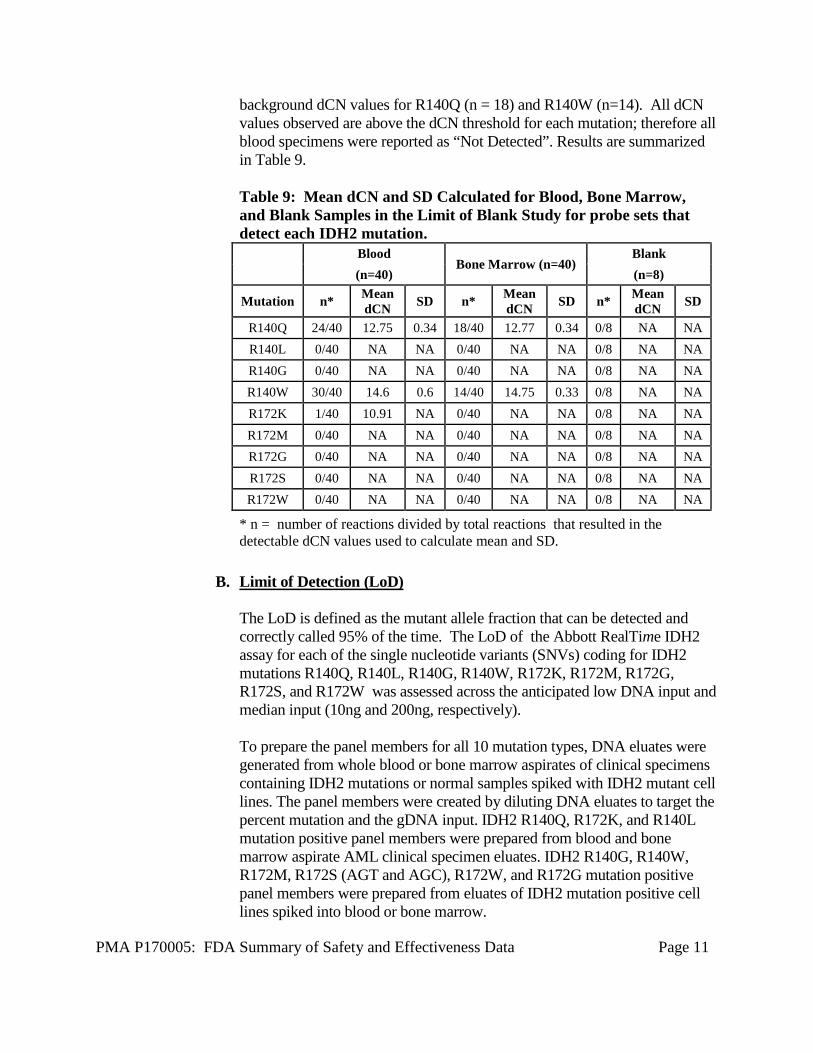
The Limit of Blank (LoB) was verified by testing 10 normal blood specimens, 10 normal bone marrow aspirate specimens, and 2 blank samples (water). Each specimen or sample was tested in replicates of 4, yielding a total of 88 replicates (40 replicates for whole blood specimens, 40 replicates for bone marrow aspirate specimens, and 8 replicates for blank samples). There was no detectable background amplification for the R140L, R140G, R172M, R172G, R172S and R172W probesets. Replicates of blood specimens show background dCN values for R140Q (n = 24), R140W (n=30), and R172K (n=1). Replicates of bone marrow specimens show
PMA P170005: FDA Summary of Safety and Effectiveness Data Page 11
background dCN values for R140Q (n = 18) and R140W (n=14). All dCN values observed are above the dCN threshold for each mutation; therefore all blood specimens were reported as “Not Detected”. Results are summarized in Table 9. Table 9: Mean dCN and SD Calculated for Blood, Bone Marrow, and Blank Samples in the Limit of Blank Study for probe sets that detect each IDH2 mutation.
Blood
Bone Marrow (n=40) Blank
(n=40) (n=8)
Mutation n* Mean dCN SD n* Mean
dCN SD n* Mean dCN SD
R140Q 24/40 12.75 0.34 18/40 12.77 0.34 0/8 NA NA R140L 0/40 NA NA 0/40 NA NA 0/8 NA NA R140G 0/40 NA NA 0/40 NA NA 0/8 NA NA R140W 30/40 14.6 0.6 14/40 14.75 0.33 0/8 NA NA R172K 1/40 10.91 NA 0/40 NA NA 0/8 NA NA R172M 0/40 NA NA 0/40 NA NA 0/8 NA NA R172G 0/40 NA NA 0/40 NA NA 0/8 NA NA R172S 0/40 NA NA 0/40 NA NA 0/8 NA NA R172W 0/40 NA NA 0/40 NA NA 0/8 NA NA
* n = number of reactions divided by total reactions that resulted in the detectable dCN values used to calculate mean and SD.
B. Limit of Detection (LoD) The LoD is defined as the mutant allele fraction that can be detected and correctly called 95% of the time. The LoD of the Abbott RealTime IDH2 assay for each of the single nucleotide variants (SNVs) coding for IDH2 mutations R140Q, R140L, R140G, R140W, R172K, R172M, R172G, R172S, and R172W was assessed across the anticipated low DNA input and median input (10ng and 200ng, respectively). To prepare the panel members for all 10 mutation types, DNA eluates were generated from whole blood or bone marrow aspirates of clinical specimens containing IDH2 mutations or normal samples spiked with IDH2 mutant cell lines. The panel members were created by diluting DNA eluates to target the percent mutation and the gDNA input. IDH2 R140Q, R172K, and R140L mutation positive panel members were prepared from blood and bone marrow aspirate AML clinical specimen eluates. IDH2 R140G, R140W, R172M, R172S (AGT and AGC), R172W, and R172G mutation positive panel members were prepared from eluates of IDH2 mutation positive cell lines spiked into blood or bone marrow.

PMA P170005: FDA Summary of Safety and Effectiveness Data Page 12
Each panel member was tested with 2 Abbott RealTime IDH2 Amplification Reagent Kit lots with 5 runs per lot over a minimum of five days and 4 replicates per run for a total of 40 replicates per panel member. The percent mutation ranged from 0.25% to 10.0% for 10 ng gDNA input and from 0.12.5% to 10% percent mutation for 200 ng gDNA input. Results are shown in Table 10. The data support the LoD claim of 2% for both blood and bone marrow. Table 10: Limit of Detection of mutation frequency at 10 ng and 200 ng DNA inputs: DNA input Sample Type Allele Frequency Detection Rate
200 ng Blood 10% 400/400 100% 200 ng Blood 5% 400/400 100% 200 ng Blood 2% 400/400 100% 200 ng Blood 1% 400/400 100% 200 ng Blood 0.50% 400/400 100% 200 ng Blood 0.25% 384/400 96% 200 ng Blood 0.13% 283/400 70.8% 200 ng Bone Marrow 10% 400/400 100% 200 ng Bone Marrow 5% 400/400 100% 200 ng Bone Marrow 2% 400/400 100% 200 ng Bone Marrow 1% 400/400 100% 200 ng Bone Marrow 0.50% 400/400 100% 200 ng Bone Marrow 0.25% 400/400 100% 200 ng Bone Marrow 0.13% 301/400 75.3% 10 ng Blood 10% 400/400 100% 10 ng Blood 5% 400/400 100% 10 ng Blood 4% 400/400 100% 10 ng Blood 2% 399/400 99.80% 10 ng Blood 1% 374/400 93.5% 10 ng Blood 0.50% 271/400 67.8% 10 ng Blood 0.25% 111/400 27.8% 10 ng Bone Marrow 10% 400/400 100% 10 ng Bone Marrow 5% 400/400 100% 10 ng Bone Marrow 4% 400/400 100% 10 ng Bone Marrow 2% 400/400 100% 10 ng Bone Marrow 1% 389/400 97.3% 10 ng Bone Marrow 0.50% 265/400 66.3% 10 ng Bone Marrow 0.25% 109/400 27.3%
C. Functional Equivalence Study Comparing Clinical Specimens to
Contrived Specimens
PMA P170005: FDA Summary of Safety and Effectiveness Data Page 13
This study characterized the equivalency between IDH2 mutation-positive AML blood/bone marrow specimens (clinical specimens) and blood/bone marrow specimen spiked with IDH2 mutation-positive cell lines (contrived specimens) in terms of limit of detection and precision. Contrived specimens of DNA eluates were generated from whole blood or bone marrow aspirates spiked with cell lines harboring either the R140Q and R172K mutation in IDH2. A fixed DNA input of 10 ng per reaction was set and the following mutation frequencies were tested with 20 replicates over 5 runs: 5%, 2%, 1%, 0.5%, and 0.25%. The results from this study were compared to the results from the Limit of Detection Study above for the clinical blood and bone marrow specimens harboring the R140Q and R172 mutation in IDH2. Both clinical and contrived specimens showed similar detection rates, dCN values and standard deviation of dCN values when comparing each dilution.
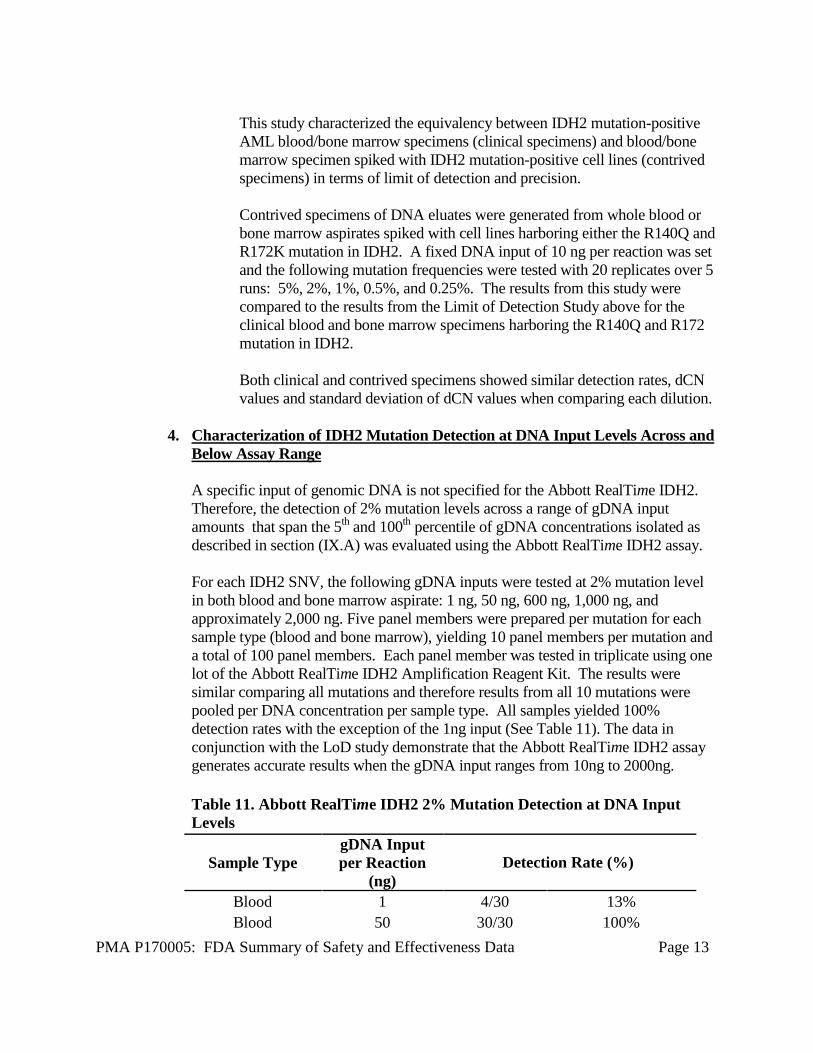
4. Characterization of IDH2 Mutation Detection at DNA Input Levels Across and Below Assay Range A specific input of genomic DNA is not specified for the Abbott RealTime IDH2. Therefore, the detection of 2% mutation levels across a range of gDNA input amounts that span the 5th and 100th percentile of gDNA concentrations isolated as described in section (IX.A) was evaluated using the Abbott RealTime IDH2 assay. For each IDH2 SNV, the following gDNA inputs were tested at 2% mutation level in both blood and bone marrow aspirate: 1 ng, 50 ng, 600 ng, 1,000 ng, and approximately 2,000 ng. Five panel members were prepared per mutation for each sample type (blood and bone marrow), yielding 10 panel members per mutation and a total of 100 panel members. Each panel member was tested in triplicate using one lot of the Abbott RealTime IDH2 Amplification Reagent Kit. The results were similar comparing all mutations and therefore results from all 10 mutations were pooled per DNA concentration per sample type. All samples yielded 100% detection rates with the exception of the 1ng input (See Table 11). The data in conjunction with the LoD study demonstrate that the Abbott RealTime IDH2 assay generates accurate results when the gDNA input ranges from 10ng to 2000ng. Table 11. Abbott RealTime IDH2 2% Mutation Detection at DNA Input Levels
Sample Type gDNA Input per Reaction
(ng) Detection Rate (%)
Blood 1 4/30 13% Blood 50 30/30 100%

PMA P170005: FDA Summary of Safety and Effectiveness Data Page 14
Blood 600 30/30 100% Blood 1,000 30/30 100% Blood 2,000 30/30 100%
Bone Marrow 1 4/30 13% Bone Marrow 50 30/30 100% Bone Marrow 600 30/30 100% Bone Marrow 1,000 30/30 100% Bone Marrow 2,000 30/30 100%
5. Characterization of dCN across a range of mutation levels at fixed DNA input
To demonstrate the linearity of the Abbott RealTime IDH2 assay across the range of mutant allele fractions, a series of dilutions with varying concentrations of mutant DNA in a background of wild-type DNA at a fixed DNA input (50ng) from both blood and bone marrow specimens was evaluated for all mutations. Synthetic DNA coding for R140Q, R140G, R140W, R172K, R172G, R172S (AGT and AGC), were diluted in whole blood eluate and R140L, R172M and R172W were diluted in bone marrow eluate. Each of the 10 IDH2 mutations were tested with IDH2 percent mutation levels of 50%, 20%, 10%, 5%, 2.5%, and 1.25%, while gDNA input was held constant at 50 ng. Three replicates of each of the prepared panel members were tested. One lot of amplification reagents and one Abbott m2000rt instrument was used. Correlation and linear regression analyses evaluated the association of log2 percent mutation with dCN for each of the 10 IDH2 mutations. The slope of the regression lines ranged from -0.92 to -1.14 (an ideal value = -1.0) with R2 values all above 0.992. These data demonstrated that at fixed DNA input, the amplification efficiency was acceptable. See Table 12. These data demonstrated linearity of dCN values across the range of mutation frequencies tested when gDNA input is held constant at 50 ng. Table 12: Correlation and linear regression analyses evaluating the association of log2 percent mutation with dCN for each of the 10 IDH2 mutations in blood and bone marrow.
gDNA Diluent
Mutant Intercept
Intercept (95% CI)
Slope Slope (95% CI) Amplification Efficiency
Blood
R140Q 34.84 (34.37, 35.30) -3.08 (-3.23, -2.93) 111.07 R140G 33.97 (33.62, 34.32) -3.16 (-3.27, -3.05) 107.22 R140W 37.82 (37.36, 38.28) -3.84 (-3.99, -3.70) 82.02 R172K 32.44 (32.16, 32.72) -3.03 (-3.12, -2.95) 113.56 R172G 35.29 (34.89, 35.68) -3.43 (-3.56, -3.30) 95.75
R172S (AGT) 32.91 (32.60, 33.22) -3.14 (-3.24, -3.04) 108.15 R172S (AGC) 32.61 (32.35, 32.86) -3.15 (-3.23, -3.06) 107.90
Bone Marrow R140L 37.03 (36.75, 37.32) -3.54 (-3.63,-3.45) 91.67 R172M 34.53 (34.21, 34.85) -3.12 (-3.22, -3.02) 109.26 R172W 34.57 (34.34, 34.81) -3.17 (-3.25, -3.09) 106.81

PMA P170005: FDA Summary of Safety and Effectiveness Data Page 15
6. Characterization of dCN across a range of DNA inputs at a fixed mutation level
A study was conducted to demonstrate the amplification efficiency of the control relative to the mutant is linear across a range of DNA concentrations and consistency of the dCN values. The mutant allele fraction was held constant. Synthetic DNA coding for R140Q, R140G, R140W, R172K, and R172G, were diluted in whole blood eluate and plasmids coding for R140L, R172M and R172W were diluted in bone marrow eluate. The percent mutation level for each plasmid was held constant at 5% while gDNA input was tested at 200 ng, 100 ng, 50 ng, 20 ng, 10 ng, and 5 ng. Three replicates of each of the prepared panel members were tested. One lot of amplification reagents and one Abbott m2000rt instrument was used. Linear regression analyses evaluated the association of log2 DNA input with dCN for each of the 10 IDH2 mutations. These data demonstrated the amplification efficiency of the assay across the range of DNA inputs was linear and that the dCN was held constant when at the 5% mutation frequency.
7. Analytical Specificity
A. Primer and Probe Specificity An in silico analysis was performed to evaluate primer and probe specificity using publicly available sequence and mutation databases. The Basic Local Alignment Search Tool (BLAST) was used to search for potential cross-reactive sequences associated with the of the Abbott RealTime IDH2 assay primers and probes. The BLAST search results showed that the primers and probes are specific for the IDH2 gene. Amplification/detection of unintended human genes is not expected.
B. Cross Reactivity and Exclusivity This study evaluated the rate of correct sample interpretation for each Abbott RealTime IDH2 target using a panel representing IDH2 SNVs targeted by the assay, IDH2 SNVs not targeted by the assay, and wild type genomic DNA. Panel members were prepared such that each PCR reaction contained a total input of approximately 200 ng of wild type human placental (HP) DNA, or wild type HP DNA plus plasmid mutant DNA resulting in a percent mutation of approximately 25% to 50% in 200 ng of total DNA. Panel Members included wild type HP DNA (R140, R172) and wild type HP DNA plus one of 12 DNA plasmids coding for each of the 10 IDH2 SNVs targeted by the assay (R140Q, R140L, R140G, R140W, R172K, R172M, R172G, R172Sc, R172St, R172W) or 2 IDH2 SNVs not targeted by the assay (R140P, R172T). The prepared panel members were directly tested using the Abbott RealTime IDH2 Amplification Reagent Kit. Forty replicates per panel member were tested.

PMA P170005: FDA Summary of Safety and Effectiveness Data Page 16
The wild type HP DNA panel member reported “Not Detected” with a 100% (40/40) rate of correct sample interpretation. Ten panel members targeted by the assay each reported “Mutation Detected” with a 100% (40/40) rate of correct sample interpretation, which included the correct identity of the IDH2 mutation. Two panel members not targeted by the assay (R140P mutation, and R172T mutation) reported “Not Detected” with a 100% (40/40) rate of correct sample interpretation. The analysis of the underlying dCN value was performed. dCN values for R140W are observed in all 40 replicates of the sample containing the R140G mutation at dCN levels below the threshold cutoff for R140W. This would lead to a “mutation detected” result. However, when two mutations are detected within a sample, the software assigns the mutation which is present at the highest level to the sample. In all cases, the R140G sample was accurately called R140G. The mean dCN, SD, and number of replicates (n) that provided detectable dCNs which were used for the mean and SD calculations for each allele are summarized in Tables 13 and 14.
Table 13. Mean dCN and SD Calculated for Probes to the R140 Alleles of IDH2 for Each Sample With Plasmids Containing Specific IDH2 Mutation. R140Q R140L R140G R140W Mutation n# Mean SD n# Mean SD n# Mean SD n# Mean SD WT 0/40 11.85 0.247 0/40 0/40 23/40 13.87 0.335 R140Q 40/40 2.39 0.092 0/40 0/40 0/40
R140L 0/40 40/40 3.14 0.045 0/40 0/40
R140G 0/40 0/40 40/40 0.79 0.06 40/40 3.61 0.136 R140W 0/40 0/40 0/40 40/40 2.74 0.191 R172K 0/40 0/40 0/40 17/40 14.32 0.364 R172M 1/40 11.82 0/40 0/40 29/40 14.04 0.441 R172G 0/40 0/40 0/40 21/40 14.09 0.453 R172St* 2/40 12.15 0.021 0/40 0/40 16/40 14.22 0.389 R172Sc* 1/40 12.13 0/40 0/40 24/40 14.25 0.321 R172W 3/40 12.14 0.435 0/40 0/40 25/40 14.07 0.311 R140P 0/40 0/40 0/40 0/40 R172T 2/40 12.11 0.007 0/40 0/40 18/40 14.33 0.264 #n = number of reactions out of 40 that resulted in the detectable dCN values used to calculate mean and SD. *Note: The R172St and R172Sc alleles are not individually resolved. Both R172St and R172Sc are identified by the assay as R172S. Shaded cells indicate results for the matched mutations and probes for those mutations.

PMA P170005: FDA Summary of Safety and Effectiveness Data Page 17
Table 14. Mean dCN and SD Calculated for Probes to the R172 Alleles of IDH2 for each sample with Plasmids Containing Specific IDH2 mutation. R172K R172M R172S R172G R172W
Mutation n# Mean SD n# Mean SD n# Mean SD n# Mean SD n# Mean SD
WT 0/40 0/40 0/40 0/40 0/40 R140Q 1/40 10.47 0/40 0/40 0/40 0/40
R140L 0/40 0/40 0/40 0/40 0/40
R140G 0/40 0/40 0/40 0/40 0/40 R140W 0/40 0/40 0/40 0/40 0/40 R172K 40/40 0.13 0.056 0/40 0/40 0/40 0/40 R172M 0/40 40/40 1.86 0.093 0/40 0/40 0/40 R172G 0/40 0/40 0/40 0/40 1.82 0.18 0/40 R172St* 0/40 0/40 40/40 0.27 0.046 0/40 0/40 R172Sc* 0/40 0/40 40/40 0.18 0.095 0/40 0/40
R172W 0/40 0/40 0/40 0/40 40/40 1.89 0.05 R140P 0/40 0/40 0/40 0/40 0/40 R172T 0/40 0/40 0/40 0/40 0/40 #n = number of reactions out of 40 that resulted in the detectable dCN values used to calculate mean and SD. *Note: The R172St and R172Sc alleles are not individually resolved. Both R172St and R172Sc are identified by the assay as R172S. Shaded cells indicate results for the matched mutations and probe sets designed to detect those mutations.
8. Potentially Interfering Substances
This study evaluated whether the Abbott RealTime IDH2 assay results are impacted by medically relevant levels of potentially interfering substances that may be found in clinical specimens. Potentially interfering substances that may be found in clinical specimens were added to IDH2 mutation negative, IDH2 R140Q mutation positive, and IDH2 R172K mutation positive blood and bone marrow aspirate specimens. A 6% mutation level was targeted for IDH2 mutation positive panel members. A total of 3 replicates of each test condition and each sample were evaluated for the presence of potential interference. Test conditions included control diluents (one for bilirubin and one for all other substances) or 6 potentially interfering substances at study specified concentrations (endogenous interferents evaluated were hemoglobin, albumin, bilirubin, triglycerides; exogenous interferents evaluated were (R)-2-hydroxyglutarate (2-
PMA P170005: FDA Summary of Safety and Effectiveness Data Page 18
HG), and EDTA). The analysis demonstrated the percent agreement was 100% (3/3) for each sample at each test condition. No interference of the Abbott RealTime IDH2 assay was observed in the presence of the potentially interfering substances for all IDH2 mutation positive and negative samples for either blood or bone marrow aspirate specimens.
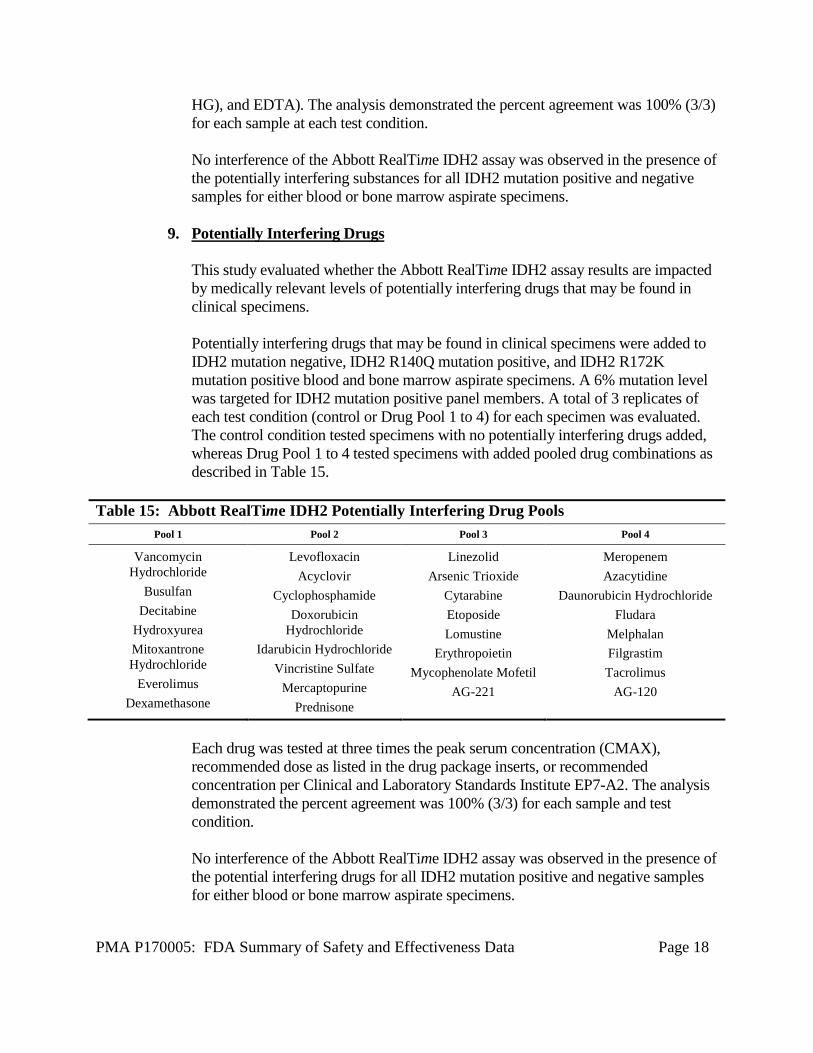
9. Potentially Interfering Drugs This study evaluated whether the Abbott RealTime IDH2 assay results are impacted by medically relevant levels of potentially interfering drugs that may be found in clinical specimens. Potentially interfering drugs that may be found in clinical specimens were added to IDH2 mutation negative, IDH2 R140Q mutation positive, and IDH2 R172K mutation positive blood and bone marrow aspirate specimens. A 6% mutation level was targeted for IDH2 mutation positive panel members. A total of 3 replicates of each test condition (control or Drug Pool 1 to 4) for each specimen was evaluated. The control condition tested specimens with no potentially interfering drugs added, whereas Drug Pool 1 to 4 tested specimens with added pooled drug combinations as described in Table 15.
Table 15: Abbott RealTime IDH2 Potentially Interfering Drug Pools Pool 1 Pool 2 Pool 3 Pool 4
Vancomycin Hydrochloride
Busulfan Decitabine
Hydroxyurea Mitoxantrone Hydrochloride
Everolimus Dexamethasone
Levofloxacin Acyclovir
Cyclophosphamide Doxorubicin
Hydrochloride Idarubicin Hydrochloride
Vincristine Sulfate Mercaptopurine
Prednisone
Linezolid Arsenic Trioxide
Cytarabine Etoposide Lomustine
Erythropoietin Mycophenolate Mofetil
AG-221
Meropenem Azacytidine
Daunorubicin Hydrochloride Fludara
Melphalan Filgrastim Tacrolimus
AG-120
Each drug was tested at three times the peak serum concentration (CMAX), recommended dose as listed in the drug package inserts, or recommended concentration per Clinical and Laboratory Standards Institute EP7-A2. The analysis demonstrated the percent agreement was 100% (3/3) for each sample and test condition. No interference of the Abbott RealTime IDH2 assay was observed in the presence of the potential interfering drugs for all IDH2 mutation positive and negative samples for either blood or bone marrow aspirate specimens.

PMA P170005: FDA Summary of Safety and Effectiveness Data Page 19
10. Potential Interfering Microorganisms This study evaluated whether the Abbott RealTime IDH2 assay results were impacted by the presence of medically relevant levels of microorganisms that may be found in clinical specimens. Potentially interfering microorganisms were added to IDH2 mutation negative, IDH2 R140Q mutation positive, and IDH2 R172K mutation positive blood and bone marrow aspirate specimens. A 6% mutation level was targeted for IDH2 mutation positive panel members. A total of 3 replicates of each of 5 test conditions (control and Microbe Pools 1 to 4) were evaluated. The microbe pools were shown in Table 16.
Table 16: Abbott RealTime IDH2 Potentially Interfering Microbe Pools Pool 1 Pool 2 Pool 3 Pool 4
Staphylococcus aureus (MRSA; COL) Streptococcus agalactiae Enterococcus
faecalis Pseudomonas aeruginosa
Staphylococcus aureus (CoNS) Streptococcus pneumoniae Enterobacter
cloacae Acinetobacter baumannii
Staphylococcus epidermidis Klebsiella pneumoniae Aspergillus terreus varicella-zoster virus
Escherichia coli Candida albicans influenza A H3 respiratory syncytial virus type A
Serratia marcescens herpes simplex virus type 1 MacIntyre respiratory syncytial virus
type B
cytomegalovirus herpes simplex virus type 2 MS
Potentially interfering microorganisms were chosen based on clinical presentation in AML patients. The analysis demonstrated the percent agreement was 100% (3/3) for each sample and test condition. No interference or cross reactivity of the Abbott RealTime IDH2 assay was observed in the presence of the potentially interfering microorganisms for all IDH2 mutation positive and negative samples tested with either blood or bone marrow aspirate specimens.
11. Precision: Within-Laboratory Repeatability The within-laboratory repeatability was evaluated by two operators using a 12-member panel. The panel contained IDH2 mutation negative blood and bone marrow aspirate specimens as well as IDH2 R140 and IDH2 R172 mutation positive

PMA P170005: FDA Summary of Safety and Effectiveness Data Page 20
blood and bone marrow aspirate specimens targeting 6% mutation level. Positive mutations were chosen such that the panel contained a representative mutation amplified by each of the four master mixes. Each operator tested the panel using 2 lots of grouped reagents–2 lots of Abbott mSample Preparation SystemDNA kits, Abbott RealTime IDH2 Amplification Reagent Kits, and Abbott RealTime IDH2 Control Kits–for 4 runs per lot over 4 days. Each run consisted of 2 replicates for each panel member for a total of 32 replicates per panel member (16 replicates per lot). Testing was conducted using 2 m2000rt instruments. Each reagent lot was assigned to its own instrument. The Abbott RealTime IDH2 assay demonstrated a percent agreement of 100% with expected results for each panel member by operator, by lot, and overall. (Table 17)
Table 17: Abbott RealTime IDH2 Repeatability Overall Percent Agreement
Agreement with Expected
Result (Number of Replicates)
Mutation Status Sample Type Yes No
Percent Agreement
(%)
95% Confidence Interval
WT Blood 32 0 100 (89 - 100) WT Blood 32 0 100 (89 - 100)
R140Q Blood 32 0 100 (89 - 100) R140W Blood 32 0 100 (89 - 100) R172K Blood 32 0 100 (89 - 100) R172W Blood 32 0 100 (89 - 100)
WT Bone Marrow 32 0 100 (89 - 100) WT Bone Marrow 32 0 100 (89 - 100)
R140Q Bone Marrow 32 0 100 (89 - 100) R140W Bone Marrow 32 0 100 (89 - 100) R172K Bone Marrow 32 0 100 (89 - 100) R172W Bone Marrow 32 0 100 (89 - 100)
The mean and SD of dCN values and the within-run, between-run, between-lot and between-operator variability are shown in Table 18. The mean and SD of dCN values and the within-run, between-run, between-lot and between-operator variability for Positive and Negative Controls are shown in Tables 19 and 20.

PMA P170005: FDA Summary of Safety and Effectiveness Data Page 21
Table 20. Analysis of Oligo Internal Control (IC) CN values for Positive and Negative controls
Within-Run Variability
Between-Run Variability
Between-Lot Variability
Between-Operator
Variability Total
Panel Value N Mean SD SD SD SD SD
IDH2 Negative Control
OLIGO1 IC CN
32 22.79 0.264 0.000 0.059 0.000 0.270
OLIGO2 IC CN
32 22.78 0.253 0.000 0.076 0.000 0.265
OLIGO3 IC CN
32 22.76 0.291 0.000 0.034 0.008 0.293
Table 18: Abbott RealTime IDH2 Repeatability Precision Analysis dCN Values
Within-Run Variability
Between-Run
Variability
Between-Lot Variability
Between-Operator
Variability Total
Mutation Status
Sample Type N Mean
dCN SD SD SD SD SD
R140Q Blood 32 5.06 0.129 0.088 0.061 0.21 0.264 R140W Blood 32 5.7 0.091 0.138 0.302 0.302 0.345 R172K Blood 32 3.01 0.125 0.017 0.226 0 0.259 R172W Blood 32 4.97 0.079 0.158 0.208 0.208 0.273
R140Q Bone Marrow 32 5.49 0.126 0.153 0.185 0.031 0.271
R140W Bone Marrow 32 5.67 0.328 0.117 0.269 0.138 0.44
R172K Bone Marrow 32 3.75 0.172 0.207 0.113 0.206 0.358
R172W Bone Marrow 32 4.33 0.064 0.318 0.302 0.302 0.443
Table 19: Analysis of mutant CN values for Positive Control
Within-Run Variability
Between-Run Variability
Between-Lot Variability
Between-Operator
Variability Total
Panel Value N Mean SD SD SD SD SD
IDH2 Positive Control
R140Q CN 32 26.03 0.347 0.000 0.290 0.096 0.462
R140W CN 32 25.98 0.332 0.029 0.541 0.056 0.638
R172K CN 32 23.74 0.313 0.000 0.000 0.000 0.313
R172W CN 32 25.16 0.239 0.091 0.593 0.019 0.645

PMA P170005: FDA Summary of Safety and Effectiveness Data Page 22
Table 20. Analysis of Oligo Internal Control (IC) CN values for Positive and Negative controls
Within-Run Variability
Between-Run Variability
Between-Lot Variability
Between-Operator
Variability Total
Panel Value N Mean SD SD SD SD SD
OLIGO4 IC CN
32 22.81 0.283 0.000 0.071 0.000 0.292
IDH2 Positive Control
OLIGO1 IC CN
32 22.83 0.303 0.000 0.141 0.040 0.337
OLIGO2 IC CN
32 22.82 0.320 0.000 0.130 0.051 0.349
OLIGO3 IC CN
32 22.81 0.305 0.000 0.138 0.043 0.338
OLIGO4 IC CN
32 22.83 0.290 0.041 0.139 0.051 0.329
12. Reproducibility Studies
A. Within-Laboratory Lot-to-Lot Reproducibility
The within-laboratory lot-to-lot reproducibility was evaluated using 3 unique lots of Abbott mSample Preparation SystemDNA kits and 3 unique lots of Abbott RealTime IDH2 Amplification Reagent Kits. A 12-member panel contained IDH2 mutation negative blood and bone marrow specimens as well as IDH2 R140 and IDH2 R172 mutation positive blood and bone marrow specimens. A 6% mutation level was targeted for IDH2 mutation positive panel members. Positive mutations were chosen such that the panel contained a representative mutation amplified by each of the four master mixes. For each panel member, 10 replicates were prepared using 3 unique lots of Abbott mSample Preparation SystemDNA kits for a total of 30 extractions per panel member. Each extraction was tested using 3 unique lots of Abbott RealTime IDH2 Amplification Reagent Kit for a total of 9 unique sample preparation/amplification kit combinations. Three m2000rt instruments were used, one for each lot of Abbott RealTime IDH2 Amplification Reagent Kit. Thus, for each panel member, a total of 90 replicates were tested. All mutation positive panel members reported “Mutation Detected” with a 100% percent agreement across all 90 replicates, and all mutation negative panel members reported “Not Detected” with a 100% percent agreement across all 90 replicates . The percent agreement by Abbott mSample Preparation SystemDNA lot was 100% (30/30) agreement for each panel member. The percent agreement by Abbott RealTime IDH2 Amplification

PMA P170005: FDA Summary of Safety and Effectiveness Data Page 23
Reagent Kit lot was 100% (30/30) agreement for each panel member. The Abbott RealTime IDH2 assay demonstrated a percent agreement of 100% with expected results for each panel member by sample preparation kit lot, amplification reagent kit lot, and overall. Within-Laboratory Lot-to-Lot Reproducibility, the mean and SD of dCN values and the between-rep, between-amp lot and between-sample prep lot variability are shown in Table 21. The mean and SD of dCN values and the between-rep, between-amp lot and between-sample prep lot variability for Positive and Negative Controls are shown in Tables 22 and 23.
Table 21. Analysis of dCN values
Between-Replicate
Variability
Between-Amplification
Lot Variability
Between-Sample Prep Lot
Variability Total
Panel Mutation Status
Sample Type N
Mean SD SD SD SD
03 R140Q Blood 90 5.01 0.168 0.188 0.082 0.265
04 R140W Blood 90 5.49 0.173 0.256 0.176 0.331
05 R172K Blood 90 2.86 0.139 0.076 0.160 0.225
06 R172W Blood 90 4.93 0.084 0.151 0.063 0.184
09 R140Q Bone Marrow
90 4.48 0.212 0.200 0.209 0.358
10 R140W Bone Marrow
90 5.90 0.134 0.201 0.029 0.242
11 R172K Bone Marrow
90 3.81 0.195 0.068 0.091 0.226
12 R172W Bone Marrow
90 4.38 0.205 0.162 0.064 0.269
Table 22. Analysis of IC CN values for Positive and Negative Controls
Between-Rep
Variability
Between-Amp Lot
Variability
Between-Sample Prep Lot
Variability Total
Panel Value N Mean SD SD SD SD
IDH2 Negative Control
OLIGO1 IC CN
54 23.13 0.387 0.460 0.000 0.601
OLIGO2 IC CN
54 23.19 0.567 0.548 0.000 0.788

PMA P170005: FDA Summary of Safety and Effectiveness Data Page 24
Table 22. Analysis of IC CN values for Positive and Negative Controls
Between-Rep
Variability
Between-Amp Lot
Variability
Between-Sample Prep Lot
Variability Total
Panel Value N Mean SD SD SD SD
OLIGO3 IC CN
54 23.16 0.569 0.544 0.000 0.787
OLIGO4 IC CN
54 23.25 0.617 0.616 0.041 0.873
IDH2 Positive Control
OLIGO1 IC CN
54 23.14 0.394 0.485 0.095 0.632
OLIGO2 IC CN
54 23.16 0.381 0.510 0.086 0.643
OLIGO3 IC CN
54 23.14 0.426 0.556 0.121 0.711
OLIGO4 IC CN
54 23.20 0.376 0.513 0.098 0.643
Table 23. Analysis of mutant CN values for Positive Control
Between-Rep
Variability
Between-Amp Lot
Variability
Between-Sample Prep Lot
Variability Total
Panel Value N Mean SD SD SD SD
IDH2 Positive Control
R140Q CN 54 26.22 0.379 0.330 0.108 0.514
R140W CN 54 26.03 0.402 0.484 0.149 0.646
R172K CN 54 24.10 0.465 0.472 0.130 0.675
R172W CN 54 25.31 0.371 0.438 0.101 0.583
B. Specimen Handling Reproducibility Reproducibility of the Abbott RealTime IDH2 assay was evaluated at 3 external sites by testing IDH2 wild type (WT) mutation negative and IDH2 mutation positive blood and bone marrow specimens. The panel included a wild type (“WT”) bone marrow panel member and WT blood panel member prepared from pooled AML bone marrow or blood specimens, respectively. The panel also included R140Q or R172K positive bone marrow and blood panel members. They were prepared by spiking

PMA P170005: FDA Summary of Safety and Effectiveness Data Page 25
R140Q or R172K positive cell lines in bone marrow or blood (targeting 6% mutation). At each site, a technologist performed 1 sample preparation and run per day of the testing panel for 6 days. Each run contained 2 replicates of each panel member yielding a total of 12 replicates for each panel member or 36 replicates for each panel member for all 3 sites combined. Each site used a unique lot of the Abbott mSample Preparation System DNA kit for a total of 3 unique lots. The same lot of Abbott RealTime IDH2 Amplification Reagent Kit and Abbott RealTime IDH2 Control Kit was used across all sites. The sample handling reproducibility analysis demonstrated 100% (12/12) agreement for each panel member by site, and 100% (36/36) overall agreement for each panel member. The mean and SD of dCN values and the within-run, between-run and between-site variability are shown in Table 24. The mean and SD of dCN and the within-run, between-run and between-site variability for Positive and Negative Controls are shown in Table 25.
Table 24: Specimen Handling Reproducibility: Overall Variability of dCN for mutation positive samples and CN of Internal Controls (IC) for mutation negative samples.
Within-Run
Variability
Between-Run
Variability
Between-Site
Variability Total
Panel Mutation Specimen
Type Value N Mean SD SD SD SD
1 WT Blood OLIGO1 IC CN
36 16.05 1.578 0.000 1.383 2.099
WT Blood OLIGO2 IC CN
36 16.04 1.628 0.000 1.392 2.142
WT Blood OLIGO3 IC CN
36 15.96 1.545 0.000 1.371 2.066
WT Blood OLIGO4 IC CN
36 16.06 1.642 0.000 1.363 2.134
2 R140Q Blood dCN 36 4.13 0.148 0.106 0.187 0.261
3 R172K Blood dCN 36 2.17 0.111 0.094 0.219 0.263
4 WT Bone Marrow
OLIGO1 IC CN
36 17.54 0.306 0.203 0.562 0.671
WT Bone Marrow
OLIGO2 IC CN
36 17.52 0.298 0.206 0.564 0.670
WT Bone Marrow
OLIGO3 IC CN
36 17.44 0.279 0.229 0.551 0.659

PMA P170005: FDA Summary of Safety and Effectiveness Data Page 26
Table 24: Specimen Handling Reproducibility: Overall Variability of dCN for mutation positive samples and CN of Internal Controls (IC) for mutation negative samples.
Within-Run
Variability
Between-Run
Variability
Between-Site
Variability Total
Panel Mutation Specimen
Type Value N Mean SD SD SD SD
WT Bone Marrow
OLIGO4 IC CN
36 17.54 0.288 0.193 0.543 0.644
5 R140Q Bone Marrow
dCN 36 4.52 0.163 0.091 0.212 0.282
6 R172K Bone Marrow
dCN 36 2.69 0.203 0.093 0.144 0.266
Table 25: Specimen Handling Reproducibility: Analysis of Oligo Internal Controls (IC) CN and mutant CN values for Positive and Negative Controls
Between-Run
Variability Between-Site Variability Total
Panel Value N Mean SD SD SD
IDH2 Negative Control
OLIGO1 IC CN
18 22.99 0.177 0.087 0.198
OLIGO2 IC CN
18 22.93 0.174 0.113 0.208
OLIGO3 IC CN
18 22.87 0.159 0.117 0.197
OLIGO4 IC CN
18 22.94 0.182 0.097 0.206
IDH2 Positive Control
R140Q CN 18 25.07 0.282 0.215 0.354
R140W CN 18 25.73 0.235 0.000 0.235
R172K CN 18 23.03 0.150 0.208 0.256
R172W CN 18 24.97 0.162 0.060 0.173
OLIGO1 IC CN
18 22.37 0.194 0.000 0.194
OLIGO2 IC CN
18 22.29 0.163 0.000 0.163

PMA P170005: FDA Summary of Safety and Effectiveness Data Page 27
Table 25: Specimen Handling Reproducibility: Analysis of Oligo Internal Controls (IC) CN and mutant CN values for Positive and Negative Controls
Between-Run
Variability Between-Site Variability Total
Panel Value N Mean SD SD SD
OLIGO3 IC CN
18 22.25 0.172 0.089 0.194
OLIGO4 IC CN
18 22.38 0.182 0.109 0.212
C. Specimen Handling Reproducibility – Clinical specimens with IDH2
mutations This specimen handling reproducibility using of Abbott RealTime IDH2 was evaluated by two operators. The source for the IDH2 mutation was from clinical specimens. Each operator tested a panel using the same lots of Abbott RealTime IDH2 Amplification Reagent Kit and Abbott RealTime IDH2 Control Kit and unique lots of mSample Preparation SystemDNA Kits. Each technologist tested a 4-member panel. The panel contained two mutation positive AML blood (R140W and R172Q) and two mutation positive bone marrow aspirate (R140W and R140Q) specimens. Each of two operators performed 1 sample preparation and run per day, for a total of 5 days. Each run contained 2 duplicates for each panel member. The sample handling reproducibility analysis demonstrated 100% (20/20) overall agreement for each panel member. The mean and SD of dCN values and the within-run, between-run and between-operator variability are shown in Table 26.
Table 26. Specimen Handling Reproducibility - Clinical specimens: Overall Variability of dCN for mutation positive samples.
Within-
Run Variability
Between-Run
Variability
Between-Operator
Variability Total
Panel Value Mutation Status
Sample Type N Mean SD SD SD SD
1 dCN R140W Bone Marrow 20 8.15 0.209 0 0 0.209
2 dCN R140Q Bone Marrow 20 2.13 0.038 0.038 0.059 0.08
3 dCN R172K Blood 20 1.03 0.034 0.039 0.157 0.165 4 dCN R140W Blood 20 7.97 0.078 0.06 0.382 0.395

PMA P170005: FDA Summary of Safety and Effectiveness Data Page 28
D. Eluate Reproducibility
Abbott RealTime IDH2 assay was evaluated at 3 external sites by testing DNA eluate extracted from IDH2 wild type (WT) mutation negative and IDH2 mutation positive blood and bone marrow specimens. The panel members included 10 IDH2 SNVs and wild type specimens targeting 50 ng and 200 ng gDNA input levels for each bone marrow and blood. The R140Q and R172K panel members for both blood and bone marrow were prepared using clinical specimens. The remaining mutation positive panel members were prepared from eluates of IDH2 mutation positive cell lines spiked into blood or bone marrow. IDH2 mutation positive panel members were prepared to target a mutation percentage of approximately 2% or 15%. Panel members were tested using 3 unique lots of Abbott RealTime IDH2 Amplification Reagent Kit. At each site, 2 technologists performed 2 amplification/detection runs over a minimum of 5 days. Each run included 3 replicates of each panel member yielding a total of 180 replicates for each panel member for all 3 sites combined. The eluate reproducibility analysis demonstrated 100% agreement for each panel member at each site and 100% agreement for each panel member tested with each Abbott RealTime Amplification Reagent Kit lot. The overall agreement was 100% for each panel member for all sites and lots combined . The mean and SD of dCN values and the within-run, between-run, between-lot, between-operator and between-site variability are shown in Table 27. The mean and SD of dCN values and the within-run, between-run, between-lot, between-operator and between-site variability for Positive and Negative Controls are shown in Table 28.
Table 27: Eluate Reproducibility: Overall Variability of dCN for mutation positive samples and CN of Internal Controls (IC) for mutation negative samples.
Within-Run
Variability
Between-Run
Variability
Between-Lot
Variability
Between-Operator
Variability
Between-Site
Variability Total
Panel Mutation Specimen
Type Value N Mean SD SD SD SD SD SD
1 R140Q Bone Marrow
dCN 180 6.25 0.259 0.074 0.092 0.083 0.235 0.378
2 R172K Bone Marrow
dCN 180 0.61 0.047 0.040 0.055 0.015 0.317 0.328
3 R140W Bone Marrow
dCN 180 6.80 0.190 0.149 0.143 0.072 0.229 0.369

PMA P170005: FDA Summary of Safety and Effectiveness Data Page 29
Table 27: Eluate Reproducibility: Overall Variability of dCN for mutation positive samples and CN of Internal Controls (IC) for mutation negative samples.
Within-Run
Variability
Between-Run
Variability
Between-Lot
Variability
Between-Operator
Variability
Between-Site
Variability Total
Panel Mutation Specimen
Type Value N Mean SD SD SD SD SD SD
4 R140L Bone Marrow
dCN 180 6.65 0.191 0.030 0.025 0.032 0.084 0.215
5 R140G Bone Marrow
dCN 180 4.65 0.113 0.053 0.081 0.002 0.348 0.378
6 R172M Bone Marrow
dCN 180 3.73 0.085 0.035 0.014 0.000 0.127 0.157
7 R172G Bone Marrow
dCN 180 6.04 0.195 0.000 0.090 0.000 0.110 0.242
8 R172Sc Bone Marrow
dCN 174a 0.85 0.062 0.020 0.050 0.026 0.284 0.297
9 R172St Bone Marrow
dCN 180 4.03 0.143 0.000 0.046 0.019 0.303 0.339
10 R172W Bone Marrow
dCN 180 3.35 0.083 0.025 0.042 0.027 0.122 0.158
11 R140Q Blood dCN 179b 3.46 0.112 0.064 0.028 0.071 0.276 0.314
12 R172K Blood dCN 180 3.70 0.107 0.045 0.054 0.000 0.342 0.365
13 R140W Blood dCN 180 6.89 0.276 0.137 0.000 0.153 0.407 0.533
14 R140L Blood dCN 180 6.84 0.118 0.055 0.102 0.023 0.125 0.208
15 R140G Blood dCN 174a 4.73 0.141 0.040 0.089 0.000 0.326 0.368
16 R172M Blood dCN 180 6.31 0.169 0.030 0.018 0.000 0.127 0.214
17 R172G Blood dCN 174a 3.07 0.112 0.000 0.071 0.000 0.068 0.149
18 R172Sc Blood dCN 180 3.78 0.147 0.000 0.047 0.054 0.287 0.330
19 R172St Blood dCN 179b 1.26 0.053 0.034 0.054 0.015 0.296 0.308
20 R172W Blood dCN 180 6.09 0.140 0.051 0.020 0.000 0.166 0.224
21 WT Bone Marrow
OLIGO1 IC CN
180 18.61 0.138 0.129 0.000 0.010 0.197 0.274
WT Bone Marrow
OLIGO2 IC CN
180 18.61 0.139 0.105 0.000 0.000 0.183 0.253

PMA P170005: FDA Summary of Safety and Effectiveness Data Page 30
Table 27: Eluate Reproducibility: Overall Variability of dCN for mutation positive samples and CN of Internal Controls (IC) for mutation negative samples.
Within-Run
Variability
Between-Run
Variability
Between-Lot
Variability
Between-Operator
Variability
Between-Site
Variability Total
Panel Mutation Specimen
Type Value N Mean SD SD SD SD SD SD
WT Bone Marrow
OLIGO3 IC CN
180 18.55 0.164 0.110 0.000 0.053 0.193 0.281
WT Bone Marrow
OLIGO4 IC CN
180 18.63 0.080 0.124 0.000 0.044 0.216 0.265
22 WT Blood OLIGO1 IC CN
180 19.21 0.661 0.000 0.166 0.401 0.000 0.791
WT Blood OLIGO2 IC CN
180 19.19 0.701 0.146 0.154 0.252 0.180 0.796
WT Blood OLIGO3 IC CN
180 19.17 0.652 0.156 0.138 0.287 0.142 0.755
WT Blood OLIGO4 IC CN
180 19.22 0.551 0.306 0.189 0.266 0.232 0.747
a. Missing replicates due to technologist error. b. Replicates excluded due to instrument error.
Table 28: Eluate Reproducibility: Analysis of Oligo Internal Controls (IC) CN and mutant CN values for Positive and Negative Controls
Between-Run
Variability Between-Lot Variability
Between-Tech Variability
Between-Site
Variability Total
Panel Value N Mean SD SD SD SD SD
IDH2 Negative Control
OLIGO1 IC CN
241 22.93 0.309 0.000 0.269 0.000 0.409
OLIGO2 IC CN
241 22.91 0.314 0.000 0.245 0.000 0.398
OLIGO3 IC CN
241 22.86 0.292 0.035 0.273 0.000 0.402

PMA P170005: FDA Summary of Safety and Effectiveness Data Page 31
Table 28: Eluate Reproducibility: Analysis of Oligo Internal Controls (IC) CN and mutant CN values for Positive and Negative Controls
Between-Run
Variability Between-Lot Variability
Between-Tech Variability
Between-Site
Variability Total
Panel Value N Mean SD SD SD SD SD
OLIGO4 IC CN
241 22.95 0.283 0.000 0.298 0.000 0.411
IDH2 Positive Control
R140Q CN 241 25.60 0.356 0.000 0.302 0.000 0.467
R140W CN 241 26.08 0.423 0.174 0.274 0.000 0.533
R172K CN 241 23.50 0.296 0.045 0.277 0.223 0.466
R172W CN 241 25.28 0.285 0.051 0.269 0.000 0.395
OLIGO1 IC CN
241 22.79 0.327 0.000 0.283 0.000 0.432
OLIGO2 IC CN
241 22.78 0.312 0.013 0.251 0.000 0.400
OLIGO3 IC CN
241 22.75 0.318 0.040 0.281 0.000 0.426
OLIGO4 IC CN
241 22.84 0.305 0.000 0.277 0.000 0.412
13. Analytical Carryover
The purpose of this study was to evaluate the Abbott RealTime IDH2 assay for carryover when high IDH2 mutation positive samples are tested adjacent to IDH2 mutation negative samples (wild type, no IDH2 mutation) or blank samples containing no template. Potential carryover from high IDH2 mutation positive samples to IDH2 mutation negative samples and blank samples was evaluated by testing replicates of alternating samples within the same sample preparation run and amplification-detection run. Six runs were performed, 3 runs alternating 11 high IDH2 mutation positive and 11 IDH2 mutation negative samples and 3 runs alternating 11 high IDH2 mutation positive and 11 blank samples for a total of 132 samples. High IDH2 mutation positive samples were prepared by adding IDH2 R140Q and R172K mutation positive cell lines to normal blood or bone marrow aspirate specimens to achieve approximately 25% mutation level. The IDH2 mutation negative samples were blood or bone marrow aspirate from normal donors; the blank sample was water.

PMA P170005: FDA Summary of Safety and Effectiveness Data Page 32
No carryover was detected for the Abbott RealTime IDH2 assay when high IDH2 mutation positive samples were tested adjacent to IDH2 mutation negative samples or blank samples containing no template.
14. Guardband Studies A. PCR Master Mix and Sample Volume Robustness
The purpose of this study was to characterize the robustness of the Abbott RealTime IDH2 assay to variations in amplification reaction volume. The Abbott RealTime IDH2 assay procedure requires the operator to manually load 45 μL of master mix to be combined with 15 μL of target into wells of a 96-well plate, followed by a visual inspection for proper volume after the addition of the master mix and the target. The visual check allows the operator to catch inaccurate pipetting of larger volumes, but will likely not allow the visualization of small volume changes. However, it is possible that an incorrect amount of master mix or sample could be added to the plate due to operator error or pipette miscalibration. This study addressed the effects of variations in master mix and target volumes on Abbott RealTime IDH2 assay performance. To characterize the robustness of the Abbott RealTime IDH2 assay to variations in master mix and target sample volumes, the following test conditions were run:
• Increase of master mix volume by 10% • Decrease of master mix volume by a range from 10% to 40% • Increase or decrease of target sample volume by 30%
Each condition was assessed with Abbott RealTime IDH2 Positive Control (PC), Abbott RealTime IDH2 Negative Control (NC), and two representative IDH2 mutant plasmid targets (R140W and R172K). Both mutant-containing plasmids were diluted to 5% in a total gDNA input of 20 ng per reaction (15μl). The source of gDNA used for this study was human placental gDNA. All conditions tested provided valid, correct results. This study supports that the Abbott RealTime IDH2 assay is robust to changes in both master mix volume and target sample volume.
B. Master Mix Component Volume Robustness The purpose of this study was to characterize the robustness of the Abbott RealTime IDH2 assay to variations in master mix component volumes. The Abbott RealTime IDH2 is a manual assay that uses four amplification master mixes. Each amplification master mix requires the end user to combine three components by adding 870 µL of Abbott RealTime IDH2 Oligonucleotide Reagent 1 to 4 (oligonucleotide reagent) and 275µL of Abbott RealTime IDH2

PMA P170005: FDA Summary of Safety and Effectiveness Data Page 33
Activation Reagent (activation reagent) to a vial of 56 µL of Abbott RealTime IDH2 DNA Polymerase and vortexing it. It is possible that incorrect volumes of master mix components could be combined due to operator error, pipette miscalibration or AmpliTaq Gold enzyme reagent being short filled, which may impact assay performance. To characterize the robustness of the Abbott RealTime IDH2 assay to variations in master mix component ratios, the following test conditions were run:
• Increase or decrease in oligonucleotide reagent volume (+/- 10 µL) • Increase or decrease in activation reagent volume (+/- 8 µL) • Decrease in polymerase enzyme volume (50% reduction)
The results of this study support that Abbott RealTime IDH2 is robust to changes in both oligonucleotide and activation reagent volumes but is not robust to 50% decrease in polymerase volume.
C. PCR Cycle Temperature and Duration Robustness
The purpose of this study was to characterize the robustness of the Abbott RealTime IDH2 assay to variations in m2000rt instrument PCR cycle temperature and duration. Abbott RealTime IDH2 has set specifications for PCR cycle temperature and cycle duration. However, alterations in m2000rt instrument performance may result in different PCR cycling parameters, which may impact assay performance. This study addresses the effects of variations in PCR cycle temperature and duration on Abbott RealTime IDH2 assay performance. The following test conditions were run to characterize the robustness of the Abbott RealTime IDH2 assay to variations in PCR cycle temperature and duration:
• Increase or decrease all cycle temperatures by 1.0°C • Increase or decrease all cycle durations by 5.0 seconds • A combination of 1.0°C and 5.0 second changes (increases and
decreases) The results of this study support that Abbott RealTime IDH2 is robust to changes in ± 1.0°C in PCR cycle temperature and ± 5 seconds in PCR cycle duration.
D. Ethanol Carryover The purpose of this study was to characterize the robustness of the Abbott RealTime IDH2 assay to residual ethanol carryover in sample preparation eluate. Specimens for the Abbott RealTime IDH2 assay are processed manually using

PMA P170005: FDA Summary of Safety and Effectiveness Data Page 34
the Abbott mSample Preparation System DNA to isolate DNA. The operator is instructed to place the tubes on the magnetic capture stand, use a pipette tip to carefully remove the ethanol wash buffer from the tube, and to remove the liquid as completely as possible. This is followed by a 13 ± 1 minute heated drying step to evaporate residual ethanol. This study assesses the consequences of residual ethanol left behind at these steps due to inadequate pipetting or incomplete drying on Abbott RealTime IDH2 assay performance. The ethanol wash buffer is approximately 75% ethanol. The impact of residual ethanol in sample preparation eluate on the robustness of the Abbott RealTime IDH2 assay was tested by comparing target containing 3% ethanol to target without ethanol (nominal). A final concentration of approximately 3% ethanol was chosen for this study by assuming a worst-case scenario of 20 μl residual ethanol wash buffer after the removal and evaporation steps. After these steps, 500 μl elution buffer is added. In this worst-case scenario the final concentration of ethanol would be: (20 μl (75% ethanol)) / 520 μl = 2.8%. IDH2 mutant plasmid targets (R140Q, R140L, R140G, R140W, R172K, R172M, R172Sc, R172W, and R172G) were diluted to 5% mutation in 20 ng total gDNA input. The source of gDNA used for this study was human placental gDNA. Ethanol (EtOH) was added to a sample of each target type to yield approximately 3% ethanol. For the nine mutants, a total of 3 replicate PCR reactions of each sample with ethanol and a total of 3 replicates without ethanol (nominal) were tested in one run. The results of this study support that Abbott RealTime IDH2 is robust to the presence of residual ethanol in sample and control eluates.
15. Stability Studies
A. Abbott RealTime IDH2 Amplification Reagent Stability
The stability of the Abbott RealTime IDH2 Amplification Reagent was assessed at various time points after storage under the following conditions: intended storage condition -15⁰C to -25⁰C; inverted storage at -15⁰C to -25⁰C; and storage after simulating transport and temperature extreme conditions which consisted of ≥ 30°C for ≥ 4 hours followed by three cycles of ≥ 48 hours in a container with dry ice and ≥ 30°C for ≥ 4 hours, then stored at the intended storage condition. Three lots Abbott RealTime IDH2 Amplification Reagent Kit were tested for stability. The 3 lots have 3 distinct production lots of IDH2 Oligonucleotide Reagents 1, 2, 3, 4, Activation Reagent, and DNA Polymerase bulks. 3 lots were used for the intended storage condition and 1 lot was used for each of the other two conditions.

PMA P170005: FDA Summary of Safety and Effectiveness Data Page 35
There were 22 panel members tested at each timepoint. The 22 panel member consisted of the IDH2 Positive Control, IDH2 Negative Control, blood and bone marrow specimens without IDH2 mutations, and blood and bone marrow specimens representing each of the IDH2 mutations targeted by Abbott RealTime IDH2 assay. The panels consist of DNA eluates that were generated from IDH2 mutation positive cell lines spiked in blood or bone marrow at either a low positive (6% mutation frequency) or high positive (25% mutation frequency). All panel members were tested with 6 replicates at each time point that they are evaluated. Stability at the intended storage condition was evaluated by performing functional testing at day 0, month 2, month 6, month 7, month 12, month 18 and month 19 for the intended use condition. To date, real-time stability testing for the Abbott RealTime IDH2 Amplification Reagent has been completed through month 7 and met acceptance criteria. These data currently support a 6 month stability claim. Stability at the inverted storage condition was tested at day 0, month 6, month 12, month 18 and month 19. To date the inverted condition has been completed through month 6 and met acceptance criteria. The storage after simulating transport and temperature extreme conditions was tested at day 0, day 7, month 7, month 12, month 18 and month 19. To date, the simulating transport and temperature extreme conditions has been tested to day 7.
B. Abbott RealTime IDH2 Control Kit and Abbott mSample Preparation SystemDNA Stability The stability of the Abbott RealTime IDH2 Control Kit and Abbott mSample Preparation SystemDNA kit was assessed at various time points under the following conditions: intended storage condition -15⁰C to -25⁰C; inverted storage at -15⁰C to -25⁰C; and storage after simulating transport and temperature extreme conditions which consisted of ≥ 30°C for ≥ 4 hours followed by three cycles of ≥ 48 hours in a container with dry ice and ≥ 30°C for ≥ 4 hours, then stored at the intended storage condition. The stability of 3 lots of Abbott RealTime IDH2 Control Kit and 3 lots of Abbott mSample Preparation SystemDNA Kit were assessed. Three lots of each kit were used for the intended storage condition and 1 lot was used for each of the other two conditions. IDH2 Positive Control (PC) and IDH2 Negative Control (NC) were tested for each storage condition, at each time point, in this study. The PC and NC are tested with 6 replicates at each time point that they are evaluated. In addition to testing PC and NC, a panel of blood/bone marrow samples were tested at baseline (one run for each of the three lots of sample preparation

PMA P170005: FDA Summary of Safety and Effectiveness Data Page 36
kits). The panel consists of 4 blood samples and 4 bone marrow aspirate samples. The 4 specimens for each sample type were as follows: 2 specimens that are IDH2 mutation negative, 1 specimen with the IDH2 R140Q mutation, and 1 specimen with the IDH2 R172K mutation. This panel will be tested at least one month past the final expiration date. Stability at the intended storage condition was evaluated by performing functional testing at day 0, month 2, month 6, and month 7, and will be evaluated at month 12, month 18 and month 19 for the intended use condition. To date, real-time stability testing for the Abbott RealTime IDH2 Control Kit and Abbott mSample Preparation SystemDNA kit has been completed through month 7 and met acceptance criteria. These data currently support a 6 month stability claim. Stability at the inverted condition has been tested at day 0 and month 6, and will be tested at month 12, month 18 and month 19. To date the inverted condition has been completed through month 6 and met acceptance criteria. The storage after simulating transport and temperature extreme conditions was tested at day 0, day 7 and will be tested at month 7, month 12, month 18 and month 19. Studies have met acceptance criteria for tested time points.
C. Activated Master Mix Use and Storage and Assembled Plate Stability
The storage stability of activated master mix and assembled PCR plate when used with the Abbott RealTime IDH2 assay were assessed using a control condition, and 3 test conditions. The control condition (Condition A) was performed at ambient room temperature (15°C to 30°C) without delay between the master mix preparation and addition to the 96-well PCR plate. The run for the control condition was initiated immediately after the completion of assay set-up. For the activated master mix stability part of this study, activated master mix was stored at 2°C to 8°C for 9 days (test Condition B) or at -20°C (± 5°C) for 62 days with 6 freeze/thaw cycles (test Condition C) before the completion of assay set-up and run initiation. For the assembled plate stability part of this study, test condition (D) had an intentional delay of 180 minutes after master mix preparation and addition to the 96-well PCR plates. Storage stability of activated master mix and assembled PCR plate was assessed using a 22-member panel. Panel members contained the 10 IDH2 mutations targeted by the assay (R140Q, R140L, R140G, R140W, R172K, R172M, R172G, R172Sc, R172St, R172W) and wild type (no IDH2 mutation) in blood and bone marrow. IDH2 mutation positive eluates were generated by adding an IDH2 mutation positive cell line to normal blood or bone marrow specimens, isolated using the Abbott mSample Preparation

PMA P170005: FDA Summary of Safety and Effectiveness Data Page 37
System DNA, and diluted to target 6% mutation and 10 ng total gDNA input. Wild type panel members were created by diluting eluates generated from clinical AML specimens negative for IDH2 mutations to target 10 ng total gDNA. All panel members were tested in triplicate for all conditions. All replicates for both bone marrow specimens and blood specimens showed 100% agreement with the expected result for all storage conditions. The changes observed for dCN, mutant CN and IC CN are considered to be nonsignificant since the changes are within observed run to run variability of the IDH2 assay. The range of dCN mean differences for mutation positive panel members was -0.79 to 0.25, with the largest difference being -0.79 for Condition B. The range of mutant CN mean differences for mutation positive panel members was -0.82 to 0.5, with the largest difference being -0.82 for Condition B. The range of IC CN mean differences for mutation positive and mutation negative panel members was -0.12 to 0.34, with the largest difference being 0.34 for Condition C.
D. Clinical Specimen Stability
Clinical specimen stability was evaluated by testing prospectively collected clinical AML blood specimens (n=6, including 1 with the R140Q mutation) and AML bone marrow aspirate specimens (n=6, including 1 with the R140Q mutation). After fresh collection, specimens were shipped frozen on dry ice for up to 24 hours, placed at -20°C upon receipt, and then thawed and aliquotted for the testing. The control condition (Condition A) was performed by performing DNA extraction immediately upon receipt. The control condition was compared to the following storage conditions: storage at 15⁰C to 30⁰C for 48 hours (Condition B); Storage at 2⁰C to 8⁰C for 7 days (Condition C); Storage at -20⁰C for 30-35 days with 4 freeze thaw cycles (Condition D); and store on dry ice for 8 days (Condition E). Each condition was tested in triplicate with the exception of a bone marrow aspirate sample that only had enough material to test in duplicate. All replicates for both bone marrow specimens and blood specimens were in 100% agreement with the expected result for all storage conditions. Variation in dCN, mutant CN and IC CN values were evaluated and were within the observed run to run variability of the assay. These results demonstrated that the clinical specimens were stable when stored under the tested conditions.
X. SUMMARY OF PRIMARY CLINICAL STUDY

PMA P170005: FDA Summary of Safety and Effectiveness Data Page 38
The safety and effectiveness of the Abbott RealTime IDH2 assay were demonstrated through testing of specimens from patients enrolled in Study AG221-C-001 (ClinicalTrials.gov Identifier: NCT01915498). Study AG221-C-001 was an open-label, single-arm, international, multicenter, two-cohort clinical trial of IDHIFA® (enasidenib) on 199 adult patients with relapsed or refractory Acute Myeloid Leukemia (R/R AML) and one of 9 mutations in codons R140 or R172 mutation in IDH2. A. Study Design
Study AG221-C-001 was an open-label, single-arm, international, multicenter, two-cohort clinical trial of IDHIFA® (enasidenib) on 199 adult patients with relapsed or refractory AML (R/R AML) and an R140 or R172 mutation in IDH2 who were treated with 100 mg daily dose of IDHIFA. Study AG221-C-001 included a phase 1 (dose escalation and dose-expansion) portion (cohort 1) and a single arm phase 2 portion (cohort 2). Cohort 1 included 101 patients and Cohort 2 included 98 patients who received the 100 mg daily dose of IDHIFA. IDH2 mutations were identified by a local diagnostic test and retrospectively confirmed by the Abbott RealTime™ IDH2 assay, or prospectively identified by the Abbott RealTime™ IDH2 assay. Both peripheral blood and bone marrow specimens were obtained from all patients for testing. Specimen types for patients that were retrospectively confirmed with the Abbott RealTime IDH2 assay were peripheral blood, peripheral blood mononuclear cells, bone marrow aspirate, and bone marrow aspirate mononuclear cells, based on availability. Clinical testing was performed at four geographically diverse sites. 1. Clinical Inclusion Criteria
a. Inclusion Criteria for Specimen Testing
• Specimens had to have sufficient sample volume for testing. • The specimen had to be handled or stored in accordance to the
Abbott RealTime IDH2 Clinical Brochure. • Specimens were collected with appropriate informed consent.
b. Inclusion Criteria for Patient Enrollment in AG221-C-001 (abbreviated)
• Relapsed or refractory AML • IDH2 mutation detected in blood or bone marrow specimen. • ECOG performance score of 0 to 2 • Platelet count ≥ 20,000/µL (transfusions allowed) unless due to
underlying malignancy • Serum total bilirubin ≤ 1.5 x ULN unless due to Gilbert’s disease,
a gene mutation in UGT1A1, or leukemic organ involvement • AST, ALT and alkaline phosphatase ≤ 3.0 x ULN unless due to
underlying malignancy

PMA P170005: FDA Summary of Safety and Effectiveness Data Page 39
• Serum creatinine ≤ 2.0 x ULN or creatinine clearance > 40 mL/min based on the Cockroft-Gault formula
• No CNS leukemia • No HSCT (Hematopioetic Stem Cell Transplant) within 60 days
prior to the first dose of enasidenib, no requirement for post-HSCT immunosuppressive therapy at screening, and no clinically significant GVHD (graft-versus-host disease)
• No systemic anticancer therapy or radiotherapy within 14 days prior to the first dose of enasidenib (hydroxyurea allowed for control of peripheral leukemic blasts in subjects with WBC > 30,000/µL)
• None of the following cardiac conditions: New York Heart Association Class III or IV congestive heart failure, left ventricular ejection fraction < 40%, history of myocardial infarction within the 6 months prior to screening, uncontrolled hypertension (SBP > 180 mmHg or DBP > 100 mm Hg), uncontrolled angina pectoris, history of severe ventricular arrhythmias, or QTcF ≥ 450 msec
• Not pregnant and not nursing, and willing to use highly effective method of birth control
2. Follow-up Schedule
Disease assessment and other clinical assessments were conducted according to protocol during the trial. Patients were to be followed for a minimum of six, 28-day cycles of IDHIFA or discontinued study therapy in order to be included analysis. One hundred ninety six of 199 patients met this criteria and all were included in the final analysis.
3. Clinical Endpoints
Efficacy of IDHIFA was established on the basis of the rate of complete response (CR)/complete response with partial hematologic recovery (CRh), the duration of CR/CRh, and the rate of conversion from transfusion dependence to transfusion independence.
B. Accountability of PMA Cohort
Study AG221-C-001 contains 199 patients in 2 cohorts that were included in efficacy analysis of IDHIFA. To be included in the efficacy analysis, the Abbott RealTime IDH2 assay had to detect an IDH2 mutation in either blood or bone marrow and the patient had to receive a 100 ng daily dose of IDHIFA. The description below includes all patients that were tested with the Abbott RealTime IDH2 assay that were either enrolled or screened for enrollment for Cohort 1 or Cohort 2.
i. Accountability of Cohort 1

PMA P170005: FDA Summary of Safety and Effectiveness Data Page 40
A total of 177 subjects with relapsed or refractory AML were enrolled in cohort 1. Both peripheral blood and bone marrow specimens were obtained from each patient. Specimens were generally stored as frozen cell pellets. The following specimen types were retrospectively tested from each patient, when available: peripheral blood (n=67), peripheral blood mononuclear cells (PBMC) (n=170), bone marrow aspirate (n= 66) and bone marrow aspirate mononuclear cells (BMMC) (n=145). Subjects were excluded if there were no specimen types with sufficient volume for testing (n=5). 172 patients were tested with the Abbott RealTime IDH2 assay resulting in 167 patients with detectible IDH2 mutations and 5 patients without detectable IDH2 mutations. Of the remaining 167 patients, 3 were excluded due to insufficient data to confirm relapse at baseline and 62 subjects were excluded due to not being assigned the 100 mg daily dose, leaving 101 patients to be included in the therapeutic efficacy analysis of IDHIFA.
ii. Accountability of Cohort 2 Specimens from blood and or bone marrow aspirate from total of 134 subjects were tested with Abbott RealTime IDH2 assay. 129 subjects had detectable IDH2 mutations and the 5 without detectable IDH2 mutations were excluded. Of the 129 patients with IDH2 mutations, 6 were excluded because there was insufficient data to confirm AML relapse at baseline, 2 were excluded because they did not have relapse or refractory AML, 2 were excluded because they were not treated with IDHIFA, and 21 were excluded for not meeting other inclusion/exclusion criteria. This resulted in 98 patients to be included in the efficacy analysis of IDHIFA.
C. Study Population Demographics and Baseline Parameters
The demographics and baseline characteristics of the 199 patients used for efficacy analysis within study AG221-C-001 are shown in Table 29. The median age of study participants was 68 years and predominantly white (77%). Enrollment according to gender was equivalent. The predominant IDH2 positive mutation was R140Q (75%) followed by R172K (20%). Four (4) IDH2 mutations were not detected in patients enrolled into the trial (R140G, R172M, R172G, R172S).
Table 29: Baseline Demographic and Disease Characteristics in Patients with Relapsed or Refractory AML Demographic and Disease Characteristics IDHIFA (100 mg daily)
N=199 Demographics Age (Years) Median (Min, Max) 68 (19, 100) Age Categories, n (%) <65 years ≥65 years to <75 years
76 (38) 74 (37)

PMA P170005: FDA Summary of Safety and Effectiveness Data Page 41
≥75 years 49 (25) Sex, n (%) Male Female
103 (52) 96 (48)
Race, n (%) White Black Asian Native Hawaiian/ Other Pacific Islander Other / Not Provided
153 (77) 10 (5) 1 (1) 1 (1)
34 (17) Disease Characteristics ECOG PS a, n (%) 0 1 2
46 (23) 124 (62) 28 (14)
Relapsed AML, n (%) Refractory AML, n (%)
95 (48) 104 (52)
IDH2 Mutation b, n (%) R140 R140Q R140W R140L R172 R172K R172W
155 (78) 150 (75)
4 (2) 1 (1)
44 (22) 40 (20)
4 (2) Time from Initial AML Diagnosis (months) Median (min, max) (172 patients)
11.3 (1.2, 129.1)
Cytogenetic Risk Status, n (%) Intermediate Poor Missing /Failure
98 (49) 54 (27) 47 (24)
Prior Stem Cell Transplantation for AML, n (%) 25 (13) Transfusion Dependent at Baseline c, n (%) 157 (79) Number of Prior Anticancer Regimens, n (%) d 1 2 ≥3 Median number of prior therapies (min, max)
89 (45) 64 (32) 46 (23) 2 (1, 6)
a 1 patient had missing baseline ECOG PS. b For 3 patients with different mutations detected in bone marrow compared to blood, the result of blood was reported following evaluation of all available patient results.
c Patients were defined as transfusion dependent at baseline if they received any red blood cell or platelet transfusions within the 8-week baseline period.
d Includes intensive and/or nonintensive therapies. D. Safety and Effectiveness Results
PMA P170005: FDA Summary of Safety and Effectiveness Data Page 42
1. Safety Results
The safety with respect to treatment with IDHIFA (enasidenib) will not be addressed in detail in this SSED. Refer to Drugs@FDA for safety information on IDHIFA. Briefly, the most common adverse reactions (≥20%) of any grade were nausea, vomiting, diarrhea, elevated bilirubin and decreased appetite. Serious adverse reactions were reported in 77.1% of patients. The most frequent serious adverse reactions (≥2%) were leukocytosis (10%), diarrhea (6%), nausea (5%), vomiting (3%), decreased appetite (3%), tumor lysis syndrome (5%), and differentiation syndrome (8%). Differentiation syndrome events characterized as serious included pyrexia, renal failure acute, hypoxia, respiratory failure, and multi-organ failure. Abbott RealTime IDH2 assay involves testing on blood or bone marrow aspirate samples. These specimens are routinely removed as part of the practice of medicine for the diagnosis of AML and therefore present no additional safety hazard to the patient being tested.
2. Effectiveness Results
The effectiveness of Abbott RealTime IDH2 assay to identify AML patients with R140 or R172 mutations on IDH2 was evaluated in study AG221-C-001. Peripheral blood and bone marrow specimens from R/R AML patients being considered for treatment were tested. Patients with an IDH2 mutation positive result were eligible for enrollment in the drug trial if they met other eligibility criteria. Patients with a negative test result were ineligible for drug trial enrollment. Patients in cohort 2 were selected on the basis of the Abbott RealTime IDH2 assay. Patients in cohort 1 used to support conclusions regarding IDHIFA efficacy were based on the IDH2 mutation positive specimens as detected Abbott RealTime IDH2 assay.
Efficacy for IDHIFA was established on the basis of the rate of complete response (CR)/complete response with partial hematologic recovery (CRh), the duration of CR/CRh, and the rate of conversion from transfusion dependence to transfusion independence. The efficacy results are shown in Table 30 and were similar in both cohorts. The median follow-up was 6.6 months (range, 0.4 to 27.7 months). Similar CR/CRh rates were observed in patients with either R140 or R172 mutation.

PMA P170005: FDA Summary of Safety and Effectiveness Data Page 43
Table 30: Efficacy Results in Patients with Relapsed or Refractory Acute Myeloid Leukemia (AML)
Endpoint IDHIFA (100 mg daily) N=199
CRa n (%) 37 (19) 95% CI (13, 25) Median DORb (months) 8.2 95% CI (4.7, 19.4) CRhc n (%) 9 (4) 95% CI (2, 8) Median DOR (months) 9.6 95% CI (0.7, NA) CR/CRh n (%) 46 (23) 95% CI (18, 30) Median DOR (months) 8.2 95% CI (4.3, 19.4) CI: confidence interval, NA: not available a CR (complete remission) was defined as <5% of blasts in thebone marrow, no evidence of disease, and full recovery of peripheral blood counts (platelets >100,000/microliter and absolute neutrophil counts [ANC] >1,000/microliter).
b DOR (duration of response) was defined as time since first response of CR or CRh to relapse or death, whichever is earlier.
c CRh (complete remission with partial hematological recovery) was defined as <5% of blasts in the bone marrow, no evidence of disease, and partial recovery of peripheral blood counts (platelets >50,000/microliter and ANC >500/microliter).
For patients who achieved a CR/CRh, the median time to first response was 1.9 months (range, 0.5 to 7.5 months) and the median time to best response of CR/CRh was 3.7 months (range, 0.6 to 11.2 months). Of the 46 patients who achieved a best response of CR/CRh, 39 (85%) did so within 6 months of initiating IDHIFA. Among the 157 patients who were dependent on red blood cell (RBC) and/or platelet transfusions at baseline, 53 (34%) became independent of RBC and platelet transfusions during any 56-day post baseline period. Of the 42 patients who were independent of both RBC and platelet transfusions at baseline, 32 (76%) remained transfusion independent during any 56-day post baseline period. Refer to Drugs@FDA for the most recent IDHIFA product labeling.
3. Pediatric Extrapolation In this premarket application, existing clinical data was not leveraged to support approval of a pediatric patient population.
E. Financial Disclosure

PMA P170005: FDA Summary of Safety and Effectiveness Data Page 44
The Financial Disclosure by Clinical Investigators regulation (21 CFR 54) requires applicants who submit a marketing application to include certain information concerning the compensation to, and financial interests and arrangement of, any clinical investigator conducting clinical studies covered by the regulation. The pivotal clinical study included 3 clinical testing sites. None of the principal investigators at those sites had disclosable financial interests/arrangements as defined in sections 54.2(a), (b), (c), and (f). The information provided does not raise any questions about the reliability of the data.
XI. SUMMARY OF SUPPLEMENTAL CLINICAL INFORMATION
Blood specimens from 273 patients and bone marrow aspirate specimens from 264 patients were tested with the Abbott RealTime IDH2 assay (combined cohort 1 and cohort 2). Of the 273 blood specimens tested, 270 (99%) produced a valid results upon initial testing. Of the 264 bone marrow aspirate samples tested, 261 (99%) produced valid results upon initial testing. A subset of patients that were found to harbor IDH2 mutations had their blood and/or bone marrow specimen retested with a validated NGS method (See section IX.A.1). The NGS method identified the IDH2 mutation in 91/92 (99%) of the blood specimen tested and 78/78 (100%) of the bone marrow aspirate samples tested. Concordance between bone marrow specimens and peripheral blood specimens was also demonstrated have an agreement rate of 99.5% (95% CI ). Refer to Table 8 above titled Concordance between bone marrow and peripheral blood specimens. The results demonstrated and support the claim that either bone marrow specimens or peripheral blood specimens can be tested with the Abbott RealTime IDH2 assay to determine whether IDHIFA is an appropriate treatment for R/R AML IDH2 R140 and R172 mutation positive R/R AML patients.
XII. PANEL MEETING RECOMMENDATION AND FDA’S POST-PANEL ACTION
In accordance with the provisions of section 515(c)(3) of the act as amended by the Safe Medical Devices Act of 1990, this PMA was not referred to the Molecular and Clinical Genetics Panel of Medical Devices, an FDA advisory committee, for review and recommendation because the information in the PMA substantially duplicates information previously reviewed by this panel.
XIII. CONCLUSIONS DRAWN FROM PRECLINICAL AND CLINICAL STUDIES
A. Effectiveness Conclusions
The Abbott RealTime IDH2 assay supports the accurate qualitative detection of single nucleotide variants (SNVs) coding nine IDH2 mutations (R140Q, R140L, R140G, R140W, R172K, R172M, R172G, R172S, and R172W) in DNA extracted from human bone marrow (EDTA) or blood (EDTA) in patients with relapsed or refractory AML.

PMA P170005: FDA Summary of Safety and Effectiveness Data Page 45
The analytical studies support that the assay can accurately identify the specific IDH2 mutations in blood or bone marrow specimens of patients with AML. The clinical effectiveness of the Abbott RealTime IDH2 assay was demonstrated in Study AG221-C-001. AG221-C-001 was an open-label, single-arm, international, multicenter, two-cohort clinical trial of IDHIFA® (enasidenib) on 199 adult patients with relapsed or refractory AML (R/R AML) and an R140 or R172 mutation in IDH2 who were treated with 100 mg daily dose of IDHIFA. Of the 199 patient identified as having an IDH2 mutation by the Abbott RealTime IDH2 assay, 23% exhibited complete remission or complete remission with partial hematological recovery.
B. Safety Conclusions
The Abbott RealTime IDH2 assay is not expected to directly cause actual or potential adverse effects, but test results directly impact patient treatment risks. The risks of the Abbott RealTime IDH2 assay are associated with the potential mismanagement of patients resulting from false results of the test. Failure of the device to perform as expected or failure to correctly interpret test results may lead to incorrect IDH2 test results, and consequently improper patient management decisions in AML treatment. A patient with a false positive result may undergo treatment with IDHIFA with inappropriate expectation of therapeutic benefit. A patient with a false negative result may be treated without IDHIFA and not experience the potential benefit. Analytical performance in this submission demonstrates that the assay is expected to perform with high accuracy mitigating the potential for false results.
C. Benefit-Risk Determination
The probable benefits of the device are based on an analysis of efficacy and safety data obtainedfrom patients with relapsed/refractory AML in Study AG221-C-001 (ClinicalTrials.gov Identifier: NCT01915498) to establish a reasonable assurance of safety and effectiveness of the Abbott RealTime IDH2 assay. Study AG221-C-001 was an open-label, single-arm, international, multicenter, two-cohort clinical trial of IDHIFA® (enasidenib) on 199 adult patients with relapsed or refractory AML (R/R AML) and an R140 or R172 mutation in IDH2 who were treated with 100 mg daily dose of IDHIFA. Efficacy of IDHIFA was established on the basis of the rate of complete response (CR)/complete response with partial hematologic recovery (CRh) and the duration of CR/CRh. Other endpoints examined included the rate of conversion from transfusion dependence to transfusion independence. Of the 199 patients 37 (19%) achieved a complete remission (CR) and 9 (4%) achieved a complete remission with partial hematological recovery; the total CR/CRh response rate was 23% (95% CI: 18-30%) and the median duration of response was

PMA P170005: FDA Summary of Safety and Effectiveness Data Page 46
8.2 months (95% CI: 4.3-19.4 months). In addition, 53/157 (34%) who were transfusion dependent at baseline, became transfusion independent in this trial. The risks of the Abbott RealTime IDH2 assay are associated the potential mismanagement of patients resulting from false results of the test. Failure of the device to perform as expected or failure to correctly interpret test results may lead to incorrect test results, and consequently improper patient management decisions in colorectal cancer treatment. A false positive test result may lead to IDHIFA® (enasidenib) treatment in a patient who is not expected to benefit, and suffer from any potential adverse side effects associated with treatment. A false negative test result may lead to IDHIFA® (enasidenib) treatment not being administered to a patient who may benefit from this drug. The probable risks associated with false results are mitigated by the analytical performance of the device. The Abbott RealTime IDH2 assay demonstrated high agreement rates between Abbott RealTime IDH2 and the NGS methods in blood specimens. The analysis demonstrated a 100.00% (91/91) Positive Percent Agreement (PPA) with a 95% exact CI of (96.03%, 100.00%). The analysis demonstrated a 98.68% (75/76) Negative Percent Agreement (NPA) with a 95% exact CI of (92.89%, 99.97%). The analysis of agreement by specific mutation in demonstrated agreement for 166/167 patient samples. The Abbott RealTime IDH2 assay demonstrated high agreement rates between Abbott RealTime IDH2 and the NGS methods in bone marrow specimens as well. The analysis demonstrated a 100.00% (78/78) PPA with a 95% exact CI of (96.03%, 100.00%). The analysis demonstrated a 100% (72/72) NPA with a 95% exact CI of (92.89%, 99.97%). The analysis of agreement by specific mutation in demonstrated agreement for 150/150 patient samples. In conclusion, given the available information above, the data support that use of the Abbott RealTime IDH2 assay as an aid in identifying acute myeloid leukemia (AML) patients with an isocitrate dehydrogenase-2 (IDH2) mutation for treatment with enasidenib (IDHIFA), the probable benefits outweigh the probable risks. 1. Patient Perspectives
This submission did not include specific information on patient perspectives for this device.
D. Overall Conclusions
The data in this application support the reasonable assurance of safety and effectiveness of this device when used in accordance with the indications for use. Data from study AG-221-C-001 support the utility of Abbott RealTime IDH2 assay as

PMA P170005: FDA Summary of Safety and Effectiveness Data Page 47
an aid in selecting patients with relapsed or refractory AML with an R140 or R172 mutation in IDH2 for whom IDHIFA is indicated.
XIV. CDRH DECISION
CDRH issued an approval order on July 31, 2017. The applicant’s manufacturing facilities have been inspected and found to be in compliance with the device Quality System (QS) regulation (21 CFR 820).
XV. APPROVAL SPECIFICATIONS
Directions for use: See device labeling. Hazards to Health from Use of the Device: See Indications, Contraindications, Warnings, Precautions, and Adverse Events in the device labeling. Post-approval Requirements and Restrictions: See approval order.