summary of findings - united nations · outline ! process of compilation ! physical energy flow...
TRANSCRIPT
IndonesiaPEFAandAirEmissionAccount:SummaryofFindings

outline
! ProcessofCompilation
! PhysicalEnergyFlowAccount(PEFA)
! AirEmissionAccounts
! Technicalissuesfacedandresolutions

Background
PartofUNSDProject
1
Consultant
2
Missions
3
Accounts

4
Introductiontoaccounts
Discussiononframeworktemplate
Compilationandvalidation
ConsultancyonSEEAAccounts

5
• DatawaspopulatedbyBPS
• Stakeholderswereinformed
DataCollection
• Datawasorganizedintheframeworktemplate
AccountsCompilation • Internaland
externalconsistency
• Plausibility
Validation
CompilationStrategy

PEFA
! Energymix
! Energyintensity
! Energyproductivity
! SDGs
-RenewableEnergyShare
-EndUseEnergycomparedtoGVA
6
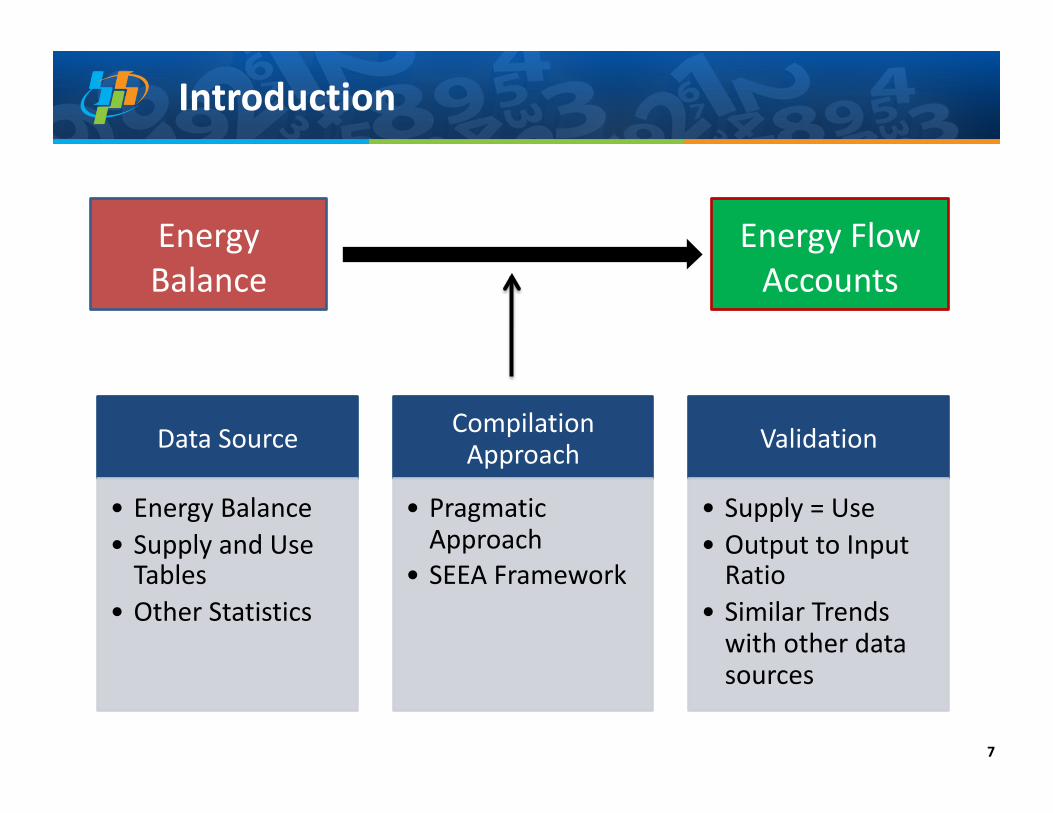
Introduction
7
EnergyBalance
EnergyFlowAccounts
DataSource
• EnergyBalance• SupplyandUseTables
• OtherStatistics
CompilationApproach
• PragmaticApproach
• SEEAFramework
Validation
• Supply=Use• OutputtoInputRatio
• SimilarTrendswithotherdatasources

EnergyMix,2011-2015
8
0%
10%
20%
30%
40%
50%
60%
70%
80%
90%
100%
2011 2012 2013 2014 2015
EnergyMixHouseholdsandIndustries,
2011-2015
Geothermalenergy
Hydropower
Biomass
Electricity
Liquifiednaturalgas(LNG)
Naturalgas
LPGandrefinerygas
Otherpetroleumproducts
Heavypetroleumproducts
Lightpetroleumproducts
Crudepetroleumandcondensate
Briquettesandcoke
Hardcoal,ligniteandpeat

Energymixbyselectedindustriesandhouseholds,2015
9
0%10%20%30%40%50%60%70%80%90%
100%
EnergyMixbyIndustriesandHouseholds,2015
Geothermalenergy
Hydropower
Biomass
Electricity
Liquifiednaturalgas(LNG)
Naturalgas
LPGandrefinerygas
Otherpetroleumproducts
Heavypetroleumproducts
Lightpetroleumproducts
Crudepetroleumandcondensate
Briquettesandcoke
Hardcoal,ligniteandpeat

EnergyUsebyIndustryandHouseholds,2011-2015
10
TotalUseofEnergy(PJ)
2011 2012 2013 2014 2015
Total industries 8873 9465 10594 9610 9171
Agriculture 23 35 45 52 31
Energy Sector 5622 5587 6550 6655 6077
Manufacturing and Construction 2410 2714 2818 1654 2118
Transportation 392 584 704 733 521
Commercial / Institutional 425 546 478 517 423
Households 1242 1301 1316 1544 1552

RenewableEnergyShareintheTotalFinalEnergyConsumption
11
Hydro
Geothermal
Biomass
TotalRenewableEnergy
1,30%
0,63%
12,79%
14,72%
2015Target7.2By2030,increasesubstantiallytheshareofrenewableenergyintheglobalenergymix
0.00
2.00
4.00
6.00
8.00
10.00
12.00
14.00
16.00
2011 2012 2013 2014 2015
RenewableEnergyShareintheTotalFinalEnergyConsumption(%)
Hydro Geothermal Biomass

EnergyIntensity
12
EnergyIntensity(GJpermillionIDR) 2011 2012 2013 2014 2015
Total industries 1.22 1.22 1.30 1.12 1.02
Agriculture 0.02 0.03 0.04 0.05 0.03
Energy Sector 5.31 5.16 5.95 6.02 5.65
Manufacturing and Construction 1.17 1.23 1.21 0.67 0.81
Transportation 1.47 2.05 2.31 2.24 1.49
Commercial / Institutional 0.15 0.18 0.15 0.16 0.12
Households 0.31 0.31 0.30 0.33 0.32
Target7.3By2030,doubletheglobalrateofimprovementinenergyefficiency

EnergyIntensityIndex
13
Target7.3By2030,doubletheglobalrateofimprovementinenergyefficiency
0
50
100
150
200
250
2011 2012 2013 2014 2015
EnergyIntensityIndexbyIndustriesandHouseholds(2011=100),2011-2015
Totalindustries
Agriculture
EnergySector
ManufacturingandConstruction
Transportation
Commercial/Institutional
Households

AirEmissionAccount
! CO2Emission
! CH4Emission
! N2OEmission
14

Introduction
15
EnergyFlowAccounts
BiennialUpdateReport
2006IPCCGuidelines
EnergyRelevantUse
Non-EnergyRelatedEmission
EmissionFactor
EnergyRelatedEmission
AirEmissionAccount

CO2Emissionemittedbyindustryandhouseholds(inGg)
16
CO2 Emission (Gg) 2011 2012 2013 2014 2015
Total industries 414 684 484 232 545 108 463 173 460 649
Agriculture 1 579 2 425 3 088 3 582 2 150
Energy Sector 184 882 208 286 273 148 268 269 267 710
Manufacturing and Construction 180 071 202 683 196 453 114 892 135 496
Transportation 27 956 41 888 49 951 52 045 37 619
Commercial / Institutional 20 196 28 950 22 467 24 386 17 674
Households 73 192 76 784 77 830 94 160 95 222
0%
20%
40%
60%
80%
100%
2011 2012 2013 2014 2015
CO2EmissionbyIndustriesandHouseholds
Agriculture EnergySector ManufacturingandConstruction Transportation Commercial/Institutional Households

CO2EmissionIntensity(MgperbillionIDRGDP)
17
Target9.4By2030,dupgradeinfrastructureandretrofitindustriestomakethemsustainable,withincreasedresource-useefficiencyandgreateradoptionofcleanandenvironmentallysoundtechnologiesandindustrialprocesses,withallcountriestakingactioninaccordancewiththeirrespectivecapabilities
0
50
100
150
200
250
300
2011 2012 2013 2014 2015
CO2EmissionIntensity(inMgperbillionIDRGDP)
Households EnergySector
Transportation Otherindustries
0
50
100
150
200
2011 2012 2013 2014 2015
CO2EmissionIntensityIndex(2011=100)
Households EnergySector
Transportation Otherindustries
0
50
100
150
200
250
300
2011 2012 2013 2014 2015
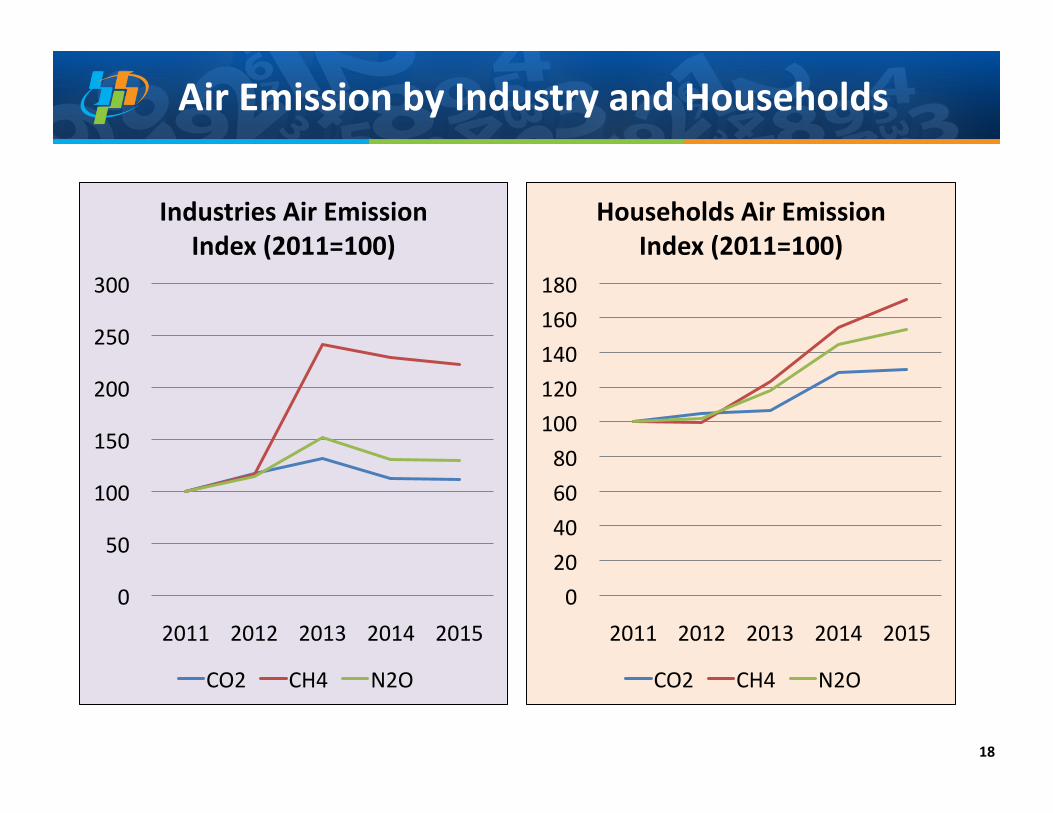
IndustriesAirEmissionIndex(2011=100)
CO2 CH4 N2O
AirEmissionbyIndustryandHouseholds
18
0
20
40
60
80
100
120
140
160
180
2011 2012 2013 2014 2015
HouseholdsAirEmissionIndex(2011=100)
CO2 CH4 N2O

Technicalissuesfaced
andresolutions
19

Challengesfaced
20
CHALLENGES1. Having2differentEnergyBalance2. BreakdownbyindustriesfromSUT20103. Breakdownofroadtransportuseofenergytoallother
industriesandhouseholds4. Coordinationandcommunicationtootherstakeholders
makingthemengagemoreintheprocessofwork5. Builddemandbasedontheworkthatrelevanttopolicy
application6. Sendamessagetoimprovefutureworkbasedonthe
findings

THANKYOU