summary of atomic models - wikispacesws+complete... · 4. in the following chart: a) calculate the...
TRANSCRIPT

PROBABILITY OBJECTIVE: The purpose of this activity is to illustrate how probability and charge density are related to distance from the nucleus for the 1s orbital of a hydrogen atom. An analogy of throwing stones at a target will be used. The target is marked off in circles with radii increasing in 5 cm increments. PROCEDURE: 1. Place the target on the desk. Stand back just beyond reach of the table edges and toss 100 stones at the
target one at a time, always aiming for the centre. 2. Count the number of stones in each ring. Any stones which land on a line should be counted as landing in
the inner ring. RESULTS:
Ring Radius (cm)
Number of Hits (Your Data) Number of Hits (Class Data)
0 - 5 5 - 10 10 - 15 15 - 20 20 - 25 25 - 30 30 - 35
missed target total throws
DATA ANALYSIS: 1. Plot the number of hits vs. the ring radius as a bar graph. Use the totals for the class.
Graph 1 # o f H i t s
0 - 5 5 – 10 10 – 15 Radius
15 - 20 (cm)
20 - 25 25 - 30 30 - 35
2. What is the most probable distance from the center for the next stone to land? 3. Predict the probability of a hit in a ring 35 - 40 cm from the center. This can be done by extrapolation of
the graph. The probability is the estimated number of hits divided by the total number of throws.
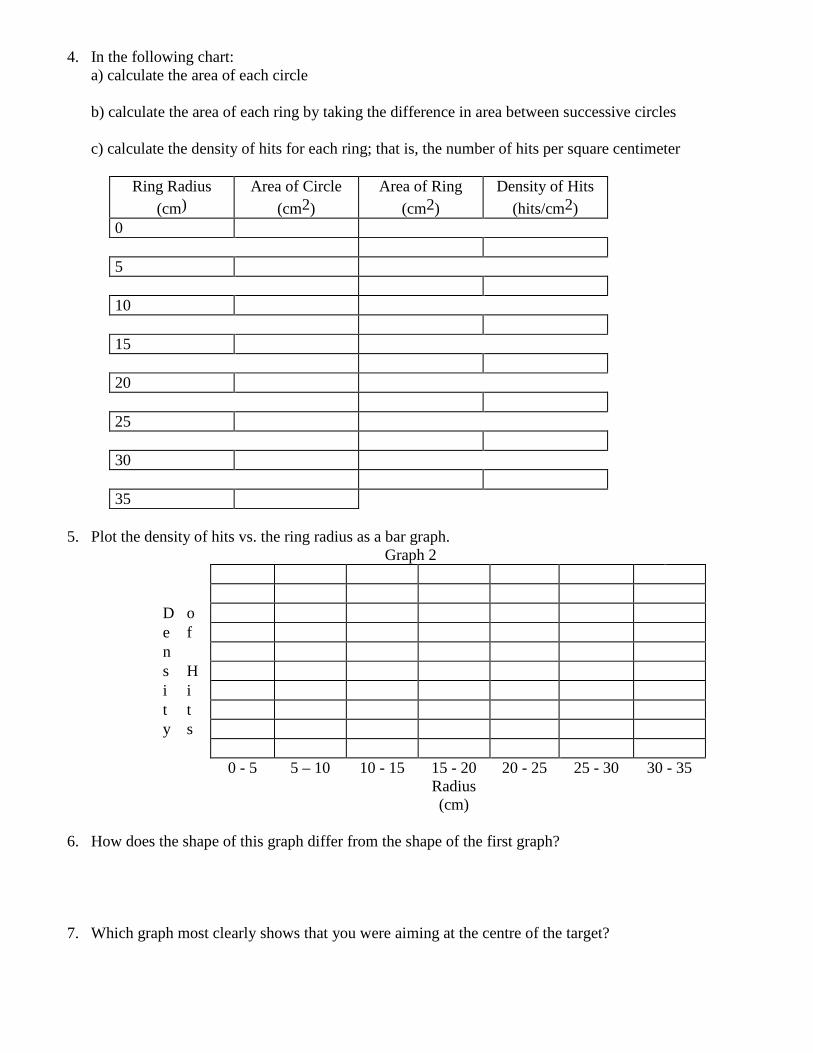
4. In the following chart: a) calculate the area of each circle
b) calculate the area of each ring by taking the difference in area between successive circles
c) calculate the density of hits for each ring; that is, the number of hits per square centimeter
Ring Radius
(cm) Area of Circle
(cm2) Area of Ring
(cm2) Density of Hits
(hits/cm2) 0 5 10 15 20 25 30 35
5. Plot the density of hits vs. the ring radius as a bar graph.
Graph 2 D o e f n s H i i t t y s
0 - 5 5 – 10 10 - 15 15 - 20 Radius (cm)
20 - 25 25 - 30 30 - 35
6. How does the shape of this graph differ from the shape of the first graph? 7. Which graph most clearly shows that you were aiming at the centre of the target?

8. The shape of which graph combines the effect of aiming for the centre with the fact that the area decreases as the ring radius decreases?
9. The following graph shows the probability of finding the electron at a distance r from the nucleus for the
1s orbital of hydrogen. Draw a vertical line showing the electron’s most probable distance from the nucleus.
10. There are two factors affecting the shape of this curve. These factors are analogous, but not identical to
those affecting the shape of the bar graph in the stone throwing experiment. (a) What factors in the atom would result in the electron tending to be close to the nucleus?
(b) In spite of the previous factor, probability decreases as the distance from the nucleus decreases below that of the peak on the graph. Why is this so?
11. Imagine that the electron location possibilities represented as an analogy to the stone throwing activity.
Sketch a graph of location density (#hits per unit volume) vs. distance r for the 1s orbital of a hydrogen atom using the graphs from the stone throwing activity as a guide.

PERIODIC PROPERTIES OF THE ATOM/ELECTRON
FACTORS TO CONSIDER 1. Coulomb’s Law:
F = kq1q2
r2 where k is a constant, q is electrical charge (+ proton, - electron), r is
inter-particle distance (proton in nucleus to electron, electron to electron) and F is electrical force of attraction (opposite charges) or repulsion (same charge).
2. Nuclear charge, i.e. Z (Atomic Number, # of protons). As Z↑ then q↑ and F↑.
3. Principal quantum number, i.e. principle energy level, “n”. The greater the principle energy level of the
electron, the greater the radius. As n↑, r↑and F↓↓ because r2.
4. Shielding, i.e. the greater the number of inner principle energy level electrons (core electrons), the greater the outward repulsions on the valence electrons and the weaker the net force of attraction from the nucleus.
5. Sublevel or orbital type, eg. “s” orbitals have the lowest potential energy (lower “r”) and the “p” have a
higher potential energy (higher “r”) in the same principal energy level, same “n”.
6. Charge distribution. Symmetrical distributions of electrons in the same orbital type: empty (least), 1/2 filled or fully filled (most) are more energetically favorable (more stable) than non-spherically symmetrical distributions.
Note: adding an electron from an atom/ion will always increase the e- - e- repulsions.
Adding an e- into an occupied orbital increases the e- - e- repulsions much more than from a single occupied orbital.
Explain the data in each of the following tables using all or some of the above factors.
GROUP I SUCCESSIVE IONIZATION ENERGIES
ELEMENT LEVEL IE (kJ/mol) Z n, r shielding orbital
shielding symmetry Therefore, ∴
Li (relative to H)
2 520
Na 3 491
K 4 414
Rb 5 404
Cs 6 376
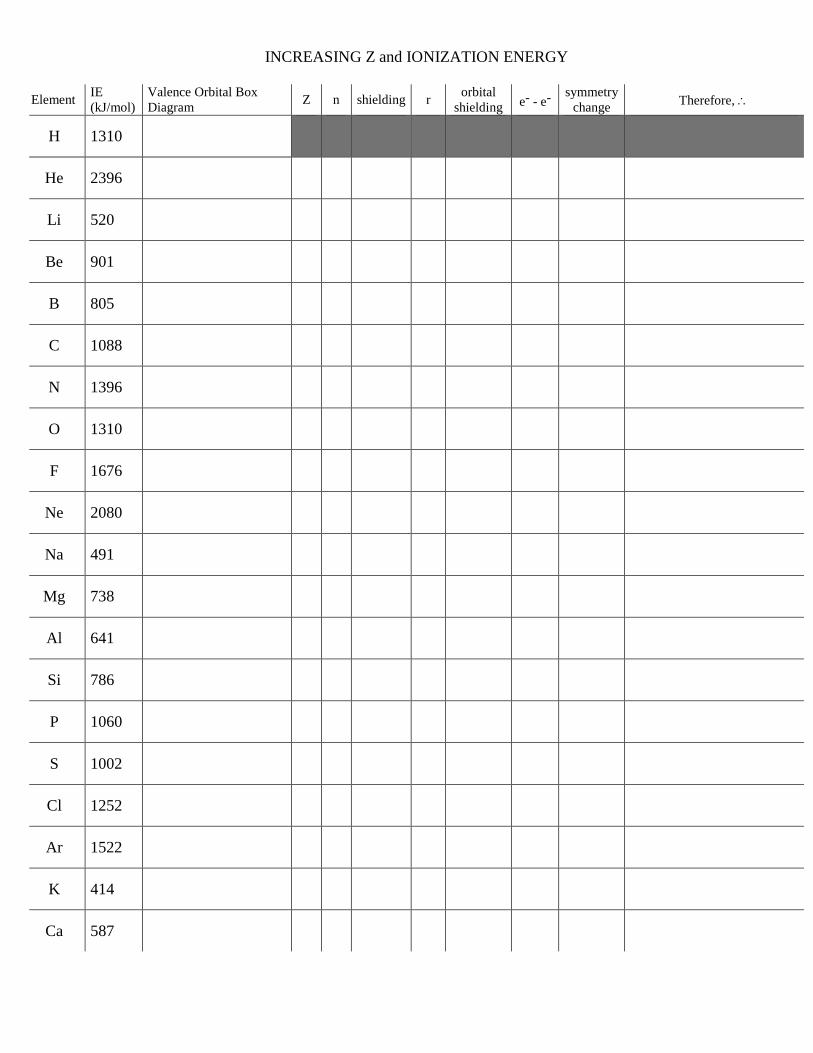
INCREASING Z and IONIZATION ENERGY
Element IE (kJ/mol)
Valence Orbital Box Diagram Z n shielding r orbital
shielding e- - e- symmetry
change Therefore, ∴
H 1310
He 2396
Li 520
Be 901
B 805
C 1088
N 1396
O 1310
F 1676
Ne 2080
Na 491
Mg 738
Al 641
Si 786
P 1060
S 1002
Cl 1252
Ar 1522
K 414
Ca 587
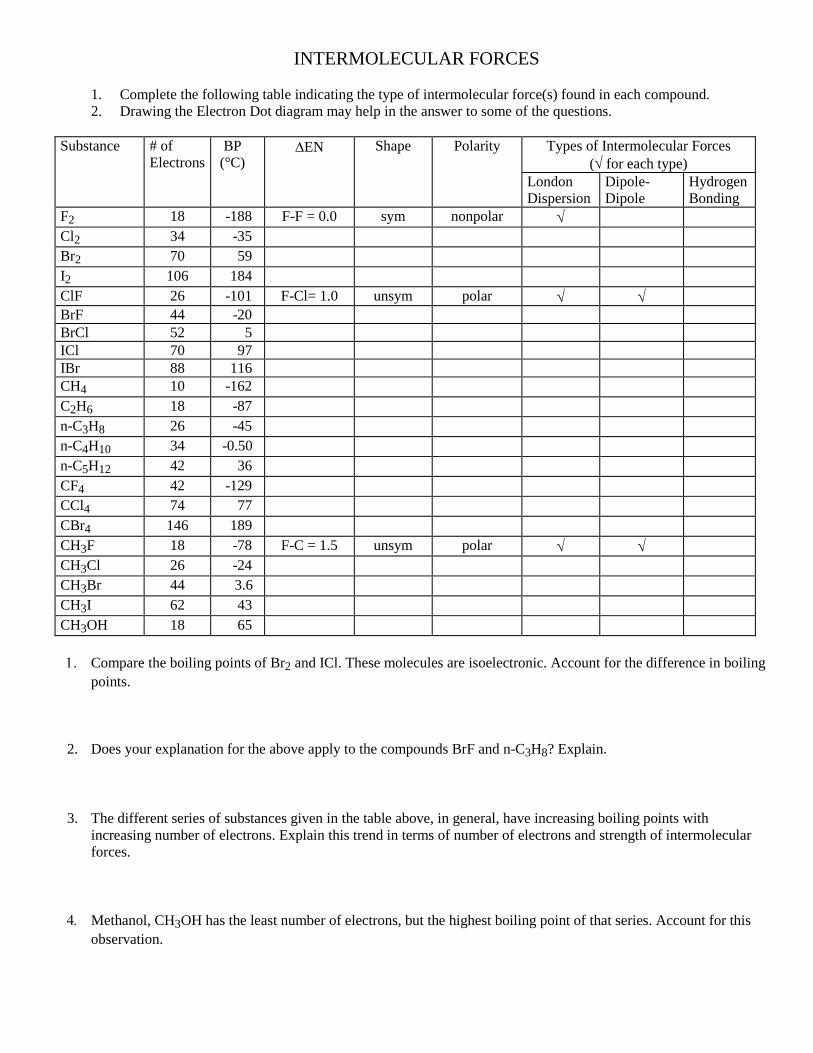
INTERMOLECULAR FORCES
1. Complete the following table indicating the type of intermolecular force(s) found in each compound. 2. Drawing the Electron Dot diagram may help in the answer to some of the questions.
Substance # of Electrons
BP (°C)
∆EN Shape Polarity Types of Intermolecular Forces (√ for each type)
London Dispersion
Dipole-Dipole
Hydrogen Bonding
F2 18 -188 F-F = 0.0 sym nonpolar √ Cl2 34 -35 Br2 70 59 I2 106 184 ClF 26 -101 F-Cl= 1.0 unsym polar √ √ BrF 44 -20 BrCl 52 5 ICl 70 97 IBr 88 116 CH4 10 -162 C2H6 18 -87 n-C3H8 26 -45 n-C4H10 34 -0.50 n-C5H12 42 36 CF4 42 -129 CCl4 74 77 CBr4 146 189 CH3F 18 -78 F-C = 1.5 unsym polar √ √ CH3Cl 26 -24 CH3Br 44 3.6 CH3I 62 43 CH3OH 18 65 1. Compare the boiling points of Br2 and ICl. These molecules are isoelectronic. Account for the difference in boiling
points. 2. Does your explanation for the above apply to the compounds BrF and n-C3H8? Explain. 3. The different series of substances given in the table above, in general, have increasing boiling points with
increasing number of electrons. Explain this trend in terms of number of electrons and strength of intermolecular forces.
4. Methanol, CH3OH has the least number of electrons, but the highest boiling point of that series. Account for this
observation.

MOLECULAR SHAPES & THEIR REPRESENTATIONS
1. For this activity, you will complete the charts giving the Lewis dot diagram, the VSEPR formula and
Name, hybridization type, the perspective 3D diagram and hydridization development for several molecules.
2. The following guidelines will apply:
Lewis dot diagram: must include all bonds and non-bonding electron pairs. VSEPR formula and Name:
a) 1 of the 5 basic shapes → use basic formula and name
b) modifications of the basic shapes → use basic formula and name and also specific formula and name
c) 2 central atoms use a) and b) above for each central atom.
Hybridization type: state for each central atom Perspective 3D diagram: use the following conventions
→ a bond in the plane of the paper is shown as a solid line → a bond projecting out of the plane towards the viewer is drawn as a wedge → a bond projecting out of the plane away from the viewer is drawn as a dashed line
Hydridization development: for each unique central atom show the orbital box diagrams for the ground state, valence state (if needed) and the hybridized state.
3. For example, using methane, CH4:
- Draw the Lewis Dot diagram. - Using the MolyMod Molecular kits construct a model of methane, CH4. For single bonds use
the rigid bond sticks. - Create a perspective drawing using the conventions listed above. - Include the angle for at least 1 of each different angle in the structure.
ie. 109.5°, 120°, 180° or 90°. - For each central atom, state the basic VSEPR name and formula for that atom.
ie. Linear–AX2, trigonal planar–AX3, tetrahedral–AX4, trigonal bipyramidal–AX5 or octahedral-AX6.
- If the central atom symmetry is not a basic VSEPR shape, state also the specific name and formula. ie. Angular–AX2E2.
- state the hydrization type for each central atom and its development as instructed above 4. In methane there is only one carbon, The central atom, which is bonded to several other atoms. In more
complex molecules there may be several central atoms. The correct bond angles must be represented around each atom of the model. A perspective drawing will be simpler if as many atoms as possible are arranged in the plane of the paper.
5. It is easy to forget the unbonded pairs of electrons surrounding some atoms in a molecule. In order to
predict the shapes of molecules correctly these electrons must also be taken into account. Since unbonded pairs of electrons crowd closer to the central atom, they repel other pairs more strongly, causing the bond angles to be somewhat smaller than the usual 109.5°. This should be noted in your perspective drawings.
6. For some compounds, the octet rule does not apply. 7. The shape of molecules with multiple bonds is correctly predicted by using the flexible bond sticks.

Molecular Models and The Shapes of Molecules Type of Molecule
Lewis Structure (Electron Dot Diagram)
VSEPR formula, Name
& Hybridization
3-D Structural Formula Hybridization Development
CH4
C
H
H
H
H
∠ =109.5°
AX4 Tetrahedral ∴ sp3
H
C
HH
H
C [He] ↑↓ ↑ ↑ ground 2s2 2p2 C [He] ↑ ↑ ↑ ↑ valence 2s1 2p3
C [He] ↑ ↑ ↑ ↑ hybrid sp3
C2H6
PCl3
SCl2

CH3OH
H2O2
HONH2
H3COCH3

H3CCOOH
PH5
SF4

IF3
XeF2
SF6
IF5

XeF6
[I3 –]
C2H4
C2H2

N2O
HCN
N2H2
C4H6 1,3 -butadiene

IONIC CRYSTALS
BACKGROUND: When ionic solids condense they obtain the most stable lattice by arranging in such a way that each type of ion is surrounded by ions of the opposite charge. The number of oppositely charged neighbors is the coordination number. The coordination number for salts of the type MX is determined by the relative sizes of the positive M ion and the negative X ion. As the radius ratio r-1/r+1 increases, fewer of the large negative ions will be able to fit around the smaller positive ions. The range of radius ratios is;
1.0 to 1.37 for a coordination number of eight – based on body centered packing 1.37 to 2.44 for a coordination number of six – using octahedral holes 2.44 to 4.55 for a coordination number of four – using tetrahedral holes
Reminder, the Electrostatic force is what keeps the ionic compound together and determines is strength and
melting/boiling points.
F = kq1q2
r2
1. Why are ionic solids brittle rather than malleable? 2. Refer to the reference handout booklet for radii of the respective ions. Calculate the radius ratio and
predict the coordination number for the following salts; Radius Ratio: NaCl CsCl ZnS KBr MgO CaS Coord. #:
3. Name a salt with the formula type M+X- which has the same lattice type as NaCl but melts at a lower
temperature. Explain your choice. 4. Name a compound with the formula type M2+X2- which has the same lattice type as NaCl. Will its
melting point be higher or lower than that of NaCl? Explain.

Metallic Solids More than 80 elements in the periodic table are metals. Metals are solids at ordinary temperature and pressure, with the exception of mercury and gallium. Metals have characteristic properties such as:
• High thermal and electrical conductivity. • Luster and high reflectivity. • Malleability and ductility. They can be beaten or shaped without fracture. • Variability of mechanical strengths (ranging from soft alkali metals to Tungsten,
which is hard). Electron sea model for metallic bonding To account for the bonding in metals, a model known as the electron sea model was proposed. This model is based on the following characteristic properties of metals: Low ionization energies Metals generally have low ionization energies. This implies that the valence electrons of metal atoms are not strongly held by the nucleus. Valence electrons can move freely out of the influence of their kernels (atomic orbit/structure minus valence electrons). Thus, metals have free mobile electrons. Large number of empty orbitals In metals a number of valence orbitals remain empty as the number of valence electrons in metals is less than the number of valence orbitals. For example, Ca [Ar] 4s2 4p0 4d0 4f0 has the p, d and f orbitals vacant. Similarly for all
the transition metals Sn [Kr] 5s2 5p2 5d0 5f0 has the most of the p, all of d and f orbitals vacant
The important features of electron sea model are:
• The positively charged kernels of metal atoms are arranged in a regular fashion in a metallic lattice.
• Loosely held valence electrons, surround each kernel in metallic lattice. Being loosely held to its kernel, the valence electrons enjoy complete freedom in the metallic lattice and are regarded as mobile electrons.
This model is used to explain the physical properties of metals. Metallic lustre The bright lustre of metals is due to presence of delocalized mobile electrons. When light falls on the surface of the metal, the loosely held electrons absorb photons of light. They get promoted to higher energy levels (excited state), equal to that of the incident light. These electrons readily return to the lower levels of energy by releasing energy, thus becoming a source of light radiations. Light appears to be reflected from metal surface and the surface acquires a shining appearance, which is known as metallic lustre.
Electrical conductivity The presence of mobile electrons causes electrical conductivity of a metal. When a potential difference (voltage) is applied across the metal sheet, the free mobile electrons in the metallic crystal start moving towards the positive electrode. The electrons coming from the negative electrode simultaneously replace these electrons. Thus, the metallic sheet maintains the flow of electrons from negative electrode to positive electrode. This constitutes electrical conductivity. Thermal conductivity When a part of the metal is heated, the kinetic energy of the electrons in that region increases. Since the electrons are free and mobile, these energetic electrons move rapidly to the cooler parts and transfer their kinetic energy by means of collisions with other electrons. Therefore, the heat travels from hotter to cooler parts of the metals. Malleability and ductility Metals can be beaten into sheets (malleability) and drawn into wires (ductility). Metallic bonds are non-directional in nature. Whenever any stress is applied on metals, the position of adjacent layers of metallic kernels is altered without destroying the crystal. The metallic lattice gets deformed but the environment of kernels does not change and remains the same as before. The deforming forces simply move the kernels from one lattice site to another. High tensile strength Metals have high tensile strength. Metals can resist stretching without breaking. A strong electrostatic attraction between the positively charged kernels and the mobile electrons surrounding them is the reason for tensile strength. Hardness of metals The hardness of metals is due to the strength of the metallic bond. In general, the strength of a metallic bond depends upon:
• The greater the number of valence electrons for delocalization the stronger is the metallic bond.
• Smaller the size of the kernel of metal atom, greater is the attraction for the delocalized electrons. Consequently, stronger is the metallic bond.
For example, alkali metals have only one valence electron and larger atomic kernels, which makes the metallic bonds weak. Consequently these metals are soft metals.

SCH4U1 - Metallic Bonding Assignment – Due at the end of the Period! 1. Read the Article on Metallic Bonding 2. How is metallic bonding different from ionic bonding? 3. What does the phrase “Sea of Electrons” mean? 4. Why is the low ionization energy of metals important for their bonding? 5. Explain, using your understanding of metallic bonding, why metals are shiny: 6. Why are metals malleable? Explain in terms of the sea of electrons. 7. What is tensile strength? Why do metals have such high tensile strength? 8. Why are Alkali Metals relatively soft? Explain in terms valence electrons and metallic
bonding.
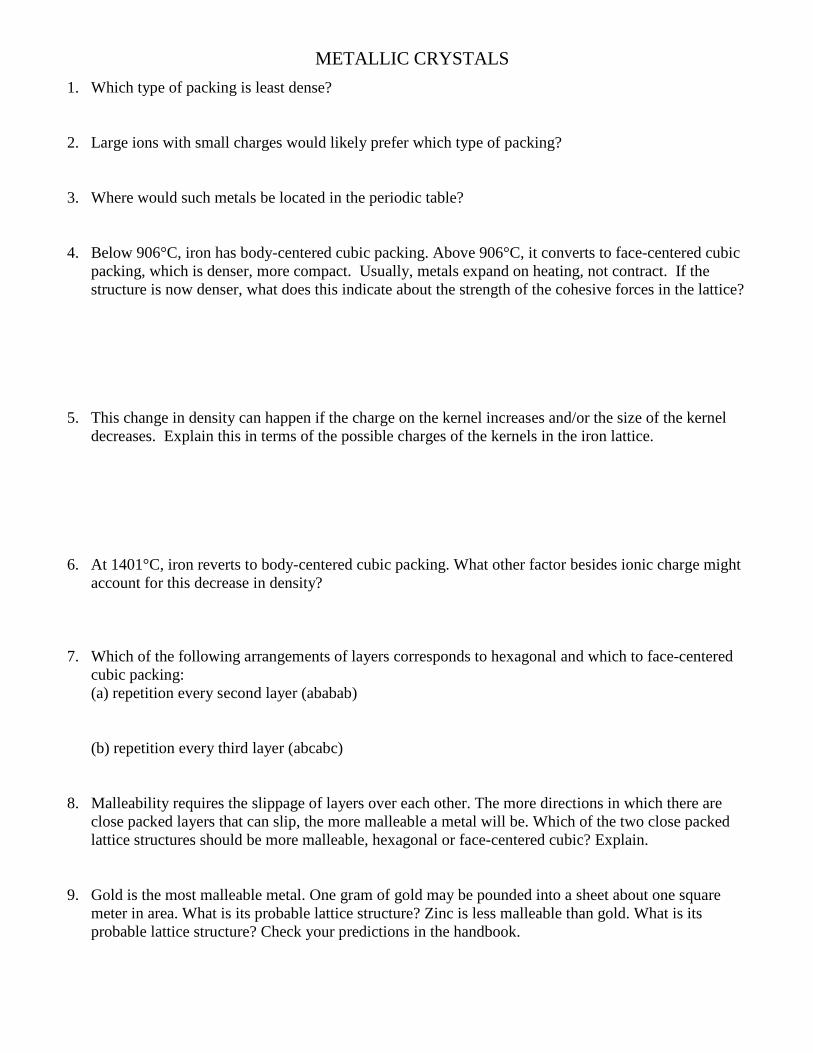
METALLIC CRYSTALS
1. Which type of packing is least dense?
2. Large ions with small charges would likely prefer which type of packing?
3. Where would such metals be located in the periodic table?
4. Below 906°C, iron has body-centered cubic packing. Above 906°C, it converts to face-centered cubic packing, which is denser, more compact. Usually, metals expand on heating, not contract. If the structure is now denser, what does this indicate about the strength of the cohesive forces in the lattice?
5. This change in density can happen if the charge on the kernel increases and/or the size of the kernel decreases. Explain this in terms of the possible charges of the kernels in the iron lattice.
6. At 1401°C, iron reverts to body-centered cubic packing. What other factor besides ionic charge might account for this decrease in density?
7. Which of the following arrangements of layers corresponds to hexagonal and which to face-centered cubic packing: (a) repetition every second layer (ababab) (b) repetition every third layer (abcabc)
8. Malleability requires the slippage of layers over each other. The more directions in which there are close packed layers that can slip, the more malleable a metal will be. Which of the two close packed lattice structures should be more malleable, hexagonal or face-centered cubic? Explain.
9. Gold is the most malleable metal. One gram of gold may be pounded into a sheet about one square meter in area. What is its probable lattice structure? Zinc is less malleable than gold. What is its probable lattice structure? Check your predictions in the handbook.
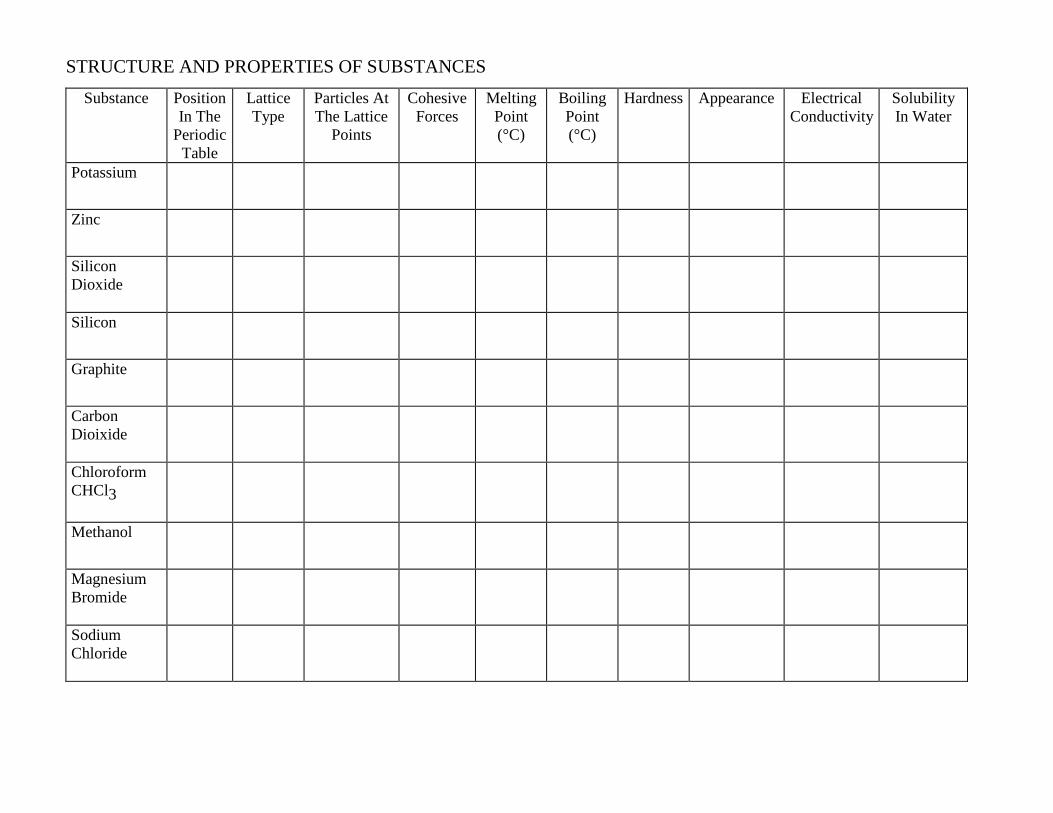
STRUCTURE AND PROPERTIES OF SUBSTANCES
Substance Position In The
Periodic Table
Lattice Type
Particles At The Lattice
Points
Cohesive Forces
Melting Point (°C)
Boiling Point (°C)
Hardness Appearance Electrical Conductivity
Solubility In Water
Potassium
Zinc
Silicon Dioxide
Silicon
Graphite
Carbon Dioixide
Chloroform CHCl3
Methanol
Magnesium Bromide
Sodium Chloride

SCH4U1 Unit #1 Review: What are the possible quantum numbers of an electron in the 5p sublevel of an atom? The radius of the Ca atom is 0.197 nanometers; the radius of the Ca2+ ion is 0.099 nanometers. Account for this difference using electron configuration diagrams. Explain why Nitrogen has a higher ionization energy than Oxygen. Use electron configuration diagrams in your explanation. Explain why Tin has two possible charges of +2 and +4. Use electron configurations in your explanations. Give Lewis dot diagrams and VSEPR 3-D diagrams of SF3-, SF4, SF5-. Show how hybridization will occur and give the VSEPR formula and shape. Label the angles on the 3-D diagram.

Describe with diagrams how BCC is different from FCC and hexagonal packing. Refer to coordination numbers in your explanation. Explain fully why chlorine is a gas while lithium chloride is a solid with attention to the structure and bonding of the materials. Explain why diamond is one of the hardest substances on earth, but graphite is relatively soft, yet both of them are made of exclusively of Carbon.