sugar snack consumption in ugandan schoolchildren ... · cakes/biscuits, chocolate, ice sticks,...
TRANSCRIPT

1
Sugar snack consumption in Ugandan schoolchildren: validity
and reliability of a food frequency questionnaire
S N Kiwanuka1,3, A N Åstrøm 1,2, T A Trovik, 1,2
Running title: Validity and reliability of a food frequency questionnaire
1 Centre for International Health, University of Bergen, Norway,
2 Department of Oral Sciences-Community Dentistry, University of Bergen, Norway
3 Department of Dentistry, Makerere University, Uganda
Corresponding author:
Anne Nordrehaug Åstrøm, Centre for International Health, Armauer Hansen House
N-5021 Bergen, Norway. Phone: 47-55974984, Fax: 47-55974979
e-mail: [email protected]

2
Kiwanuka SN, Åstrøm AN. Trovik TA. Sugar consumption in Ugandan school
children: validity and reliability of a food frequency questionnaire. Community Dent
Oral Epidemiol
Objectives: This study assessed the reproducibility and relative validity of an 8-item
self-administered food frequency questionnaire (FFQ) on intake of sugared snacks in
Ugandan school children. A 5 day pre-coded food behaviour check-list (FBC) was
used as validation criteria. Socio-demographic correlates of a sum frequency sugar
score were explored. Methods: The study was conducted in Kampala, Uganda in
2004. Six hundred and fourteen school children (mean age 12.4 yr) completed FFQ on
cakes/biscuits, chocolate, ice sticks, soft drinks, coffee, tea, sugared deserts and
sweets/candies at school. They were examined clinically for dental caries. Forty
students completed the FFQ twice, one week apart and 325 students completed the 5
day FBC at school. Results: The mean DMFT score was 0.98 (SD 1.6, range 0-15).
Reproducibility scores (Cohen’s kappa) for the sugar items ranged from 0.17 (ice-
sticks) to 0.55 (biscuits). No differences were seen between the average intakes at test
and retest. Higher intake was reported in FFQ than in FBC across all sugar items.
Crude agreement between students reporting intake at least 3-5 times a week / less
than 3 times a week ranged from 50-55% (e.g. biscuits, chocolate) to 87% (tea).
Spearman’s correlation coefficients ranged from 0.14 (dessert) to 0.27 (sweets).
ANOVA revealed significant increase (P=0.001) in the mean FBC sum scores by
increasing quartiles of the FFQ sum scores. The average sum FFQ sugar scores were
higher in girls than in boys and higher in older than younger students. Key words:
sugared snacks, Uganda, school children, reliability, validity

3
Introduction
Lifestyle related diseases, such as cancers and cardio-vascular disease, increase all
over the world, particularly in the developing countries (1, 2). In the case of dental
caries there is consensus about the relationship between frequency of intake of non-
milk extrinsic sugars and incidence of tooth-decay (3, 4). The Nordic countries have
recommended limiting added sugars to a maximum of 10% of children’s total energy
intake (5). Many developing countries, including Uganda, have experienced increases
in the per capita sugar consumption (6,7). Evidence suggests that commercialised
sugar products have become easily available and are highly preferred and frequently
consumed, particularly among the higher socio-economic status groups and urban
residents (6). Eating habits occurring during childhood tend to persist into adulthood
(8,9). Policy to promote restricted sugar consumption needs information about the
patterns of intake of sugared snacks at an early age and its significant influencing
factors.
Assessment of dietary habits is recognised to be a challenging measurement issue
(10). The study of dietary assessment in adults poses methodological problems
relating particularly to the accuracy of assessment (10,11). Dietary studies in children
have additional problems because children’s cognitive ability to record and remember
intake as well as their limited knowledge of food and food preparation must be
addressed (11). Self-reported food frequency questionnaire, FFQ, 24-hour recalls,
food diaries and direct observations have commonly been used to assess eating
behaviours in both children and adults (12). The FFQ is appreciated for its ease of
administration and relatively low cost. It correlates moderately well with information
obtained by 24-hour recalls, diaries and direct observations, whereas recalls and
4
records show stronger agreement with other validation standards (12, 13). The
validity of the FFQ methods has been investigated in a number of studies in adults.
This method has been assumed to be suitable for collecting data in epidemiological
studies from the age of 10 years and up-wards when the cognitive process of children
become more similar to those of adults (10, 14-16). However, validation studies of
questionnaires used in children and adolescents are limited. Few reproducibility and
validation studies have been published that evaluate assessment methods for gathering
self-reported food group intake among children without involving parents (12,13,15).
No such study has evaluated self-reported intake of sugared snacks and drinks of
primary school children in sub-Saharan Africa.
This study assessed sugar related eating habits among Ugandan primary school
children using an eight-item FFQ. Its principle purpose was to rank the consumption
of individuals into broad categories of intake rather than quantifying the individual
consumption (17). The FFQ contained selected sugar items known to be commonly
preferred and consumed among children and adolescents in East African countries
(18-20). A study of its psychometric properties was deemed necessary and
advantageous before further use. Thus, this study aimed to assess the reproducibility
and relative validity of the eight-item FFQ on intake of sugared snacks and drinks
among 10-14-year-old pupils attending primary schools in Kampala, Uganda. In the
absence of an absolute gold standard for dietary assessment in free-living populations
(10), a 5-day pre-coded food behaviour check-list, FBC, believed to provide greater
accuracy than the questionnaire, was used as validation criterion. The socio-
demographic and clinical dental status correlates of children’s sugar intake were also
examined.

5
Material and methods
Study population and sampling method
A cross-sectional study was conducted among children attending primary schools in
Kampala (0.3mg fluoride/L), the capital city of Uganda, which covers an area of 197
km2 and has a population of 1.2 million people (49% male, 18% below the age of 5
yr). The study was conducted during January-March 2004 using a FFQ, a clinical
examination and a 5-day FBC to collect data. A list of all government primary schools
(n=13) within the Kampala central division (area 14.7 km2) was obtained from the
Division Headquarters. Two primary schools with less than 30 children were excluded
due to limited size leaving 11 schools to constitute the sampling frame of 2589
standard seven pupils. A sample size of 650 children was calculated based on an
assumed prevalence of dental caries (DMFT>0) of 50%, a standard error of 5% and a
design effect of 2 (21). Lists of all students in grade 7 were obtained from the school
authorities and every third student in each school was randomly selected to
participate. This strategy provided a sample that was self-weighting, implying that
each participating student had the same probability of being selected into the study.
Allowing for refusal to give informed consent and exclusions of a few pupils in the
age range 15-18 yr, 826 parents was contacted and 701 signed letters were returned.
The help of teachers was elicited in reminding the children to return the signed forms
and to set an appropriate date for the data collection. Twenty pupils who completed
the questionnaire survey refused to be examined clinically and were thus excluded
from the study. The final participation rate for the main questionnaire survey and
clinical examination was 74% (n= 614, mean age 12.4, SD=0.8) (Table 1).

6
A test-retest of the whole FFQ was undertaken among 40 participants after one week
to assess the extent to which the measurements are consistent across administrations
(22). Participants were not told that they would complete identical questionnaires
twice. For assessing relative validity of the FFQ, a follow-up study was conducted
four weeks after completion of the main FFQ and clinical examination. A sub-group
of participants from the FFQ survey consisting of 394 pupils attending 4 conveniently
selected schools volunteered to keep FBC for 5 consecutive school days. A total of
325 completed (participation rate 82.5%) the records for the whole period (Table 1).
Ethical considerations
Ethical clearance was obtained from the ethical research committees in Norway and
Uganda. Written permission to conduct the study was obtained from the Ministries of
Health and Education in Uganda, local administration authorities and the school
authorities. Written informed consent was obtained from the parent on behalf of their
children.
FFQ questionnaire survey
The structured questionnaire comprised various socio-demographic and oral health
related variables and sugar frequency questions. The questionnaire was constructed
and administered in English, which is the language of instruction in all formal
academic institutions in Uganda. Health professionals reviewed the survey instrument
for semantic, experiential and conceptual equivalence. Sensitivity to culture and
selection of appropriate words were considered. The FFQ was pilot tested and
adjusted accordingly before being used in the field. It was administered by the main
researcher (SK) and four trained assistants in schools as part of the classroom activity

7
to provide a standard administration with the adult assistance available. Questions
were read out loud one at a time while the participants filled in the responses on their
own.
Measurements
Socio-demographic characteristics
Age of the child was recorded as age at last birthday and categorised as (0) 10-12 yrs
and (2) 13-14 yrs. Gender was coded as 0= male, 1= female. Father’s and mother’s
highest level of education was assessed on scales ranging from (1) primary education
to (4) university/ higher learning institutions. Two dummy variables were constructed
yielding the categories (0) lower education (primary and secondary education) and (1)
higher education (college or university or higher learning institutions). Household
durable assets (e.g. bicycle, television, car, motor cycle) were assessed as (1)
available/in working condition, (2) not available/nor in working condition. Aspects of
the dwelling were assessed including number of rooms and main source of fuel. A
household wealth index (asset) was constructed from 7 variables using Principle
Component Analysis, PCA with factor scores ranked into quintiles from (1) poorest to
(5) least poor (23).
Food frequency questionnaire (FFQ)
Sugar frequency intake was assessed using 8 items (biscuits, chocolate, ice sticks, soft
drinks, tea with sugar, sugared coffee, sweetened deserts and sweets/candy), (4)
several times a day, (3) once a day, (2) 3-5 days a week, (1) less than 3 days a week.
Participants were asked to have their usual intake in mind when completing the
questionnaire. No particular time frame was provided. A FFQ sum additive score

8
(FFQ ADD) was constructed from the 8 items as initially scored [range from 8 (low)
to 32 (high)]. For cross tabulation analyses, each item was dichotomised into (1) at
least 3 days a week and (0) less than 3 days a week.
Clinical examination
The clinical examination (n=614) was carried out by one dentist (SNK) whereas a
trained assistant recorded the observations. Caries was assessed using the decayed,
missing and filled tooth index (DMFT) as described by the World Health
Organisation (24). Lesions were recorded as present when a carious cavity was
apparent on visual inspection under field conditions (DMFT=0 and DMFT>0).
Calibration exercise was carried out at the Institute for Paediatric Dentistry, Faculty of
Dentistry, University of Bergen, Norway.
Follow-up study: 5 days food behaviour check list (FBC)
A 5-school day FBC was chosen as the reference method since three to seven days are
normally adequate to assess food group intake (16, 25). Only students who completed
records for the whole period were included in the analyses. On each day the FBC was
completed anonymously in the class setting in the presence of the teacher and a
research assistant responding to questions from students to help in completing the
checklists. The FBC was constructed to assess adequate documentation of the 8 sugar
items from the FFQ. The students were asked whether or not they had taken biscuits,
chocolate, ice sticks, soda, tea, coffee, sugared deserts and candy the previous day.
Answers were given as (1) yes and (0) no. All students were also asked about intake
frequency (i.e. number of times an item was taken yesterday ranging from zero and up
wards). The FBC is a simplification of the 24 hour recall. By focusing a recent and

9
defined time period (yesterday), the memory task is simplified by prompting specific
sugared foods and drinks. An average score for the 5 days (range 0,0-1,00) was
computed for each participant with respect to whether or not they had taken a sugar
item yesterday. To enable comparison with FFQ sugar scores, each average FBC
score was expressed as a proportion of the weekly use of that sugar item. Students in
the score range 0.0-0.2 were weighted as ”less than 3 days a week” (coded 0),
whereas those having values ≥ 0.40 were weighted as “ at least 3 days a week” (coded
1). A simple count FFQ sugar score (FFQ SC) and a simple count FBC sugar score
(FBC SC) was constructed from the 8 dummy variables (0 =”less than 3 days a week”
and 1= “ at least 3 days a week”) yielding ranges of 1-8 and 0-8, respectively. In
addition, the frequency of intake of sugared snacks and drinks taken the previous day
was recorded and dummy variables were constructed yielding (1) ≥ once yesterday
and (0) not taken yesterday.
Statistical analysis
Data was entered using STAR OFFICE and transferred to SPSS version 11.5 for
analyses. Univariate analyses were performed by use of chi-square statistics.
Spearman’s correlation, Wilcoxon signed rank test, and Mc Nemar’s test were used
for paired ordinal and dichotomous variables. Internal consistency and reproducibility
was assessed using Cronbach’s alpha and Cohen’s kappa, respectively. Multiple
variable analyses were conducted using GLM ANOVA and GLM Repeated
Measures.

10
Results
Sample profiles
Table 2 gives the percentage distribution of participants’ socio-demographic
characteristics by gender for the FFQ survey. A total of 614 students, 45.1% boys,
mean age 12.4, SD=1.0, 59.6% younger (10-12yr) participated in the FFQ and the
clinical examination. Most of the younger students were girls. The mean DMFT was
0.98, SD=1.6, range 0-15. The corresponding scores in 10-12 and 13-14-year-old
children were 0.77 (1.3) and 1.3 (2.0), respectively. A total of 59.8%, 61.7% and 1.1%
had respectively, DMFT=0, DT=0 and FT>0. Forty students (50% boys, mean age
12.6, SD=1.0) completed the FFQ a second time after a period of one week. Three
hundred and twenty five students participated in the follow up FBC study, 42.8%
boys, mean age 12.3, sd=1.0, 62.5% younger (10-12 yr) students. To assess whether
the participants of the follow up (n= 325), were representative of the study group as a
whole, the follow-up group was compared on relevant characteristics with the pupils
who completed the main FFQ study only (n= 289). There were no statistically
significant differences between the two groups with respect to socio-demographics,
DMFT status and frequency of intake of sugared snacks and drinks.
Internal consistency- and test-retest reliability
Internal consistency reliability (Cronbach’s alpha) for the FFQ ADD and SC sugar
scores obtained in the main survey (n= 614) were 0.70 and 0.69, respectively. The
corresponding alpha score for the FBC SC scores among follow-up study participants
(n= 325) was 0.70. Table 3 shows the mean and median sugar intake estimated from
the FFQ at two time periods (n=40). Wilcoxon signed rank test showed no statistically
significant difference at the group level between the intake assessed at time 1 and time

11
2. The weighted kappa values ranged from 0.16-0.17 (coffee, ice sticks) to 0.55
(biscuits). Intraclass correlation coefficient for the FFQ ADD scores at time a 1 and
time 2 was 0.55 (95% CI 0.3-0.7). The examiner agreement for the clinical
examination was found to be acceptable (Cohen’s kappa= 0.75).
Relative validity
With few exceptions, no striking differences were found between boys and girls and
younger and older students. Thus, results from the whole sample are presented (Table
4). McNemar test with dummy variables (cut off point at least 3-5 days a week)
revealed statistically significant differences between the two methods with
participants consistently reporting a higher intake in the FFQ as compared to the FBC.
With respect to the single sugar items, Spearman’s correlation coefficients ranged
from 0.14 (sugared deserts) to 0.27 (sweets). Results from Wilcoxon signed rank tests
revealed overestimation on the part of the FFQ SC score as compared to the FBC SC
score, with mean values of 5.5 (SD= 1.9) and 3.4 (SD= 1.9), respectively (p<0.001)
(not shown in Table 4). Spearman’s correlation coefficient, rho, for the FFQ SC and
FBC SC scores was 0.30 (p<0.001). The corresponding figures for 10-12 yr and 13-14
year old students were 0.25 and 0.40 (p<0.001), respectively. Crude agreement
between students confirming intake at least 3 days a week and less than 3 times a
week ranged from 50-55% (biscuits, chocolate, soft drinks, coffee, desserts), through
55%-65% (ice cream, sweets) to 87% (tea). The least and most frequently reported
sugar items estimated by both methods were intake of chocolate and tea. To assess the
ability of the FFQ to rank individuals into broad categories of sugar intake, the FFQ
SC scores were divided into quartiles. A GLM ANOVA, adjusting for age and gender
revealed a statistically significant increase (F=10.5, df=3, p<0.001) in the mean FBC

12
SC scores by increasing FFQ quartiles. The adjusted mean values were 2.9 (95% CI
2.5-3.3), 3.1 (95% CI 2.5-3.6), 3.4 (95% CI 3.1-3.8) and 4.6 (95% CI 4.1-5.0) in
quartile 1, 2, 3 and 4, respectively. Bonferroni post hoc showed that the mean values
of quartile 4 differed statistically significantly from those in quartile 1, 2 and 3.
Correspondingly, for all 8 sugar items, mean FBC sugar intake increased across the
FFQ categories, at least 3 days a week and less than 3 days a week. With respect to
intake of biscuits, deserts and tea, the increase was statistically significant for the
older age group, only.
The proportions of children who reported consumption of sugared snacks and drinks
at least once the previous day across 5 consecutive days are depicted in Table 5. The
day to day variation was limited but varied across the food items. GLM with
frequency daily consumption from FBC as within subject factor (time) and the
corresponding FFQ item in terms of (1) at least daily and (2) less than daily as
between subject factors revealed no statistically significant two-way interactions. This
confirms the visual evidence of stability in rank as depicted for daily soda
consumption in Figure 1. Thus, the FBC mean daily frequency consumption within
the FFQ categories maintained their relative position in rank across the 5 days. One-
way ANOVA revealed that reported intake of all sugared items in the FBC showed
stability in ranking between day 1 and day 5 with the “ at least daily” and “less than
daily” FFQ categories being statistically significantly different at each follow-up day
(p<0.005).

13
Socio-demographic correlates of sugar consumption
The proportions of pupils in the main FFQ study (n=614) who reported intake of
sugared snacks and drinks at least 3 days a week ranged from 57% (chocolate) to 93%
(sugared tea). Gender differences with a higher proportion of girls than boys reporting
that intake were statistically significant for biscuits, chocolate and sweets. A GLM
ANOVA with the sum FFQ SC sugar score, (mean= 5.8, SD= 2.0, range 0-8) as
dependent variable and age, gender, parental education and caries experience as fixed
factors, revealed statistically significant effects of gender (F=6.7, df=1, p=0.010) and
age group (F=4.1, df=1, p=0.045) (Table 6). An interaction effect between age and
DMFT status (F=3.6, df=1, p=0.058) approached statistical significance. Stratified
analysis revealed a negative and positive relationship between DMFT and the mean
FFQ SC scores in the younger (10-12 yr) and older (13-14 yr) age groups,
respectively. Subgroup analyses (n=325) with FFQ SC and FBC SC scores as
dependent variables and gender, mothers education, age and DMFT as independent
variables revealed similar estimated effects as those revealed by the main sample
analysis (n=614).
Discussion
Fair to moderate reproducibility was established for most FFQ items. According to
Landis and Koch (26), kappa values at and below 0.20, in the ranges of 0.21-0.40,
0.41-0.60, 0.61-0.80 and 0.81-1.00 indicate poor, fair, moderate, good and very good
agreement, respectively. On the group level, no mean differences were observed
between the two time periods (Table 2). A short one week interval was used in the
present study to avoid the possibility of confusing dietary changes and lack of
repeatability in these young individuals (22).

14
It has been suggested that the simplest method for comparing frequency data is to
calculate the percentage agreement within a certain number of units (14). Comparing
the categories at least 3 days a week / less than 3 days a week based on the FFQ an
FBC method, revealed less satisfactory agreement (50-55%) for biscuits, chocolate,
soft drink, coffee and desert, moderate agreement (60%) for sweets and ice cream and
good agreement (87%) for tea, only (14). The mean consumption estimated by FFQ
and FBC did differ statistically significantly, with the highest consumption identified
by the FFQ across all sugar items. Overestimation of children’s food intake with FFQ
is a common finding in the literature (12-15,27,28). Earlier studies of Norwegian (19)
and British adolescents (30,31) as well as Spanish adults (32) observed overestimation
for most nutrients by FFQ when compared to weighted dietary records. According to
the present data, over reporting was a larger problem with chocolate, biscuits and ice
cream than with soft drinks, sugared tea and deserts. Thus, lack of agreement was
most extensive with the items least frequently reported, suggesting that main course
food items consumed on an everyday basis might be recalled more accurately as
compared to secondary food items such as sugared snacks (27). Pupils might also
have over reported intake of sugared snacks due to social desirability because
commercialised sugar products increasingly gain social importance in non-
industrialised countries (1-2)
An exact agreement at group level between the results from FFQ and FBC is not
necessarily critical to the ability of the FFQ to rank or classify individuals into
broader groups (22). Thus, the FFQ distinguished reliably between those having high
and low average weekly and average daily intake as assessed by the FBC,
15
demonstrating its ability to correctly classify subjects into broader groups of intake of
sugared snacks. Nevertheless, the correlation coefficients obtained ranged from 0.14 -
0.30, suggesting rather poor ability of the FFQ to rank subjects, particularly regarding
the single sugar items. A plausible explanation might be low inter-subject variation
and restricted ranges of assessment scales on both the FFQ and FBC instrument (22).
Moderate reliability on the part of both assessment methods might have contributed to
the small validity coefficients estimated (22). The rank order coefficients observed
were similar to those obtained previously by several authors, but lower than those
reported by others (13,16, 31,27). A number of researchers have suggested that
validity coefficients in the range 0.30-0.70 could indicate satisfactory agreement
between FFQ and dietary records (33), whereas Romieu et al (34) recommended
coefficients in the range 0.20-0.50 to be satisfactory.
The present findings should be interpreted in light of the assumed accuracy of the
reference method applied. If the 5 day FBC was biased towards underestimation of
sugar snacking due to forgetfulness, lack of compliance and unstructured eating
patterns, then the validity of the FFQ would be underestimated as well. A limitation
connected with the FBC is the coverage of 5 school days only. Since there was no
school on Saturday and Sunday checklists were not collected on those days. If the
consumption of certain sugar items is strongly connected with certain days of the
week, the FBC may not give a true picture of the average weekly intake. Little
difference was observed across the 5 days regarding the ability of the FFQ categories
to discriminate between high and low average daily consumption (Fig 1). This
suggests that variation in sugar consumption over time was not a major source of
variability in the FBC data.

16
Questions have been raised as to whether FFQ assessing usual food intake is suitable
at all to young individuals (35). Although oral health questionnaires with children in
the age group 6-10-year-olds have been found to have a high level of concordance
between child and care-giver (36), children below the age of 12 have been considered
too young to report their own food intake with acceptable accuracy (14). This
suggests that recalls and records work better at that age than do FFQ (12). In this
study, the FFQ sum scores were appropriate for the purpose of classifying subjects
into broader groups of sugar snacking and the appropriateness tended to improve with
increasing age of the participants.
On average respondents showed a relatively high overall level of sugar intake with the
highest intake reported for females and older pupils. This adds to the construct
validity of the FFQ. Higher sugar consumption in females has been commonly
reported in studies of community populations in sub-Saharan Africa (18,19). On the
other hand, children’s sugar frequency intake was not positively correlated with their
DMFT status. This has been reported previously (39) and might be attributed to the
overall high level of sugar consumption identified. In a previous study of 3-5 year
olds in Uganda, children of parents with low level of education consumed more
sugared snacks and drinks and had higher caries prevalence than did their counterparts
having parents with longer education (20). Similar results with respect to sugar intake
in 4-year-olds have been reported from industrialised countries (37-38). This
association was not observed in the present study, which also corroborate findings
reported elsewhere (37-38). This appears to imply that parental influences are less
important among 10-14 year old primary school children.

17
In sum, the ability of the FFQ to classify Ugandan school children into broad
categories of low and high sugar snacking was acceptable. The results indicate that
the eight item sugar FFQ is inappropriate for estimating absolute intake but could
discriminate between high and low consumers and might be applicable to identify
children at risk and for examining differences between child populations. In spite of
the practical advantages of the short sugar snacking FFQ as tested in this study it
needs further revision to become a valid measurement for the measurement of sugar
snacking in 10-14 year old urban school children.
Acknowledgements
The financial support from the Norwegian Research Council through Faculty of
Dentistry, University of Bergen is highly appreciated. We would like to thank the
students who participated in the extensive data collection. The authors also thank
Professor Ola Haugejorden for valuable comments upon an earlier version of this
paper.

18
Figure text
Fig. 1. Mean frequency of daily soda consumption as reported by FBC at day 1
through day 5 in groups reporting soda consumption at least daily and less than daily
by FFQ

19
References
1. Murray CJL & Lopez AD. Global mortality, disability and the contribution of risk
factors: Global Burden of disease study. Lancet 1997; 349: 1498-1504.
2. Drewnowski A, Popkin BM. The nutrition transition: new trends in the global diet.
Nutr Rev 1997; 55: 31-43.
3. Sreebny LM. Sugar availability, sugar consumption and dental caries.
Community Dent Oral Epidemiol 1982; 10: 1-7.
4. van Loveren C, Duggal MS. Experts’ opinion on the role of diet in caries
prevention. Caries Res 2004; 38: 16-23.
5. Joint WHO/FAO Expert Consultation. Diet, nutrition and the prevention of chronic
diseases. Geneva: World Health Organization, Geneva, 2003.
6. Jamel HA, Sheiham A, Cowell CR, Watt RG. Taste preference for sweetness in
urban and rural populations in Iraq. J Dent Res 1996; 75: 1879-84
7. WHO Oral Health Country/Area Profile programme. Geneva: World Health
Organization; CAPP pages [updated 2002, cited 2005 June9]. Global sugar
consumption 1991-2000. Available from: http://www.whocollab.od.mah.se
8. Kelder SH, Perry CL, Klepp K-I, Lytle LL. Longitudinal tracking of adolescent
smoking, physical activity and food choice behaviour. Am J Public Health 1994; 84:
1121-26.

20
9. Åstrøm AN. Stability of oral health-related behaviour in a Norwegian cohort
between the ages of 15 and 23 years. Community Dent Oral Epidemiol 2004; 32: 354-
62.
10. Block G. A review of validations of dietary assessment methods. Am J Epidemiol
1982; 115: 492-505.
11. Rockett HRH, Breitenbach M, Frazier AL, Witschi J, Wolf AM, Field AE, Coditz
GA. Validation of a youth/adolescent food frequency questionnaire. Prev Med 1997;
26: 808-16.
12. McPherson RS, Hoelscher DM, Alexander M, Scanlon KS, Serdula MK. Dietary
assessment methods among school-aged children: validity and reliability. Prev Med
2000; 31: S11-S33.
13. Speck BJ, Bradley CB, Harrell JS, Belyea MJ. A food frequency questionnaire for
youth: psychometric analysis and summary eating habits in adolescents. J Adolesc
Health 2001; 28:16-25.
14. Hammond J, Nelson M, Chinn S, Rona RJ. Validation of a food frequency
questionnaire for assessing dietary intake in a study of coronary heart disease risk
factors in children. Eur J Clin Nutr 1993; 47: 242-50
15. Andersen LF, Bere E, Kolbjornsen N, Klepp K-I. Validity and reproducibility of
self –reported intake of fruit and vegetable among 6th graders. Eur J Clin Nutr 2004;
58:771-77.
16. Vereecken CA, Maes L. A Belgian study on the reliability and validity of the
health behaviour in school-aged children food-frequency questionnaire. Public Health
Nutr 2003; 6: 581-88.
17. Rockett HR, Colditz GA. Assessing diets of children and adolescents. Am J Clin
Nutr 1997; 65 (suppl): 1116S-1122S.
21
18. Astrom AN, Masalu J. Oral health behaviour patterns among Tanzanian university
students: a repeat cross-sectional study. BMC Oral Health.
Available from: http://www.biomedcentral.com/1472-6831/1/2
19. Okullo I, Nordrehaug Astrom A, Haugejorden O. Variation in caries experience
and sugar intake among secondary school students in urban and rural Uganda. Acta
Odontol Scand 2003; 61: 197-202.
20. Kiwanuka SN, Astrom AN, Trovik TA. Dental caries experience and its
relationship to social and behavioural factors among 3-5 year old children in Uganda.
Int J Paed Dent 2004; 14: 336-346.
21. Lwanga SK, Lemeshow S. Sample size determination in health studies. A
practical manual. Geneva: WHO, 1991.
22. McDowell I, Newell C. Measuring health. A guide to rating scales and
questionnaires. 2nd Ed. New: York: Oxford University Press, 1996, pp 30-41.
23.Schellenberg JA, Victora C, Mushi A, de Savigny D, Schellenberg D, Mshinda H,
et al. Inequities among the very poor: health care for children in rural southern
Tanzania. Lancet 2003; 361: 561-66.
24. World Health Organization. Oral Health Surveys, Basic Methods, 4th edition,
Geneva, 1997.
25. Ling AM, Horwath C, Parnell W. Validation of a short food frequency
questionnaire to assess consumption of cereal foods, fruit and vegetables in Chinese
Singaporeans. Eur J Clin Nutr 1998; 52: 557-64.
26. Landis JR, Koch GG. The measurement of observer agreement for categorical
data. Biometrics 1977; 33: 159-74.

22
27. MacIntyre UE, Venter CS, Vorster HH. A culture-sensitive quantitative food
frequency questionnaire used in an African population: 2. Relative validation by 7-
day weighted records and biomarkers. Public Health Nutr 2004; 4: 63-71.
28. van Assema P, Brug J, Ronda G, Steenhuis I, Oenema A. A short Dutch
questionnaire to measure fruit and vegetable intake: Relative validity among adults
and adolescents. Nutr Health 2002; 16: 85-106
29. Andersen LF, Nes M, Lillegaard IT, Sanstad B, Bjørneboe G, Drevon CA.
Evaluation of a quantitative food frequency questionnaire used in a group of
Norwegian adolescents. Eur. J. Clin Nutr 1995; 49: 543-54.
30. Robinson S, Skelton R, Barker M, Wilman C. Assessing the diet of adolescent
girls in the UK. Public Health Nutr 1999; 2: 571-77.
31. Lietz G, Barton KL, Longbottom PJ, Anderson AS. Can the EPIC food frequency
questionnaire be used in adolescent populations? Public Health Nutr 2002; 5: 783-89
32. Schroder H, Covas MI, Marrugat J, Vila J, Pena A, Alcantara M et al. Use of a
three-day estimated food record, a 72-hour recall and a food frequency questionnaire
for dietary assessment in a Mediterranean Spanish population. Clin Nutr 2001; 20:
429-37.
33. Block G, Woods M, Potosky A, Clifford C. Validation of self-administered diet
history questionnaire using multiple records. J Clin Epidemiol 1990; 43:1327-35.
34. Romieu I, Stampfer MJ,Stryker WS,Hernadez M, Kaplan L,Sober A et al.. Food
predictors of beta-carotene and alpha- tocopherol: validation of a food frequency
questionnaire. Am J Epidemiol 1990; 131: 864-76.
35. Randall E. Measuring food use in school aged children. J Sch Health 1991; 61:
201-3.

23
36. Jamieson LM, Thomson WM, McGee R. An assessment of the validity and
reliability of dental self-report items used in a national Child Nutrition Survey.
Community Dent Oral Epidemiol 2004; 32:49-54.
37. Overby NC, Lillegaard ITL, Johansson L, Andersen LF. High intake of added
sugar among Norwegian children and adolescents. Public Health Nutr 2003; 7: 285-
93.
38. Cullen KW, Ash DM, Warnecke C, de Moor C. Intake of soft drinks, fruit-
flavored beverages and fruits and vegetables by children in grades 4 to 6. Am J Public
Health 2002; 9: 1475-78.
39. Zero DT. Sugars-The arch criminal? Caries Res 2004; 38: 277-85.

24
Table1. Distribution of study participants according to selection of sample and
exclusion criteria
n (%)
Standard seven children attending 11 government
schools in Kampala central
2589
Size of systematic random sample 826 (100.0)
Children who did not return consent forms 125 (15.1)
Children who refused to be examined 20 (2.4)
Children above 15 years of age excluded from analyses 67 (8.1)
Children for FFQ survey 614 (74.3)
Children selected to participate in 5-days FBC 394 (100.0)
Number of children who completed five days FBC 325 (82.5)

25
Table 2. Percentage (n) of participants by socio-demographic characteristics (n=614)
Male % (n) Female %(n) All
Age(yrs)
10-12 53.4(148) 64.7(218) 59.6(366)
13-14 46.6(129) 35.3(119)** 40.4(248)
Mother’s education
Low 54.5(139) 60.7(181) 57.9(320)
Higher 45.5(116) 39.3(117) 42.1(233)
Father’s education
Low 37.3(91) 41.9(124) 39.8(215)
High 62.7(153) 58.1(172) 60.2(325)
Wealth index
Most poor (1) 21.2(56) 18.6(61) 19.8(117)
Very poor 17.0(45) 21.3(70) 19.4(115)
Poor 19.7(52) 21.6(71) 20.8(123)
Little poor 20.5(54) 19.2(63) 19.8(117)
Least poor (5) 21.6(57) 19.2(63) 20.3(120)
DMFT>0 37.9(105) 42.1(142) 40.2(247)
** p<0.01

26
Table 3. Reproducibility: Intake of sugared snacks per week based on FFQ at Time 1
and Time 2, median (P25,75), mean. Wilcoxon’s signed rank test and kappa (n=40)
Time 1 Time 2 P Kappa
Biscuits 3.0 (2.0,3.0)
2.7-
3.0 (2.0,3.0)
2.7
0.964 0.55
Chocolate 3.0 (1.0,3.0)
2.4
3.0 (2.0,3.0)
2.6
0.198 0.39
Ice sticks 3.0 (3.0,3.7)
2.9
3.0 (2.0,3.0)
2.8
0.112 0.17
Soft drinks 3.0 (1.2,3.0)
2.4
3.0 (2.0,3.0)
2.5
0.711 0.40
Coffee 3.0 (1.2,3.0)
2.6
3.0 (2.0,3.0)
2.7
0.410 0.16
Tea 3.0 (3.0,4.0)
3.1
3.0 (3.0,4.0)
3.1
0.572 0.29
Sugared deserts- 3.0 (2.2,3.7)
2.8
3.0 (3.0,3.0)
2.8
0.967 0.23
Sweets 3.0 (3.0,4.0)
3.0
3.0 (3.0,3.0)
2.9
0.654 0.23
Sugar ADD
scores
22.0 (20.2,24.0)
22.4
23.0 (19.0,25.0)
22.3
0.723 0.45

27
Table 4. Relative validity: Mean and (sd) for intake of sugared snacks and drinks, Chi
square (Mc Nemar’s test) and the Spearman’s correlation coefficient (rho) based on
the FFQ and 5 days FBC (n=325).
FFQ
Mean (sd) ƒ
FBC
Mean (sd) ƒ
Chi
Square
P rho
Biscuits 0.6 (0.4) 0.3 (0.3) 41.5 <0.001 .17**
Chocolate 0.5 (0.4) 0.1 (0.3) 119.9 <0.001 .21**
Ice sticks 0.7 (0.4) 0.5 (0.4) 59.1 <0.001 .22**
Soft drinks 0.6 (0.4) 0.4 (0.3) 25.4 <0.001 .16**
Coffee 0.6 (0.4) 0.3 (0.4) 71.6 <0.001 .25**
Tea 0.9 (0.2) 0.8 (0.3) 6.5 <0.001 .14**
Sugared deserts- 0.7 (0.4) 0.4 (0.4) 53.7 <0.001 .24**
Sweets 0.7 (0.4) 0.5 (0.4) 26.2 <0.001 .27**
**p<0.001
ƒ The average of the 0,1variables is the proportion who scored 1-at least 3 days a week

28
Table 5. Day to day variation in intake of sugared snacks and drinks based on the
FBC. Percentage of those reporting at least once a day intake (n=325).
Sugar items, Day 1
%
Day 2
%
Day 3
%
Day 4
%
Day 5
%
Biscuits 28.7 29.8 26.6 25.7 25.4
Chocolate 12.3 11.1 9.1 10.2 9.4
Ice-stick 21.1 39.5 39.8 39.5 36.3
Soda 37.4 29.8 30.7 25.0 24.0
Tea 87.1 81.0 73.7 75.0 77.2
Coffee 29.2 24.3 26.6 25.7 24.6
Deserts’ 37.4 34.8 29.8 29.8 28.7
Sweets’ 39.2 36.8 37.4 42.7 36.3

29
Table 6. Adjusted mean FFQSC scores and 95% Confidence Interval (95% CI) by
socio-demographic and clinical variables (n=614).
n Mean (95% CI)
Gender
Girl 290 6.0 (5.7-6.2)
Boy 244 5.5 (5.2-5.7)*
Mother’s education
Lower 309 5.7 (5.4-5.9)
Higher 225 5.8 (5.5-6.1)
Age group
10-12 yr 320 5.5 (5.3-5.8)
13-14 yr 220 5.9 (5.6-6.2)*
Caries prevalence
DMFT=0 319 5.8 (5.5-6.0)
DMFT>0 215 5.7 (5.4-5.9)
*p<0.05

30


Paper V

Norsk Epidemiologi 2005; 15 (2): 175-182 175
Self-reported dental pain and associated factors in Ugandan schoolchildren
S.N. Kiwanuka1,3 and A.N. Åstrøm1,2 1) Centre for international health, University of Bergen, Norway
2) Department of Oral Sciences-Community Dentistry, University of Bergen, Norway 3) Department of Dentistry, Faculty of Medicine, Makerere University, Uganda
Correspondence: Anne Nordrehaug Åstrøm, Center for international health, Armauer Hansen Building, N-5021 Bergen, Norway Telephone: +47 55 974984 Telefax: +47 55 974979 e-mail: [email protected]
ABSTRACT
There is a limited amount of research on the prevalence and determinants of subjective oral health indica-tors in children. Objective: to assess the prevalence of self-reported dental pain and to explore its relation-ship with socio-demographic characteristics in 10-14 year olds attending primary schools. Method: A cross-sectional survey was conducted during January-March 2004, including 11 public primary schools in Kampala, Uganda. A total of 614 children completed questionnaires administered in schools. Dental caries and plaque status were recorded in permanent teeth. Results: Experience with dental pain was confirmed by 42.1% boys and 52.3% girls. The crude prevalence of dental caries was 37.9% in boys and 42.1% in girls. Plaque was present on anterior teeth and 84.3% complained of at least one oral problem. Multiple logistic regression analysis revealed that reporting at least two oral problems (OR = 2.7), being dissatisfied with dental appearance (OR = 2.7) and having visited a dentist twice during the previous 3 years (OR = 2.2) were associated with higher odds of reported dental pain. Conclusion: A substantial proportion of school children had experience with dental pain. Dental pain associated positively with dental caries, sub-jective oral health indicators and dental attendance. Knowledge about the extent and significance of dental pain is important for the planning and evaluation of preventive and treatment efforts.
INTRODUCTION Emerging consensus in the literature has identified three major dimensions of oral health related quality of life (OHRQoL); clinically assessed disease and impair-ments, disease and treatment specific symptoms and functional and psychological disability (1,2). Over the years, several subjective oral health indicators have been developed for application in adults (3-6). There is a lack of OHRQoL measures designed for children, although paediatric oral disorders are numerous and likely to affect children’s quality of life negatively (7,8). Few attempts have been made to assess the pre-valence and determinants of OHRQoL generally and dental pain particularly in the child populations of non-industrialized countries. In this study, dental pain is considered to be synonymous with toothache and de-scribed as pain originating from innervated tissues within the tooth or immediately adjacent to it (9). Untreated dental caries might lead to dental pain, which in turn results in impacts of affected play and sleep, avoidance of certain types of food and decreased school performance (9-11). In low-income countries like Uganda, the exposure to dental services is low, and toothache has been cited as a common reason for children to seek dental care (12,13). Previous studies involving 13-19-yr-old Ugandan school children have provided evidence of high rates (44%) of delayed
treatment demand (dental visiting because of tooth-ache), indicating a need for emergency care for later stages of dental caries (12). As a result of a growing consumption of foods and drinks with added sugars and inadequate oral health care services, it is expected that caries experience of children will increase in Uganda and other sub-Saharan African countries (14). Previous national estimates for Uganda have placed the mean DMFT (decayed, missed and filled teeth) for 12-year-olds at 0.5 in 1987, 0.4 in 1988 and 0.4 in 1993 (15). National averages mask differences within the country with mean DMFT estimates varying from 0.6 to 2.9 across urban and rural communities (16). Most epidemiological studies of the dental health situation in child populations have inquired about den-tal pain by asking parents (9,17). In the USA, 5% of 5-12-yr-olds reported some pain from their teeth/ gums in the previous 3 months according to their parents (18). Among South Australian children aged 5-15 yr, 12% (5-yr-olds) and 32% (12-yr-olds) reported a his-tory of toothache (19). Shepherd et al. (10) interviewed 8-yr-old British children and found a prevalence of 47.5%. In non-industrialized countries, the prevalence and severity of children’s dental pain has usually been higher than the figures presented in UK, the USA and Europe. Ratnayake and Ekanayake (13) examined 8-yr-old Sri Lanka children and found a lifetime pre-valence of oral pain of 49% and 53% as reported by
176 S.N. KIWANUKA AND A.N. ÅSTRØM
children themselves and their parents, respectively. Naidoo et al. (20) examined 8-10-yr-olds in the Wes-tern Cape of South Africa and found a prevalence of dental pain within the past two months as high as 70%. In a recent study of 12-yr-old Ugandan school children from a rural sub-county, toothache in the last four weeks was reported by 36.5%, whereas 20.2% and 6.4% needed a filling and one or more teeth extracted, respectively (15). According to the biopsychosocial model dental pain is known to have both biological and psycho-social components. Thus, dental pain perceptions are complex functions of socio-demographic status, indivi-dual characteristics such as knowledge, beliefs and expectations, in addition to the principle pathological cause of dental caries (5,21). Although found to be consistently associated with severity of tooth decay, conditions such as erosion, trauma and exfoliation of primary teeth can also give rise to dental pain. A review of the epidemiology of dental pain and dental caries in child populations has shown that dental pain is prevalent among children even in contemporary populations with historically low levels of caries expe-rience (9). In the health and lifestyle survey conducted among Finnish adolescents, 1977-1997, no tendency for the prevalence of toothache to decline across time was recorded despite a corresponding decline in caries experience (22). Among 5-10-yr-old South Australian school children, experience of toothache at any time in a child’s lifetime was reported by 9% of parents of subjects who had no clinical evidence of dental caries (19). In developed countries, toothache has been reported to be most prevalent in individuals of low income and education (13,17,22). Moreover, the caries–toothache association is found to be strongest in populations with reduced access to dental care, in lower socioeconomic status groups and in populations where dental caries is largely untreated (9). Less fre-quent dental attendance patterns have been associated with low prevalence of reported dental pain among children in non-industrialized countries (13). Description of the extent and distribution of dental pain is important when assessing the burden of dental diseases in children. Focusing on 10-14-year-old pri-mary school children in Kampala, Uganda, this study aimed to assess the prevalence of dental pain and its association with dental caries experience, socio-demo-graphic characteristics, oral hygiene, dental attendance and self-reported oral health. Socio-demographics as possible effect modifiers of the association between dental caries and dental pain was also investigated. MATERIAL AND METHODS Study population and sampling method A cross-sectional study was conducted among children attending standard seven in primary schools in Kam-pala (0.3 mg fluoride/L), the capital city of Uganda.
The study was conducted during January-March 2004 using a structured questionnaire and a clinical exa-mination. A list of all government (public) primary schools (n = 13) within the Kampala central division (area 14.7 km2) was obtained from the Division Head-quarters. Two primary schools with less than 30 children were excluded due to limited size leaving 11 schools to constitute the sampling frame of 2589 stan-dard seven pupils. A sample size of 650 children was calculated based on an assumed prevalence of reported dental pain of 50%, a standard error of 5% and a de-sign effect of 2 (21). Lists of all students in standard 7 were obtained from the school authorities and every third student in each school was randomly selected to participate. This sampling strategy provided a sample that was self-weighting, implying that each participa-ting student had the same probability of being selected into the study. Allowing for refusal to give informed consent and 701 signed letters were returned. The help of teachers was elicited in reminding the children to return the signed forms and to set an appropriate date for the data collection. A total of 67 pupils were exclu-ded due to a wide age range (15-18 yr) and to being absent from school on the day of data collection. Twenty pupils who completed the questionnaire sur-vey refused to be examined clinically and were also excluded from the study. The final participation rate for the main questionnaire survey and clinical study was 74% (n = 614). Ethical considerations Ethical clearance was obtained from the ethical research committees in Norway and Uganda. Written permission to conduct the study was obtained from the Ministries of Health and Education in Uganda, local administration authorities and the school authorities. Written informed consent was obtained from the parent on behalf of their children. Clinical examination The clinical examination was carried out under field conditions in the class-room setting by one dentist (SNK), whereas a trained assistant recorded the obser-vations. Students were examined whilst seated on a chair, using a head lamp as source of illumination. Initially visible plaque on anterior maxillary teeth was recorded. Dental probes and plane mouth mirrors were employed. The teeth were cleaned and dried with cotton roles before being examined for caries using the decayed, missing and filled tooth index (DMFT) as de-scribed by the World Health Organization (23). Caries was recorded as being present when a lesion in a pit/fissure or on a smooth surface had a detectable softened floor, undermined enamel, softened wall or a temporary filling in addition to sticky enamel lesions. A tooth was considered missing if there was a history of extraction due to pain and or the presence of a ca-vity. Lesions were recorded as present when a carious

SELF-REPORTED DENTAL PAIN IN SCHOOLCHILDREN 177
cavity was apparent on visual inspection under field conditions (DMFT = 0 and DMFT > 0). Calibration exercise was carried out at the Institute for Pediatric Dentistry, Faculty of Dentistry, University of Bergen, Norway. Questionnaire survey The structured questionnaire comprised various socio-demographic and oral health related variables. The questionnaire was constructed and administered in English, which is the language of instruction in all for-mal academic institutions in Uganda. Health profes-sionals reviewed the survey instrument for semantic, experiential and conceptual equivalence. Sensitivity to culture and selection of appropriate words were consi-dered. The questionnaire was pilot tested and adjusted accordingly before being used in the field. The main researcher (SNK) and four trained assistants admini-stered the questionnaire in schools as part of the class-room activity to provide a standard administration. Questions were read out loud one at a time while the participants filled in the responses on their own. Dependent variable Self-reported dental pain was assessed using one sin-gle question. The participants were asked whether or not they had experienced dental pain during the pre-vious 12 months. Response categories were given as yes (1) and no (0). Independent variables Bleeding gums and sore mouth were inquired in terms of (1) yes and (0) no. A self-reported oral problem index was constructed from the two items. Aspects of the dwelling were assessed including fuel used for cooking as indicators of socioeconomic status. The predictor variables used in the analyses, their coding and the number of subjects (%) according to categories are given in Table 1. Statistical analysis Data was entered using STAR OFFICE and transferred to SPSS version 13.0 for analyses. Univariate analyses were performed by use of chi-square statistics and logistic regression. Reproducibility was assessed using Cohen’s kappa and Spearman’s correlation coefficient. Multiple variable analysis was conducted using multi-ple logistic regression. RESULTS Characteristics of participants A total of 614 students, 45.1% boys, mean age 12.4, SD = 1.0, 59.6% younger (10-12yr) participated in the questionnaire survey and were examined for dental ries. Most of the younger students were girls. A majority confirmed brushing with toothpaste (98%). In Uganda most of the commercialised toothpaste is
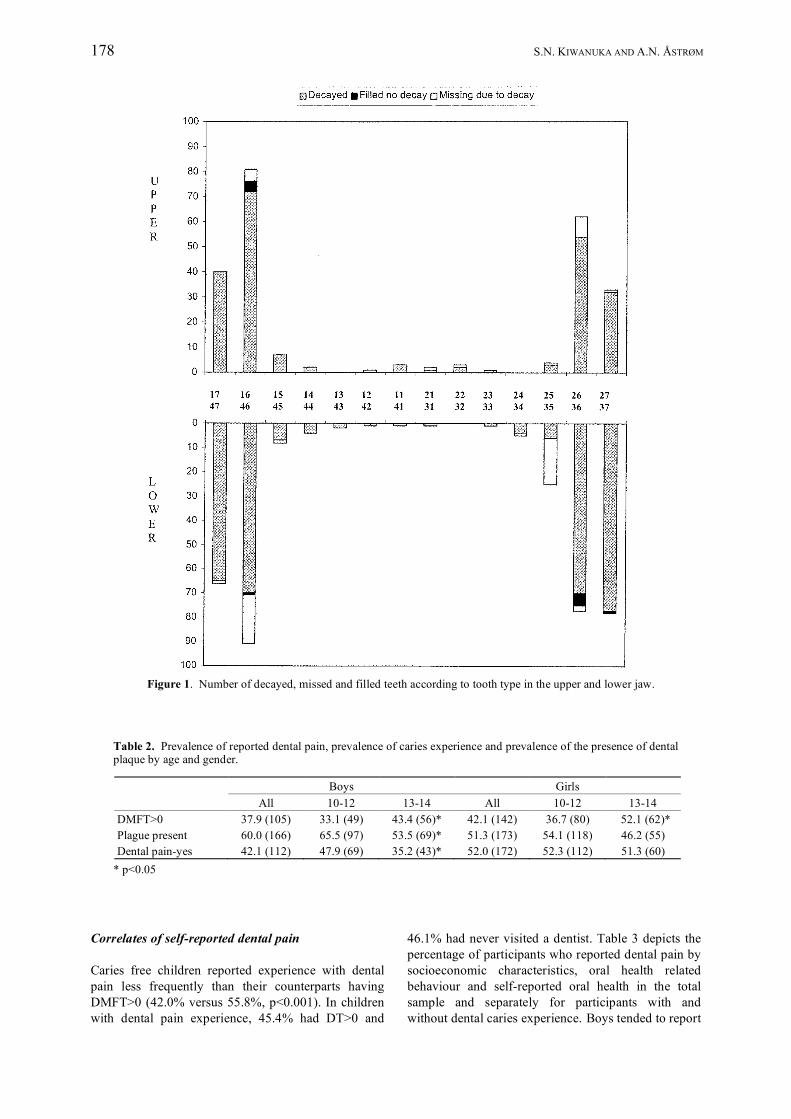
fluoridated. Above three in five participants reported at least one oral symptom and 553 (90.1%) were satisfied with their mouth and teeth. A majority, 346 (56.4%) did not confirm dental attendance during the previous 3 years (Table 1). Test-retest reliability Forty students (50% boys, mean age 12.6, SD = 1.0) completed the questionnaire and were examined cli-nically a second time after one week. The examiner agreement for the clinical examination in terms of DMFT was found to be acceptable (Cohen’s kappa = 0.75). Spearman’s correlation coefficient across the questionnaire variables were 0.38 (toothache), 0.56 (satisfaction with oral condition), 0.53 (satisfaction with dental appearance), 0.84 (dental attendance), 0.74 (household energy source), and 1.00 (age and gender). Prevalence of caries experience, plaque and self- reported dental pain The first molars (270 teeth) were most frequently affected with untreated decay, closely followed by the second molars (220 teeth). The lower molars were more frequently affected than their upper counterparts (Figure 1). The mean DMFT was 0.98, SD = 1.6, range 0-15. The prevalence of untreated dental caries, DT>0, was 235 (38.3%), constituting 95% of the DMFT score. The age specific prevalence of caries experience (DMFT>0), visible plaque and self-reported dental pain in boys and girls is depicted in Table 2. Dental pain was confirmed by 284 partici-pants (47.6%, 95% CI 43.7–51.5), 42.1% (95% CI 36.3–47.9) boys and 52.3% (95% CI 48.0–58.0) girls. Among males, 47.9% versus 35.2% (p<0.05) of 10-12-yr-olds and 13-14-yr-olds confirmed dental pain.
Table 1. Number (%) of subjects by category on inde-pendent variables.
Variables Categories (code) N (%) Gender Girl (1) 337 (54.9) Boy (2) 277 (45.1) Age 10-12 (1) 366 (59.6) 13-14 (2) 248 (40.4) Household energy source Electricity (0) 159 (26.0) Other (wood/
charcoal) (1) 453 (74.0)
Dental visit last three years Never (1) 346 (56.4) Once (2) 163 (26.5) Twice (3) 105 (17.1) Caries experience DMFT = 0 (0) 367 (59.8) 0<DMFT<3 (1) 159 (25.9) DMFT≥3 (2) 88 (14.3) Plaque score No (0) 275 (44.8) Yes (1) 339 (55.2) Dental appearance Satisfied (0) 509 (83.2) Dissatisfied (1) 103 (16.8) Symptoms None (0) 200 (34.0) One (1)) 281 (47.8) Two (2) 107 (18.2)
178 S.N. KIWANUKA AND A.N. ÅSTRØM
Figure 1. Number of decayed, missed and filled teeth according to tooth type in the upper and lower jaw.
Table 2. Prevalence of reported dental pain, prevalence of caries experience and prevalence of the presence of dental plaque by age and gender. Boys Girls All 10-12 13-14 All 10-12 13-14 DMFT>0 37.9 (105) 33.1 (49) 43.4 (56)* 42.1 (142) 36.7 (80) 52.1 (62)* Plague present 60.0 (166) 65.5 (97) 53.5 (69)* 51.3 (173) 54.1 (118) 46.2 (55) Dental pain-yes 42.1 (112) 47.9 (69) 35.2 (43)* 52.0 (172) 52.3 (112) 51.3 (60)
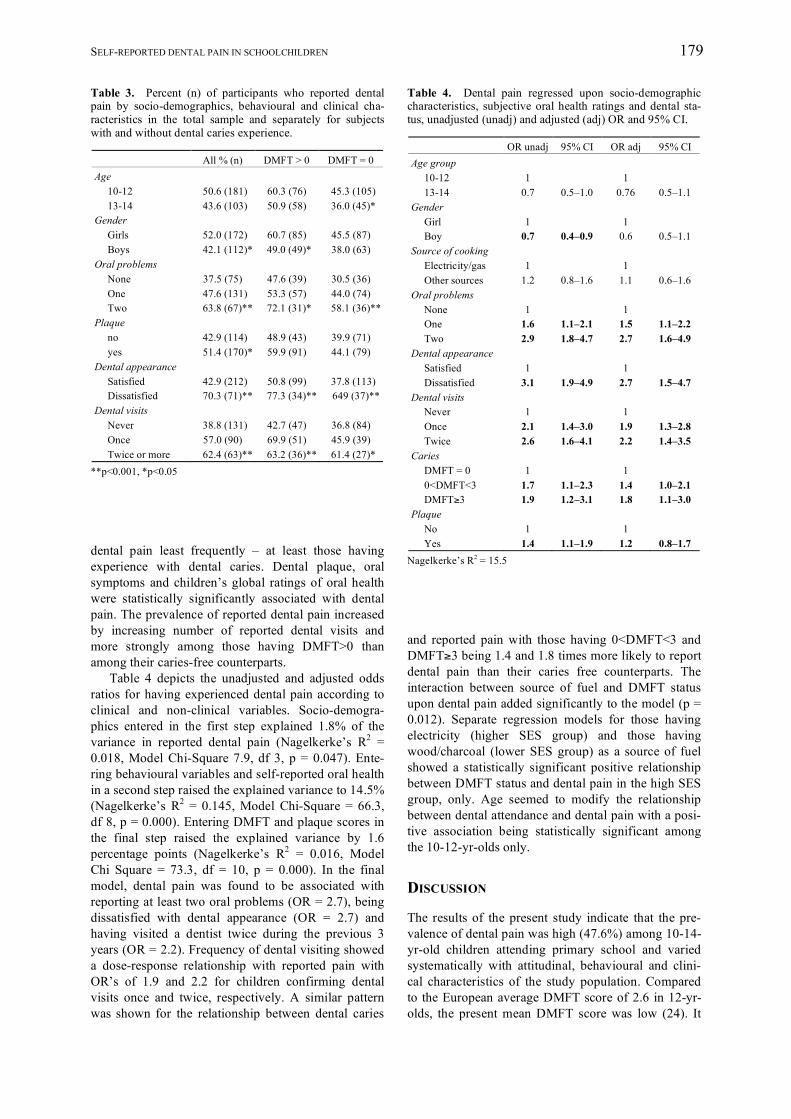
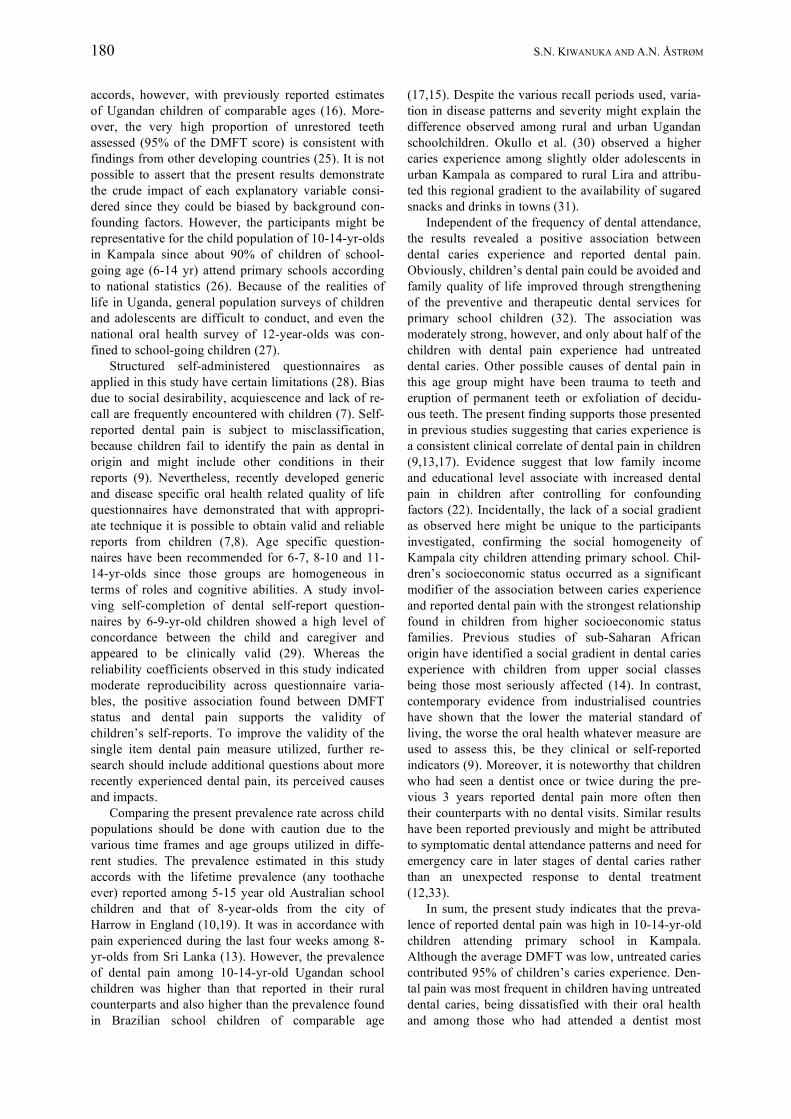
* p<0.05 Correlates of self-reported dental pain Caries free children reported experience with dental pain less frequently than their counterparts having DMFT>0 (42.0% versus 55.8%, p<0.001). In children with dental pain experience, 45.4% had DT>0 and
46.1% had never visited a dentist. Table 3 depicts the percentage of participants who reported dental pain by socioeconomic characteristics, oral health related behaviour and self-reported oral health in the total sample and separately for participants with and without dental caries experience. Boys tended to report
SELF-REPORTED DENTAL PAIN IN SCHOOLCHILDREN 179
Table 3. Percent (n) of participants who reported dental pain by socio-demographics, behavioural and clinical cha-racteristics in the total sample and separately for subjects with and without dental caries experience. All % (n) DMFT > 0 DMFT = 0 Age 10-12 50.6 (181) 60.3 (76) 45.3 (105) 13-14 43.6 (103) 50.9 (58) 36.0 (45)* Gender Girls 52.0 (172) 60.7 (85) 45.5 (87) Boys 42.1 (112)* 49.0 (49)* 38.0 (63) Oral problems None 37.5 (75) 47.6 (39) 30.5 (36) One 47.6 (131) 53.3 (57) 44.0 (74) Two 63.8 (67)** 72.1 (31)* 58.1 (36)** Plaque no 42.9 (114) 48.9 (43) 39.9 (71) yes 51.4 (170)* 59.9 (91) 44.1 (79) Dental appearance Satisfied 42.9 (212) 50.8 (99) 37.8 (113) Dissatisfied 70.3 (71)** 77.3 (34)** 649 (37)** Dental visits Never 38.8 (131) 42.7 (47) 36.8 (84) Once 57.0 (90) 69.9 (51) 45.9 (39) Twice or more 62.4 (63)** 63.2 (36)** 61.4 (27)*
**p<0.001, *p<0.05 dental pain least frequently – at least those having experience with dental caries. Dental plaque, oral symptoms and children’s global ratings of oral health were statistically significantly associated with dental pain. The prevalence of reported dental pain increased by increasing number of reported dental visits and more strongly among those having DMFT>0 than among their caries-free counterparts. Table 4 depicts the unadjusted and adjusted odds ratios for having experienced dental pain according to clinical and non-clinical variables. Socio-demogra-phics entered in the first step explained 1.8% of the variance in reported dental pain (Nagelkerke’s R2 = 0.018, Model Chi-Square 7.9, df 3, p = 0.047). Ente-ring behavioural variables and self-reported oral health in a second step raised the explained variance to 14.5% (Nagelkerke’s R2 = 0.145, Model Chi-Square = 66.3, df 8, p = 0.000). Entering DMFT and plaque scores in the final step raised the explained variance by 1.6 percentage points (Nagelkerke’s R2 = 0.016, Model Chi Square = 73.3, df = 10, p = 0.000). In the final model, dental pain was found to be associated with reporting at least two oral problems (OR = 2.7), being dissatisfied with dental appearance (OR = 2.7) and having visited a dentist twice during the previous 3 years (OR = 2.2). Frequency of dental visiting showed a dose-response relationship with reported pain with OR’s of 1.9 and 2.2 for children confirming dental visits once and twice, respectively. A similar pattern was shown for the relationship between dental caries
Table 4. Dental pain regressed upon socio-demographic characteristics, subjective oral health ratings and dental sta-tus, unadjusted (unadj) and adjusted (adj) OR and 95% CI. OR unadj 95% CI OR adj 95% CI Age group 10-12 1 1 13-14 0.7 0.5–1.0 0.76 0.5–1.1 Gender Girl 1 1 Boy 0.7 0.4–0.9 0.6 0.5–1.1 Source of cooking Electricity/gas 1 1 Other sources 1.2 0.8–1.6 1.1 0.6–1.6 Oral problems None 1 1 One 1.6 1.1–2.1 1.5 1.1–2.2 Two 2.9 1.8–4.7 2.7 1.6–4.9 Dental appearance Satisfied 1 1 Dissatisfied 3.1 1.9–4.9 2.7 1.5–4.7 Dental visits Never 1 1 Once 2.1 1.4–3.0 1.9 1.3–2.8 Twice 2.6 1.6–4.1 2.2 1.4–3.5 Caries DMFT = 0 1 1 0<DMFT<3 1.7 1.1–2.3 1.4 1.0–2.1 DMFT≥3 1.9 1.2–3.1 1.8 1.1–3.0 Plaque No 1 1 Yes 1.4 1.1–1.9 1.2 0.8–1.7
Nagelkerke’s R2 = 15.5 and reported pain with those having 0<DMFT<3 and DMFT≥3 being 1.4 and 1.8 times more likely to report dental pain than their caries free counterparts. The interaction between source of fuel and DMFT status upon dental pain added significantly to the model (p = 0.012). Separate regression models for those having electricity (higher SES group) and those having wood/charcoal (lower SES group) as a source of fuel showed a statistically significant positive relationship between DMFT status and dental pain in the high SES group, only. Age seemed to modify the relationship between dental attendance and dental pain with a posi-tive association being statistically significant among the 10-12-yr-olds only. DISCUSSION The results of the present study indicate that the pre-valence of dental pain was high (47.6%) among 10-14-yr-old children attending primary school and varied systematically with attitudinal, behavioural and clini-cal characteristics of the study population. Compared to the European average DMFT score of 2.6 in 12-yr-olds, the present mean DMFT score was low (24). It
180 S.N. KIWANUKA AND A.N. ÅSTRØM
accords, however, with previously reported estimates of Ugandan children of comparable ages (16). More-over, the very high proportion of unrestored teeth assessed (95% of the DMFT score) is consistent with findings from other developing countries (25). It is not possible to assert that the present results demonstrate the crude impact of each explanatory variable consi-dered since they could be biased by background con-founding factors. However, the participants might be representative for the child population of 10-14-yr-olds in Kampala since about 90% of children of school-going age (6-14 yr) attend primary schools according to national statistics (26). Because of the realities of life in Uganda, general population surveys of children and adolescents are difficult to conduct, and even the national oral health survey of 12-year-olds was con-fined to school-going children (27). Structured self-administered questionnaires as applied in this study have certain limitations (28). Bias due to social desirability, acquiescence and lack of re-call are frequently encountered with children (7). Self-reported dental pain is subject to misclassification, because children fail to identify the pain as dental in origin and might include other conditions in their reports (9). Nevertheless, recently developed generic and disease specific oral health related quality of life questionnaires have demonstrated that with appropri-ate technique it is possible to obtain valid and reliable reports from children (7,8). Age specific question-naires have been recommended for 6-7, 8-10 and 11-14-yr-olds since those groups are homogeneous in terms of roles and cognitive abilities. A study invol-ving self-completion of dental self-report question-naires by 6-9-yr-old children showed a high level of concordance between the child and caregiver and appeared to be clinically valid (29). Whereas the reliability coefficients observed in this study indicated moderate reproducibility across questionnaire varia-bles, the positive association found between DMFT status and dental pain supports the validity of children’s self-reports. To improve the validity of the single item dental pain measure utilized, further re-search should include additional questions about more recently experienced dental pain, its perceived causes and impacts. Comparing the present prevalence rate across child populations should be done with caution due to the various time frames and age groups utilized in diffe-rent studies. The prevalence estimated in this study accords with the lifetime prevalence (any toothache ever) reported among 5-15 year old Australian school children and that of 8-year-olds from the city of Harrow in England (10,19). It was in accordance with pain experienced during the last four weeks among 8-yr-olds from Sri Lanka (13). However, the prevalence of dental pain among 10-14-yr-old Ugandan school children was higher than that reported in their rural counterparts and also higher than the prevalence found in Brazilian school children of comparable age
(17,15). Despite the various recall periods used, varia-tion in disease patterns and severity might explain the difference observed among rural and urban Ugandan schoolchildren. Okullo et al. (30) observed a higher caries experience among slightly older adolescents in urban Kampala as compared to rural Lira and attribu-ted this regional gradient to the availability of sugared snacks and drinks in towns (31). Independent of the frequency of dental attendance, the results revealed a positive association between dental caries experience and reported dental pain. Obviously, children’s dental pain could be avoided and family quality of life improved through strengthening of the preventive and therapeutic dental services for primary school children (32). The association was moderately strong, however, and only about half of the children with dental pain experience had untreated dental caries. Other possible causes of dental pain in this age group might have been trauma to teeth and eruption of permanent teeth or exfoliation of decidu-ous teeth. The present finding supports those presented in previous studies suggesting that caries experience is a consistent clinical correlate of dental pain in children (9,13,17). Evidence suggest that low family income and educational level associate with increased dental pain in children after controlling for confounding factors (22). Incidentally, the lack of a social gradient as observed here might be unique to the participants investigated, confirming the social homogeneity of Kampala city children attending primary school. Chil-dren’s socioeconomic status occurred as a significant modifier of the association between caries experience and reported dental pain with the strongest relationship found in children from higher socioeconomic status families. Previous studies of sub-Saharan African origin have identified a social gradient in dental caries experience with children from upper social classes being those most seriously affected (14). In contrast, contemporary evidence from industrialised countries have shown that the lower the material standard of living, the worse the oral health whatever measure are used to assess this, be they clinical or self-reported indicators (9). Moreover, it is noteworthy that children who had seen a dentist once or twice during the pre-vious 3 years reported dental pain more often then their counterparts with no dental visits. Similar results have been reported previously and might be attributed to symptomatic dental attendance patterns and need for emergency care in later stages of dental caries rather than an unexpected response to dental treatment (12,33). In sum, the present study indicates that the preva-lence of reported dental pain was high in 10-14-yr-old children attending primary school in Kampala. Although the average DMFT was low, untreated caries contributed 95% of children’s caries experience. Den-tal pain was most frequent in children having untreated dental caries, being dissatisfied with their oral health and among those who had attended a dentist most

SELF-REPORTED DENTAL PAIN IN SCHOOLCHILDREN 181
frequently. The caries–dental pain relationship was stronger in children from higher socioeconomic back-grounds. Knowledge about the extent and significance of reported dental pain clearly indicates a need to strengthening preventive and therapeutic dental ser-vices among primary school children in Kampala.
ACKNOWLEDGEMENTS The financial support from the Norwegian Research Council through Faculty of Dentistry, University of Bergen (Grant no 710004) is highly appreciated. We would like to thank the students who participated in the extensive data collection.
REFERENCES 1. Slade GD. The oral health impact profile. In: Slade GD, ed. Measuring oral health and quality of life. Chapel
Hill: University of North Carolina, Dental Ecology, 1997. 2. Gift HC, Atchinson KA, Dayton CM. Conceptualising oral health and oral health related quality of life. Soc
Sci Med 1997; 44: 601-608. 3. Cushing AM, Sheiham A, Maizels J. Developing socio-dental indicators – the social impact of dental disease.
Community Dent Health 1986; 3: 3-17. 4. Atchinson KA, Dola TA. Development of the Geriatric Oral Health Assessment. Index J Dent Educ 1990; 54:
680-687. 5. Locker D, Miller Y. Subjectively reported oral health status in an adult population. Community Dent Oral
Epidemiol 1994; 22: 425-430. 6. Adulyanon S, Vourapukjaru J, Sheiham A. Oral impacts affecting daily performances in a low dental Thai
population. Community Dent Oral Epidemiol 1996; 24: 385-389. 7. Jokovic A, Locker D, Stephens M, Kenny D, Tompson B, Guyatt G. Validity and reliability of a questionnaire
for measuring child oral health related quality of life. J Dent Res 2002; 81: 459-463. 8. Gherunpong S, Tsakos G, Sheiham A. Developing and evaluating an oral health related quality of life index
for children; the CHILD-OIDP. Community Dent Health 2004; 21: 161-169. 9. Slade GD. Epidemiology of dental pain and dental caries among children and adolescents. Community Dent
Health 2001; 18: 219-277. 10. Shepherd MA, Nadanovsky P, Sheiham A. The prevalence and impact of dental pain in 8-year-old school-
children in Harrow, England. Br Dent J 1999; 187: 38-41. 11. Levine RS, Pitts NB, Nugent ZJ. The fate of 1,587 un-restored carious deciduous teeth: a retrospective gene-
ral dental practice based study from northern England. Br Dent J 2002; 193: 99-103. 12. Okullo I, Åstrøm AN, Haugejorden O. Social inequalities in oral health and in use of oral health care services
among adolescents in Uganda. Int J Paed Dent 2004; 14: 326-335. 13. Ratnayake N, Ekanayake L. Prevalence and impact of oral pain in 8-year old children in Sri Lanka. Int J Paed
Dent 2005; 15: 105-112. 14. Petersen PE. The World Oral Health Report 2003: continuous improvement of oral health in the 21st century –
the approach of the WHO Global Oral Health programme. Community Dent Oral Epidemiol 2003; 31 (Suppl. 1): 3-24.
15. Nalweyiso N, Busingye J, Whitworth J, Robinson PG. Dental treatment needs of children in a rural subcounty of Uganda. Int J Paed Dent 2004; 14: 27-33.
16. Okullo I. Assessing oral impacts on daily performance, dental caries and aspects of oral care services among adolescents in Uganda. PhD thesis, University of Bergen, Creato Media, 2004.
17. Nomura LH, Bastos JLD, Peres MA. Dental pain prevalence and association with dental caries and socio-economic status in schoolchildren, Southern Brazil, 2002. Braz Oral Res 2004; 18: 134-140.
18. Bailit HL. The prevalence of dental pain and anxiety; their relationship to quality of life. NY State Dent J 1987; 53: 27-30.
19. Slade GD, Spencer AJ, Davies MJ, Burrow D. Intra-oral distribution and impact of caries experience among South Australian schoolchildren. Aust Dent J 1996; 41: 343-350.
20. Naidoo S, Chikte UME, Sheiham A. Prevalence and impact of dental pain in 8-10-year-olds in the western Cape. SADJ 2001; 56: 521-523.
21. Lwanga SK, Lemeshow S. Sample size determination in health studies. Geneva: World health Organization, 1991.
22. Honkala E, Honkala S, Rimpela A, Rimpela M. The trend and risk factors of perceived toothache among Finnish adolescents from 1977 to 1997. J Dent Res 2001; 80: 1823-1827.
23. World Health Organization: Oral health surveys, Basic Methods, 4th edn. Geneva, 1997.

182 S.N. KIWANUKA AND A.N. ÅSTRØM
24. WHO oral health country/area profile. Geneva: World Health Organization, http://www.whocollab.od.mah.se/ index.html.
25. David J, Wang NJ, Åstrøm AN, Kuriakose S. Dental caries and associated factors in 12-year old school-children in Thiruvananthapuram, Kerala, India. Int J Paediatri Dent 2005; 15: 420-28.
26. Uganda Bureau of Statistics Education 2004. http://www.ubos.org/steducation.html. 27. Tirwomwe F, Ekoku Y, Manji F, Bælum V, Fejerskov O. Oral health in Uganda: Results from a National
survey 1987. Kampala: Ministry of Health, Medical Research Institute, 1988. 28. Mc Dowell I, Newell C. Measuring health: A guide to rating scales and questionnaires, 1st edn. New York:
Oxford University Press, 1996. 29. Jamieson LM, Thomson WM, McGee R. An assessment of the validity and reliability of dental self-report
items used in a national Child Nutrition Survey. Community Dent Oral Epidemiol 2004; 32: 49-54. 30. Okullo I, Åstrøm AN, Haugejorden O, Rwenyonyi C. Variation in caries experience and sugar intake among
secondary school students in urban and rural Uganda. Acta Odontol Scand 2003; 61: 197-202. 31. Diehnelt DE, Kiyal HA. Socioeconomic factors that affect international caries levels. Community Dent Oral
Epidemiol 2001; 29: 226-233. 32. Locker D, Jokovic A, Stephens M, Kenny D, Tompson B, Guyatt G. Family impact of child oral and oro-
facial conditions. Community Dent Oral Epidemiol 2002; 30: 438-448. 33. Vigild M, Petersen PE, Hadi R. Oral health behaviour of 12-year-old children in Kuwait. Int J Paed Dent
1999; 9: 23-29.

Appendices

1
APPENDIX I
Serial number Date
CONSENT FORM
(Parent/Caregiver) Title of the project: Reporting on dental caries prevalence and associated risk factors: a study among nursery school children in Uganda Name of researcher: Kiwanuka Suzanne N. Please tick in the box 1. I confirm that I have read and understood the information sheet for the
above study and have had the opportunity to ask questions.
2. I understand that my participation is voluntary and that I am free to
withdraw at any time with out giving any reason.
3. I agree that my child ………………………………(child’s name) and I will
take part in the above study.
Name of child’s parent/caregiver Date Signature ______________________________ ____/____/____ _____________________________
Name of interviewer Date Signature ______________________________ ____/____/____ _____________________________

2
Section A General information about child and parent / caregiver
Nursery school…………….…………….....
Child’s name………………………….……
Child’s date of birth……………………….
Tribe…………………..……………………
Religion………………………………...…..
Child’s gender
Male Female
Respondent’s relation to the child
Mother Father Other (please specify)
…………………………………………..
1. What is your age? (Age of respondent)
………………………………………………
2. What is your (present) marital status? (Please tick one only)
Single Married Divorced/separated Widowed
3. At what level did the child’s mother finish her full time education? (Please tick one only)
Primary school Secondary school Further education (college) Higher education (university/higher learning institution) No formal education Other (please specify)
………………………………………………
4. At what level did the child’s father finish his full-time education? (Please tick one only)
Primary school Secondary school Further education (college). Higher education (university/higher learning institution) No formal education. Other (please specify)
………………………………………………
5. Who owns the house your family is living in at the moment? (Please tick one only)
Owned by the family Rented house Owned by the government Owned by my employers

3
6. How many bedrooms does the house you are living in have? (Please tick one only)
1
2
3
4
More than 4
7. What kind of roof does the house you are living in have? (Please tick one box)
Iron sheets
Concrete
Tiles
Grass thatched
Asbestos sheets
8. What source of energy do you use for lighting the house at night? (Please tick one box)
Electricity
Paraffin lamp
Gas light
Candle light
Other (Please specify)
………………………………………………
9. What source of energy do you use in the home for cooking? (Please tick one box)
Electricity
Gas
Paraffin
Charcoal
Firewood
Other (Please specify)
………………………………………………
10. How many children are living in your house now? (Please tick one box)
1
2
3
More than 3
11. What birth order is this child?
………………………………………………
12. Who does your child live with? (Tick as many as apply)
Both parents
Mother only
Father only
Grand parents
Other relatives
Other (Please specify)
………………………………………………
13. Who usually looks after your child during the day? (Please tick one box)
Mother at home
Grand parents
Sister/brother
Other relative
Father at home
Friend/neighbour
House maid
Day nursery

4
Section B The following questions are related to your child’s eating habits
1. When your child was a baby did you; (please tick one box)
Only breast-feed?
Only bottle-feed?
Both breast and bottle-feeding was done?
2. Has your child ever used a dummy/pacifier?
Yes No
If yes, has your child’s dummy/pacifier ever been dipped in something sweet to make it taste nice?
Yes No
3. How often does your child take tea, porridge or milk with added sugar? (Please tick one)
Not everyday
Once a day
Twice a day
Three times a day
More than three times a day
4. How often does your child take drinks like soda? (Please tick one box)
Not everyday
Once a day
Twice a day
Three times a day
More than three times a day
5. How often does your child eat sweets (such as toffees, chocolates, and chewing gum?)
Daily
Several times a week
Once a week
Occasionally
Never
6. How often does your child eat sugary foods like cakes, biscuits and ice cream?
Daily
Several times a week
Once a week
Occasionally
Never

5
Section C The following questions are about your attitude towards sugared snacks and foods
Strongly disagree
Disagree
Neither agree or disagree
Agree
Strongly agree
1. As a family we intend to control how often our child takes sugared foods and drinks
2. As a family we would like to control our child’s sugar intake
3. To control how often our child takes sugared snacks and drinks between meals might prevent tooth decay
4. To control how often our child takes sugared snacks and drinks between meals might make them behave well
5. The people in our family feel it is important that we control how often our child takes sugared foods and drinks between meals
6. The people in our family control their intake of sugared foods and drinks between meals
7. The people we know well would feel it was important that we control how often our child takes sugared foods and drinks between meals
8. As a family we feel it is difficult to control how often our child takes sugared foods and drinks between meals

6
Strongly disagree
Disagree
Neither agree or disagree
Agree
Strongly agree
9. If clean water is available ,we as a family would be able to control how often our child takes sugared foods and drinks between meals
10. If time allows, we as a family would be able to control how often our child takes sugared foods and drinks between meals
11. The chances that our child will get tooth decay in the future is great
12. As a family we worry a lot that our child will have tooth decay in the future
13. To control how often our child takes sugared snacks and drinks between meals is good
14. To control how often our child takes sugared snacks and drinks between meals is not wise

7
Section D The following questions are about tooth brushing/tooth cleaning 1. What is used to clean your child’s teeth? (Please tick one only)
Tooth brush
Chewing stick
Cloth
Finger
Other (Please specify)
………………………………………………
2. How old was your child when he/she first started having his or her teeth cleaned/brushed? (Please tick one only)
Under 1 year
1-2years
2-3years
Over 3 years
Teeth are not cleaned / brushed
3. Who usually brushes your child’s teeth? (Please tick as many as apply)
Child
Parent
Someone else
Teeth are not brushed
4. How often are the child’s teeth cleaned / brushed? (Please tick one only)
Never
Less than once a day
Once a day
Twice a day
More than twice a day
5. Has your child started using toothpaste?
Yes No
If yes, what toothpaste does the child use? (Please tick as many as apply)
Toothpaste bought in shops
Ash/Charcoal
Salt
Other (Please specify)
………………………………………………

8
Section E The following questions are related to dental attendance and oral care 1. Before today, have you ever taken your child to a dentist?
Yes No
If yes, did the dentist examine the child?
Yes No
2. Has your child had a toothache in the last year?
Yes No
If yes, how many times? (Please tick one box)
Once
Twice
Three times
Don’t remember
3. What is your usual reason for going to see a dentist? (Please tick one box)
Regularly for check up
Regularly for treatment
Only if I have problems with my teeth or
gums
I do not visit a dentist
4. How often do you take tea, porridge or milk with added sugar? (Please tick one box)
Not everyday
Once a day
Twice a day
Three times a day
More than three times a day
5. How often do you take drinks like soda? (Please tick one box)
Not everyday
Once a day
Twice a day
Three times a day
More than three times a day
6. How often do you eat sweets (such as toffees, chocolates, and chewing gum?)
Daily
Several times a week
Once a week
Occasionally
Never
7. How often do you eat sugary foods like cakes, biscuits and ice cream?
Daily
Several times a week
Once a week
Occasionally
Never
8. How many times do you brush your teeth per day? (Please tick one box)
Once
Twice
Three times
Don’t know
9. Would you like to get more information on oral/dental health?
Yes No

9
Section F The following questions are related to the parent’s / caregiver’s opinion of own oral health, availability to dental treatment, dental attendance and belief in keeping teeth for life 1. How many teeth (natural teeth) do you have in your upper jaw? Please, count them.
………………………………………………
2. How many teeth (natural teeth) do you have in your lower jaw? Please, count them.
………………………………………………
3. How do you consider the present condition of your mouth and teeth, do you consider it very good, good, bad or very bad?
Very good
Good
Bad
Very bad
Neither good nor bad
4. Are you satisfied or dissatisfied with the appearance of your teeth?
Satisfied
Dissatisfied
I don’t know
5. Is it easy for you to get a dentist appointment if you need it?
I can easily get a dental appointment
I can possible get a dental appointment
It is difficult to get a dental appointment
6. How often do you attend to dental examination/treatment?
Regularly, at least once a year
Twice during the last three years
Less often
No visits during the latest three years
Occasionally, only when I have pain
Never
7. Last time you visited a dentist, was that to have: (Please tick one box)
One tooth or teeth extracted
Treatment for pain
Check up/conservative treatment
I have never visited a dentist
8. Is dental treatment costs expensive?
Dental treatment costs are expensive
Dental treatment costs are reasonable
Dental treatment costs are cheep
9. Do you think that you can keep all your teeth for life?
Yes
No
I don’t know
10. How do you think people at your age react to loosing front tooth or teeth?
Very upsetting
Upsetting
Indifferent/not upsetting at all


10
APPENDIX II
District
THE CHILD THE EXAMINER
CHILD’S NAME: EXAMINER’S NAME:
ID NO: _______ ______________ DATE OF BIRTH:____ /____/ _______ GENDER Male Female
NOTES:
DENTITION STATUS Upper right Upper left
55 54 53 52 51 61 62 63 64 65
85 84 83 82 81 71 71 73 74 75 Lower right Lower left
PLAQUE TOOTH CODES NOTES Plaque present on upper anterior teeth Yes No
Sound tooth Decayed Filled with decay Filled no decay Missing due to caries Missing any other reason Trauma/fracture
0 1 2 3 4 5 T


11
APPENDIX III
HOW TO ANSWER THIS QUESTIONNAIRE
This is not a test.
However, it is important that you answer all the questions. The answers you give will
help dentists find ways of improving oral health of young people in Uganda.
Read all instructions carefully and answer each question as best as you can. Together we
will read each question carefully; you will then write your answer before we go on to the
next question. Please answer all the questions as honestly as possible
If you do not understand the instructions or are confused about a particular question, raise
your hand and the supervisor will come and assist you.
The information you provide will be treated confidentially and used for statistical
purposes only. No participant will be identified with the information he/she has given.

12
Section A The first questions are about you and your family. Read each question carefully and tick off the answer that fits you the best. Tick only one answer ( ) for each question.
1. School
……………....................................................
2. Address/Pin code
……………....................................................
3. Are you a boy or a girl?
1 Boy 2 Girl
4. Year of birth.
……………....................................................
5. Where do you live now?
1 Home 2 Hostel
6. What is your religion?
1 Hindu
2 Muslim
3 Christian (catholic protestant)
4 Other (specify)
……………....................................................
7. At what level did your mother finish her full time education?
1 Primary school (P1 – P7)
2 Secondary school (S 1-S6)
3 Degree (University)
4 Master degree (Further studies)
5 Not attended school
6 Other (specify)
……………....................................................
7b. Mother’s work
……………....................................................
8. At what level did your father finish his full time education?
1 Primary school (P1 – P7)
2 Secondary school (S1-S6)
3 Degree (University)
4 Master degree (Further studies)
5 Not attended school
6 Other (specify)
……………....................................................
8b. Father’s work
……………....................................................

13
9. Does any member of your family (with whom you live) own a bicycle?
1 Yes 2 No
10. Does any member of your family (with whom you live) own a motorcycle?
1 Yes 2 No
11. Does any member of your family (with whom you live) own a car?
1 Yes 2 No
12. Does any member of your family (with whom you live) own a television?
1 Yes 2 No
13. Does your family (with whom you live) own a refrigerator (fridge)?
1 Yes 2 No
14. At home from where do you get drinking water?
1. Tap / Pipe / well
2. River / Pond / Stream
3. Other (specify)
……………....................................................
15. Who owns the house your family is living in at the moment?
1 Rented house
2 Owned by the family
3 Owned by the government
4 Owned by the employers
16. How do you consider the economic situation of your family at home?
1 We are among the rich in the area
2 We are not rich but we manage to live well
3 We are neither rich nor poor
4 We struggle with the little we have
5 We are among the poor in the area
17. How many rooms are there in your home?
1 One
2 Two to five
3 Six or more
4 We don’t have a house
18. What is the main source of cooking fuel at home?
1 Gas stove / Electric cooker
2 Kerosene stove
3 Wood
4 Cow dung
5 Charcoal

14
Section B
The following are questions about your mouth and teeth. Please tick ( ) only one answer for each statement.
1. What do you think is the state of your
mouth and teeth?
1 Very good
2 Good
3 Bad
4 Very bad
2. Are you satisfied or dissatisfied with your mouth and teeth?
1 Very satisfied
2 Satisfied
3 Dissatisfied
4 Very dissatisfied
3. How satisfied/dissatisfied are you with the appearance of your teeth?
1 Very satisfied
2 Satisfied
3 Dissatisfied
4 Very dissatisfied
4. Think back on the last 12 months – have
you ever had:
1=yes, 2=no, 3=don’t knowA Bleeding gums? 1 2 3
B Sore mouth? 1 2 3
C Bad breathe? 1 2 3
D Toothache? 1 2 3
E Food stuck in your teeth?
1 2 3
5. Which of the following do you think are important reasons for looking after your teeth?
YES NO
A To look good to other people
B For my teeth to look nice
C To avoid false teeth
D I like my breath to smell fresh
E To avoid toothache
F To avoid dental treatment

15
Section C
The next questions are about hygiene and food habits. Please read each question carefully and answer as honestly as possible. Please tick ( ) only one answer for each question.
1. How often do you brush your teeth?
1 More than one time a day
2 Once a day
3 Several times a week
4 Never
2. Do you usually brush your teeth before breakfast?
1 Yes 2 No
3. Do you usually brush your teeth before going to bed?
1 Yes 2 No
4. Do you usually brush your teeth after mealtime?
1 Yes 2 No
5. After meals do you usually wash your mouth with water?
1 Yes 2 No
6. For cleaning your teeth what do you use?
YES NO
A Finger
B Tooth brush
C Mango leaf
D Chewing stick
E I don’t clean my teeth
7. With what substance do you clean your teeth?
YES NO
A Toothpaste
B Ash / Charcoal
C Salt / Oil
D I don’t use anything
8. What kind of toothpaste do you use (See figure and fill in the blank)?
…………….....................................................
9. During the last three years – how many times have you visited the dentist?
1 Never
2 One time
3 Two to five times
4 Six and above

16
10. If you have attended a dentist during the last three years – what was the main reason?
YES NO
A Toothache
B Wanted a check up
11. If you have not attended a dentist during the last three years – what was the main reason?
1 Dental visit expensive
2 Fear
3 No need
12. Have you ever smoked, chewed or sniffed
any tobacco products?
1 Yes 2 No
Section D
We would like to ask you how often you usually take sugared snacks and drinks. Please tick ( ) only one answer for each question.
1. How often do you eat sweet biscuits?
1 More than one time a day
2 Once a day
3 3-5 times a week
4 Less than three times a week
2. How often do you eat chocolates?
1 More than one time a day
2 Once a day
3 3-5 times a week
4 Less than three times a week
3. How do you usually eat your chocolate?
1 All at once in a short time
2 Slowly in small amounts
3 I do not take sweets
4. During a normal day when do you usually have your chocolate?
1 At meal times
2 Between meal times
3 Both at meals and between meals
4 I do not take sweets

17
5. How often do you have ice sticks?
1 More than one time a day
2 Once a day
3 3-5 times a week
4 Less than three times a week
6. How often do you have soft drinks (pepsi, coco cola etc)?
1 More than one time a day
2 Once a day
3 3-5 times a week
4 Less than three times a week
7. How do you usually drink your soft drinks (pepsi, coca-cola etc)?
1 All at once in a short time
2 Slowly in small amounts
3 I do not take sweets
8. During a normal day when do you usually have soft drinks (pepsi, coca-cola etc.)? 1 At meal times
2 Between meal times
3 Both at meals and between meals
4 I do not take sweets and soft drinks
9. How often do you take sugared tea?
1 Several times a day
2 Once a day
3 3-5 times a week
4 Less than three times a week
10. How often do you take sugared coffee?
1 More than one time a day
2 Once a day
3 3-5 times a week
4 Less than five times a week
11. How often do you eat sweetened fruits/desserts? 1 More than one time a day
2 Once a day
3 3-5 times a day
4 Less than three times a day
12. How often do you take fresh fruits?
1 More than one time a day
2 Once a day
3 3-5 times a week
4 Less than three times a week
13. How often do you take fruit juice?
1 More than one time a day
2 Once a day
3 3-5 times a week
4 Less than three times a week
14. How often do you take sweets like candies, toffees, chewing gums etc? 1 More than one time a day
2 Once a day
3 3-5 times a week
4 Less than three times a week

18
15. How do you usually eat your sweets?
All at once in a short time
Slowly in small amounts
I do not take sweets
16. During a normal day when do you usually have your sweets?
At meal times
Between meal times
Both at meals and between meals
I do not take sweets
Give your comments if any:
……………………………………………………………………………………………………………………………………………………………………………………………………………………………………………………………………………………………………………………………………………………………………………………………
Thank you for your co-operation

19
APPENDIX IV CHILD’S NUMBER -------------------------------------------------
Male Female
DATE OF BIRTH:____ /____/ _______
SCHOOL------------------------------
DENTITION STATUS
Upper right Upper left
18 17 16 15 14 13 12 11 21 22 23 24 25 26 27 28
48 47 46 45 44 43 42 41 31 32 33 34 35 36 37 38
Lower right Lower left
TOOTH CODES NOTES
Sound tooth
Decayed
Filled with decay
Filled no decay
Missing due to caries
Missing any other reason
Fissure sealant
Bridge abutment, special crown veneer
Unerupted crown
Not recorded
Trauma/fracture
0
1
2
3
4
5
6
7
8
9
T
Visible plaque on upper anterior teeth
1 Yes
0 No

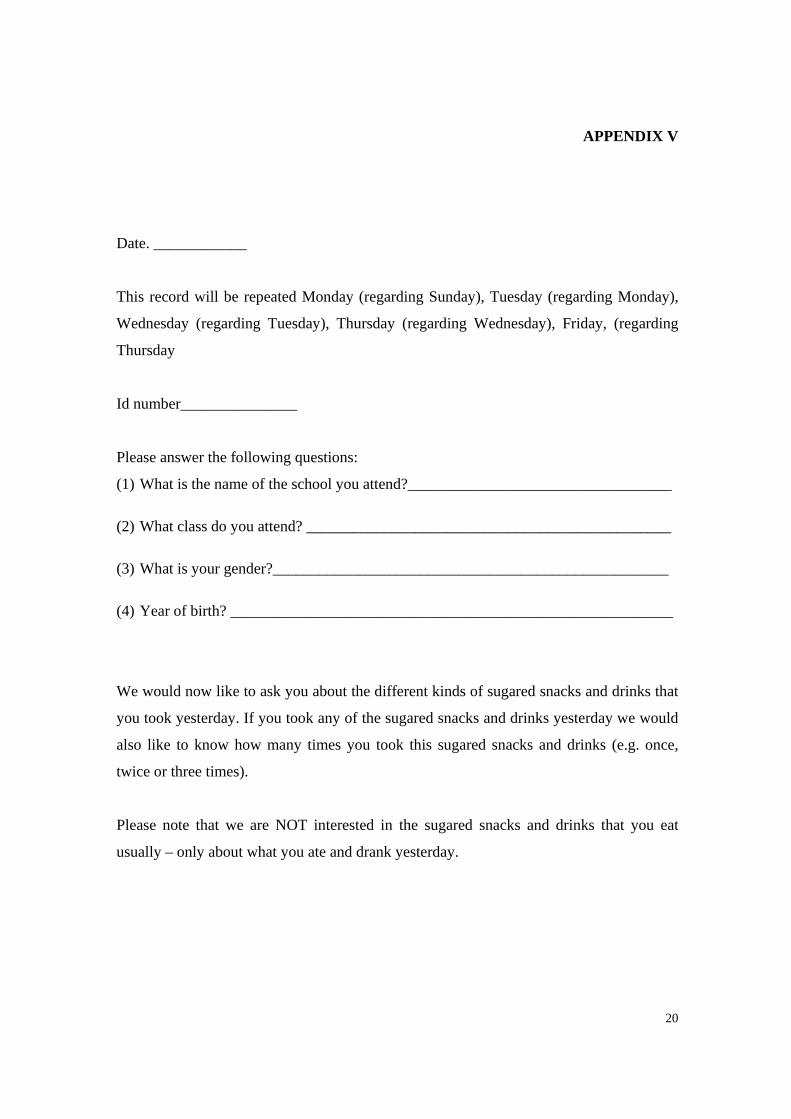
20
APPENDIX V
Date. ____________
This record will be repeated Monday (regarding Sunday), Tuesday (regarding Monday),
Wednesday (regarding Tuesday), Thursday (regarding Wednesday), Friday, (regarding
Thursday
Id number_______________
Please answer the following questions:
(1) What is the name of the school you attend?__________________________________
(2) What class do you attend? _______________________________________________
(3) What is your gender?___________________________________________________
(4) Year of birth? _________________________________________________________
We would now like to ask you about the different kinds of sugared snacks and drinks that
you took yesterday. If you took any of the sugared snacks and drinks yesterday we would
also like to know how many times you took this sugared snacks and drinks (e.g. once,
twice or three times).
Please note that we are NOT interested in the sugared snacks and drinks that you eat
usually – only about what you ate and drank yesterday.
21
1. Did you take sweet biscuits yesterday?
Yes
No
If yes - how many times did you take sweetened biscuits yesterday? __________ number of times
2. Did you take chocolate yesterday?
Yes
No
If yes - how many times did you take chocolate yesterday? _______________ number of times
3. Did you take sweets (e.g. candy, toffee, chewing gum) yesterday?
Yes
No
If yes - how many times did you take sweets yesterday? ________________number of times
4. Did you take ice sticks yesterday?
Yes
No
If yes - how many times did you take ice sticks yesterday? ________________number of times
5. Did you take sweetened deserts yesterday?
Yes
No
If yes - how many times did you take sweetened desert yesterday? ___________number of times
6. Did you take tea with sugar yesterday?
Yes
No
If yes - how many times did you take tea with sugar yesterday? _____________number of times

22
7. Did you take coffee with sugar yesterday?
Yes
No
If yes - how many times did you take coffee with sugar yesterday? __________number of times
8. Did you take milk with sugar yesterday?
Yes
No
If yes - how many times did you take milk with sugar yesterday? ____________number of times
9. Did you take cakes yesterday?
Yes
No
If yes - how many times did you take cakes yesterday? ________________number of times
10. Did you take rice yesterday?
Yes
No
If yes - how many times did you take rice yesterday? ________________number of times
11. Did you take soft drinks yesterday? (e.g. coca cola--------)
Yes
No
If yes - how many times did you take soft drinks yesterday? ________________number of times
12. Did you take juice yesterday? (e.g. ribena, splash, orange juice-------)
Yes
No
If yes - how many times did you take juice yesterday? ________________number of times

23
APPENDIX VI
ERRATA Correction list
We regret that a number of errors with respect to the reference list occurred for the final part of
the discussion in Paper I.
Paper 1: Dental caries experience and its relationship to social and behavioural factors among 3-
5-year-old children in Uganda
Page 337, left column line 14: “sub-Saharan corrected to sub-Saharan African. And right column
line 22: “primary” corrected to “nursery”.
Page 339 Table 1: column 4 line 4 “13” corrected to “113”
Page 342, left column, line 17: “ this is the first” corrected to this is the first study
Page 343, left column, line 22: [20,20,32,35,37, 41] corrected to [32,38]
Page 343, left column, line 27: [20,20,32,34] corrected to [20,32,34,39,40]
Page 343, left column, line 32: [17,17,29,31,37,40] corrected to [31]
Page 343, left column, line 39: [38,39,41,42] corrected to [39-42]
Page 343, right column. line 16: [43,44,44,45] corrected to [43,44,45]
Page 343, right column, line 50: [46,47,47,48] corrected to [46,47,48]
Page 344, left column, line 4: [48,49] corrected to [49]
Page 344, right column, line 8: [39,42,46,47] corrected to [39,42]
Ref 15: Tiromwe corrected to Tirwomwe
Ref 17: Harris R, Nicoll AD, Adair PM, Pine CM. Predictors of dental caries in young children: a
qualitative systematic review of the literature. Community dental health 2003 corrected to Harris
R, Nicoll AD, Adair PM, Pine CM. Risk factors of dental caries in young children: a systematic
review of the literature. Community Dental Health 2004; 21: 71-85

24
Ref 49: Bhayat Cleaton-Jones P corrected to Bhayat A, Cleaton-Jones P
Paper III: Examining intention to control pre-school children’s sugar snacking: a study of
careers in Uganda.
Page 11: right column, paragraph 3, line 15; “primary” corrected to “nursery”.
Page 15: Table 4 heading line 2- “caries-free and level of education” corrected to “caries –free and
low level of education”.