heights and weights of scottish schoolchildren
TRANSCRIPT

Brit. J. prev. soc. Med. (1956), 10, 1-14
HEIGHTS AND WEIGHTS OF SCOTTISH SCHOOLCHILDRENBY
J. A. GRANT KEDDIEFormerly Medical Officer (School Health), Department of Health for Scotland
The series of investigations- which form thesubject of this account deal on a broad basis withquestions relating to the height and weight ofchildren attending Scottish education authorityschools.
I. OBJECT AND SCOPE OF INQUIRY
Attention is given solely to cross-sectional ordistance studies, that is to 'say, to the measurementsat various ages of large numbers of children ofdifferent generations or of different geographical-industrial groups.* Concern is with children aged5, 9, 13, and, in certain instances, 16 years, thesebeing the ages at which children attending educationauthority schools undergo systematic medicalexamination in Scotland.The material for presentation and analysis is
divisible into four groups:
(1) Average heights and weights of children in Edin-burgh and Glasgow during the past 40 years,1913-14 to 1953-54.
(2) Average heights and weights of children in three ofScotland's main cities (Edinburgh, Glasgow, andDundee) and one of its most populous counties(Ayrshire), the four areas together forming arepresentative cross-section of the school popula-tion in the central industrial belt, for the six schoolsessions, 194849 to 1953-54.
(3) Average heights and weights of Scottish children ona regional basis, for the sessions 1951-52 and1952-53.
(4) Average heights and weights of children of fourhighly industrial large burghs (Dumbarton, Fal-kirk, Kilmarnock, and Kirkcaldy) and four less
* Nearing completion is a further series of investigations whichrelate both to the cross-sectional studies, in respect of school childrenof different socio-econorqic groups, and to longitudinal or velocitystudies.
industrial large burghs (Perth, Stirling, Ayr, andDunfermline), 1952-53.
II. DETAILS OF INVESTIGATIONS
(1) EDINBURGH AND GLAsGow: MEAN HEIGHTS ANDWEIGHTS OF CHILDREN ATTENDING EDUCATIONAUTHORITY SCHOOLS EXAMINED AT SYSTEMATICMEDICAL INSPECTIONS AT 5, 9, AND 13 YEARS, ATINTERVALS FROM 1913-14 TO 1953-54.
In Scotland, relatively few education authoritiescan provide, from the early years of the school healthservice up to the present time, anything approachinga complete record of the average heights and weightsof children aged 5, 9, and 13 years. This is due inpart to the variation that existed from area to area,before session 1938-39, in the age groups selected forsystematic medical examination. Glasgow is for-tunately placed in this respect, but this circumstancehas not been without disadvantage, for, as a conse-quence of the frequent quotation of the relatively lowaverage heights and weights for Glasgow school-children of 30 or 40 years ago and the relatively highincreases in the average measurements of thechildren of that city in the past 20 years, there hasbeen a tendency to accept these increases as typicalof those of Scottish schoolchildren as a whole.
It is certain that there has been a general increasein the average heights and weights of schoolchildrenof the various age groups (dealt with at systematicmedical examinations) throughout Scotland duringthe past two decades, but, in the absence of reason-ably complete records of past heights and weightsfor a representative cross-section of the school popu-lation, the precise extent of the increases for Scottishschoolchildren as a whole during the period inquestion must remain a matter for conjecture.

J. A. GRANT KEDDIE
Even the somewhat less marked increases in theaverage measurements of children attending Edin-burgh education authority schools cannot beaccepted as representative of those for Scottishschoolchildren as a whole, but the particulars forEdinburgh and Glasgow together may justifiably beregarded as illustrating such increases in mostpopulous industrial centres during recent decades.Appendix Table A, which deals with the average
heights and weights of children aged 5, 9, and 13years attending education authority schools inEdinburgh and Glasgow, shows the extent to whichthe average measurements have increased during thecourse of the past 40 years in these two cities. Thechoice of school sessions at irregular intervals isoccasioned by the non-existence of height and weightrecords for Edinburgh schoolchildren during therecent war and by the fact that in that city, for aperiod of some years, not only was the systematicmedical examination of the 9-year-olds discontinuedbut the examination of the older children was post-poned from age 12 to age 13.
In Appendix Table A the actual average measure-ments of the schoolchildren of both Edinburgh andGlasgow for sessions 1953-54 and 1949-50 (and for1937-38 as well in the case of Glasgow) have beenadjusted to the uniform ages of 5-4A, 9A5 , and 13A5years, use being made of the factors (that is, theaverage rates of increase in height and weight permonth of age) employed in Glasgow in recent yearsin the adjustment of the average measurements ofthe local children to these particular uniform ages.As to the earlier sessions, the average ages when thechildren were measured approximated closely to theuniform ages mentioned above.
Two points are worthy of note:
(a) The average heights and weights for 1953-54 forboys and girls of all these age groups in both Edinburghand Glasgow are greater than the corresponding averagesfor 1913-14, and all the differences are statisticallysignificant. The actual mean differences are set out inTable I.
At the end of the first world war and in the schoolsessions immediately thereafter, it was found that mostof the average heights and. weights fell short of thoserecorded in session 1913-14. By 1931-32 a few of theaverage heights and weights given in Appendix Table Ahad shown signicant increases over those for 1913-14,but it is during the past 20 years that the increase inaverage measurements has steadily risen to a levelapproaching that for 1953-54.
Special comment is desirable concerning the average
* In this article, instances where the amount by which an observeddifference exceeds its standard error is not stated with precision, theuse of the word "significant" implies that the difference between twoproportions or two averages is at least twice its standard error.
TABLE ICITIES OF EDINBURGH AND GLASGOW EDUCATION
AUTHORITY SCHOOLCHILDRENINCREASE IN MEAN HEIGHTS AND WEIGHTS BETWEEN
1913-14 AND 1953-54
Age (yrs) 5 9 13
Edin- Glas- Edin- Glas- Edin- Glas-City burgh gow burgh gow burgh gow
Increase inMean Height 1*29 1*93 2*92 4*00 3 *57 3*91
BoysIncrease inMean Weight 2*07 4-35 7*45 8*36 14-37 14-53
(lb.)
Increase inMean Height 1*04 1*64 2*30 2*53 0*85 3*18(in.)
GirlsIncrease inMean Weight 1 * 31 3 69 7 19 6 98 12 68 16 41
(lb.)
height of 13-year-old Edinburgh schoolgirls. This was59 in. in 1913-14, but the average height from 1909-10to 1926-27 was regularly between 56 and 57 in. (1912-13,with 58 4 in., and 1913-14, with 59 in., being excep-tional), and it was not until 1927-28 that an averageheight of 58 e 5 in. was reached. With this point in mind,therefore, it may be stated in general terms that between1913-14 and 1953-54 the following increases took placein the average measurements of Edinburgh and Glasgowschoolchildren (Table II).
TABLE IICITIES OF EDINBURGH AND GLASGOW EDUCATION
AUTHORITY SCHOOLCHILDRENAPPROXIMATE GAINS IN AVERAGE MEASUREMENTS
BETWEEN 1913-14 AND 1953-54
Boys GirlsCity Age
(yrs) Height Weight Height Weight(in.) (lb.) (in.) (lb.)
5 1* 2 1 1*Edinburgh 9 Nearly 3 7* 21 7*
13 3* 14* Nearly 3 12i5 Nearly 2 4* 1* 3*
Glasgow 9 4 8* 2* 713 Nearly 4 14* Nearly 3* 16*
(b) As may be seen from Appendix Table A, theaverage heights and weights of Edinburgh schoolchildrenof the various age groups in 1913-14 were all greater thanthose of the Glasgow schoolchildren of correspondingage, but as the years have passed there has been aprogressive closure of the "gaps" in most instances.Thus, for 1953-54, the average measurements of theEdinburgh children are greater:
For boys:by 0 36 in. and 0 62 lb. at 5 years,by 0-32 in. and 0-89 lb. at 9 years,by 0 56 in. and 2-34 lb. at 13 years;
For girls:by0 24 in. and 0 21 lb. at 5 years,by0 17 in. and 1I81 lb. at9years,by 0 37 in. and 1-57 lb. at 13 years.
2
HEIGHTS AND WEIGHTS OF SCOTTISH SCHOOLCHILDREN
Despite the progressive closure of the "gaps" betweenthe average measurements of the children of the twocities, as many as eleven of the twelve differences are stillof statistical significance (the difference being at leastthree times its respective standard error in ten instances,and 2 - 2 times its standard error in the remaining instance,that relating to the height of 9-year-old girls); thedifference which is not of statistical significance is thatin respect of the weight of 5-year-old girls.
It is not without interest to find, on studying themeasurements of the Glasgow schoolchildren for thepast 15 years, that the proportionate increases inaverage height and weight between 5 and 9 years,9 and 13 years, and 5 and 13 years, are more or lessidentical for children born in 1925 and in subsequentyears up to and including 1940 (these increases beinggreater, of course, for girls than for boys between9 and 13 years, and 5 and 13 years.) These propor-tionate increases are set out in Table III:
TABLE IIICITY OF GLASGOW
CHILDREN BORN IN 1925 AND IN SUBSEQUENT YEARSPERCENTAGE INCREASES IN AVERAGE MEASUREMENTS
Period (yrs)
5- 9 21 5 47-0 21-0 48-09-13 15-5 46-0 17-5 58 05-13 40-0 115-0 43-0 135-0
This position arises directly from the fact that forGlasgow schoolchildren in the past 15 years, as forLondon schoolchildren during the period 1938-49(Daley, 1950), the change in weight has beenproportionate to the change in height, with theresult that the ratio of weight to height has remainedmore or less steady. The report on the Londoninvestigations summarized the position thus:
The fact that bone and flesh have kept pace with eachother, despite substantial changes in the absolutevalues of height and weight, suggests that with im-proved nutrition in schoolchildren, nature has main-tained her own balance; that children of to-day arenot merely heavier or merely taller than their parentswere, but are members of a generation altogether ofgreater physique.In the report on the London investigation, use
was made of the metric system in calculating theweight to height ratio, and for 1938 and 1949 alike,the ratio of average height (cm.) to average weight(kg.) was as follows:
For boys:0 17 at 5 years,021 at 9 years,0-27 at 13 years.
For girls:0 17 at 5 years,0-21 at 9 years,0-28 at 13 years.
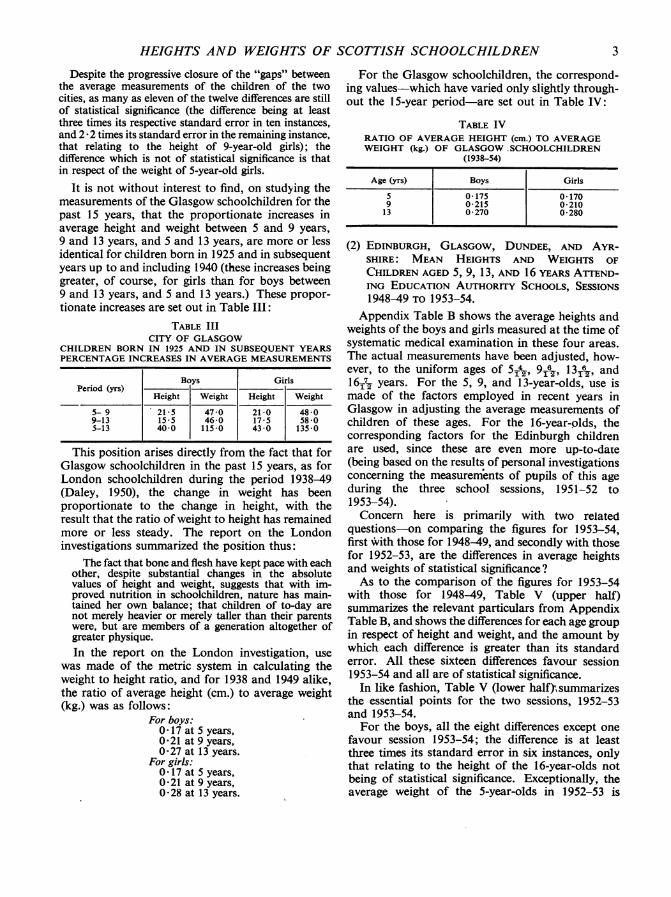
For the Glasgow schoolchildren, the correspond-ing values-which have varied only slightly through-out the 15-year period-are set out in Table IV:
TABLE IVRATIO OF AVERAGE HEIGHT (cm.) TO AVERAGEWEIGHT (kg.) OF GLASGOW .SCHOOLCHILDREN
(1938-54)
Age (yrs) Boys Girls
5 0-175 0-1709 0-215 0-21013 0-270 0-280
(2) EDINBURGH, GLASGOW, DUNDEE, AND AYR-SHIRE: MEAN HEIGHTS AND WEIGHTS OFCHILDREN AGED 5, 9, 13, AND 16 YEARs ATTEND-ING EDUCATION AUTHORrIY SCHOOLS, SESSIONS1948-49 TO 1953-54.
Appendix Table B shows the average heights andweights of the boys and girls measured at the time Qfsystematic medical examination in these four areas.The actual measurements have been adjusted, how-ever, to the uniform ages of 5-4A, 9 1-, 13-16a, and16 7 years. For the 5, 9, and 13-year-olds, use ismade of the factors employed in recent years inGlasgow in adjusting the average measurements ofchildren of these ages. For the 16-year-olds, thecorresponding factors for the Edinburgh childrenare used, since these are even more up-to-date(being based on the results of personal investigationsconcerning the measurements of pupils of this ageduring the three school sessions, 1951-52 to1953-54).Concern here is primarily with two related
questions-on comparing the figures for 1953-54,first with those for 1948-49, and secondly with thosefor 1952-53, are the differences in average heightsand weights of statistical significance ?As to the comparison of the figures for 1953-54
with those for 1948-49, Table V (upper half)summarizes the relevant particulars from AppendixTable B, and shows the differences for each age groupin respect of height and weight, and the amount bywhich each difference is greater than its standarderror. All these sixteen differences favour session1953-54 and all are of statistical significance.In like fashion, Table V (lower halfy,summarizes
the essential points for the two sessions, 1952-53and 1953-54.For the boys, all the eight differences except one
favour session 1953-54; the difference is at leastthree times its standard error in six instances, onlythat relating to the height of the 16-year-olds notbeing of statistical significance. Exceptionally, theaverage weight of the 5-year-olds in 1952-53 is
3

J. A. GRANT KEDDIE
TABLE VCITIES OF EDINBURGH, GLASGOW, AND DUNDEE, AND COUNTY OF AYRSHIRE
MEAN HEIGHTS AND WEIGHTS AT 5'/1,, 9 6/12. 13'/,,, AND 167/,2 YRSCOMPARISON OF FIGURES FOR 1953-54 WITH THOSE FOR 1948-49 AND 1952-53
Age (yrs)
Sex Session 5 9 13 16
Height Weight Height Weight Height Weight Height Weight(in.) (lb.) (in.) (lb.) (in.) (lb.) (in.) (lb.)
1948-49 42-65 42-36 51-69 63-49 59 00 90-01 66-86 130 60
1953-54 42-73 42-54 51-82 64-09 59-56 93-37 67*64 134-48Boys
Difference 0-08 0-18 0-13 0*60 056 3-36 0-78 3-88t= 3-9 3-6 4-2 5-6 12-8 15-1 7-3 5S7
1948-49 42 19 40-69 51 04 60-72 59-35 94-22 63-49 121-24
1953-54 42*48 41-10 51*34 62-45 59-96 97*37 63*63 122-81Girls
Difference 0-29 0-41 0-30 1-73 0-61 315 0-14 1-57t= 13-8 7-8 9-5 14-4 16-6 14-7 4 5 2-1
1952-53 42-65 42-61 51-55 63*29 59-40 92*68 67-55 132-39
1953-54 42*73 42*54 51-82 64*09 59-56 93-37 67-64 134-48Boys
Difference 0-08 0-07 0-27 0-80 0-16 0-69 0*09 2-09t= 4-1 1-4 8-9 7 5 3-7 3-1 0-8 3-1
1952-53 42-34 40-96 51-30 61-60 59-84 96-72 63-64 122-70
1953-54 42-48 41-10 51-34 62-45 59-96 97-37 63-63 122-81Girls
Difference 0-14 0-14 0-04 0-85 0-12 0-65 0-01 0-11t= 7-0 2-8 1.1 7-1 3-3 3-0 0-1 1-5
above that of those in 1953-54 but the difference isnot statistically significant.For the girls, seven of the eight differences favour
1953-54; five ade significant, the difference being atleast three times its standard error in four instances,and 2-8 times in the fifth, and two relating to theheight of the 9 and 16-year-olds are not significant.The difference in respect of the weight of the16-year-olds (which alone favours 1952-53) is not ofstatistical significance.These results, in conjunction with those arising
from the comparison of the figures for 1953-54with those for 1948-49, show unmistakably acontinuance, among children of school age, of theupward trend in average heights and weights thathas been a noteworthy feature of the past twodecades.
(3) REGIONAL ANALYSIS: MEAN HEIGHTS ANDWEIGHTS OF CHILDREN AGED 5, 9, 13, AND16 YEARS, ATTENDING SCOTTISH EDUCATIONAUTHORrrY SCHOOLS, SESSIONS 1951-52 AND1952-53.A few years ago, a regional analysis of the average
heights and weights of the children of the age groupscustomarily dealt with at systematic medical exami-nations gave somewhat anomalous results. This was
due, it was believed, to the failure in certain areas,in the years immediately after the end of the recentwar, to provide a proper system of checking theaccuracy of the weighing machines and to makeadequate provision for servicing them. Steps havebeen taken, however, by the authorities concerned toreplace outmoded machines and to provide a regularsystem of checking and servicing, so that the resultscan now be accepted with a reasonable degree ofassurance. This is so, despite the fact that, thoughthe common practice, as in Edinburgh and Glasgow,is for the children to be weighed without shoes andwearing underpants (boys) or vests and knickers(girls), the children in certain areas wear slightlymore clothing. Such a variation, however, does notinvalidate the results for the country as a whole or
for any of the six regions into which Scotland isdivided for the purpose of the present analysis. Theusual practice is to record the height to the nearestquarter of an inch, and the weight to the nearestquarter (or half) pound, using a steelyard weighingmachine and fixed height-measuring equipment(in the absence of a height-measuring attachment tothe machine). The height is taken with the childstanding erect, back to the measuring rod, with thefeet together and the weight on the heels and noton the toes or the outside of the feet.
4

HEIGHTS AND WEIGHTS OF SCOTTISH SCHOOLCHILDREN
A geographical-industrial grouping as beenadopted for the regional analysis of the averageheights and weights of the children aged 5, 9, 13, and16 years. The six broad groups are as follows:
Region 1.-Highlands, comprising the northern andwestern counties, Aberdeen (excluding the city ofAberdeen), Argyll, Bute, Caithness, Inverness, Moray,Nairn, Orkney, Perth (and Kinross), Ross and Cromarty,Sutherland, and Zetland. Half of these are mainly ruralareas, and the other half mainly consist of heath andmoor.
Region 2.-Eastern Counties, comprising the countiesof Angus (excluding Dundee), Banff, Clackmannan, Fife,and Kincardine. This region is predominantly rural, buthas extensive fishing interests and, in the south-west ofFife, a considerable industrial and coal-mining popu-lation.
Region 3.-Cities of Edinburgh, Aberdeen, and Dundee.These urban districts are of a less industrial and moreresidential character than Region 6.
Region 4.-Southern Counties, comprising the lowlandcounties of Ayr, Berwick, Dumfries, East Lothian,Kirkcudbright, Midlothian (excluding Edinburgh),Peebles, Roxburgh, Selkirk, and Wigtown. Mainlyrural, the region also contains many centres of lightindustry and, in Ayr, East Lothian, and Midlothian,extensive coal-mining interests.
Region 5.- Western and Central Industrial Areas, com-prising the counties of Dunbarton, Lanark (excludingGlasgow), Renfrew, Stirling, and West Lothian. Pri-marily industrial-the heavy industries predominating,on balance-the region also contains a number ofimportant coal-mining centres, and, as in Lanark andStirling, extensive agricultural districts.
Region 6.-City of Glasgow. This is the most highlyindustrial of the four main cities of Scotland.
This grouping is on lines akin to those followed byMartin (1949) in his analysis of the medical examina-tions of 20-year-old Scotsmen registered under theMilitary Training Act, 1939, but there are a fewimportant differences. Regions 1, 2, and 3 are moreor less identical in both instances, but in the presentarticle the region "Glasgow, Motherwell, Paisley"(representative of the more highly industrializedtowns) is replaced by "Region 6, City of Glasgow"and "Region 7, Western and Central IndustrialArea"; the counties of Dunbarton, Lanark,Stirling, and West Lothian are thus separated fromthe "Southern Counties" of the M.R.C. Memoran-dum.
In the present analysis a distinction is drawnbetween the children aged 5, 9, and 13 years on the
one hand, and those aged 16 years on the other.Children aged 5, 9, and 13 years attending educationauthority schools constitute a high proportion of allthe children of these age groups in each of the sixregions (those at fee-paying schools independent ofeducation authorities, for example, forming a verysmall proportion of the total), but the 16-year-oldpupils at education authority schools do not form inany of the regions a representative cross-section ofthe children of that age group in the community.
Personal study of the particulars given on largenumbers of medical record cards shows clearly thatabout two-thirds of the fathers of pupils whocontinue in attendance at secondary schools to theage of 16 years and beyond are in Social Classes I orII or in the more highly-skilled occupations of SocialClass III.* This aspect of the subject needs noemphasis, as it has recently been dealt with at lengthby the Scottish Mental Survey Committee (ScottishCouncil for Research in Education, 1953) and theCentral Advisory Council for Education (Ministryof Education, 1954). The essential point, for presentpurposes, is that, in arranging the six regions indescending order of average heights and weights, ourprime concern is with the measurements of the5, 9, and 13-year-olds.
Appendix Tables C and D show the averageheights and weights of children of these three agegroups for the two sessions 1951-52 and 1952-53,for each of the six regions as well as for Scotland asa whole. The actual average measurements havebeen adjusted to the uniform ages of 5 4 , 9 6, and13- years-the most convenient and appropriatein this instance-by use of the factors derived from astudy of the measurements of children attendingeducation authority schools in Edinburgh insession 1952253.
The numbers dealt with are large, those for boysin Scotland as a whole totalling 44,936 at 5 years,32,931 at 9 years, and 30,798 at 13 years in 1952-53,the corresponding totals for girls being 43,030,31,828, and 30,108, respectively. In the six regions,the totals range for boys from 5,018 to 11,901 at5 years, from 3,199 to 9,725 at 9 years, and from3,161 to 8,454 at 13 years; the corresponding figuresfor girls are of like magnitude, and for them as forthe boys, the lowest regional total for each agegroup is that for the Eastern Counties (Region 2),and the highest that for the Western and CentralIndustrial Area (Region 5).
* The five social classes are those into which occupations arecustomarily grouped in vital statistical investigations (GeneralRegister Office, 1951).
5

TABLE VISIX SCOTTISH REGIONS ARRANGED IN DESCENDING ORDER OF MEAN HEIGHTS AND WEIGHTS
Age (yrs) .. .. 5 9 13
Measurement .. .. Height Weight Height Weight Height WeightSession .1951-2 1952-3 1951-2 1952-3 1951-2 1952-3 1951-2 1952-3 1951-2 1952-3 1951-2 1952-3
1 1 1 1 4 1 1 1 4 2 1 14 2 4 4 1 4 4 4 1 4 4 45 4 5 5 5 5 2 2 2 1 2 3
Boys .. .. 2 5 3 2 2 2 5 5 3 3 5 53 3 2 3 3 6 3 3 5 5 3 26 6 6 6 6 3 6 6 6 6 6 6
4 1 1 1 1 1 1 1 2 4 4 12 4 4 4 4 4 2 4 4 1 1 41 5 2 2 2 2 4 2 1 5 2 3
Girls . . 5 2 5 5 5 5 3 3 3 3 3 23 3 3 3 3 3 5 5 5 2 5 56 6 6 6 6 6 6 6 6 6 6 6
In Table VI the regions are arranged in descendingorder of average height and weight.
For boys, Region 1 (Highlands) and Region 4(Southern Counties)-commonly in that order-almost invariably occupy the two top positions, andhave the highest average values for both height andweight. Region 6 (Glasgow) occupies the lowestpositions for height, with one exception, and weight,and Region 3 (Edinburgh, Aberdeen, and Dundee)most commonly occupies the second lowest positionfor both height and weight. Region 2 (EasternCounties) and Region 5 (Western and CentralIndustrial Region) are intermediate, Region 2 beingslightly superior to Region 5 in respect of height,while in weight, on balance, there is equality.For girls, the pattern is practically identical.
Regions 1 and 4 almost invariably have the highestaverage heights and weights-with Region 1 usuallytop, Region 6 invariably bottom, and Region 3usually second to bottom. Here also Regions 2and 5 occupy intermediate positions, with Region 2usually above Region 5 in both height and weight.
Moreover, for each of the two sessions and forboys and girls alike, the order of the average weightsof a particular age group is nearly always eitheridentical with, or very close to, the order of theaverage heights.
As to the significance or otherwise of thesevarious differences in average height and averageweight, it is proposed to make seven sets ofcomparisons:
(a) Comparison ofAll-Scotland Mean Heights andWeights, 1951-52 and 1952-53.-Table VII sum-marizes the average heights and weights for Scotlandas a whole for each of the two sessions, and showsthe differences and the amount by which eachexceeds its standard error.
TABLE VIISCOTTISH EDUCATION AUTHORITY SCHOOLSMEAN HEIGHTS AND WEIGHTS OF CHILDREN
AGED 5 /1s, 9,/s,, AND 13'/,, YEARSALL-SCOTLAND MEANS, 1951-52 AND 1952-53
Age (yrs) 5 9 13
Height Weight Height Weight Height WeightMeasurement (in.) (lb.) (in.) (lb.) (in.) (lb.)
1951-52 42-93 43-13 5198 64-14 59 97 92-87
1952-53 43 00 43*12 51 93 64-27 59*52 93*52Boys.
Difference 007 001 005 013 005 0*65t= 57 0 3 2-8 1.9 1*8 4-7
1951-52 42 53 41*47 51*48 61*66 60*12 97-67
1952-53 42*61 41*50 51*54 62-04 59*99 97*53Girls _
Difference 008 003 006 038 013 014t= 6-2 0 9 2-7 5 0 55 1-0
Three of the six differences for boys are significant:(i) the increase in average height at 5 years,(ii) the increase in average weight at 13 years,(iii) the fall in average height at 9 years.
Four of the six differences for girls are significant:(i) the increase in average height at 5 years,(ii) the increase in average height at 9 years,(iii) the fall in average height at 13 years,(iv) the increase in average weight at 9 years.
These facts, although in respect of two consecutiveyears only, provide additional evidence, on balance,that the upward trend in the average heights andweights of schoolchildren that has characterized thepast two decades is continuing.
(b) Comparison of Mean Heights and Weights forIndividual Regions with thosefor Scotland as a Whole,1951-52 and 1952-53.-As an indication of theextent to which some of the average heights andweights for the individual regions differ from those
6 J. A. GRANT KEDDIE

HEIGHTS AND WEIGHTS OF SCOTTISH SCHOOLCHILDREN
for Scotland as a whole, the range for each age groupfor 1952-53 is sho-wn in Table VIII.
TABLE VIIISCOTTISH EDUCATION AUTHORITY SCHOOLCHILDRENREGIONAL ANALYSIS OF MEAN HEIGHTS AND WEIGHTSRANGEOF MEASUREMENTS AT 5'/12, 9 0/12, AND 13 6/12 YEARS
1952-53
Boys Girls
Age (yrs) Height Weight Height Weight(in.) (lb.) (in.) (lb.)
5 42*48-4353 42 07-44*59 42*16-4309 40*54-43 07
9 51-26-52-51 62 59-66 75 5090-52 47 60 73-64 44
13 5915-60-21 91*11-98-21 59-51-60-56 95-20-100-37
The results for 1951-52 and 1952-53 are remark-ably consistent for both girls and boys, for Regions 1and 4 on the one hand, and Regions 6 and 3. on theother. There is justification for the conclusion thatat 5, 9, and 13 years the average measurements of thechildren in Regions 1 and 4 are above the correspond-ing all-Scotland averages, the differences for boysbeing invariably, and those for girls almost in-variably, of statistical significance:
Regions I and 4:Boys: height, t = 4-5 or more; weight, t = 3 5 or
more.Girls: height, t = 5 5 or more as a rule; weight,
t = 7-3 or more.
Moreover, at those ages, the average measure-ments of the children in Regions 6 and 3 are belowthe corresponding all-Scotland averages, the dif-ferences for Region 6 being invariably, and those forRegion 3 almost invariably, of statistical significance:
Region 6:Boys: height, t = 12 or more; weight, t = 9 9 or
more.Girls: height, t = 9 7 or more; weight, t = 10 or
more.
(c) Comparison of Mean Heights and Weights forRegion I (Highlands) with those for Region 4(Southern Counties), 1951-52 and 1952-53.-Ananalysis, in terms of the significance or otherwise ofthe differences between the average heights andweights of the children of Region 1 and those ofRegion 4, at 5, 9, and 13 years, gives the followingresults:
Boys.-For the two sessions as a whole, there is ahigh proportion of differences which are not ofstatistical significance; the only significant differencescommon to both sessions are those at 5 years in respectof height (t = 3 - 2 and 5 4), which favour Region 1 ineach instance.
Girls.-There are four significant differences com-mon to both sessions. For Region 1 there are signi-ficantly higher averages at 5 years in respect of weight(t = 13 and 11), and at 9 years in respect of both height(t = 3 and 7 - 8) and weight (t = 6 * 3 and 5 - 1). Region4 has significantly higher averages at 13 years inrespect of height (t = 3 - 6 and 7 - 9).
(d) Comparison of Mean Heights and Weights forRegions 1 and 4 with those for Other Regions,1951-52 and 1952-53.-Attention is here confinedto two points. First, there is a comparison, for eachage group, of the average measurements forRegions 1 and 4 with the corresponding averages forthe region providing the next highest average.Secondly, in the exceptional cases in which theaverage of the third region is higher than that ofRegion 1 and/or Region 4, there is the question ofwhether or not the difference is significant.For boys and girls alike it is found that, when
Region 1 and Region 4 present the highest and thesecond highest averages (as is usually the case, inrespect of both height and weight), these averagesalmost invariably exceed to a significant extent thenext highest corresponding average; when, excep-tionally, the average for a region other than Region 1or Region 4 is the highest for a particular age group,that average is most commonly not significantlygreater than the corresponding averages for Regions1 and 4.
(e) Comparison of Mean Heights and Weights forRegion 6 (Glasgow) with those for Region 3 (Edin-burgh, Aberdeen, and Dundee), 1951-52 and 1952-53.-The results of this analysis are as follows:
Height.-Over the two sessions as a whole, there aretwo instances only in which the averages for Region 6exceed those for Region 3, namely, the averages in1952-53 for boys aged 5 years (although the differenceis not of statistical significance) and 9 years (t = 5 -2).
In the remaining four instances among boys, and inall six instances among girls, the average heights forRegion 6 are significantly below those for Region 3(t = 4 or more, except in one case).
Weight.-For both boys and girls, the averages forRegion 6, for all three age groups in both sessions, aresignificantly below the corresponding averages forRegion 3 (t = 4 *7 or more).
(f) Comparison of Regions in Descending Order ofMean Heights and Weights with the Regional Orderof Means for Young Adult Scotsmen examined under'the Military Training Act, 1939.-Brief reference hasalready been made to the Medical ResearchCouncil's memorandum (Martin, 1949) analysingthe findings concerning 91,513 men aged 20 years(9,620 of them Scotsmen) who registered under theMilitary Training Act, 1939. The analysis was
7

J. A. GRANT KEDDIE
restricted to those examined before the outbreak ofwar, and despite the absence of farm workers, thegroup represented not unfairly the young adult malepopulation of the country at that time.
Table IX shows the main findings for the 9,62020-year-old Scotsmen, the regions being arranged indescending order of average heights and weights.
TABLE IXYOUNG ADULT SCOTSMEN REGISTERED UNDER
MILITARY TRAINING ACT, 1939MEAN HEIGHTS AND WEIGHTS, BY REGION
- Height (in.) Weight (lb.)
Approx. Mean MeanRegion No. Height ±S.E. S.D. Weight ±S.E. S.D.
Examined
Highlands 510 67-8 ±0-11 2-53 142-3 +0-75 17-03
EasternCounties 1,070 673 ±008 2 49 138*3 ±0 48 15I79Edinburgh,Aberdeen, 1,570 67 1 ±0 07 2-61 135-9 ±0-38 15-08and Dundee
SouthernCounties 2,620 671 005 2-55 135-7 ±0-31 15I68
Glasgow,Motherwell, 3,850 66-7 +0-04 2-65 1331 +0-25 15-55and Paisley
AllScotland 9,620 67-0 ±0-03 2-61 1353 ±0 16 15-91
As Martin pointed out, the highlanders were onthe average superior in physical measurements, theaverage height ranging from 0-4 to 1 -1 in. and theaverage weight from 4 0 to 9 2 lb. above those ofmen from the other regions; men from the industrialcentres of Glasgow, Motherwell, and Paisley, on theother hand, were inferior to those from the otherregions in average height and weight, being, forexample, 0-6 in. shorter and slightly more than2j lb. lighter than those from the two regions withthe next smallest averages (namely, the SouthernCounties-which in that investigation includedseveral counties with highly industrial centres-andthe cities of Edinburgh, Aberdeen, and Dundee).The results of the particular part of the present
investigation that is used for comparison with theabove tally closely with the latter in respect of theregional order of average heights and weights.Region 1 (Highlands) with few exceptions, leads forboth boys and girls in respect of height and weightat 5, 9, and 13 years, Region 4 (Southern Counties),another predominantly rural region, coming a closesecond. The amount by which the averages forRegion 1 (Highlands) exceed the next highestaverages is significant in nearly all instances (apartfrom those for Region 4). Similarly, the averageheights and weights of children attending education
authority schools in Region 6 (Glasgow) are signi-ficantly less than the corresponding figures forRegion 3 (Edinburgh, Aberdeen, and Dundee),which has the next lowest averages.
(g) Comparison of Mean Heights and Weights ofChildren aged 16 years attending Scottish EducationAuthority Secoijdary 'Schools in Individual Regionswith those for Scotland as a Whole, 1951-52 and1952-53.-The total numbers of 16-year-old boysmeasured at systematic medical examinations inScotland in sessions 1951-52 and 1952-53 were2,697 and 2,902, the corresponding totals for thegirls being 2,527 and 2,687. In Appendix Table E,the actual average measurements have been ad-justed to the uniform age of 16 7 years, the factorsemployed being those based on the measurements of16-year-old pupils attending Edinburgh educationauthority secondary schools during the threesessions 1951-52 to 1953-54.Appendix Table E shows that the average mea-
surements of the 16-year-olds in Scotland were:Boys:
67-59 in. and 135-67 lb. (1951-52);67-70 in. and 134-91 lb. (1952-53).
Girls:63-66 in. and 123-64 lb. (1951-52);63 - 66 in. and 123 - 57 lb. (1952-53).
First, it should be observed that, although theaverage height of the 16-year-old boys for 1952-53is above the corresponding average measurementfor 1951-52, the difference is not significant; theaverage height of the 16-year-old girls is identicalfor the two sessions. The difference between theaverage weights for the two sessions, for both boysand girls, is not significant.As has already been mentioned, the 16-year-olds
do not form a representative cross-section of thechildren of that age group in any of the regions, asabout two-thirds of the fathers are in Social ClassesI or II or in the more highly-skilled occupations ofSocial Class III. From region to region they form anot dissimilar socioeconomic group, and it is to beexpected that the average heights and weights will besimilar. In fact, relatively few of the average mea-surements for the individual regions are significantlyabove or below the corresponding all-Scotlandaverages; there are only two significant differencescommon to both sessions:
The average weight of the boys of Region 1 (High-lands) is significantly above that for Scotland as awhole (t = 2 - 7 and 3 -0), and the average height of thegirls of Region 3 (Edinburgh, Aberdeen, and Dundee)is significantly below that for Scotland as a whole(t = 2-5 and 2-1).
8

HEIGHTS AND WEIGHTS OF SCOTTISH SCHOOLCHILDREN
It is interesting to note a particular conclusionreached by Martin (1949): "It appears that Scotsmento-day do not differ in stature from their fathers ortheir great-grandfathers." Morant (1950) showedthat the average height of present-day recruits intothe Royal Air Force does not increase after about20 years, whereas that of recruits into the army in1913 increased until 24 years of age. Clements andPickett (1952), analysing a sample of medical recordsof the Ministry of Labour and National Service forthe first quarter of 1941 for 3,700 Scotsmen (1,800of them between 18 and 24 years of age), concludedthat "Scotsmen of all social classes reach adultstature by the 19th year." These and many otherinvestigators think that the faster growth amongschoolchildren of the past 20 years and the earlierattainment of maximum mature height implies noincrease in the final stature of young adults.
There have been relatively few attempts, especiallyin recent years, to compare directly the heights of agroup of parents with three of their offspring, butDurnin and Weir (1952), in a comparison of theheights of groups of men and women students of theUniversity of Glasgow with those of their parents,showed the men students to be 1 *8 in. taller on anaverage than their fathers, and the women studentsto be 1 .7 in. taller than their mothers. These resultsled to the conclusion that it was unlikely that thesedifferences were wholly due to shrinkage of theparents, and that a real secular increase in heightwas at least a contributory factor. Moreoever,evidence recently furnished by Acheson and Hewitt(1954) in respect of nearly 600 pre-school childrenin Oxford lends support to the hypothesis of anincreasing fulfilment of "growth potential", andthus of a net increase in the height of the adultpopulation.
It is doubtful, however, whether a firm conclusionabout this particular problem is possible, and thegeneral question of the extent to which differences instature (and body-weight) are determined by geneticor environmental factors is likely to remain contro-versial. It may well be, however, as Berry andCowin (1954) presume, that "the answers to all thoseproblems will ultimately be writ clear in the statureof future generations", partly as a result of thelong-term research studies that are now afoot.
(4) AVERAGE HEIGHTS AND WEIGHTS OF THE SCHOOL-CHILDREN OF FOUR HIGHLY INDUSTRIAL LARGEBURGHS COMPARED WITH THOSE OF THE CHILDRENOF FOUR LESS INDUSTRIAL LARGE BURGHS, AT5, 9, 13, AND 16 YEARS, 1952-53.
In a sense this comparison is simply a variant of
the preceding regional analysis. Just as the averageheights and weights for children of the highlyindustrial city of Glasgow (Region 6) are signi-ficantly lower than the corresponding averages forthe children of the less industrial Region 3 formedby the cities of Edinburgh, Aberdeen, and Dundee,so it is to be expected that the averages for thechildren of a group of industrial large burghs wouldbe lower-possibly significantly so-than those forthe children of a group of much less industrial largeburghs.To determine whether this was indeed so, the large
burghs of Dumbarton, Falkirk, Kilmarnock, andKirkcaldy were chosen for the highly industrialgroup, and the large burghs of Perth, Stirling, Ayr,and Dunfermline (three of these situated close totheir "industrial" counterparts) for the less indus-trial group. The total number of children of the fourage groups concerned who were measured during1952-53 varied within each of the two groups ofburghs from 1,300 to 2,500.The particulars in Table X (overleaf) are drawn
from Appendix Table F, the average heights andweights of both boys and girls having been adjustedto the uniform ages of 5A1 , 9 , 13A1v, and 16,7years, by use of the factors based on the recentmeasurements of children attending the Edinburgheducation authority schools.
Analysis shows that at 5 and 9 years, for boys andgirls alike, the average, heights and weights of thechildren of the four highly industrial large burghsare significantly lower than the correspondingaverages for the four less industrial large burghs. At13 years the averages for the children of the highlyindustrial group are all lower than those for thechildren of the less industrial group, but in oneinstance only, the average height for girls, is thedifference of statistical significance (t = 7*9); at16 years the averages for the children of the highlyindustrial group are lower, all the differences beingsignificant except that relating to the average weightfor girls.
It has to be noted, however, that, by the age of13 years, in most of the eight burghs concerned, the"native-born" school population has been aug-mented to a variable extent by "migrants" from thecounty landward areas who are pursuing studies atsecondary schools, and precise information is notavailable as to the number of those "migrants"; at16 years of age also, there is continuance of thisparticular difficulty and, moreover, the totalnumbers are small.The general trend, however, is interesting, and the
findings in respect of the 5 and 9-year-olds, who are
9

TABLE XEIGHT LARGE BURGHS, FOUR INDUSTRIAL AND FOUR NON-INDUSTRIAL
MEAN HEIGHTS AND WEIGHTS OF SCHOOL CHILDREN AT 5'/,,, 96./, 136/,,, and 16'/,, YEARSSESSION 1952-53
Age (yrs) .. ..5 9 13 16
Height Weight Height Weight Height Weight Height WeightMeasurement .. (in.) (lb.) (in.) (lb.) (in.) (lb.) (in.) (lb.)
Industrial LargeBurghs .. .. 43 *45 42 * 55 51 * 53 63 * 34 59*59 93 95 67-34 130*91
Boys _"Non-industrial"Large Burghs 43 *93 44-00 53 * 17 65 *06 59*66 94*45 68 *07 136*04Difference .. 048 145 174 1*72 0*07 0 50 0 73 5*13
t 7-1 8-8 16-0 4 6 0 5 0-7 2 5 8-8
Industrial LargeBurghs .. 42*37 4081 51*19 60*84 59*44 96*81 63*69 123*53
Girls"Non-Industrial"Large Burghs .. 42*93 41*55 5265 62-73 60*31 97*72 64-44 124 06
Difference .0.56 074 1*46 1*89 0*87 0*91 0*75 1*07t = 8-2 4-4 12-0 4-7 7-9 1-4 3-1 1-8
nearly all "native-born", are of importance for thepresent purpose, being in line with some of themain findings of the regional analysis on a geo-graphical industrial grouping.
III. SUMMARY
(1) It is claimed that, although the increase inaverage heights and weights of children attendingeducation authority schools in Edinburgh andGlasgow over the past 40 years may not be typicalof Scotland as a whole, it illustrates the position inmost of the populous industrial centres.
It is shown that the average measurements ofchildren aged 5, 9, and 13 years in Edinburgh andGlasgow in session 1953-54 are all significantlygreater than the corresponding averages for 1913-14.A few of these averages had already increasedsignificantly by 1931-32, but the chief increases haveoccurred in steady annual increments during thepast 20 years.
In 1913-14 the average measurements for theEdinburgh children at 5, 9, and 13 years were allabove the corresponding averages for the Glasgowchildren. As time passed, most of these "gaps" wereappreciably closed, but even so the present-daydifferences in favour of the Edinburgh children are.statistically significant, with only one exception.The proportionate increases in the average
measurements of Glasgow boys and girls between5 and 9 years, 9 and 13 years, and 5 and 13 years areclosely similar for those born in 1925 and in subse-quent years up to and including 1940.
(2) Edinburgh, Glasgow, Dundee, and Ayrshiretogether fairly represent the school population of thepopulous central industrial belt of Scotland. Astudy of the average measurements of schoolchildrenaged 5, 9, 13, and 16 years for the 6-year period,1948-49 to 1953-54, shows that by 1953-54 all theaverages had risen, for boys and girls alike, thedifference being significant in each instance. Acomparison between 1952-53 and 1953-54 showsdifferences favouring the latter session in practicallyall cases, most of these differences being statisticallysignificant.
Together, these results show a continuance of theupward trend in the average heights and weights ofschoolchildren that has characterized the past twodecades.
(3) The general situation throughout Scotland inregard to the weighing and measuring of school-children at systematic medical examination isreviewed. In the subsequent analysis, the country isdivided on a geographical-industrial basis into sixregions:
Region 1, Highlands;Region 2, Eastern Counties;Region 3, Edinburgh, Aberdeen, and Dundee;Region 4, Southern Counties;Region 5, Western and Central Industrial Region
(excluding Glasgow);Region 6, Glasgow.
The average heights and weights of children aged5, 9, 13, and 16 years attending education authorityschools in sessions 1951-52 and 1952-53 are adjustedto the uniform ages of 5 4A, 9A, 13 1A , and 6 7 years.
10 J. A. GRANT KEDDIE

HEIGHTS AND WEIGHTS OF SCOTTISH SCHOOLCHILDREN
In the analysis a distinction is made betweenchildren aged 5, 9, and 13 years on the one hand andthose aged 16 years on the other, as the 16-year-oldsecondary school pupils do not form a representativecross-section of the members of this age group in thecommunity.
The all-Scotland averages for boys in session1952-53 are:
43 00 in. and 43 * 12 lb. at 5 years.51-93 in. and 64-27 lb. at 9 years.59 52 in. and 93 52 lb. at 13 years.
The corresponding all-Scotland averages for girlsin session 1952-53 are:
42 61 in. and 41-50 lb. at 5 years.51-54 in. and 62 04 lb. at 9 years.59 99 in. and 97 53 lb. at 13 years.
These average measurements, in comparison withtheir counterparts for 1951-52, provide additionalevidence of a continuance of the upward trend in theaverage heights and weights of both boys and girls.
Arrangements of the regions in descending orderof measurements brings out the following points:
(i) Region 1 (Highlands) and Region 4 (Southern)Counties)-commonly in that order-almost in-variably have the highest average values for bothheight and weight for both boys and girls.
(ii) Region 6 (Glasgow) provides the lowestaverage heights, with one exception, and the lowestaverage weights, with Region 3 (Edinburgh, Aber-deen, and Dundee) most commonly providing thenext lowest average measurements.
(iii) Region 2 (Eastern Counties) and Region 5(Western and Central Industrial Region, excludingGlasgow) occupy intermediate positions, with theformer, on balance, the more favourably situated.
(iv) For each of the two sessions, for both boysand girls, the order of average weights in a particularage group approximates closely, with few exceptions,to the order of the average heights.
(v) At 5, 9, and 13 years, the average measure-ments of children in the predominantly rural regions(1 and 4) are above the corresponding all-Scotlandaverages, the differences being almost invariably ofstatistical significance. In contrast, for each agegroup, the average measurements of children in thepredominantly industrial regions (6 and 3) are belowthe corresponding all-Scotland averages, the dif-ferences being almost invariably significant.
(vi) The arrangement of the six regions indescending order of average heights and weights ofchildren at 5, 9, and 13 years gives results that agreeclosely with the findings of Martin (1949) in aninquiry into the average heights and weights of youngadult Scotsmen examined under the Military Train-ing Act, 1939.
(viii) In the session 1952-53 the average measure-ments of the 2,902 16-year-old boys in attendance ateducation authority secondary schools throughoutScotland (measurements adjusted to the uniform ageof 16 7 years) were 67-70 in. and 134'91 lb., andthose of the 2,687 16-year-old girls were 63 66 in.and 123 * 57 lb. From region to region, so far as theoccupations of the fathers are concerned, these16-year-old pupils may be said to form a not dis-similar socio-economic group, of a level somewhatabove that of the 16-year-olds in the community as awhole; in keeping with this, relatively few of theaverage measurements for the individual regions aresignificantly above or below the correspondingall-Scotland average.
(4) In addition to the regional analysis, the aver-age measurements at 5, 9, 13, and 16 years of theschoolchildren of four highly industrial large burghsare compared with those of four less industrial largeburghs. For both boys and girls, the average heightsand weights in each age group in the highly industrialgroup of large burghs are below the correspondingaverages for the less industrial group, most of thedifferences being statistically significant.
It is a pleasure to record my thanks to the medicalofficers of health and school medical officers throughoutScotland for their collaboration in checking the accuracyof the returns of heights and weights of schoolchildrenfor sessions 1951-52 and 1952-53; in particular, thanksare due to the medical, nursing, and clerical staffs of theschool health departments in Edinburgh, Glasgow,Dundee, and Ayrshire for the careful recording, over theyears, of the results of the systematic medical examina-tions.
Indebtedness is expressed to Dr. John Riddell, medicalofficer of health for the Counties of Midlothian andPeebles, and Mr. James Maxwell, principal lecturer inpsychology at Moray House Training College, Edin-burgh, for their most helpful advice and criticism.
I acknowledge with gratitude the encouragement ofDr. H. Kenneth Cowan, chief medical officer, Depart-ment of Health for Scotland, and Dr. W. B. Inglis,O.B.E., director of studies, Moray House TrainingCollege.
REFERENCESAcheson, R. M., and Hewitt, D. (1954). British Journal ofPreventiveand Social Medicine, 8, 59.
Berry, W. T. C., and Cowin, P. J. (1954). Brit. med. J., 1, 847.
11.

12 J. A. GRANT KEDDIE
Clements, E. M. B., and Pickett, K. G. (1952). British Journal of Ministry of Education (1954). "Early Leaving". A Report of thePreventive and Social Medicine, 6, 245. Central Advisory Council for Education (England). H.M.S.O.,
Daley, A. (1950). "Report on the Heights and Weights of School London.Pupils in the County of London in 1949". Staples Press, London. Morant, G. M. (1950). Proc. roy. Soc. B., 137, 443.
Durnin, J. V. G. A., and Weir, J. B. de V. (1952). Brit. med. J.,1, 1006. Scottish Council for Research in Education (1953). "Social Implica-
General Register Office (1951). "Classification of Occupations, tions of the 1947 Scottish Mental Survey". Publications of the1950". H.M.S.O., London. Scottish Council for Research in Education, XXXV. University of
Martin, W. J. (1949). "The Physique of Young Adult Males", London Press, London.Medical Research Council Mem. Mo. 20. H.M.S.O., London.
APPENDIXTABLE A
CITIES OF EDINBURGH AND GLASGOW EDUCATION AUTHORITY SCHOOLSSESSIONS 1913-14 TO 1953-54
AVERAGE HEIGHTS AND WEIGHTS OF CHILDREN OF 5,9, AND 13 YEARS OF AGE EXAMINED IN SCHOOLDURING SYSTEMATIC MEDICAL INSPECTION*
Age (yrs) 5 9 13
School Height Weight Height Weight Height WeightCity Sex Session (in.) (lb.) (in.) (lb.) (in.) (lb.)
1913-14 41-5 40-6 48-8 56-6 56-0 78 91920-21 41-3 40-7 49-5 58-0 55-9 76-41926-27 41*6 42*2 48*4 55-8 56-8 85*7
Boys 1931-32 42-3 40*4 48-6 54-5 58 2 88*41937-38 42-48 41-84 not available not available1949-50 42*61 42*78 51*59 64*04 58*96 91 371953-54 42*79 42*67 51*72 64*05 59*57 93*27
Edinburgh1913-14 41-2 39-6 48-7 55*7 59 0 84-31920-21 40 0 39 1 49-2 55.8 56 9 79-11926-27 40*5 39*3 48 9 53-5 55 6 82-7
Girls 1931-32 41*3 39-0 48-7 53-2 59*6 92-51937-38 42-12 40-34 not available not available1949-50 42 14 41 21 51*08 62-26 59.74 96-591953-54 42*24 40 91 51*00 62*89 59 85 96 98
1913-14 40 5 37-7 47-4 54-8 55-1 76-41920-21 40 2 39*5 49*1 54-4 54-7 74 81926-27 40 9 39.3 49 5 56-4 56-1 78-8
Boys 1931-32 41 1 39*4 49*3 57*0 56-3 79 81937-38 41*65 40*52 50*23 59*45 57-33 83*451949-50 42*47 42-31 51*08 61*84 58*60 88*431953-54 42-43 42-05 51 40 63-16 59-01 90 93
Glasgow1913-14 40 4 37-0 48-3 54 1 56 3 79-01920-21 39*8 38-1 48-3 53 5 56 5 78-51926-27 40*7 38-1 48-8 54-3 56-5 82-1
Girls 1931-32 40*7 37 -8 49*1 55*0 57 3 83 71937-38 41*34 39*01 49*98 57*59 58-47 88*931949-50 42-00 40-46 50 54 59-64 59-22 93 161953-54 42-04 40*69 50*83 61*08 59*48 95*41
* Measurements adjusted in 1937-38, 1949-50, and 1953-54 to the uniform ages of 5 4/12, 95/12, and 135'I, years. In earlier sessions theaverage ages at time of measurement approximated closely to these.
TABLE BCITIES OF EDINBURGH, GLASGOW, AND DUNDEE, AND COUNTY OF AYR
EDUCATION AUTHORITY SCHOOLS-SESSIONS 1948-49 TO 1953-54NUMBERS AND THE AVERAGE HEIGHTS AND WEIGHTS OF CHILDREN OF 5,9, 13, AND 16 YEARS OF AGE
EXAMINED IN SCHOOL DURING SYSTEMATIC MEDICAL INSPECTIONADJUSTED AVERAGE MEASUREMENTS (UNIFORM AGES OF 5 4/12 9 6/12, 13 6/1,
AND 167/12 YEARS RESPECTIVELY)
Age Group .. .. Entrant Infants Second Age Group Third Age Group Secondary Schools(5'/12 yrs) (96/12 yrs) (13'/12 yrs) Age Group (167/1, yrs)
School No. Height Weight No. Height Weight No. Height Weight No. Height WeightSex Session Examined (in.) (lb.) Examined (in.) (lb.) Examined (in.) (lb.) Examined (in.) (lb.)
1948-49 14,903 4265 42-36 12,211 51-69 63-49 11,213 59 00 90-01 1,010 66-86 130-601949-50 14,837 42-63 42-63 11,949 51*66 63-47 12,019 59*05 91*02 1,010 67-34 132-711950-51 14,154 42-67 42-60 11,951 51*53 62-92 12'038 59-24 91*95 993 67-53 133-11
Boys 1951-52 17,241 42-66 42 58 11,709 51-79 63 35 12,530 59 36 91-79 1,022 67-44 133-861952-53 17,652 42-65 42-61 12,289 51*55 63 29 11,937 59-40 92-68 1,101 67-55 132-391953-54 16,903 42-73 42-54 13,487 51-82 64-09 12,227 59-56 93-37 1,314 67-64 134-48
1948-49 14,177 42-19 40-69 11,423 51 05 60-72 11,289 59 35 94-22 782 63 49 121*241949-50 14,143 42-19 40-97 11,778 51*08 61-32 12,226 59-59 92-12 707 63*54 121*681950-51 13,409 42-29 41-05 11,575 51-13 61-29 12,198 59-62 95-65 801 63-36 123-21
Girls 1951-52 16,774 42-32 40-91 11,779 51-14 61-34 12,594 59-95 97-50 907 63-67 123-631952-53 17,197 42-34 40-96 11,487 51-30 61-60 11,578 59 84 96-72 925 63-64 122-701953-54 15,960 42-48 4110 13,170 51-34 62-45 12,604 59-96 97 37 1,150 63-63 122 81

HEIGHTS AND WEIGHTS OF SCOTTISH SCHOOLCHILDREN 13
TABLE CBOYS ATTENDING SCOTTISH EDUCATION AUTHORITY SCHOOLS-SESSIONS 1951-52 and 1952-53NUMBERS AND AVERAGE HEIGHTS AND WEIGHTS OF BOYS OF 5,9, AND 13 YEARS OF AGE
EXAMINED IN SCHOOL DURING SYSTEMATIC MEDICAL INSPECTIONADJUSTED AVERAGE MEASUREMENTS (UNIFORM AGES OF 5'/,,, 9 /,,, AND 13 6/,j, YEARS RESPECTIVELY)
Age Group.Entrant-Infants Second Age Group Third Age Group(5 '/hs yrs) (96/12 Yrs) (13 6/12 yrs)
School No. Height Weight No. Height Weight No. Height WeightSession Region Examined (in.) (lb.) Examined (in.) (lb.) Examined (in.) (lb.)
1. Highlands.4,761 43 38 44-58 3,911 52-24 66-42 3,440 59-84 95 33
2. Eastern Counties .3,646 42-92 42-84 2,873 51-85 64-35 2,394 59-79 92-85
3. Edinburgh, Aberdeen, and Dundee 6,214 42-61 42-93 4,666 51-89 63 68 5,075 59-59 92-18
1951-52 4. Southern Counties..6,446 43 27 43 77 4,874 52-55 65-45 4,626 60-16 95 14
5. Western and Central IndustrialRegion (excluding Glasgow) 10,709 43 08 43 25 9,204 52-05 63 81 8,948 59-44 92-67
6. Glasgow . .9,297 42-49 42-02 5,969 51-39 62-35 6-535 59-07 90-57
All Scotland . .41,073 42-93 43-13 31,497 51-98 64-14 31,018 59-57 92-87
1. Highlands . .5,057 43 53 44-59 3,818 52-51 66-75 3,528 60-04 98-21
2. Eastern Counties . .5,018 43-46 42-85 3,199 51-79 64-20 3,161 60-21 92-51
3. Edinburgh, Aberdeen, and Dundee 6,096 42-46 42-76 4,270 51-26 63 86 4,472 59-32 93-20
1952-53 4. Southern Counties 7,152 43 35 43 61 5,226 52-39 65-19 4,730 60-12 95-60
5. Western and Central IndustrialRegion (excluding Glasgow) 11,901 43-04 43-32 9,723 52-10 64-15 8,454 59-22 92-77
6. Glasgow . .9,712 42-48 42-07 6,695 51-41 62-59 6,453 59-15 91-11
All Scotland . .44,936 43 00 .43-12 32,931 51 93 64-27 30,798 59-52 93-52
TABLE DGIRLS ATTENDING SCOTTISH EDUCATION AUTHORITY SCHOOLS-SESSIONS 1951-52, 1952-53
NUMBERS AND THE AVERAGE HEIGHTS AND WEIGHTS OF GIRLS OF 5,9, AND 13 YEARS OF AGEEXAMINED IN SCHOOL DURING SYSTEMATIC MEDICAL INSPECTION
ADJUSTED AVERAGE MEASUREMENTS (UNIFORM AGES OF 5'/,,,, 9 '/, AND 13 /,, YRS RESPECTIVELY)
Age Group.Entrant-Infants Second Age Group Third Age Group(5'/,2 yrs) '(9*1/, yrs) (13 iss, yrs)School No. Height Weight No. Height Weight No. Height WeightSession Region Examined (in.) (lb.) Examined (in.) (lb.) Examined (in.) (lb.)
1. Highlands.4,533 42-79 43 31 3,869 52-03 64-06 3,481 60-26 99.40
2. Eastern Counties . . 3,441 42-88 41-83 2,874 51-70 63-09 2,171 60-77 97.74
3. Edinburgh, Aberdeen, andDundee 5,918 42-33 41-05 4,776 51-34 62-12 5,054 60-15 97.59
1951-52 4. Southern Counties ..6,077 42-90 42-06 4,708 51-72 62-77 4,534 60-49 101-00
5. Western and Central IndustrialRegion (excluding Glasgow) 9,928 42-61 41-34 8,969 51-58 60-93 8,632 60-07 96-10
6. Glasgow.9,148 42-07 40-44 5,798 50-80 60-22 6,636 59-48 95-03
AllScotland.39,,045 42-53 41-47 30,994 51-48 61-66 30,508 60-12 97-67
1. Highlands.4,660 43-09 43-07 3,648 52-47 64*44 3,385 60-07 100-37
2. Eastern Counties .4,863 42-69 41-61 3,278 51-48 62-43 3,145 59*93 97-02
3. Edinburgh, Aberdeen, andDundee 5,697 42-18 40.90 4,022 51-36 62-06 4,196 59-96 98-46
1952-53 4. Southern Counties - 6.921 42-96 42-04 5.010 52-00 63-38 4,485 60-56 99-48
5. Western and Central IndustrialRegion (excluding Glasgow) - 11,261 42-76 41-58 9,678 51-46 61-16 8,487 59-99 96-84
6. Glasgow.9,628 42-16 40-54 6,192 50-90 60-73 6,410 59-61 95-20
All Scotland .43,030 42-61 41-50 31,828 51-54 62-04 30,108 59-99 97-53

14 J. A. GRANT KEDDIE
TABLE FPUPILS ATTENDING SCOTTISH EDUCATION AUTHORITY SECONDARY SCHOOLS-SESSIONS 1951 52, 1952-53NUMBERS AND THE AVERAGE HEIGHTS AND WEIGHTS OF PUPILS OF 16 YEARS OF AGE EXAMINED IN
SCHOOL DURING SYSTEMATIC MEDICAL INSPECTIONADJUSTED AVERAGE MEASUREMENTS (UNIFORM AGE OF 16 7/,, YRS)
Sex.Boys GirlsSchool No. Height Weight No. Height WeightSession Region Examined (in.) (lb.) Examined (in.) (lb.)
1. Highlands.389 67 49 138-01 436 63-25 123-19
2. Eastern Counties.235 67 -25 137-01 191 63-66 122-82
3. Edinburgh, Aberdeen, and Dundee 535 67-54 134-32 498 63 40 123-31
1951 52 4. Southern Counties 385 68 00 136-65 390 64-04 124-34
5. Western and Central Industrial Region(excluding Glasgow).709 67-70 135-27 654 63 -78 123-57
6. Glasgow.444 676161 134-34 351 63 90 124-49
All Scotland.2,697 67-59 135-67 2,527 63-66 123-64
1. Highlands.403 67-28 137-84 500 63-57 125-24
2. Eastern Counties.246 67 48 133-20 278 63-34 123 96
3. Edinburgh, Aberdeen, and Dundee 450 67-74 132-18 436 63 -38 122-17
1952-53 4. Southern Counties 431 67 90 134-94 429 63 -53 125 13
5. Western and Central Industrial Region(excluding Glasgow).798 68-13 136 79 671 64-01 123-62
6. Glasgow.574 67-28 133-23 373 63-87 121-56
All Scotland.2,902 67-70 134-91 2,687 63-66 123-57
TABLE FPUPILS ATTENDING EDUCATION AUTHORITY SCHOOLS-SESSION 1952-53, IN FOUR HIGHLY INDUSTRIAL
AND FOUR LESS INDUSTRIAL LARGE BURGHSNUMBERS AND THE AVERAGE HEIGHTS AND WEIGHTS OF PUPILS OF 5, 9, 13, AND 16 YEARS OF AGE
EXAMINED IN SCHOOL DURING SYSTEMATIC MEDICAL INSPECTIONADJUSTED AVERAGE MEASUREMENTS (UNIFORM AGES OF 5 4I12, 9 6/12, 13 6/,,, AND 16 7/,, YRS RESPECTIVELY
Age Group . .. Entrant-Infants I Second Age Group Third Age Group Secondary Schools(5 4/12 yrs) (96"/12 yrs) (13 "/,2 yrs) Age Group (I6 7/,, yrs)
No. Height Weight No. Height Weight No. Height Weight No. Height WeightSex Burghs Examined (in.) (lb.) Examined (in.) (lb.) Examined (in.) (lb.) Examined (in.) (lb.)
All eight burghs 2.892 43-69 43 27 2.104 52 41 64-22 2,561 59-56 94-20 322 67.74 133-74
Boys Four highly in-dustrial burghs 1,464 43.-45 42-55 1,036 51-53 63-34 1,289 59.-59 93 95 145 67-34 130-91
Otherfourburghs 1,428 43 93 44-00 1,068 53 27 65 06 1,272 59-66 94.45 177 68 07 136-04
All eight burghs 2,846 42-65 41-19 2,265 51 93 61-78 2,641 59 93 97 25 311 64-10 124-02
Girls Four highly in-dustrial burghs, 1,387 42 37 40-81 1,128 51-19 60 84 1,356 59.44 96 81 136 63-69 123-53Otherfourburghs 1,459 42-93 41 55 1,137 52 65 6273 1,285 60 31 97-72 175 64.44 124 60