sugar industry as a source of pollution: a case study ... · sugar industry as a source of...
TRANSCRIPT

CroniconO P E N A C C E S S EC PHARMACOLOGY AND TOXICOLOGY
Research Article
Sugar Industry as a Source of Pollution: A Case Study, Elgenaid Sugar Factory, Gezira State, Sudan
Mohamed E Hassan1*, Nabil H H Bashir² and Yousif O H Assad² 1Department of Environment and Natural Resources Faculty of Agricultural Sciences, University of Gezira, Wad Medani, Sudan 2Department of Pesticides and Toxicology, Faculty of Agricultural Sciences, University of Gezira, Wad Medani, Sudan
*Corresponding Author: Mohamed E Hassan, Department of Pesticides and Toxicology, Faculty of Agricultural Sciences, University of Gezira, Wad Medani, Sudan.
Citation: Mohamed E Hassan., et al. “Sugar Industry as a Source of Pollution: A Case Study, Elgenaid Sugar Factory, Gezira State, Sudan”. EC Pharmacology and Toxicology 4.5 (2017): 202-212.
Received: September 13, 2017; Published: October 10, 2017
Abstract
Pollution is a major national and world problem. Industries, including sugar industry, represent one of the pollution causes. This study aims to evaluate the extent of pollution in waste-water (WW), plants, and soil caused by the sugar industry in Elgenaid area, Gezira State, central Sudan. Completely randomized design was adopted. Samples were collected from the factory WW, trees, and soil from the area of study and compared with other areas far from the factory within the state. The WW samples were analyzed using titration methods to determine levels of sulfide, as well as chemical oxygen demand (COD) and biological oxygen demand (BOD). Moreover, all samples were analyzed by atomic absorption spectrophotometer (AAS) to determine concentrations of Zn, Pb, Cd, and Cu. The results showed that the sulfides concentration was ranging from 1.36 - 2.90 mg/L (average 2.21 mg/L), i.e. within the permissible limits. The COD was between 1,600 - 5,330 mg/L (av. 4,073 mg/L), while the BOD was between 870 and 2,730 mg/L ( av. 2,096 mg/L), i.e. both were higher than allowed concentrations (50 mg/L for COD, and 35 mg/L for BOD). All samples collected didn’t show detectable levels of Pb, Cu and Cd. However, Zn appeared in all samples; its concentrations ranged from 0.1359 - 0.6375 mg/L in WW samples (av. of 0.367mg/L), from 0.088 - 1.043 mg/L in trees samples (av. 0.399mg/L), and from 0.045 - 0.352 mg/L in the soil samples (average of 0.115 mg/L). These values are high according to the National Environment Quality Standard of Pakistan.
Keywords: Environmental Pollution; Waste Water; Heavy Metals; COD; BOD; Sugar Industry; Elgenaid; Sudan
Introduction
Environmental pollution, as a national and world problem, was recognized the 1960s. According to several scientists and specialized organizations, the problem could get worse in the future. General pollution produces a deterioration of the quality of the environment. Pollution (point or non-point) is responsible for dirty streams, rivers and seas, atmospheric contamination, the despoliation of the coun-tryside, urban dereliction, adulterated food, etc. All these factors are affecting the environment in which people reside, work, and spend their leisure time [1]. A pollutant is a substance or an effect, which adversely alters the environment by changing the growth- rate of spe-cies, interferes with the food-chain/ web, toxic, or interferes with health, comfort, amenities, or property values of peoples. Generally, pol-lutants are introduced into the environment in significant amounts in the form of sewage, waste, accidental discharge, or as a by-product of amount catering process or other human activity [2].
Pollution control measures for large-scale industrial operations must be carefully planned to minimize risks to health and environ-ment. The sugar production process is known to produce substantial levels of gas waste, solid waste, water, and noise pollution. The

203
Sugar Industry as a Source of Pollution: A Case Study, Elgenaid Sugar Factory, Gezira State, Sudan
Citation: Mohamed E Hassan., et al. “Sugar Industry as a Source of Pollution: A Case Study, Elgenaid Sugar Factory, Gezira State, Sudan”. EC Pharmacology and Toxicology 4.5 (2017): 202-212.
highly polluted wastewater (WW) from sugar factories, in particular, poses a substantial danger to health and environmental quality [3]. In Sudan, sugar industry (started 1963) is basically seasonal in nature and operates only for 120 to 200 days in a year (early November to April). A significantly large volume of waste is generated during the manufacture of sugar and contains a high amount of pollution load, particularly in terms of suspended solids, organic matter (OM), and press mud, bagasse and air pollutants [4].
Therefore, the objectives of the present work were to evaluate the pollution caused by the sugar industry waste represented by Elge-naid Sugar Factory (GSF), the first Sudanese sugar factory, established 1963, Gezira State, with special emphasis on:
1. Assessing the quality of WW discharged from the factory, and
2. Evaluating the level of some pollutants in the area of study from water, soil and plants samples, viz. sulfides, (HMs) heavy metals, chemical oxygen demand (COD) and biological oxygen demand (BOD).
Materials and MethodsStudy area
The study was carried out in GSF area and its surroundings, in the Gezira State (Central Sudan) (Map 1). Samples were prepared at the Biology laboratory, Faculty of Agricultural Sciences, and the Food Sciences laboratory, Faculty of Engineering and Technology (FET), University of Gezira, Wad Medani, the Sudan. Chemical analysis was carried out in the Sugar Cane Research Center-Elgenaid, and the Environment and Natural Resources Research Institute, the National Center for Research, Khartoum, and the Chemistry laboratory, FET.
Map 1: The study area.
204
Sugar Industry as a Source of Pollution: A Case Study, Elgenaid Sugar Factory, Gezira State, Sudan
Citation: Mohamed E Hassan., et al. “Sugar Industry as a Source of Pollution: A Case Study, Elgenaid Sugar Factory, Gezira State, Sudan”. EC Pharmacology and Toxicology 4.5 (2017): 202-212.
Determination of sulfide in WW
WW samples were collected from three different locations along the waste effluent canal (map), at equal distances along the canal, which starts from the factory and passes to the Blue Nile river. From each location, samples were taken from three points as replicates.
Materials
Glassware: Burettes, pipettes, different sizes of conical flasks, volumetric flasks of different volumes, different sizes of beakers, gradu-ated cylinders, separatory funnels, Erlenmeyer flasks and porcelain crucible.
Others: Furnace, sensitive balance, oven, filter papers, sieves, and a refrigerator.
Chemicals: Zinc acetate solution (2.5%), which was prepared by dissolving 2.5g Zn (CH3COO)2 2H2O in water and diluted to 100 ml. HCl 50% v/v. MKIO3 (0.004): KIO3 was dried at 120oC for 4 hr, followed by dissolving 0.892g KIO3, then diluted to 1L with distilled water. Starch indicator, which was prepared by making a paste of 1.0g of soluble starch, and pouring the paste with continuous mixing into 10 ml of boiling water for 1 minute. Sodium thiosulfate (0.0125 M), which was prepared by dissolving 3.125 g (Na2S2O3.5H2O), and the mixture was diluted to 1L by adding distilled water, HCL (0.05N), H2SO4 (0.025), conc. HCL, and HCL (20%), Mercuric sulfate, Potassium dichro-mate solution (0.25N), ferrous ammonium sulfate, ferroin indicator, manganese sulfate, potassium iodide, sodium azide, and sodium thiosulfate (0.25N).
Methods
A zinc acetate solution was added immediately after samples collection to fix the sulfide. In the proportion of 2 ml/L, a few drops of HCl, were added to the solution to prevent hydrolysis [5]. To standardize the thiosulfate solution, three portions of 20 ml of potassium iodate-iodide solution was taken in three 250 ml conical flasks. Two ml of 50% HCl was added to each flask and mixed. The mixture was titrated with the sodium thiosulfate solution using 2 ml of the starch solution as an indicator, and the starch was added when a pale yellow color was reached. The titration continued until the blue color just disappeared, the titer (sodium thiosulfate) volume was noted and the concentration of thiosulfate was calculated from the average volume of thiosulfate titer. Three portions of 20 ml portions of potassium iodate-iodide solutions were taken in three 250 ml conical flasks. Exactly 2 ml of 50% HCl was added to each flask and mixed. WW (50 ml) was added to each flask and mixed; each mixture was titrated with sodium thiosulfate; 2ml of the starch indicators were added to each conical flask, when a pale straw color was reached, the titration was continued until the blue color just disappears. The titer (sodium thiosulfate) volumes were noted, and the sulfide concentration was calculated [5]. The same procedure was repeated for each sample.
Calculations
Standardization of thiosulfate
First step involves the reaction between iodate and iodide in acid solution to give iodine
IO-3 + 5I- + 6H+ 3I2 + 3H2O ……………………… (1)
The second step is the reaction between the iodine produced and the thiosulfate:
I2 + 2S2O3-2 S4O6 -2 + 2I- ………………………….. (2)
From (1) and (2) one mole of the iodate reacts with 6 moles towards thiosulfate. Thus:
Iodate Thiosulfate
MV MV/6

205
Sugar Industry as a Source of Pollution: A Case Study, Elgenaid Sugar Factory, Gezira State, Sudan
Citation: Mohamed E Hassan., et al. “Sugar Industry as a Source of Pollution: A Case Study, Elgenaid Sugar Factory, Gezira State, Sudan”. EC Pharmacology and Toxicology 4.5 (2017): 202-212.
Since one mole of iodate reacts with 6 mole of thiosulfate
M1V1 = M2V2/6
Iodometric method
Since one mole of iodate reacts with 6 mole of thiosulfate
I2 + S-2 S + 2I
And the excess (unreacted iodine) is titrated with thiosulfate solution.
The amount of sulfide present in the sample is calculated from the following equation:Let the amount of thiosulfate equivalent to the iodine originally present = (M1V0)/2 Where: M1 = molarity of thiosulfate. V0 = volume of thiosulfate.
Let the amount of thiosulfate equivalent to the unreacted iodine = (M1V1)/2
Thus, the amount of thiosulfate equivalent to the iodine that reacted with the sulfide will be:
0 1( )
2
M V V-
This is the amount of thiosulfate equivalent to the amount of sulfide present in the sample.
Hence the concentration of sulfide is calculated from the equation:
0 116 ( ):
( )
M V VSulfide concentration
Samplevolume L
-
Where: M = molarity of thiosulfate. V0 = the volume of thiosulfate. V1 = the average volume of S2O3.
Determination of Pb, Cd, Cu, and Zn
Soil samples
Eight samples (50g each; replicated 3x) from each of the three selected locations (map) were collected using an auger. The samples were taken from the top 15 cm of the soil only. The three sites from which the samples were taken were: GSF area, Hesahiesa Town (10 km south of GSF) and University of Gezira farm area (Nishesheiba; 45 km south Hesahiesa town)) to represent the contaminated areas, the surrounding areas and clean (control) areas, respectively (Map). GSF soil samples were collected from the four geographical directions within 500m from the factory site. The sediments from the WW canal were also collected. Hesahiesa soil samples were collected from two locations suspected to be deposition sites of GSF fumes coming from the factory chimneys. Samples of Nishesheiba soil were collected from the farm as a control.
Soil samples Preparation
Samples were thoroughly mixed, sieved and air- dried for 24 hr, and 5 g were transferred to Erlenmeyer flask. To this, 20 ml of extract-ing solution (0.05 N HCl + 0.025 N H2SO4) was added; placed in a mechanical shaker for 15 minutes, filtered through Whatmann filter paper no. 1 into a 50 ml volumetric flask and diluted to 50 ml with the extracting solution [6].
206
Sugar Industry as a Source of Pollution: A Case Study, Elgenaid Sugar Factory, Gezira State, Sudan
Citation: Mohamed E Hassan., et al. “Sugar Industry as a Source of Pollution: A Case Study, Elgenaid Sugar Factory, Gezira State, Sudan”. EC Pharmacology and Toxicology 4.5 (2017): 202-212.
Water Samples
WW samples (1L each; replicated 3x) were collected from three different locations along the waste effluent canal (map), which starts from the factory and passes through the canal to the Blue Nile. The first samples were taken from the point where the waste effluent just emerged from the factory (mouth of the canal), and then along the canal. Three samples were taken at equal distances along the canal, starting from the mouth of the canal inside the factory. One sample was taken from the water used for washing sugarcane as control sample.
Water Sample Preparation
The water samples (1L each), was collected using a van Dorn type sampler. From each sample 200 ml aliquot was filtered through a 0.45 micromillipore filter. The filtrate was acidified with 16 drops of concentrated HCl [7].
Plant samples
The samples were collected from two different locations GSF and Nishesheiba, to represent contaminated and control areas, respec-tively. Samples of GSF plant material were collected from sugarcane, ban tree (Eucalyptus microtheca) bark, neem (Azadirachta indica) bark and the bagasse of the sugarcane. Nishesheiba plants (control) samples were collected only from neem bark and ban bark as controls.
Plant Samples Preparation
Plant samples were air-dried. One g of dried, ground plant tissue was placed in a porcelain crucible. The samples were placed in a cool muffle furnace and ashed at 500oC overnight. The ashed samples were cooled and the ash was dissolved in 5 ml of 20% HCl; warming the solution was important for dissolving the residues. The solution was filtered through an acid-washed filter paper into a 50 ml volumetric flask. The filter paper was washed and washings were combined with the filtrate and completed to volume and thoroughly mixed [8].
Analysis of Soil, Plant material and Water Samples
The conditions of AAS (model WIN 330) were automatically adjusted. The prepared soil, plant, and water samples were kept in the dark brown bottles, connected with a tube, which carries the samples into AAS apparatus that reads the spectra automatically; the amount/concentration of Pb, Cu, Cd, and Zn were recorded as they appeared on the screen.
Determination of COD and BOD
COD
COD is a measure of oxygen equivalent to that portion of organic material, which is oxidized by strong oxidizing agent. The value is reported as mg/L of COD. The COD value in general always higher than that of BOD.
Procedure
Twenty ml of WW was taken into a round-bottom flask fitted with a condenser; 1g of mercuric sulfate was added to the flask, to it 30 ml of concentrated H2SO4, and 10 ml K2Cr2O7 (0.25N) was added and digested for 2hr at 150oC. Distilled water (20 ml) was treated similarly as a blank. After 2 hr, digestion of both sample and distilled water must have occurred. The blank was made up to 140 ml, cooled to room temperature, titrated with 0.1N ferrous ammonium sulfate after adding 2 - 3 drops of ferrion indicator. The color changes form greenish to blue with addition of ferrous ammonium sulfate, with the last drop color change from blue to reddish tinge. In this process, mercuric sulfate was added to scavenge the chloride ions [9].

207
Sugar Industry as a Source of Pollution: A Case Study, Elgenaid Sugar Factory, Gezira State, Sudan
Citation: Mohamed E Hassan., et al. “Sugar Industry as a Source of Pollution: A Case Study, Elgenaid Sugar Factory, Gezira State, Sudan”. EC Pharmacology and Toxicology 4.5 (2017): 202-212.
Calculations
COD mg/L = [(A – B) N x 8000]/ml sampleWhere:A = ml of ferrous ammonium sulfate solution used for blank.B = ml of ferrous ammonium sulfate solution used for sample.N = Normality of ferrous ammonium sulfate solution.
BOD
Procedure
WW was neutralized to pH 7.0 by adding either sulfuric acid or sodium hydroxide. Several dilutions were required of the sample, generally 1 to 5% for raw and settled sewage, 5 - 25% for oxidized effluents and 25 - 100% for polluted rivers in BOD bottles. The blank dilution water and the diluted sample were kept four days in an incubator at 20oC. The dissolved oxygen (DO) was determined as: In the diluted sample 2 ml and manganese sulfate (4g MnSO4 in 25 ml DW) was added followed by 2 ml alkali- iodide reagent (5g of NaOH, and 1.5g KI was dissolved in 16 ml of DW). Sodium azide (0.1g) was prepared in 4ml DW. The latter was added to the former to make it 100ml. Stopper was placed carefully to exclude air bubbles and the contents were mixed by inverting the bottle ca. 15x. After keeping the solution for 2 minutes, 2 ml conc. H2SO4 was added. Titration was done with 0.25 N sodium thiosulfate until having a pale straw color. Starch solu-tion (2 ml) was added and the titration was continued till the disappearance of the blue color [9].
Calculations
When seeding is not required
D1 = dissolved oxygen of original dilution water.D2 = dissolved oxygen of diluted sample after 5 days incubation.P = Decimal fraction of sample used
When seeded dilution water is used BOD (mg/L) = [(D1 – D2) - (B1 – B2) / PWhere:B1 = Dissolved oxygen of dilution of seed control before incubation.B2 = Dissolved oxygen of dilution of seed control after incubation.P = (% seed in D1)/ (% seed in B1).
1 2( )/
D DBOD mg L
P
-=
Statistical Analysis
Data collected was subjected to appropriate transformations as required, followed by ANOVA, and the means were separated using the Duncan’s Multiple Range Test (DMRT).
Results and Discussion Concentration of Sulfide in WW
The results of the standard curve (Table 1), indicated that the mean is 31.1 ml of their standard reagents. The sulfide concentration of the samples obtained by the Iodometric method showed an increase in sulfide concentration towards the tail of the stream, which is going to the Blue Nile river. This increase could be attributed to the fact that the effluents of the stream follow (the slope) the topography of the

208
Sugar Industry as a Source of Pollution: A Case Study, Elgenaid Sugar Factory, Gezira State, Sudan
Citation: Mohamed E Hassan., et al. “Sugar Industry as a Source of Pollution: A Case Study, Elgenaid Sugar Factory, Gezira State, Sudan”. EC Pharmacology and Toxicology 4.5 (2017): 202-212.
area. This slow-rate of discharge is suitable for the micro-organism to work on the OM carried with the effluents, resulting in fermentation and changing the pH of the medium and releasing of the hydrogen sulfide. Moreover, weeds also growing along and inside the stream are expected to resist or hamper the motion towards the Blue Nile. Together, they gave enough time for the bacteria in the mud and sediments to produce hydrogen sulfide. Data showed that there are significant differences between the concentrations in a mouth of the stream (1.36 mg/L), middle of the stream (2.39 mg/L) and the tail of the stream (2.90 mg/L). The method was not able to detect sulfide in either the Blue Nile water or tap- water (Figure 1).
Replicates Volume of titer (S2O3)-2 (ml)1 32.02 31.33 30.0
Mean 31.1S.E. ± 0.59
Table 1: Results of the standard for sulfides.
Figure 1: Average sulfide concentration in the waste water from the factory (mouth, middle and tail of the stream) to the river (ND: Not Detectable).
Thus, it can be safely said that the differences between them and the other three values of the stream were significant. The sulfide concentrations obtained from the three locations along the stream ranged from 1.36 mg/L to 2.90 mg/L. These concentrations are not poisonous, according to Parvinen and Lajunen [10].
209
Sugar Industry as a Source of Pollution: A Case Study, Elgenaid Sugar Factory, Gezira State, Sudan
Citation: Mohamed E Hassan., et al. “Sugar Industry as a Source of Pollution: A Case Study, Elgenaid Sugar Factory, Gezira State, Sudan”. EC Pharmacology and Toxicology 4.5 (2017): 202-212.
Concentration of Zn, Pb, Cd and Cu
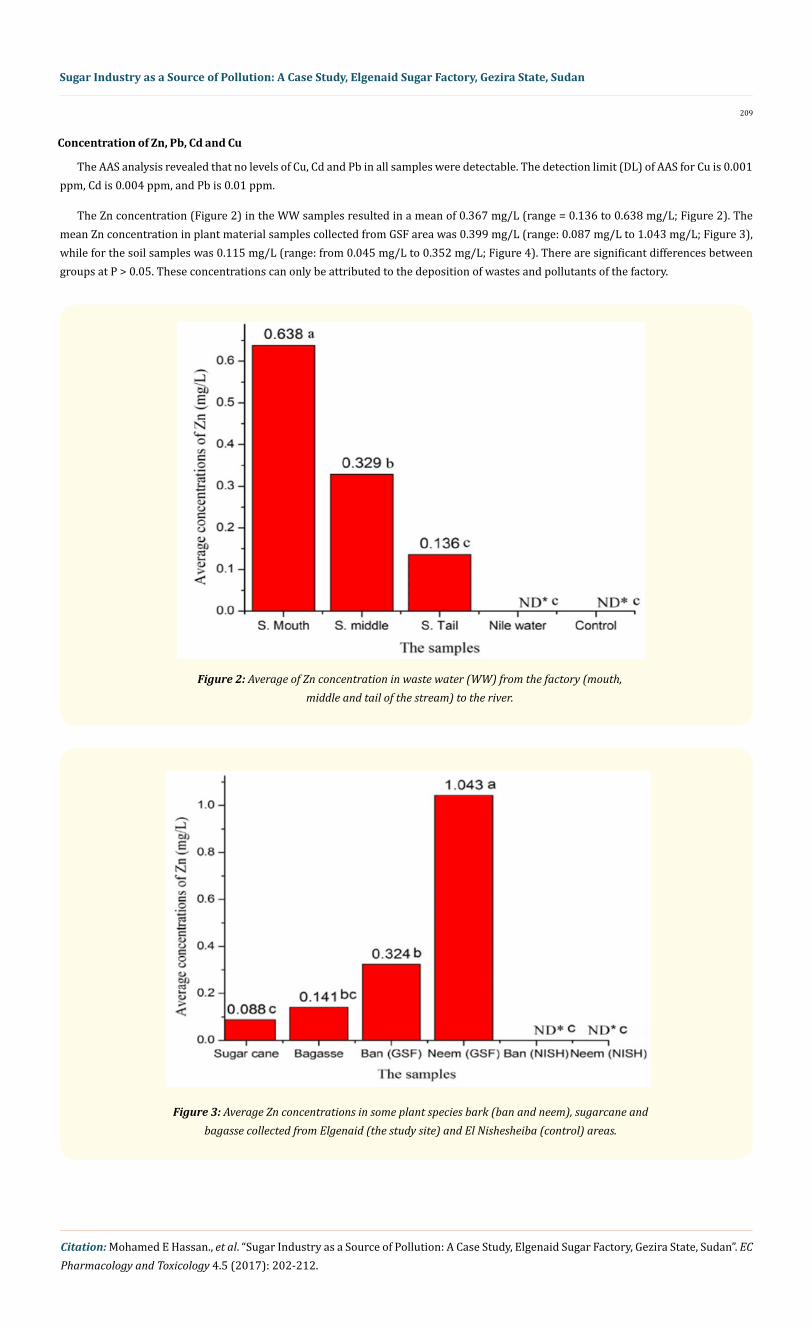
The AAS analysis revealed that no levels of Cu, Cd and Pb in all samples were detectable. The detection limit (DL) of AAS for Cu is 0.001 ppm, Cd is 0.004 ppm, and Pb is 0.01 ppm.
The Zn concentration (Figure 2) in the WW samples resulted in a mean of 0.367 mg/L (range = 0.136 to 0.638 mg/L; Figure 2). The mean Zn concentration in plant material samples collected from GSF area was 0.399 mg/L (range: 0.087 mg/L to 1.043 mg/L; Figure 3), while for the soil samples was 0.115 mg/L (range: from 0.045 mg/L to 0.352 mg/L; Figure 4). There are significant differences between groups at P > 0.05. These concentrations can only be attributed to the deposition of wastes and pollutants of the factory.
Figure 2: Average of Zn concentration in waste water (WW) from the factory (mouth, middle and tail of the stream) to the river.
Figure 3: Average Zn concentrations in some plant species bark (ban and neem), sugarcane and bagasse collected from Elgenaid (the study site) and El Nishesheiba (control) areas.

210
Sugar Industry as a Source of Pollution: A Case Study, Elgenaid Sugar Factory, Gezira State, Sudan
Citation: Mohamed E Hassan., et al. “Sugar Industry as a Source of Pollution: A Case Study, Elgenaid Sugar Factory, Gezira State, Sudan”. EC Pharmacology and Toxicology 4.5 (2017): 202-212.
Figure 4: Average of Zn concentrations in soil samples collected for different localities (Map): The four geographical directions of Elgenaid, Hesahiesa (Hesa1 and Hesa2), and sediments.
The above concentration of Zn in the WW samples is very high when compared to the values in National Environmental Quality Stan-dard (NEQS) set by the government of Pakistan (i.e. zero). Contaminated sample reported by Påhlsson [11], reported Zn level up to 4 mg/L in water, 35 g/kg in soil, and 15 mg/L in estuarine water. The mean daily Zn intake from drinking water is estimated to be < 0.2 mg/day [12]. The environmental concentration of Zn in fresh water rarely exceeds 40 μg/L [13] (Spear, 1981), with a range of 1 - 100 mg/L. In the plants, the range is 10 to 100 mg/kg [14].
Concentration of COD and BOD in Wastewater:
The Results (Figure 5) shows an increase in COD and BOD concentration towards the Blue Nile river. COD and BOD are used as indica-tors of pollution in aquatic fresh water)ecosystems, and lakes. COD is an indicator for the total organic and inorganic pollution, whereas, BOD indicates organic pollution that triggers eutrophication [15].
Figure 5: Concentrations of COD and BOD in waste water samples taken from the mouth, middle and tail of the wastewater stream up to the Blue Nile river.

211
Sugar Industry as a Source of Pollution: A Case Study, Elgenaid Sugar Factory, Gezira State, Sudan
Citation: Mohamed E Hassan., et al. “Sugar Industry as a Source of Pollution: A Case Study, Elgenaid Sugar Factory, Gezira State, Sudan”. EC Pharmacology and Toxicology 4.5 (2017): 202-212.
It could be inferred from COD and BOD values registered from three stream locations, that: Inorganic and organic pollution levels are low at the mouth of the stream.
• The levels of pollution rise progressively toward the middle of the stream reaching to high levels at the tail.
• These differential COD and BOD values suggest the following:
o The pollutants leave the point source (factory) intermittently.
o The low velocity of the discharge from the mouth to the tail.
o The intermittent discharge causes accumulation of OM, causing low velocity, at the middle and the tail of the stream and, consequently, enhancing the process of eutrophication (high COD and BOD values).
All the locations were found to contain concentrations higher than the standard levels: 50 mg/L for COD and 35 mg/L for BOD accord-ing to The Sudanese Standards and Metrological Organization, (SSMO). However, the results of COD and BOD revealed contamination of WW. The main sources for contamination might be to the disposal of chemicals during washing and processing of the cane, and washing of the machines that contains some oils and grease, in addition to OM. The results of BOD indicated that water of the stream is largely polluted by OM. The direct dumping of insoluble solid wastes and discharge of sewage effluents into streams had been noted as a main contributor for BOD. Moreover, winds and rains also carry organic materials and other soil washing ingredients (fertilizers, pesticides, minerals, etc.) from the neighboring bare and agricultural lands to this stream.
Bibliography
1. Cornish E. “Futuring: The exploration of the future”. World Future Society; Besthesda, Maryland, USA (1994): 313.
2. Agrawa A., et al. “Water Pollution with Special Reference to Pesticide Contamination in India”. Journal of Water Resource and Protec-tion 2 (2010): 432-448.
3. Parker R., et al. “Informal settlements, environmental degradation, and disaster vulnerability: The Turkey case study”. World Bank Publications 97 (1995).
4. Shammas NK and Wang LK. “Hazardous Waste Deep-Well”. Advances in Hazardous Industrial Waste Treatment (2008): 385.
5. Darkwa J. et al. “Oxyhalogen-sulfur chemistry: Oxidation of N-acetylcysteine by chlorite and acidic bromate”. The Journal of Physical Chemistry A 107.46 (2003): 9834-9845.
6. Yassoglou N., et al. “Heavy metal contamination of roadside soils in the Greater Athens area”. Environmental Pollution 47.4 (1987): 293-304.
7. Nix J and Goodwin T. “The simultaneous extraction of Fe, Mn, Cu, Co, Ni, Cr, Pb and Zn from natural water for determination by atomic absorption”. Atomic Absorption Newsletter 9 (1970): 119-122.
8. Adrian WJ. “A comparison of a wet pressure digestion method with other commonly used wet and dry-ashing methods”. Analyst 98 (1973): 213-216.
9. APHA. “Standard methods for the examination of water and wastewater”. American Water Works Association, Water Pollution Con-trol Federation & Water Environment Federation. American Public Health Association (1995).
10. Parvinen P and Lajunen L. “Determination of sulfide as hydrogen sulfide in water and sludge samples by gas phase molecular AS”. Atomic Spectroscopy 15 (1994): 83-86.

212
Sugar Industry as a Source of Pollution: A Case Study, Elgenaid Sugar Factory, Gezira State, Sudan
Citation: Mohamed E Hassan., et al. “Sugar Industry as a Source of Pollution: A Case Study, Elgenaid Sugar Factory, Gezira State, Sudan”. EC Pharmacology and Toxicology 4.5 (2017): 202-212.
11. Påhlsson AMB. “Toxicity of heavy metals (Zn, Cu, Cd, Pb) to vascular plants”. Water, Air, and Soil Pollution 47.3-4 (1989): 287-319.
12. Ahlers W., et al. “Contamination-free sample collection and handling protocols for trace elements in natural fresh waters”. Marine and Freshwater Research 41 (1990): 713-720.
13. Spear P. “Zinc in the aquatic environment: chemistry, distribution, and toxicology”. 17589: NRCC Associate Committee on Scientific Criteria for Environmental Quality (1981)
14. Jones R and Burgess MS. “Zinc and cadmium in soils and plants near electrical transmission (hydro)”. Environmental Science and Technology 18.10 (1984): 731-734.
15. Inoue T and Ebise S. “Runoff characteristics of COD, BOD, C, N and P loadings from rivers to enclosed coastal seas”. Marine Pollution Bulletin 23 (1991): 11-14.
Volume 4 Issue 5 October 2017© All rights reserved by Mohamed E Hassan., et al.