sugar and spice - inpe
TRANSCRIPT

>
Sugar and SpiceTrade Comes to the Sugarscape
Like the other animals, we find and pick up what wecan use, and appropriate territories. But unlike theother animals, we also trade and produce for trade.
Jane Jacobs, Systems of Survival [ 1992: xi)
In the previous chapters we have studied simple agents having local
rules for movement, sex, cultural exchange, and combat. In this chapter, we explore another crudal sodal behavior: trade. So far, our
methodology has been to postulate one or more agent rules and thenstudy the sodety that unfolds. Sometimes we presented a "target" sodaloutcome before providing any rules (for example, the "proto-history"),while at other times we argued that the rules themselves were of interest
since they were in some sense simple or minimal (for example, themovement rule M ).
In this chapter, we proceed somewhat differently. We draw on neoclassical microeconomic theory for rules governing agent trade behavior
.1 These rules mediate the interaction of infinitely lived agents whohave unchanging, well -behaved preferences that they truthfully revealto one another and who engage in trade only if it makes them better off(technically, trade must be Pareto-improving ). Howeyer, instead of theneoclassical stipulation that the agents interact only with the price system
- that is, all agents are price-takers - we implement trade as occur-ring between neighboring agents at prices determined locally by a simplebargaining rule} Individual agents do not use any nonlocal price infor -
1. In some agent-based computer simulations the term Ntrade" is used loosely, todenote any interagent transfer of internal stocks, independent of whether the agents haveany internal mechanism for computing the welfare associated with such transfers. This isnot a usage of interest to economists.
2. Kirn1an [1994], in his review of the literature on economies with interacting agents,suggests that Nmodels in which agents interact with each other directly rather than indirectly
through the market price mechanism provide a rich and promising class of alternatives which may help us to overcome some of the difficulties of the standard models."
SUGAR AND SPICE: TRADE COMES TO THE SUGARS CAPE 95
mation in their decisionmaking. Because price fonnation is local, this isa model of completely decentralized exchange between neoclassical agents.Later we relax some of the least realistic aspects of the neoclassical setup
; for example, giving the agents finite lives and nonfixed preferences.The main issue we address is the extent to which interacting agents
are capable of producing socially optimal outcomes, that is, allocations ofresources having the property that no agent can be made better offthrough further trade. The artificial societies modeling approach allowsus to explore such questions systematically and reproducibly. Inparticular
, we compare the perfonnance of distinct classes of agents- neoclassical agents and various non -neoclassical ones. We find that neoclassical
agents trading bilaterally are able to approach, over time, a price close tothat associated with an optimal allocation. However, when the agentsare made progressively less neoclassical- when they are pemlitted tosexually reproduce or have culturally varying preferences- the marketsthat emerge generally have suboptimal perfonnance for indefinite periods
of time.Such results have important implications. First and foremost, the
putative case for laissez-faire economic policies is that, left to their owndevices, market process es yield equilibrium prices. Individual (decentralized
) utility maximization at these prices then induces Pareto optimalallocations of goods and services. But if no price equilibrium occurs, thenthe efficiency of the allocations achieved becomes an open question andthe theoretical case for pure market solutions is weakened.
We also investigate the effect of trade on variables studied in previouschapters. We find that the canying capacity of the resource-scape isincreased by trade, but so is the skewness of the wealth distribution. Moreagents exist in a society that engages in trade, but the resulting society ismore unequal. Furthennore , the markets that result from our local traderule generate horizontal inequality - agents with identical endowmentsand preferences end up in different welfare states. Importantly , the welfare
theorems of neoclassical economics do not hold in such markets.When agents are allowed to enter into credit relationships with one
another- for purposes of bearing children- interesting financial networks emerge. Some agents end up as pure lenders, others as pure borrowers, and many turn out to be both lenders and borrowers. Indeed,
entire financial hierarchies emerge within the agent society.It seems natural to think of market process es as a fonn of social computation
, with the agents operating as distributed processing "nodes"and the flow of commodities serving as inter-node communication . Each

node (agent) executes a local optimization algorithm (purposive behavior), attempting to maximize a local objective (utility ) function through
decentralized interactions with other nodes (agents). The market as awhole- the sodal computer- tends toward a globally optimal allocationof goods, as if it were "attempting" to compute such an allocation. In thischapter we study how the success of this sodal computation depends onagent spedfications.
Spice: A Second Commodity
129.5' 78' 129.5' 78' 129.5' 78' 129.5' 78' 129.5' 78'
96 SUGAR AND SPICE: TRADE COMES TO THE SUGARSCAPE
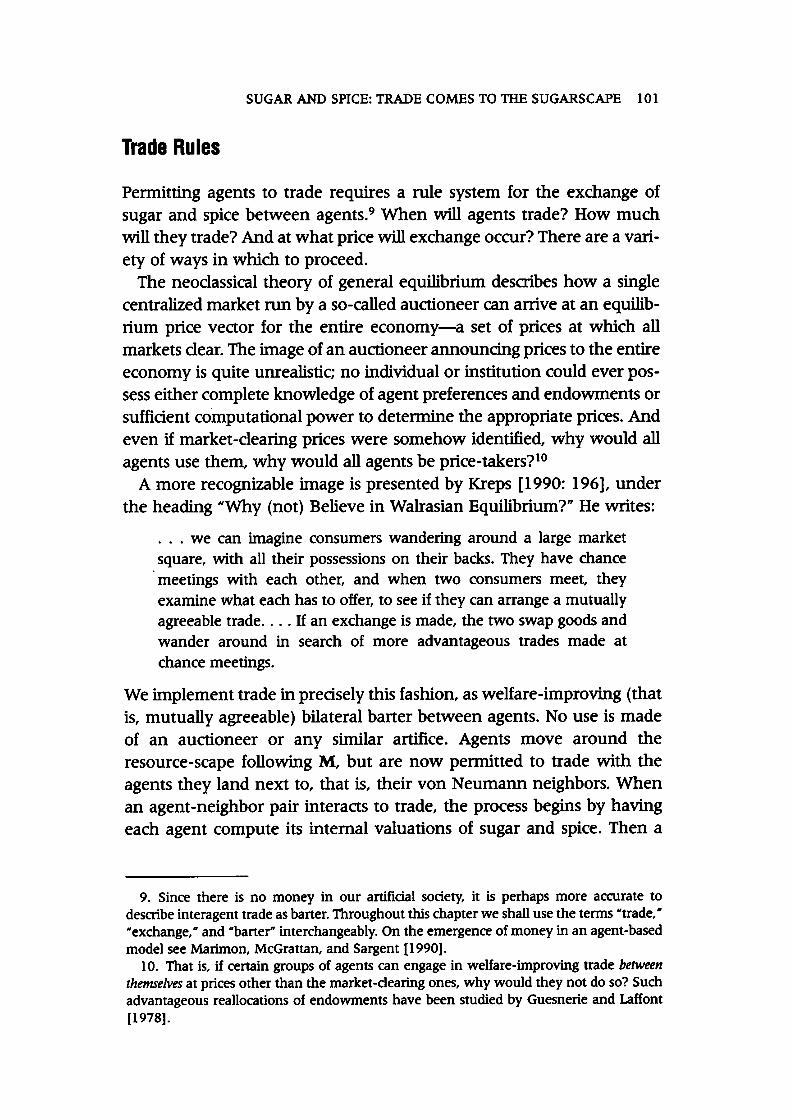
Figure IV - I . Sugar Mountains in the Northeast and Southwest, Spicein the Northwest and Southeast
To begin , since trade involves an exchange of distinct items between individuals, the first task is to add a second commodity to the landscape. This
second resource, I Ispice," is arranged in two mountains opposite the original sugar mountains , as depicted in figure IV- l .3 At each position there is
a sugar level and capacity, as before , as well as a spice level and capacity.Each agent now keeps two separate accumulations , one of sugar and
one of spice, and has two distinct metabolisms , one for each good . These
3. An infinite variety of other arrangements of the resources is possible, of course, andwe have experimented with various topographies. However, the configuration depicted infigure IV- I will be used exclusively here. While the details of particular model runs areintimately intenwined with the economic geography employed, the qualitative characterof the results does not depend on any particular topography.

metabolic rates are heterogeneous over the agent population , just as inthe single commodity case, and represent the amount of the commodities
the agents must consume each period to stay alive. Agents die ifeither their sugar or their spice accumulation falls to zero.
Welfare
where my = m] + m2. Note that this is a Cobb-Douglas functional fonn .The metabolisms make an agent's welfare dependent upon its biology injust the way we want ; that is, if an agent has a higher metabolism forthe first commodity (sugar) than for the second (spice), then it views asite having equal quantities of sugar and spice as if there were relatively
less sugar present.This welfare function is state-dependent insofar as the arguments
(w],w) denote accumulated quantities of the two commodities, notinstantaneous consumption. This gives the agents the behavioral characteristic
that as they age, for example, and accumulate wealth, they
SUGAR AND SPICE: TRADE COMES TO mE SUGARSCAPE 97
The Agent ~ Function
W(WI' W2) = WI"llm T W Y' llm T,
4, This will be made precise below in the discussion of "internal valuations,.
We now need a way for the agents to compare their needs for the twogoods. A "rational" agent having, say, equal sugar and spice metabolismsbut with a large accumulation of sugar and small holdings of spiceshould pursue sites having relatively more spice than sugar. One way tocapture this is to have the agents compute how "close" they are to starving
to death due to a lack of either sugar or spice. They then attempt togather relatively more of the good whose absence most jeopardizes theirsurvival. In particular, imagine that an agent with metabolisms (m], m2)and accumulations (W], W2) computed the "amount of time until deathgiven no further resource gathering" for each resource; these durationsare just T] = w]/m] and T2 = w2/m2' The relative size of these two quantities
, the dimensionless number T]IT2, is a measure of the relativeimponance of finding sugar to finding spice. A number less than onemeans that sugar is relatively more important , while a number greaterthan one means that spice is needed more than sugar.
An agent welfare function giving just these relative valuations at themargins is4

In other words, given an agent with some sugar wealth WI and spicewealth W2' every position within the agent's vision is inspected and theagent calculates what its welfare would be were it to go there and collect
the sugar and spice. Expression (2) says simply that the agent selectsthe site produdng maximum welfare.6 As in the case of a single commodity
, if there are several sites that produce equal welfare then the firstsite encountered is selected. Overall, the new movement rule for eachagent is as follows.
Multicommoditv agent movement rule M : 7. Look out as far as vision permits in each of the four lattice
directions, north , south, east, and west;
5. Derivations in Appendix C give fonnal conditions under which an agent facing identical (distributions of) resource levels at distinct times in its life will rank sites differently
due solely to changes in its wealth.6. It is possible to unify the one and two commodity cases conceptually by imagining
that in the fonner case the agents are "optimizing" a welfare function that has just oneargument; that is,
( )W w;m = wm.
7. We use M to symbolize all variants of the movement rule. In the Sugarscape software system the number of commodities, n, is a useradjustableparameter, and so M has
actually been implemented as the n-dimensional analog of expression (2).
98 SUGAR AND SPICE: TRADE COMES TO mE SUGARSCAPE
view the same resource site differently .5 This state-dependence, while adeparture from the utility function usual in neoclassical economics, is anatural way to represent preferences for agents who do not consumetheir entire commodity bundle each period.
The Agent Movement Rule in the Presence of Two Commodities
Given this welfare function , the movement rule followed by the agentsis identical to what it was in the simple one commodity case, namely,look around for the best position and move there. The only difference inthe two commodity case is that establishing which location is "best"
involves evaluating the welfare function at each prospective site. Let sdenote a site, with xl and xl the sugar and spice levels at that site.Fonnally, the agents perfonn an optimization calculation over the sitesin their vision-parameterized neighborhood, N VI according to
max W(w] + xl, w2 + xl ) . (2)se Nv

8. Below we show that the general effect of trade is indeed to augment the carryingcapacity.
SUGAR AND SPICE: TRADE COMES TO THE SUGARSCAPE 99
. Considering only unoccupied lattice positions, find the nearest position producing maximum welfare;
. Move to the new position;
. Collect all the resources at that location.
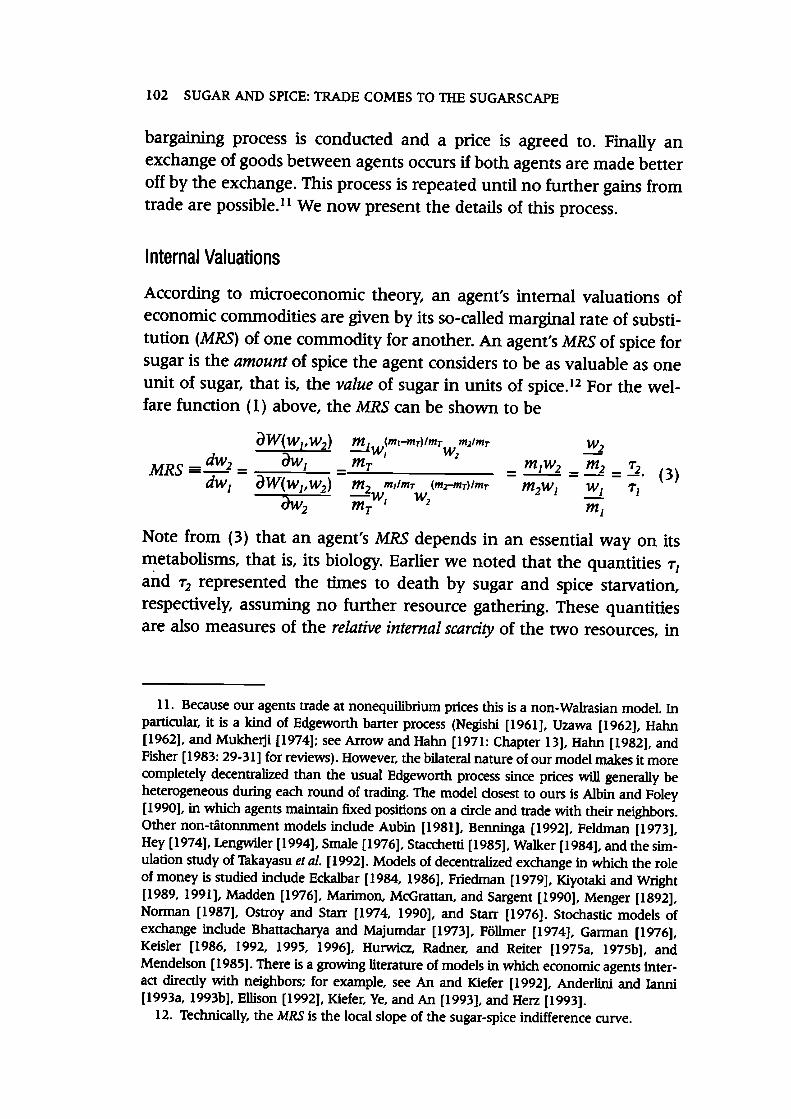
Now we study how the addition of the second commodity affects individual movement dynamics. To see that the effect is profound, one need
only look at a particular run of the model, such as animation IV- I . Herevision is uniformly distributed in the agent population between I and10, while metabolism for each of the two commodities is unifom1ly distributed
between I and 5. A black tail is attached to one arbitrarily chosen agent, a so-called observational agent, to highlight the complexity of
individual trajectories.The agents search locally for the spot that makes them best off and they
move there. However, because of the spatial separation of the tworesources, agents move back and forth between the two types of mountains
: Staying on one mountain for an extended period of time augmentsthe agent's holdings of one commodity but dissipates its holdings of theother, forcing it to migrate. Note that if one were to average the observation
~l agent's location over time its mean position would fall somewherebetween the two types of mountains, despite the fact that the agentspends precious little time at such locations. That is, spatio-temporal averaging
gives us little understanding of actual agent behavior.The carrying capacity of this landscape is lower than in the single
commodity (sugar-only ) case, because there are now two ways to die,namely, by running out of either resource. A common route to death onthe two -resource landscape is for an agent to run low on one of theresources while "s.tocking up" on the other and then find itself in aregion of the resource-scape where there is a low density (and a flat gradient
) of the needed good: having eaten its way deep into a high sugar(low spice) zone, the agent dies of spice deprivation, for example. Mostagents in animation IV- I never suffer this fate. When spice depletionthreatens they have sufficient vision to find spice rich zones and replenish
their stocks. Of course, there is another way agents might obtaincommodities they need: through trade.8

II
IIjII
!;
100 SUGAR AND SPICE: TRADE COMES TO THE SUGARSCAPE
6I~z.~~~..n,~z.~~~..o,~z.~~~..n,~z.~~~..n,~z.~~~..n ,~z.~~~..n,~z.~~~..n,~z.~~~..n,~z.~~~..o,~z.~~~..n
. . .
. . .
.... ... .. . . .. ... . .. ... . .. .. .... .. ... .. ... .. .. ..
.. ..,.. ... .. ... ... ....... . ' ..... ..'. . 'I . ... .. .. ..-. I : .. ... . .... ... .. . .. . .. .
.. ..
.. .
. .
. . . .
. .
.. . .
.. .
. . . .
. .
... .
. . .
. . .
..
.. ... ... ... .. ... .. .. ..
. . .
. .
.. .
. .
. . .
.. .
.. . .
..
......... .... .- ---. ...- ... . .. . .. .. . ... .. .. ..... .. .. . ... .. ..... -.
.
.... .
.;. . ... ... .. I . .. . .. .. . "... ,. ... . .. ...... ... - ... . .
. ... .
. .
.. . .
. . . . .
. . . .
.. .
. .
. .
. . . .
. . . .
. . . .. .
. .. .. ....... l... .. ... .... ... . l ....
... .. .
..
.
.... ..... ...... .. ....
. .: - . I. ..
....
. -.
....
.
-.
. ..
.. .. . .... ... .. . . .. . ... . .. ... ... .... . .1I""...1. . ~.... . ~.. . ... .. ...... .... ... .. .. ... ... . ... ... .. . ....... .... . . ... . . .. ... ..... .. ... "-. .. " .- -,.. . .... .... . .. . ....... ... .. . .. ... .... ...... . ..
.
12345678901234567890121456789012345678901214567890
IJ
' ~Z. S 7R9DI~Z. S 7R90' ~Z.S 7R9DI~Z. S 7R9DI~Z.S 7R9D
1
!!
I12145678901214567890121456789012145678901214567890
.. .... . .. ... . ... .... .' ~Z. ~ 7AQnl ~Z. ~ 7AQn' ~Z. ~ ~A Qn' ~Z. ~ 7AQn' ~Z. ~ 7AQn
m
.. - . -
..
Animation IV-I . Elaborate Trajectory of an I I Observational1lAgent in the Case of Both Sugar and Spice Present under RuleSystem ({GI}, {M})
Permit ting agents to trade requires a rule system for the exchange ofsugar and spice between agents.9 When will agents trade? How muchwill they trade? And at what price will exchange occur? There are a variety
of ways in which to proceed.The neoclassical theory of general equilibrium describes how a single
centralized market run by a so-called auctioneer can arrive at an equilibrium price vector for the entire economy- a set of prices at which all
markets clear. The image of an auctioneer announcing prices to the entireeconomy is quite unrealistic; no individual or institution could ever possess
either complete knowledge of agent preferences and endowments orsuffident computational power to determine the appropriate prices. Andeven if market -clearing prices were somehow identified, why would allagents use them, why would all agents be price-takers?lO
A more recognizable image is presented by Kreps [1990: 196], underthe heading "Why (not ) Believe in Walrasian Equilibrium ?" He writes:
. . . we can imagine consumers wandering around a large marketsquare, with all their possessions on their backs. They have chancemeetings with each other, and when two consumers meet, theyexamine what each has to offer, to see if they can arrange a mutuallyagreeable trade. . . . If an exchange is made, the two swap goods andwander around in search of more advantageous trades made atchance meetings.
We implement trade in predsely this fashion, as welfare-improving (thatis, mutually agreeable) bilateral barter between agents. No use is madeof an auctioneer or any similar artifice. Agents move around theresource-scape following M , but are now pemlitted to trade with theagents they land next to, that is, their von Neumann neighbors. Whenan agent-neighbor pair interacts to trade, the process begins by havingeach agent compute its internal valuations of sugar and spice. Then a
9. Since there is no money in our artificial society, it is perhaps more accurate todescribe interagent trade as baner. Throughout this chapter we shall use the terms "trade,""exchange," and "banerw inter change ably. On the emergence of money in an agent-basedmodel see Marimon, McGrattan, and Sargent [1990].
10. That is, if cenain groups of agents can engage in welfare-improving trade betweenthemselves at prices other than the market-clearing ones, why would they not do so? Suchadvantageous reallocations of endowments have been studied by Guesnerie and Laffont[1978].
SUGAR AND SPICE: TRADE COMES TO THE SUGARSCAPE 101
Trade Rules
Internal Valuations
According to microeconomic theory, an agent's internal valuations ofeconomic commodities are given by its so-called marginal rate of substitution
(MRS) of one commodity for another. An agent's MRS of spice forsugar is the amount of spice the agent considers to be as valuable as oneunit of sugar, that is, the value of sugar in units of spice.12 For the welfare
function (1) above, the MRS can be shown to be
11. Because our agents trade at nonequilibrium prices this is a non-Walrasian model. Inparticular, it is a kind of Edgeworth baner process (Negishi [1961], Uzawa [1962], Hahn[1962], and Mukhelji [1974]; see Arrow and Hahn [1971: Chapter 13], Hahn [1982], andFisher [1983: 29-31] for reviews). However, the bilateral nature of our model makes it morecompletely decentralized than the usual Edgeworth process since prices will generally beheterogeneous during each round of trading. The model closest to ours is Albin and Foley[1990], in which agents maintain fixed positions on a drcle and trade with their neighbors.Other non-tatonnment models include Aubin [1981], Benninga [1992], Feldman [1973],Hey [1974], Lengwiler [1994], Smale [1976], Stacchetti [1985], Walker [1984], and the simulation
study of Takayasu et al. [1992]. Models of decentralized exchange in which the roleof money is studied include Eckalbar [1984, 1986], Friedman [1979], Kiyotaki and Wright[1989, 1991], Madden [1976], Marimon, McGrattan, and Sargent [1990], Menger [1892],Norman [1987], Ostroyand Starr [1974, 1990], and Starr [1976]. Stochastic models ofexchange include Bhattacharya and Majumdar [1973], Follmer [1974], Garman [1976],Keisler [1986, 1992, 1995, 1996], Hurwicz, Radner, and Reiter [1975a, 1975b], andMendelson [1985]. There is a growing literature of models in which economic agents interact
directly with neighbors; for example, see An and Kiefer [1992], Anderlini and Ianni[1993a, 1993b], Ellison [1992], Kiefer, Ye, and An [1993], and Herz [1993].
12. Technically, the MRS is the local slope of the sugar-spice indifference curve.
~ (m.-mr)/mr mz/mrW, Wz_mT-m2 m,/mr (mr-mr)/mr- W, WzmT
a W(Wl,W2) ~MRS = ~ = aWl = ~ = !!!l = .!J. (3)dWl a W(Wl,W2) m2wl WI 71
a W2 -m;Note from (3) that an agent's MRS depends in an essential way on its~ etabolisms, that is, its biology. Earlier we noted that the quantities 71and 72 represented the times to death by sugar and spice starvation,respectively, assuming no further resource gathering. These quantitiesare also measures of the relative internal scarcity of the two resources, in
102 SUGAR AND SPICE: TRADE COMES TO THE SUGARSCAPE
bargaining process is conducted and a price is agreed to. Finally anexchange of goods between agents occurs if both agents are made betteroff by the exchange. This process is repeated until no further gains fromtrade are possible. I I We now present the details of this process.

Table IV-I. Relative MR Ss and the Directions of Resource ExchangeMRS A > MRSB MRS A < MRSB
Action A B A BBuys sugar spice spice sugar- - -Sells spice sugar sugar spice
The Bargaining Rule and Local Price Formation
Having established the direction in which resources will be exchanged, itremains to specify a rule for establishing the quantities to be exchanged.The ratio of the spice to sugar quantities exchanged is simply the price.This price must, of necessity, fall in the range [MRSA, MR Ss] . To see this,consider the case of two agents, A and B, for whom MRSA > MR Ss. SinceA will acquire sugar from B in exchange for spice (see table IV- I ), itsMRS will , according to (3), decrease as a result of the exchange, whileB's MRS will increase. But A will not give up spice for sugar at just anyprice. Rather, the most spice it is willing to give up for a unit of sugar isprecisely its MRS; for one unit of sugar it is willing to trade any amountof spice below the quantity given by the MRS. Analogously for B: it iswilling to trade at any price above its MRS. Thus the range of feasibleprices is [MRSA, MR Ss] .
A rule for specifying exchange quantities, and therefore price, might
13. Note that whether a panicular agent is a sugar buyer or seller is completely endogenous- it depends on the MRS of the other agent with whom the exchange interaction
occurs.
SUGAR AND SPICE: TRADE COMES TO THE SUGARSCAPE 103
the sense that an agent whose MRS < 1, for example, thinks of itself asbeing relatively poor in spice.
When two agents, A and B, encounter one another- that is, whenone moves into the other's neighborhood- the MRS of each agent iscomputed. Here we treat these internal valuations as common knowledge
; that is, the agents truthfully reveal their preferences to one another. If MRS A > MRSB then agent A considers sugar to be relatively
more valuable than does agent B, and so A is a sugar buyer and a spiceseller while agent B is the opposite.13 The general conditions are summarized
in table IV- I . As long as the MR Ss are not the same thereis potential for trade; that is, one or both of the agents may be madebetter off through exchange.

The primary result of this rule is to moderate the effect of two agentshaving vastly different MR Ss.15 It turns out that it is more naturalto work with 'iT = In(p), and in describing our artificial economy belowwe shall compute statistics for 'iT .16
Finally, with the price detennined, we need to spedfy the actual quantities of sugar and spice to be exchanged. Here we add the element of
indivisibility by stipulating that each exchange involve unit quantity ofone of the commodities. In particular, for p > 1, P units of spice areexchanged for 1 unit of sugar. If p < 1, then 1 unit of spice is exchangedfor I Ip units of sugar.
The Trade AlgorithmGiven that two agents have I I bargain ed to" a price, and thereby specifiedthe quantities to be exchanged, the trade only goes forward if it makesboth agents better off. That is, trade must improve the welfare of bothagents. Furthermore, since discrete quantities are being traded, and
p(MRSA,MRSB) = V MR SAM R S Bo
14. There exists an enormous literature on bilateral bargaining when agents haveincomplete information. A good introduction is Osborne and Rubinstein [1990], whileimportant papers are reprinted in Linhan, Radner, and Sattenhwaite [1992]; see also Gale[1986a, 1986b] and Binmore and Dasgupta [1987]. Since our agents truthfully reveal theirpreferences we do not make use of these ideas here. Clearly this is an important topic forfuture work.
15. We have also experimented with a bargaining rule that simply picks a randomnumber from the interval [MRSA, MRSB]. The qualitative character of the results reponedbelow is insensitive to this change.
16. To see this, note that trading 10 units of spice for one sugar (p = 10) should betreated as equally distant from p = 1 as trading 10 sugars for one spice (p = 1/10).With P = In(p), this requirement is met since m(10) - In(l ) = In(l ) - In(1/10).
104 SUGAR AND SPICE: TRADE COMES TO THE SUGARSCAPE
be called a bargaining rule since it can be interpreted as the (adaptive)way in which two goal-seeking agents instantiate a price from the rangeof feasible prices. 14 While all prices within the feasible range are " agreeable" to the agents, not all prices appear to be equally "fair." Prices neareither end of the range would seem to be a better deal for one of theagents, particularly when the price range is very large. Following Albinand Foley [1990], we use as the exchange price the geometric mean of theendpoints of the feasible price range. That is, the trading price, p, isdetennined according to

A~ent trade rule T:. Agent and neighbor compute their MR Ss; if these are equal
then end, else continue;. The direction of exchange is as follows: spice flows from the
agent with the higher MRS to the agent with the lower MRSwhile ,sugar goes in the opposite direction;
. The geometric mean of the two MR Ss is calculated- this willserve as the price, p;
. The quantities to be exchanged are as follows: if p > 1 thenp units of spice for 1 unit of sugar; if p < 1 then I Ip units ofsugar for 1 unit of spice;
. If this trade will (a) make both agents better off (increases thewelfare of both agents), and (b) not cause the agents' MR Ss tocross over one another, then the trade is made and return tostart, else end.
Note that the bargaining rule constitutes step 3 of the algorithm .19
For a graphical interpretation of T, consider the so-called Edgeworthbox shown in figure N -2. Here agent A has sugar-spice endowment of(5, 8), while agent B possess es (15, 2). The red line intersects A' s endowment
and is A' s line of constant utility ; that is, A is indifferent betweenits endowment and all other sugar-spice allocations on the red line. Anyallocation below this line is unacceptable to A since such an allocationwould yield less welfare than A enjoys at its present position. All allocations
above the isoutility line are preferred by A to its current allocation.
17. That is, given MRSA > ) MRSB, agents stop trading if one additional trade willmake MRSA MRSB.
18. Heretofore, we have described all rules for the agents and the sugarscape as .sim-
pIe local rules.. We would like it if the trade algorithm T could also be described in thisway, but realize that one can reason ably say that this rule, although completely local, ishardly simple (requiring, for example, partial differentiation, computation of square root S,and so on). Perhaps it is better described as being the simplest local rule in the neoclassical
spirit.19. It is possible to substitute other bargaining rules simply by repladng this step.
SUGAR AND SPICE: TRADE COMES TO THE SUGARSCAPE 105
therefore repeated exchange may never lead to identical agent MR Ss,special care must be taken to avoid infinite loops in which a pair ofagents alternates between being buyers and sellers of the same resourceupon successive application of the trade rule. This is accomplished byforbid ding the MR Ss to cross over one another.17 Putting all this together
we have:ls

B
8
.
2
3
6 .
4
.
5
4 .
2
A
0
2 . 5 5 7 . 5 10 12 . 5 15 17 . 5 20
Analogously, B prefers allocations that are below the blue line, its isoutil -ity curve. From any initial endowments we can draw A' s and B's isoutil -ity curves. For some endowments the area between the curves will belarger than that shown in figure 1V-2, while for others it will be smaller.When initial endowments fall on the gray line, the so-called contractcurve, the agents' isoutility curves are exactly tangent- the MR Ss of thetwo agents coincide. At these positions there is zero area between theagents' isoutility curves and, as a result, there are no potential gainsfrom trade .20
From point 1, each application of rule T moves the agents to progressively higher welfare states, first to position 2, then to 3, and so on until
finally they reach position 5. Additional trading, beyond 5, would causethe agents' MR Ss to cross over, and so is not allowed.21 When T resultsin allocations for agents A and B that are on the contract curve, we say
106 SUGAR AND SPICE: TRADE COMES TO THE SUGARSCAPE
Figure IV-2.according to Rule T10
20. For a detailed discussion of the Edgeworth box, see Kreps [ 1990: 152- 53, 155- 56] .21. One might reason ably wonder why we have built T to take only incremental steps
toward the contract curve, instead of jumping directly to it . One rationale is to limit the complexity of our agents; in making small welfare improving trades they use only the local shape
of their welfare function in the vidnity of their endowment. They then make a relativelysmall trade and recompute their marginal valuations with respect to their new holdings.
Edgeworth Box Representation of 1Wo A~ents 1radin~

near Pareto optimality has been attained locally.Rule T specifies how two agents interact to trade. It remains to specify
which agents interact through T. All the rules of agent interaction thatwe have described so far- rules for sexual reproduction, for culturalinterchange- involve local interaction, and here we shall not deviatefrom this pure bottom-up approach. When an agent following M movesto a new location it has from 0 to 4 (von Neumann) neighbors. It interacts
through T exactly once with each of its neighbors, selected in random order.23
The Sugarscape interagent trade rule can be summarized as follows: Ifneighboring' agents have different marginal rates of substitution thenthey attempt to arrange an exchange that makes them both better off .Bargaining proceeds and a trade price is "agreed" to. Quantities of sugarand spice in proportion to the trade price are specified for exchange. Ifexchange of the commodities will not cause the agents' MR Ss to crossover then the transaction occurs, the agents recompute their MR Ss, andbargaining begins anew. In this way nearly Pareto optimal allocationsare produced locally.
With these micro-rules in place we are now in a position to study theaggregate or market behavior of neoclassical agents engaged in bilateraltrade. How will prices evolve in such markets? WIll trade volumes varyregularly or erratically? Rule T stipulates that individual agents aremade better off through trade, but will the society of agents as a whole beable to extract the full welfare benefits of trade? How sensitive willmarket performance be to neoclassical assumptions about agents? Theseare the questions to which we now turn .
SUGAR AND SPICE: TRADE COMES TO THE SUGARSCAPE 107
that local Pareto optimality has been achieved.22 When the allocations produced by T are just off the contract curve, as in figure IV-2, we say that
22. In this usage local Pareto optirnality is synonymous with pairwise or bilateral Paretooptimality; see Feldman [1973] and Goldman and Starr [1982].
23. A variant of this would let an agent engage in T with a neighboring agent multipletimes during a single move. For example, sayan agent has 2 neighbors and trades withone of them according to T, that is, until they have approximately equal MR Ss. Then theagent turns to the other neighbor and interacts with it following T. After the second set oftrades is complete the agent's MRS will be different from what it was at the tennination oftrade with the first neighbor, and therefore it may be feasible to trade further with this firstneighbor. The agent is permit ted to do so, and it switch es back and forth between itsneighbors until no more gains from trade are possible. In this variant, the active agentwould act as a kind of arbitrageur between its two neighbors.
Markets of Bilateral Traders
General equilibrium theory describes how a centralized market run byan idealized auctioneer can arrive at an equilibrium price. The immediate
question for us - having banished the auctioneer and all other typesof nonlocal information - is whether our population of spatially distributedneoclassical agents can produce anything like an equilibrium price through localinteractions alone. It turns out that there is a definite sense in which theycanl However, the character of the equilibrium achieved by our agentsis rather different from that of general equilibrium theory, for themarkets which result produce less than optimal agent welfare- thepotential gains from trade are not fully extracted- despite essential con-vergence'to the general equilibrium price. Furthermore, when we relaxcertain neoclassical assumptions (infinitely lived agents, fixed preferences
) overall market performance is further degraded.
Neoclassical Agents and Statistical Price EquilibriumOn the sugar-spice landscape we randomly place a population of 200infinitely lived agents, having Cobb-Douglas utility functions given by(I ), with behavioral rules M and T. Metabolisms for sugar and spice areuniforn1ly distributed in the agent population between I and 5. This hasthe effect of making preferences symmetrical, that is, there are as manyagents who prefer sugar to spice as there are who prefer the reverse.Vision is also uniforn1ly distributed between I and 5. Initial endowmentsare randomly distributed between 25 and 50 for both sugar and spiceand are thus also symmetrical with respect to the two resources.Therefore, since there is approximately the same amount of sugar andspice present on the landscape, the symmetry of preferences andendowments implies that the general equilibrium price of sugar to spicewill be about I , varying somewhat from time period to time period} 4
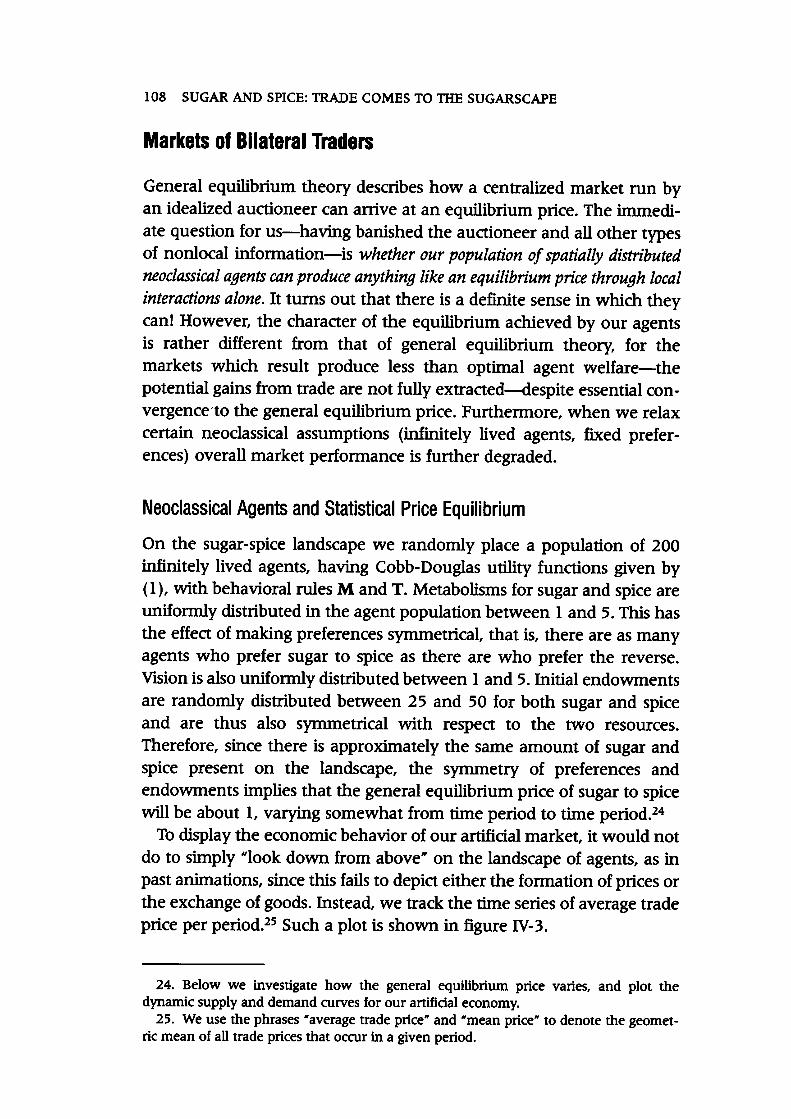
To display the economic behavior of our artificial market, it would notdo to simply "look down from above" on the landscape of agents, as inpast animations, since this fails to depict either the formation of prices orthe exchange of goods. Instead, we track the time series of average tradeprice per period} 5 Such a plot is shown in figure N -3.
108 SUGAR AND SPICE: TRADE COMES TO mE SUGARSCAPE
24. Below we investigate how the general equilibrium price varies, and plot thedynamic supply and demand curves for our anificial economy.
25. We use the phrases Naverage trade price" and Nmean price" to denote the geomet-ric mean of all trade prices that occur in a given period.

. ., .:'Ie' . ...t . -.."If .. .~ . .- .-. -. ' , ~ . . .,. 0: 'I.. . 'a:~. ~I M~~~;~~~~~-, ,~p~~,~~~~~. .J . . .. .,~ .. ... ~ . "- ~. . ".~ . #d:1'-1,\" ."-8.. .." ..' -.,'le." . .1 1.'. . ~. .. . ... , . . . - ... . . ~.... . . . w-.). . . .I.. .
0 200 400 600 800 1000
infinite.27. Because agents are infinitely lived in this run of the model, the
in price will never reach a stationary value but will continue to fall.standard
Time
Another way to look at how prices converge toward the general equilibrium level is to plot the standard deviation in the logarithm of the
average trade price per period. For the previous run , this is shown in figure IV-5. Here, and in all subsequent plots of price standard deviation
time series, raw data are shown in black with smoothed data in red.While the standard deviation in price never vanish es, it does tend to stabilize
at a relatively small value, averaging about 0.05 by t = 1 000} 71n thiscase it would seem unobjectionable to say that a price equilibrium
is essentially attained by this market. Economic equilibrium emergesfrom the bottom up.
26. Actually, the distribution of trade volume is non station arv when a2ent lifetimes are
deviation
SUGAR AND SPICE: TRADE COMES TO THE SUGARSCAPE 109
Typical Time Series for Avera~e Trade Price under RuleFigure 1V-3.System ({G1), {M, T})Mean Price
2
1.2
1.
Note that initially there is significant variation in prices but that overtime prices tend to bunch around the "market-clearing" level of 1. Thetotal volume of trade is quite large, with nearly 150,000 trades occurringover the time shown in figure 1V-3. There is extensive variation in tradevolume per period, as shown in figure 1V-4. Trade volumes are distributed
approximately log normally, with a few big trade periods and lots ofsmaller ones.26

400
350
300
250 !
i
,
200
15
10
200 400 600 800 1000
Time
t~nn ~rn
.
.
.
.
.
200 400 600 800
Typical Time Series of Trade Volume under Rule System
Volume
Figure 1V-5. . Deviation in the
Standard Deviation1.2
1
0.8
0.6
0.4
0.2
lO OO Time
Typical Time Series for the SLo~arithm of Avera~e Trade Price under Rule System ({GI), {M, T})
Figure 1V-4.({GI}, (M, T})

rformance Toduced
Carrying Capacity Is Increased by TradeIn Chapter II we found that the notion of carrying capacity emerged naturally
on the sugarscape} 9 Here we study the effect of trade on the carrying capacity. We do this by noting the number of agents who survive
in the long run, first with trade turned off, then with it turned on. Figure1V-6 .is a plot of the dependence of carrying capacity on average agentvision, the lower line representing the no-trade case, the upper line thewith -trade case.
Clearly, trade increases the carrying capacity. This result is in accordwith intuition . It was argued earlier that trade was a way for agents toavoid death due to a deficiency in one commodity. To see how this isso, imagine a pair of neighboring agents. Agent I has an abundance ofsugar but is close to death by spice deprivation; Agent 2 has a surfeit ofspice but is on the verge of death through sugar deprivation. If trade isforbidden then each will die. Clearly, however, an exchange of Agent I 'ssugar for Agent 2's spice will keep both alive. This is how trade increases
the carrying capacity of the sugar-spice scape.Let us now discuss the nature of the equilibrium produced by com-
28. It is usual in economics to associate the Smithian invisible hand with welfare properties of markets, and we do this below. Our usage here has more in common with what
Nozick [1974, 1994] calls an Ninvisible-hand process.. For an excellent discussion ofSmith's varied usage of the term . invisible hand,. see Rothschild [1994].
29. In figure 11-5 we presented the dependence of carrying capacity on vision andmetabolism distributions in the agent population. As average vision increased and meanmetabolism decreased, the carrying capacity increased.
of Markets P by Neoclassical Traders
markets.
SUGAR AND SPICE: TRADE COMES TO THE SUGARS CAPE III
The Invisible HandThere is a sense in which this completely decentralized, distributedachievement of economic equilibrium is a more powerful result than isoffered by general equilibrium theory, since dynamics of price formationare fully accounted for, and there is no recourse to a mythical auctioneer
. This result harks back to Adam Smith and the classical economistswhose image of markets involved no such entity.28
Having seen typical price-volume time series for markets of neoclassicalagents engaged in bilateral trade, we now investigate the nature of these

equilibrium.
Statistical EquilibriumThe equilibrium concept used in general equilibrium theory is a deterministic
one. That is, once the auctioneer announces the market-clearingprice vector, all agents trade at exactly these prices. Each agent endsup with an allocation that cannot be improved upon. That is, a Pareto-
optimal set of allocations obtains. Because these allocations are optimal,no further trading occurs and the economy is said to be in equilibrium .Overall, equilibrium happens in a single trade step.30
In the model of bilateral exchange described above, each agent tradesnot at the general equilibrium price but rather at a locally negotiated one.Imagine that it is some particular agent's turn to move, and you must predict
the exact price at which its next trade will occur. This price dependsnot only on that agent's own internal valuation (MRS) but also on that ofits trading partner. Predicting the actual trade price involves predictingwho this neighbor is likely to be, that agent's MRS, and so on. With anything
less than a complete description of the entire state space of the arti-fidal sodety, this calculation can only be made probabilistically.
Recently, Foley [1994] has advanced a novel theory of statistical eco-
30. For a classic exposition, see Arrow and Hahn
Carrying Capacity200
175
150
125
100
75
50
25
0
pletely decentralized trade . It is of a profoundly different character than
[1971].
2 4 6 8 lO Mean Vision
the Walrasian general
112 SUGAR AND SPICE: TRADE COMES TO mE SUGARSCAPE
Figure 1V-6. Carrying Capacity as a Function of Mean Agent Vision,with and without Trade, under Rule System ({GI}, {M , T})

Horizontal InequalityFoley [1994] has introduced the term horizontal inequality to describe thefact that agents having identical abilities (vision in our model), preferences
(parameterized by metabolism in Sugarscape), and endowmentswill generally have different welfare levels in statistical equilibrium , a
phenomenon that is strictly prohibited in Walrasian general equilibrium .
Differences in final consumption and welfare in Walrasian competitive equilibrium always correspond to differences in initial endowments
. But trading at different price ratios leads agents with the sameinitial endowments to different consumption and utility levels. [Foley1994: 342]
31. This is to be distinguished from the theory of stochastic general equilibrium underincomplete information; for a review see Radner [1982].
32. See Varian [1984: 198-203] for the welfare properties of Walrasian equilibria.33. The First Welfare Theorem is commonly referred to as the "invisible hand theorem"
[Stokey and Lucas 1989: 451- 54]. This suggests that decentralized trade must arrive- asif "led by an invisible hand" [Smith 1976: 456]- at Walrasian equilibrium. Our market ofdecentralized trade cenainly does not arrive there.
SUGAR AND SPICE: TRADE COMES TO THE SUGARSCAPE 113
nomic equilibrium that has much in common with economic behaviorobserved in our model.31 He has argued that general equilibrium theory
is I Imethodologically too ambitious" in that it attempts to computethe allocation for each agent exactly. Indeed, such computations wouldseem intractable in the relatively simple case of our artificial economy,to say nothing of the real world .
This brings us to the so-called First Welfare Theorem of neoclassicaleconomics.32 This result is the foundation for economists' claims thatmarkets allocate goods to their optimal social uses. The theorem statesthat Walrasian equilibria are Pareto-efficient. They are states in which noreallocation exists such that an agent can be made better off without making atleast one other agent worse off. But in statistical equilibrium
the First Welfare Theorem should be revised to say that a market equilibrium approximates but cannot achieve a Pareto-efficient allocation.
How close a given market comes to Pareto-efficiency can be measuredby the price dispersion in transactions. [Foley 1994: 343]
It is exactly this price dispersion that we studied above and will investigate further below in the context of non-neoclassical agents. Thus the
philo~ophical underpinning for laissez-faire policies appears to be weakfor markets that display statistical equilibrium .33
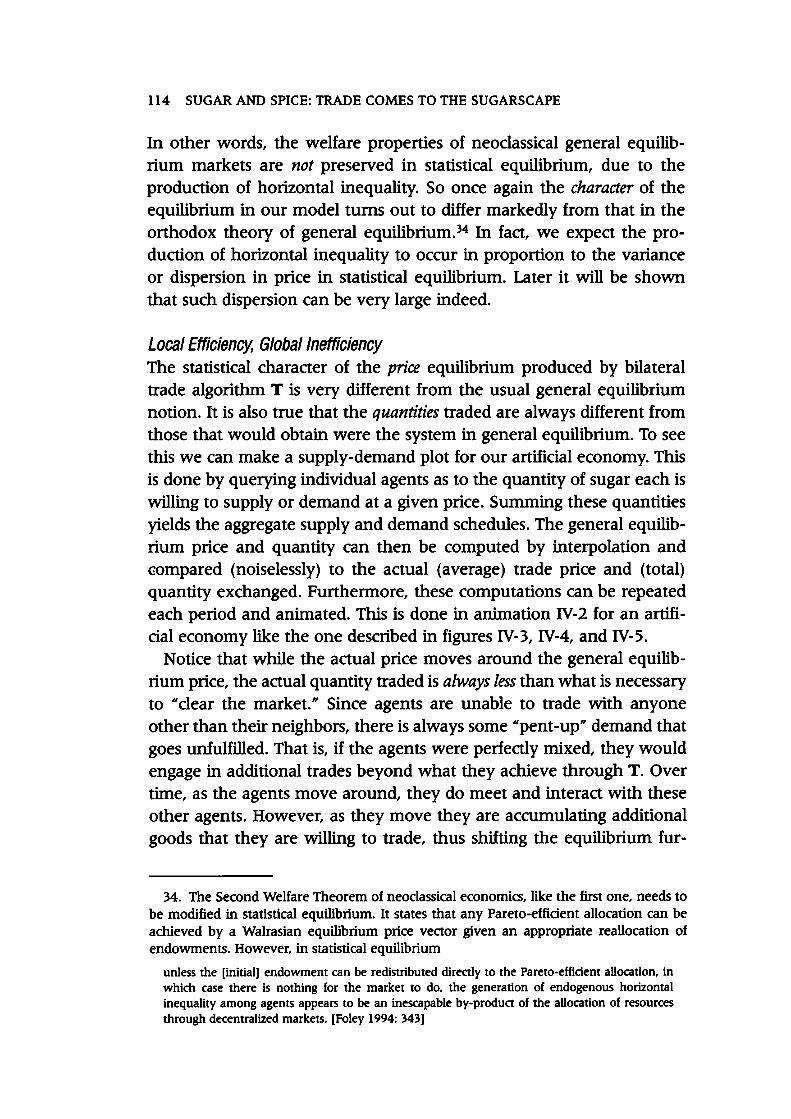
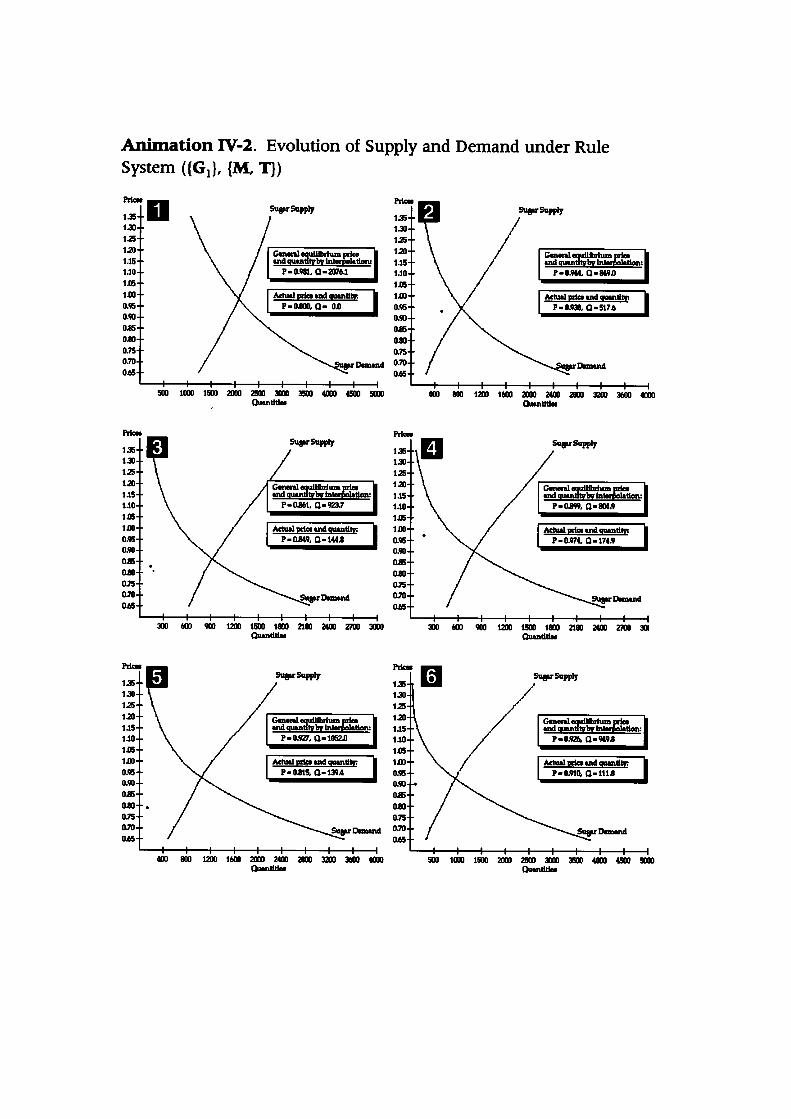
Local Efficiency, Global InefficiencyThe statistical character of the price equilibrium produced by bilateraltrade algorithm T is very different from the usual general equilibriumnotion . It is also true that the quantities traded are always different fromthose that would obtain were the system in general equilibrium . To seethis we can make a supply-demand plot for our artificial economy. Thisis done by querying individual agents as to the quantity of sugar each iswilling to supply or demand at a given price. Summing these quantitiesyields the aggregate supply and demand schedules. The general equilibrium
price and quantity can then be computed by interpolation and<:ompared (noiselessly) to the actual (average) trade price and (total )quantity exchanged. Furthermore, these computations can be repeatedeach period and animated. This is done in animation 1V-2 for an artificial
economy like the one described in figures 1V-3, 1V-4, and 1V-5.Notice that while the actual price moves around the general equilibrium
price, the actual quantity traded is always less than what is necessaryto "clear the market." Since agents are unable to trade with anyoneother than their neighbors, there is always some "pent-up" demand thatgoes unfulfilled . That is, if the agents were perfectly mixed, they wouldengage in additional trades beyond what they achieve through T. Overtime, as the agents move around, they do meet and interact with theseother agents. However, as they move they are accumulating additionalgoods that they are willing to trade, thus shifting the equilibrium fur -
34. The Second Welfare Theorem of neoclassical economics, like the first one, needs tobe modified in statistical equilibrium . It states that any Pareto-effident allocation can beachieved by a Walrasian equilibrium price vector given an appropriate reallocation ofendowments. However, in statistical equilibrium
unless the [initiall endowment can be redistributed directly to the Pareto-efficient allocation, inwhich case there is nothing for the market to do. the generation of endogenous horizontalinequality among agents appears to be an inescapable by-product of the allocation of resourcesthrough decentralized markets. [Foley 1994: 3431
114 SUGAR AND SPICE: TRADE COMES TO THE SUGARSCAPE
In other words, the welfare properties of neoclassical general equilibrium markets are not preserved in statistical equilibrium , due to the
production of horizontal inequality. So once again the character of theequilibrium in our model turns out to differ markedly from that in theorthodox theory of general equilibrium .34 In fact, we expect the production
of horizontal inequality to occur in proportion to the varianceor dispersion in price in statistical equilibrium . Later it will be shownthat such dispersion can be very large indeed.
I ~~In~IIOII:1I '-0.914, Q-8I9D I
~
Supr Supply
1
1
1
1
~ ~ ! ! ~ ! ~ : 3eau
Wbdum ~
1 . 1 end _ dl Ybvlnl8l Dolation :
1 . 1 P - OB99 . o- a . 9
1
1
I
Actue1 JIriCI end quantll9 :
I
O . I
P - O . 974 . 0-
174 . 9 I
O .
0
0
O .
O .
~~
O ~
3D 6m 900 13D 1511 1 & xi 2100
Ouantltt .
Animation 1V-2.. Evolution of Supply and Demand under RuleSystem ({GI}, (M, T})~ D Sup.-Supplylo E13)1.251.20
[!:!~!~~~f :3equ Wbltum ~1.15 uuI_dtvllrlllt8r Dolation:1.10 P-o._, 0-2076.1im1.00 I AdIIaI DIIce uuI _lib: IO.~ I P-O-' 0- OIJ IO.~O.Eom0.750.700b5
500 1000 1500 DJJ ~ DQ BXI 4000 4500 5000Qlwl Ii Ii8
I Adua1~UId_tl\9: II p.o._, Q.517b I
~1~1: 1~1.311.151.10im1.O.~O.~O~.Oal0.750.70OJBQuantill M
Supr Supply
1: 1.:111~1.31 I~~ ~~; ~ leauOa.rIum ~1.15 Uldquendtvbvll\l Ir6o Ialkm:1.10 P-O.927. Q-1~Jj1JJ51A11 I Aotual.-lc8 U1dquentltv: .O.~ I P-OBis, Q-139A IO.~O~Oal .0.750.70 D8 I D8ndO~ 400 D 1D 1600 DO 2400 ~ DD mI mIo...ntltl.
PI\.-1~ . S U F Supply1~1~1.311.151.101iSimo.~o.~o~om0.750.70 ~ D I I D8ndOb5SD 1101 1SD zm ~ DXJ BXI 4IDI 4SD S OlQuenlltl.
I ~#""'=tt..I: II ,-o.~ 0-91'. II Ao Iualwlce Uld G U Ul Iliw: II '-0.910. 0-111. I
11111.11.111O.O.000o.0 400 a 130 1600 3D! 2400 28Q 3311 ~ 4000Quul Ilt18

Far from Equilibrium EconomicsA very general principle is lurking here. At each time step agents engagein production (resource gathering according to M ) and consumptionactivities as well as pure exchange with their neighbors according to T.Because the exchange rule requires time to reach an equilibrium societal
allocation, it essentially gives production and consumption time toalter the equilibrium to which T is converging. That is, as productionand consumption modify endowments they also modify the target theexchange process is trying to achieve. The result is that the economy isfar from equilibrium in a very definite sense. These circumstances-exchange taking time to converge while production and consumptionconstantly shift the equilibrium - are sufficient conditions for the existence
of a nonequilibrium economy.37
36. The far-from-equilibrium character of this spatially distributed market is an interesting result from the perspective of prices as signals appropriate for decentralizing decision-
making. Although the market has not reached general equilibrium it is essentiallygenerating the general equilibrium price (though our agents, following T, do not use thissignal). There are at least two implications of this. First, "getting the price right W is not suf-fident to guarantee allocative efficiency. The second conclusion is of a different character.In certain markets it may be that agents use local infonnation exclusively in their eco-nomic decisionmaking. In such markets aggregate data such as average prices, a primaryfocus of economists' attentions, are simply emergent statistically from micro-heterogeneityand of no particular interest to the agents.
37. Fisher [1983: 14] makes a similar point: "In a real economy. . . trading, as well asproduction and consumption, goes on out of equilibrium. It follows that, in the course ofconvergence to equilibrium (assuming that occurs), endowments change. In turn thischanges the set of equilibria. Put more sucdnctly, the set of equilibria is path dependent-it depends not merely on the initial state but on the dynamic adjustment process. . . .
116 SUGAR AND SPICE: TRADE COMES TO THE SUGARSCAPE
35. In animation IV-2 there is an increase in both the actual trade volume and the general equilibrium volume over time (the fonner always jagging the latter). This nonsta-
tionarity is due to the infinite livedness of the agents.
ther. The decentralized economy is always far from general equilibriumin this sense.35
This result is of prime significance. For whenever the actual trade volumes are less than the general equilibrium ones, agent society is not
extracting all the welfare from trade that it might . If the agents couldcoordinate their activities beyond their local neighborhoods they couldall be made better off. Here we see that even though T produces exchangesthat are nearly Pareto-optimal locally, the resulting market has far from optimalwelfare properties globally.36

SUGAR AND SPICE: TRADE COMES TO THE SUGARSCAPE 117
Effect of the Distribution of Agent Vision on Price VarianceIn figure IV-5 the variance in trade price decays to a relatively smallvalue. Initially , the agents' endowments may have little to do with theirpreferences (since both endowments and preferences are randomlyassigned). Hence, when they encounter one another they may trade atprices far from the general equilibrium level. But exchange serves tobring their internal valuations (MR Ss) closer together. Over time, the dispersion
in MR Ss decreases as agents increasingly encounter others withMR Ss similar to their own . However, as described above, the process es ofproduction and consumption make complete convergence impossible,and so some price variance persists indefinitely .
One can get significantly larger amounts of price variance by makingthe market 'lithinner." For example, when agent interactions are restricted
, less trade occurs, price convergence slows, and there results abroader disribution of MR Ss in the economy. There are a variety of waysto produce such thin markets on the sugarscape. Here we investigate theeffect of agent vision on the speed of price convergence.
In the run of the model described in figures IV-3, IV-4, and IV-5, agentvision was uniformly distributed between 1 and 5. U we reduce vision to1 across the entire agent society, then the agents will move around muchless and there will be more price heterogeneity. This is depicted in figureIV- 7 where the annual mean price is displayed.
The average price over the roughly 100,000 trades that occur duringthis period is 1.0, quite close to the general equilibrium level. But nothing
like the "law of one price" obtains. This is displayed more clearly bya plot of the standard deviation in the natural logarithm of per periodmean prices (see figure IV-B). While the standard deviation trends downward
, there is significantly more variation in the price than encounteredin figure IV-5. Inshon , nothing like general equilibrium obtains here.
Price variance is a feature of real-world markets. The amount of pricedispersion in any panicular market is, of course, an empirical question.While we do not purpon to be modeling any particular market here, thedegree of price heterogeneity displayed in figure IV-B is of the same magnitude
as that observed in econometric studies of price dispersion.38
What matters is the equilibrum that the economy will reach from given initial conditions,not the equilibrium that it would have been in, given initial endowments, had the priceshappened to be just right." See also Negishi [1961] and Hicks [1946: 127- 29].
38. These include Carlson and Pescatrice [1980] and Pratt, Wise, and Zeckhauser[1979]. Economists seek to explain persistent price dispersion in terms of imperfeCtly

Figure IV -B. Typical Time Series for the Standard Deviation in theLogarithm of Average 1i"ade Price under Rule System ({GI}, {M , T}),with Agent Vision set at I
Standard Deviation1.
.
.
2
.
..
.
.
.. .
.
.
.
. .
. .
.
.
.
.
0
.
.
.
.
.
. ..
,
..
. .
.
.
. . .
..
0
0 . 4
. .
.
.
..
.
.
.
0 . 2
80000 600200 4
Mean2 . . .... .. .... ,.. ,... ~ .. ... - . t . .'...,-(. .!.. . ... .~'..,.. ..... . .....'" ......:.... "a~.". . ... . .. ~ . . -. ... . .~. . .',.. . - ;,.- '-... c-..,.;"..':' ...f..~ .'.8":'" ~' "1;'- -, J"':-' :.. .,.'.... - ... .. . . #. ... ...',-'~ ....'.. , ., . .~:-~.. "'~.'1.. I,"$"..~-!: .'~"(' .:~."":. ..;!.. i'~.~1.' !.1_4 ,=--;. ... ~ .::;, .~.~,.\,,'...""~~- "'... .,', -: .,~~ ~~. ~ ~., :. .--- ... . -. -:-. . ..... ,.,' ,..... '- . ;....~. ..,.-...... , '. '.. ... ....,. . ... , .. . , ... . .. . .. . . ,. ..- .. .. . ...... ,. . .. ...0 200 400 600 800 1000 Time..
..
1000 Time
Price
Figure IV-7. Typical Time Series for Average Trade Price under RuleSystem ({GI), {M, T}), with Agent Vision Set at I

1
0 . 8
.
.
0 . 6
.
.
. .
0 . 4
.
.
.
0 . 2
.
. .
200 400 600 800 1000
Time
It is also possible to create markets on the sugarscape that have muchless price variance than that shown in figure 1V-5. When average agentvision is large, price heterogeneity decreases. Figure 1V-9 gives a timeseries for the standard deviation in the logarithm of mean prices in apopulation in which vision is unifom1ly distributed between 1 and 15.
Here, due to higher mean vision, there is much more intense interaction- more perfect mixing- of the agent population and therefore equilibrium
is approached quickly. By contrast to the preceding case (lowagent vis on, high price variance), the anifidal market of figure 1V-9more closely resembles the information-rich environment of, for example
, finandal markets.
Non-Neoclassical Agents and Further Departures from Equilibrium
up to now our agents, endowed with fixed preferences and infinite lives,have been basically neoclassical. In agent-based models like Sugarscapeit is not difficult to relax these assumptions. In what follows we make
Standard Deviation
informed consumers who engage in (costly) search for the best prices [Ioannides 1975,
Reinganum 1979] . Our model is not a search model, yet it also yields price dispersion.
SUGAR AND SPICE: TRADE COMES TO mE SUGARSCAPE 119
Figure 1V-9. Typical Time Series for the Standard Deviation in theLogarithm of Average Trade Price under Rule System ({GI), (M, T}),with Agent Vision Uniformly Distributed between 1 and 15

Finite Lives: ReplacementIn Chapter II we introduced finite death ages into the agent populationfor purposes of studying the wealth distributions that emerged underrule M . The replacement rule Rla.b] denotes that the maximum agentage is uniformly distributed over interval [a,b] .
In the context of trade, the effect of the replacement rule is to addagents to -the population who initially have random internal valuations,that is, MR Ss quite distant from the price levels that prevail. A new agentis born into the world with an initial endowment uncorrelated with itswants. It seeks, through trade, to improve its welfare by bringing itsendowments into line with its needs. That is, an agent with high sugarmetabolism and low spice metabolism wants to accumulate muchlarger stocks of sugar than of spice. When agent lifetimes are relativelyshort in comparison with the time required for the distribution of MR Ssto homogenize, high price variance will result. An example of this isillustrated in figure IV- IO, a plot of the standard deviation in the logarithm
of annual average trade prices in the case of maximum age distributed unifonnly between 60 and 100, and vision returned to its
earlier distribution (uniform between I and 5). Clearly, this straightforward departure from the neoclassical agent produces market performance at considerable variance with Walrasian general equilibrium .39
As the average agent lifetime grows there is more time for youngagents to have their internal valuations brought into line with the overall
market.4O So the price dispersion decreases as mean agent lifetimeincreases. This effect is shown in figure IV- II where agent maximumages are distributed uniformly between 980 and 1020.41
39. At any instant in this finitely lived agent economy it is certainly the case that equilibria exist. Figure IV-I 0 demonstrates that such equilibria will not generally be achieved.40 One might argue that in the real world the issue is not agent lifetimes per se, but
rather the duration of agents' panicipation in markets. Of course, in Sugarscape all agentswho are alive panicipate in the market through rule T.
41. Note that the variance in agent lifetimes is identical in figures IV-I 0 and IV-II .
120 SUGAR AND SPICE: TRADE COMES TO THE SUGARSCAPE
our agents more human, first, by giving them finite lives and, second, bypermit ting their preferences to evolve. We shall see that the effect ofthese new rules is to add variance to the distribution of prices and tomodify the price itself. In fact, the mean price will follow a kind of I Irandom
walk .1I

1
0 . 8
I .
' .
0 . 6
.
.
0 . 4
.
.
.
.
.
.
.
0 . 2
200 400 600 800 1000
Tirne
Standard Deviation
Figure IV-II . Typical Time Series for the Standard Deviation in theLogarithm of Average Trade Price under Rule System ({GI), {M,R'960,lO OO]' T})Standard Deviation
Figure IV-IO. Typical Time Series for the Standard Deviation in theLogarithm of Average Trade Price under Rule System ({GI}, (M,R[60.I OO J' T})

42. It is not possible to study wealth distributions in the context of infinitely livedagents since such distributions are nonstationary.
0 200 400 600 800 1000Average Agent Age
.5 .c uo'C=G..me~~. ~mCcO~ aI~.9a .C,c.9~We have studied this effect for a variety of agent lifetime specifications
and summarize the results in figure IV- I2 .
EquityIn Chapter il , highly skewed distributions of wealth were observed foragents following movement rule M . How is the distribution of wealthaltered by trade? In particular, is society made more or less equitable bytrade? Now that finite lives and agent replacement have been reintroduced
this question is conveniently studied.42 One familiar measure ofequity is the Gini coefficient, G, illustrated in animations il -4 and ill -4,where it was displayed along with Lorenz curves. In figure IV-I3 thedependence of G on trade is displayed.
Overall, the effect of trade is to further skew the distribution of wealthin society. So, while trade increases the carrying capacity, allowing moreagents to survive, it also increases the inequality of the wealth distribution.In this sense, there is a tradeoff between economic equality and eco-nomic performance.
122 SUGAR AND SPICE: TRADE COMES TO THE SUGARS CAPE
Figure 1V- l2. . Dependence of the Long-Run Standard Deviation inthe Logarithm of Average Trade Price on Average Lifetime under RuleSystem ({GI}, (M , R[a.b]' T})
0.50.450.4
0.350.3
0.250.2
0.150.1
0.05 .0

Finite Lives: Sexual ReproductionWhen agents reproduce sexually via rule S, described in Chapter ill ,each new agent's preferences are the result of U cross-over" of its parents'
preferences. With S turned on we expect- as in the case of agentreplacement through R[a.b]- an increase in the price variance due to thecontinual introduction of novel agents (with random internal valuations
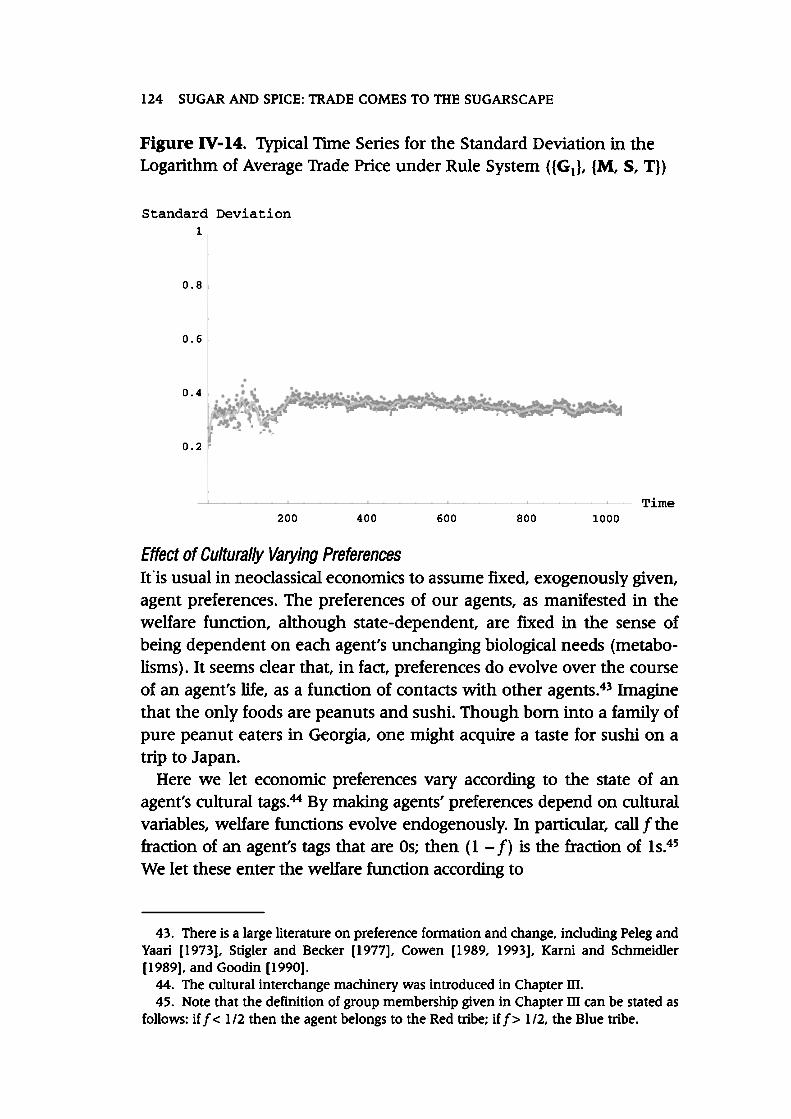
) into the society. In figure 1V-14 the onset of puberty is a randomvariable in the interval [12, 15], the range of ages at which childbearingends is [35, 45] for women and [45, 55] for men, and the maximumagent age is selected from [60,100] .
Again, a persistent high level of price dispersion is observed. Overall,the effect of finite lives - with replacement or sexual reproduction- is topush the market away from anything like general equilibrium .
As shown in Chapter ill , evolutionary process es are at work whenever the agents engage in sexual reproduction, modifying the distribution of vision and metabolism in the agent population . Therefore
economic preferences are systematically varying on evolutionary timescales when S is operational. This is so since the distributions of metabolisms
in the agent population are changing, as in figure ill -2, and thesemetabolisms enter directly into the agent welfare functions. This is akind of uvertical transmission" of preferences. We now consider theuhorizontal transmission" of preferences.
Gini0.50.40.30.20.10 2 4 6 8 10 12 14 16Mean vision
~ :: : : : :==:::::::::=:::::::==No trade
SUGAR AND SPICE: TRADE COMES TO mE SUGARSCAPE 123
Figure IV-I3 . Dependence of the Gini Coefficient on Trade,Parameterized by Mean Vision and Mean Metabolism, under RuleSystem ({GI), {M, R[60.1001' T})
THE SUGARSCAPE124 SUGAR AND SPICE: TRADE COMES TO
Effect of Culturally Varying PreferencesIt is usual in neoclassical economics to assume fixed, exogenously given,agent preferences. The preferences of our agents, as manifested in thewelfare function , although state-dependent, are fixed in the sense ofbeing dependent on each agent's unchanging biological needs (metabolisms
). It seems clear that, in fact, preferences do evolve over the courseof an agent's life, as a function of contacts with other agents.43 Imaginethat the only foods are peanuts and sushi. Though born into a family ofpure peanut eaters in Georgia, one might acquire a taste for sushi on atrip to Japan.
Here we let economic preferences vary according to the state of anagent's cultural tag S.44 By making agents' preferences depend on culturalvariables, welfare functions evolve endogenously. In particular, call [ thefraction of an agent's tags that are Os; then (1 - / ) is the fraction of Is.45We let these enter the welfare function according to
Figure 1V-14. Typical Time Series for the Standard Deviation in theLogarithm of Average Irade Price under Rule System ({GI), {M, S, T})
Standard Deviation1
Time1000
43. There is a large literature on preference formation and change, including Peleg andYaari [1973], Stigler and Becker [1977], Cowen [1989, 1993], Kami and Schmeidler[1989], and Goodin [1990].
44. The cultural interchange machinery was introduced in Chapter ill .45. Note that the definition of group membership given in Chapter ill can be stated as
follows: iff < 1/2 then the agent belongs to the Red tribe; iff > 1/2, the Blue tribe.

SUGAR AND SPICE: TRADE COMES TO mE SUGARS CAPE 125
Figure 1V-15. Typical Time Series for Average 1i"ade Price under RuleSystem ({GI}, (M , K , T})Mean Price
46. For another use of binary strings to model evolving preferences, see Lindgren andNordahl [1994: 93- 94].
47. Note that through culturally varying preferences, an agent's biological (metabolic)requirements can be eclipsed by cultural forces. For example, in the case of f near 0, anagent vinually neglects its need for sugar and, unless f increases later, the agent may diefrom sugar starvation.
"Wi( .!!!!f m.zWI,W2) = W 11 W 7(1-1>I 2 '
. .. .. . . .. ..~ ...' -... . .. ~ .. ...~ . ..fr; ..; , . ...' '.e."..' . ~ Ie" . - -. u. "').,r~ Jf .' .. ..~? \ .. 1.#1- , .I...)~ .,If t. ",,: !~-':'.. .. -..., -"'. ~\ .f.~w~ r~L$.~. ~ . ... . -I.. .... X,' .,,~_.., - P"~~.... . ~ ~.. -- p-,- ,~).. .: . ,..-~ , . . 9- ~-~ --..- "~." . . . . .... ""'\..'.. .. -. . ~ ,-8t", '/). ..~. $ .,t\-. ~....,~ ~I ,. -.,. --. ~...' , at ....",: 4'..t. '7 .-. ~',(~ ,.~ : ..' .. ~. 10 ..... .sr', . \:.."~ ,'\. .. . -.....0 200 400 600 800 1000 Time(5)
where 1.l = m 1 f + m2( I - / ) . Thus, when cultural transmission process esare active, preferences evolve over time, yet at each instant the Cobb-Douglas algebraic form is preserved.46
Figure IV-I 5 gives a typical annual average price time series when infinitely lived agents are governed by (5) and cultural transmission rule K is
operational.Note that now the mean price follows a kind of random walk. This
occurs because culture is continuously evolving and therefore preferencesare constantly changing.47 There is also significant price dispersion, asshown in figure IV-I6 .
Note that the variance in price never settles down. Also, at 106 transactions, the volume of trade in this run is larger (by a factor of roughly 5)
1.5
1.2

than in figure 1V-4. This is because as an agent's preferences change itfinds itself holding goods that it no longer values highly . Or, asShakespeare's Benedick asks, " . . . but doth not the appetite alter? A manloves the meat in his youth that he cannot endure in his age."48
Let us now turn sexual reproduction (5) on as well , so that preferences change both "vertically " and "horizontally ." A typical time series
for the price standard deviation is shown in figure 1V-17.The combined effect of finite lives and evolving preferences is to produce
so much variation in price that equilibrium seems lost forever.In summary, our quite realistic departures from the neoclassical
model of individual behavior produce dramatic departures from the textbook picture of overall market performance. Now we turn to another
topic, restoring the neoclassical assumptions.
Externalities and Price Disequilibrium: The Effect of Pollution
In Chapter n we introduced pollution onto the sugarscape. There we wereconcerned with the effect of pollution on agent movement. When weturned pollution on and allowed it to accumulate (no diffusion), agents
1000 Time
48. From Much Ado About Nothing, Act II, Scene m.
126 SUGAR AND SPICE: TRADE COMES TO THE SUGARSCAPE
Figure 1V-16. Typical Time Series for the Standard Deviation in theLogarithm of Av.erage Trade Price under Rule System ({GI), {M , K , T})
Standard Deviation

1
0 . 8
"
..
0 . 6
0 . 4
. .
.
.
0 . 2
0 200 400 600 800 1000
Timemigrated from the polluted area. When we turned diffusion on, the pollution
dissipated and agents moved back into the abandoned zones.Having developed a model of bilateral trade in this chapter, we are
now in a position to explore the effect of pollution on prices. To economists, environmental pollution is the classic negative externality .
Externalities are important since their existence is an indication that aneconomy is not achieving efficient resource allocation.
To explore the effect of pollution on prices we let one resource, sugar,be a N dirty " good. That is, when agents harvest sugar from the landscapethey leave behind production pollution . When they metabolize sugarthey produce consumption pollution . Spice harvesting and consumption
, by contrast, do not cause such pollution . Our experiment, then, isthis. First, we will allow agents to trade. Then, after 100 periods, theagents begin generating sugar pollution and we track the effect onprices. At t = 150, pollution is turned off and diffusion process es are activated
. Results of the experiment are logged in animation N -3.When the agents flee the polluted sugar mountains and move to the
spice rich (sugar poor) regions, most of the sugar available to meet metabolic needs is what the fleeing agents have carried with them. Agents
who need sugar must trade for it , and the relative sugar scarcity that
SUGAR AND SPICE: TRADE COMES TO mE SUGARSCAPE 127
Figure IV - I7 . Typical Time Series for the Standard Deviationin the Logarithm of Average li "ade Price under Rule System({GI), {M , S, K , T})
Standard Deviation

Accompanying Sugar Extraction and Consumption; Rule System ({GI,DI }, (M , T, PI)
Average
Trade Price
10 . 0
5 . 0
2 . 0
1 . 0
0 . 5
0 . 2
0 . 1
20 40 60 80 100 120 140
Time
Average
Trade Price
10 . 0
5 . 0
2 . 0
1 . 0
0 . 5
0 . 2
0 . 1
0 60 80 100 120 140 160 180 200 220
Time
Price and Price Range Thne Series for PollutionAnimation 1V-3.
Average Trade Price10.05.02.01.0OS0.20.1
Average Trade Price10.05.02,01.00.50.20.1
Time

49. Recall that prices are ratios of spice-to-sugar: A sugar price of 5 means that a buyerof sugar would sacrifice 5 units of spice to acquire 1 unit of sugar.
SUGAR AND SPICE: TRADE COMES TO THE SUGARSCAPE 129
results causes the sugar price to rise.49 The effect is dramatic, effectivelyan exponential price rise.
Then, when pollution generation is turned off- imagine this being theresult of some technological windfall - and pollution levels are transported
across the landscape by diffusion, the agents return to the sugarrich zones and the sugar price falls to its previous value of around 1.0.Such price adjustment dynamics are ignored in static microeconomics,where the implicit presumption is that, as a policy matter, it is safe toassume instant adjustment to a new equilibrium . For t > 150, we doindeed see adjustment back toward the original equilibrium . But fromthe perspective of agent society the process is far from instantaneous. Inthis case the artificial economy requires roughly twice as long to recover
its statistical price equilibrium as it did to deviate from it . Whentransients such as this are long-lived, it makes little sense to focus allattention on equilibria . Artificial societies provide a means of studyingprice dynamics.
.
On the Evolution of Foresight
Agaipst our simple agents it may be said that they are myopic temporally. A simple way to remedy this is to have them make decisions not
on the basis of their current holdings but instead as if they were lookingahead cp periods. Formally, let the agents now move to maximize
W(Wl,W2;cP) = (wl- cPml)m/lmT(w2- cPm2)mvmT, (6)where the parenthesized terms on the right hand side are set equal tozero if they evaluate to a negative number.
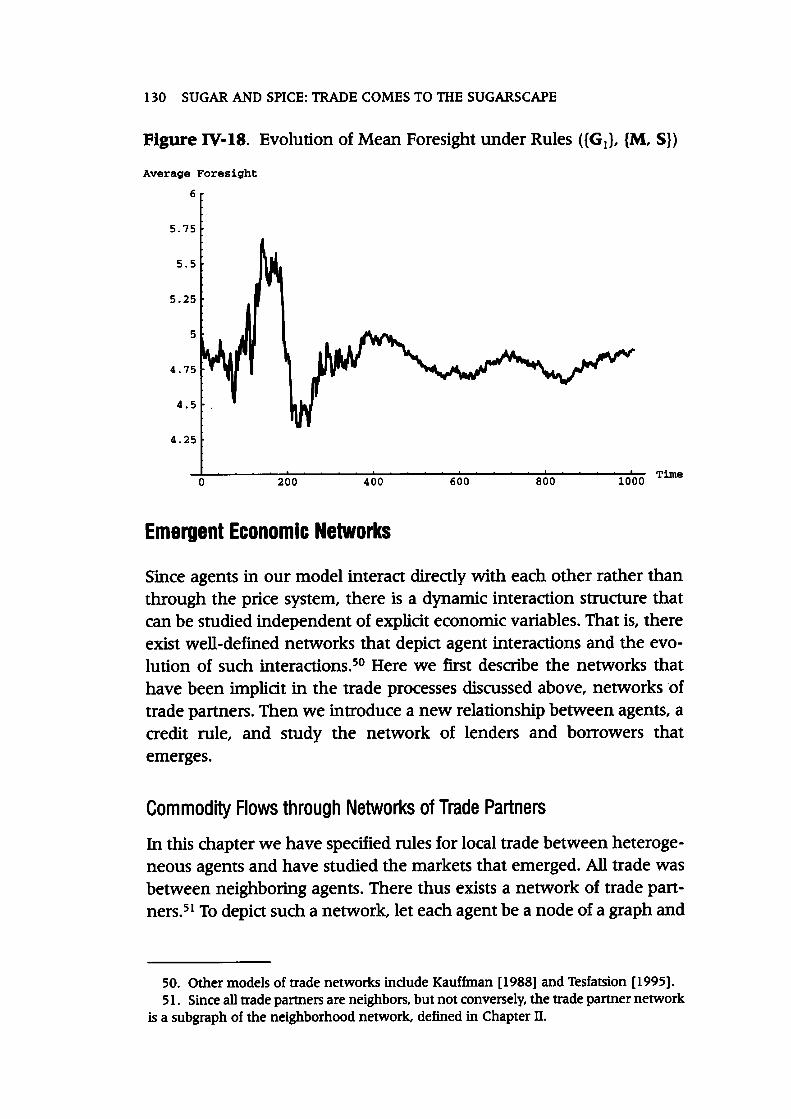
To study how this simple kind of foresight can modify agent behavior,we initially let cp be uniformly distributed in the agent population in therange [0, 10], and then turn sex (that is, S) "on." Once more, we can"watch" evolution unfold (see figure IV-18) by tracking the averageforesight in the population .
Clearly, some foresight is better than none in this society since the long-run average foresight becomes approximately stable at a nonzero level.However, large amounts of foresight, which lead agents to take actions asif they had no accumulation, are less "fit " than modest amounts.
130 SUGAR AND SPICE: TRADE COMES TO THE SUGARSCAPE
Figure IV - IS . Evolution of Mean Foresight under Rules ({GI ), {M , 5 })
Average Foresight
argent
Since agents in our model interact directly with each other rather thanthrough the price system, there is a dynamic interaction structure thatcan be studied independent of explicit economic variables. That is, thereexist well -defined networks that depict agent interactions and the evolution
of such interactions. 50 Here we first describe the networks thathave been implicit in the trade process es discussed above, networks .oftrade partners. Then we introduce a new relationship between agents, acredit rule, and study the network of lenders and borrowers thatemerges.
Commodity Flows through Networks of Trade Partners
In this chapter we have specified rules for local trade between heterogeneous agents and have studied the markets that emerged. All trade was
between neighboring agents. There thus exists a network of trade panners.51 To depict such a network , let each agent be a node of a graph and
50. Other models of trade networks include Kauffman [1988] and Tesfatsion [ 1995] .51. Since all trade partners are neighbors, but not conversely, the trade panner network
is a subgraph of the neighborhood network , defined in Chapter ll .
65.755.55.2554.754.54.250 200 400 600 800 1000 Time: Economic Networks

Credit Networks and the Emergence of Hierarchy
So far the agent sodeties studied in this book have been "flat "- there isno sense in which some agents are subordinate to others . This stemsfrom the fact that agent interactions are usually short lived , lasting one(or at most a few ) periods , or are symmetrical (such as when agents areneighbors of one another , or are mutual friends ).
We can produce hierarchical relationships among agents by permit tingthem .to borrow from and lend to one another for purposes of havingchildren . The following local rule of credit produces such relationships :54
Agent credit rule LA,:. An agent is a potential lender if it is too old to have children , in
which case the maximum amount it may lend is one-half of its current wealth;
. An agent is a potential lender if it is of childbearing age and haswealth in excess of the amount necessary to have children , inwhich case the maximum amount it may lend is the excess wealth;
. An agent is a potential borrower if it is of childbearing age andhas insuffident wealth to have a child and has income(resources gathered , minus metabolism , minus other loanobligations ) in the present period making it credit -worthy fora loan written at ten D S specified by the lender ;
52. As in Chapter ill , lines across the entire lattice connect trade partners who areneighbors on the torus.
53. For why this network does not have a pure von Neumann structure, see footnote29 in Chapter II.
54. Insofar as a primary consequence of this rule is that older agents lend to youngerones, a kind of finely grained overlapping generations model results.
SUGAR AND SPICE: TRADE COMES TO THE SUGARS CAPE 131
draw edges between agents who are trade partners . Such trade networksare endogenous in that they depend in a complicated way on agentbehavior (that is, the movement rule , trade rule , and so on ). Theychange over time , of course , as agents move around the landscape .Animation IV-4 gives such an evolution .
It is useful to think of the edges in such networks as channels overwhich commodities flow .52 Notice that although any particular agenttrades with at most 4 neighbors , agents who are quite distant spatially maybe pan of the same graph , that is, connected economically . In essence,such graphs portray large-scale flows of goods across the landscape.53

Animation IV -4.{M, T})
Emergent Trade Network under Rule System ({G]),

Social Computation, EmergentComputation
The theory of general equilibrium is essentially a body of results on theexistence of equilibrium . In the neoclassical story, the Walrasian auctioneer
is a mechanism for achieving such an equilibrium . Once the market-
clearing price is detennined, the population of price-taking agents
55. The Sugarscape software system implements the n commodity generalization of credit rule L. For the sake of simplidty, the single commodity (sugar-only) form is used here.
SUGAR AND SPICE: TRADE COMES TO mE SUGARSCAPE 133
. If a potential borrower and a potential lender are neighborsthen a loan is originated with a duration of d years at the rateof r percent, and the face value of the loan amount is transferred
from the lender to the borrower;. At the time of the loan due date, if the borrower has sufficient
wealth to repay the loan then a transfer from the borrower tothe lender is made; else the borrower is required to pay backhalf of its wealth and a new loan is originated for the remaining
sum;. If the borrower on an active loan dies before the due date
then the lender simply takes a loss;. If the lender on an active loan dies before the due date then
the borrower is not required to pay back the loan, unlessinheritance rule I is active, in which case the lender's childrennow become the borrower 's creditors.
This rule may not seem at first glance to be particularly parsimonious.However, it is the simplest one we could think of that bore some resemblance
to real-world credit arrangements.We. return to the one commodity landscape to illustrate the operation
of this rule. When agents move, engage in sexual activity, and borrowfrom and lend to one another, there result credit relationships like thoseshown in animation 1V-5.55 This animation begins by displaying agentsspatially, coloring lenders green, borrowers red, and yellow those agentswho are both borrowers and lenders. Subsequently, the hierarchicalevolution is displayed. Agents at the top of the hierarchical plot are purelenders, those at the bottom of any branch are pure borrowers, andagents in between are simultaneously borrowers and lenders. For thisrun as many as five levels of lenders-borrowers emerge.

Emergent Credit Network under Rule System ({GI},Animation 1V-5.(MS , L1O.1O}) ...... .... . . .I~~~ ~ I. . ..... .. . I~;~ ~ I . . ... .N.Irk *t!.ttr8. . . . .. . . N.Irk *-.., . .. ... . . , .. ... -~~~. On . ... :.: ... ~~~~ ~ . :. ,~ ...
56. Technically, these questions are very complicated. In the context of parallel, asynchronous computation, the relevant literature concerns the snapshot algorithm; see
Bensekas and Tsitsiklis [1989: 579- 87] .57. For more on emergent computation, see Forrest [ 1991] .
SUGAR AND SPICE: TRADE COMES TO THE SUGARSCAPE 135
produces a socially optimal allocation of goods through exchange. Theauctioneer is essentially an algorithm for the computation of prices. In thispicture of the economic world no single agent has enough information(about endowments, preferences) to compute an efficient allocation on itsown. Yet this allocation results through the cumulative actions of individuals
. However, a particularly curious characteristic of this picture of decentralized decisionmaking via prices is that the auctioneer algorithm requires
centralized information . That is, all agents must report their demands to theauctioneer who ultimately furnish es an authoritative price to the population
that all agents must use in their trade decisions.In reality, of course, there is no auctioneer, no central price computation
authority. Rather, prices emerge from the interactions of agents. Theseinteractions occur in parallel and asynchronously. It is as if agents areprocessing nodes in some large-scale parallel, asynchronous computer.Trade is the algorithm the nodes execute; nodes communicate prices toone another and change their internal states through the exchange ofgoods. The computation topology (architecture) is endogenous andever-changing. Under what circumstances do such computations terminate
in a market-clearing price? And how would any particular agentknow that they had terminated- is it even possible to discern whetheran equilibrium price has been achieved?56 Does the fact that some nodesdie while new nodes are regularly added to the social computer meanthat notions of computation temlination must be stochastic in nature?
Insofar as real economic agents engage in trade to improve their welfare, one might view the parallel,- asynchronous exchange activities of
agents not as the social computation of prices but as a distributed algorithm for the production of agent welfare. Artificial economies are laboratories
where we can study the relative performance of distinct traderules (algorithms) and alternative computational architectures (agentnetworks) in producing agent welfare.
Social computation concerns how societies of interacting agents solveproblems that agents alone cannot solve, or even pose. Emergent computation
concerns how networks of interacting computational nodessolve problems that nodes alone cannot solve.57 Notice that these twofields have much in common.

Conclusions
Policy Implications
Foley [1994] has thoroughly criticized the way in which conclusionsabout economic policy are drawn from the model of Walrasian competitive
equilibrium . In particular, the orthodox criticism of price regulationis that it is i" elevant if prices already fall within the limits set by the regulations
or distorting if it actually constrains price movements. But indecentralized markets there is no single price.
If a significant amount of trading takes place at different price ratios,price floors and ceilings can serve to protect agents against relativelydisadvantageous trades, and thus to mitigate the endogenous horizontal
inequality produced by the market. [Foley 1994: 342]Therefore, a clear role for economic regulation may exist when pricesare heterogeneous.
Certain economists ascribe nearly magical powers to markets. Marketsare idealized to operate frictionlessly, without central authority , cost-lessly allocating resources to their most efficient use. In this world ofcomplete decentralization and Pareto efficiency, the only possible effectof government intervention is to "gum up" the perfect machinery. Whilethis extreme view is perhaps little more than a caricature- and fewwould admit to holding it in toto - it is also, unfortunately , a positionfrequently promulgated in policy circles, especially when there is noeconometric or other evidence upon which to base decisionmaking.58
A different way to frame the issues raised in this chapter is as follows:
58. On the limited extent to which economic theory provides solid foundations for policy, see Hahn [1981] and Kirman [1989].
136 SUGAR AND SPICE: TRADE COMES TO THE SUGARSCAPE
Summary and
In many ways, the central question of economic theory is this: To whatextent can economic markets efficiently allocate goods and servicesamong agents? For example, does the ostensibly good performance ofmarkets like stock exchanges tell us anything about the functioning ofdecentralized markets such as those for environmental goods and services
? In our model we have just such a decentralized market- decentralized spatially- and we have found mixed results, to say. the least,
concerning the achievability of equilibrium prices and globally optimalallocations, under a wide variety of conditions.

59. Indeed, there is a growing theoretical literature that admits these possibilities; see, forexample, Bala and Majumdar [1992] . However, these results do not seem to have madetheir way into policy discussions as of this writing .
60. As Farmer has observed, NTo someone schooled in nonlinear dynamics, economictime series look very far from equilibrium , and the emphasis of economi.c theories onequilibria seems rather bizarre. In fact, the use of the word equilibrium in economicsappears to be much closer to the notion of attraaor as it is used in dynamics rather thanany notion of equilibrium used in physics N [Anderson, Arrow, and Pines 1988: 101] .
SUGAR AND SPICE: TRADE COMES TO THE SUGARSCAPE 137
Do plausible departures from the axioms of general equilibrium theoryproduce markets that behave almost as well as ideal markets? While fewwould admit that extant markets function ideally, there is little cogenttheory of performance degradation in real markets resulting fromincomplete information , imperfect foresight, finite lives, evolving preferences
, or external economies, for example.The emphasis in the economics literature has been on the existence of
static equilibrium , without any explicit microdynamics. Why cannotprices oscillate periodically on seasonal or diurnal time scales, or quasiperiodically
when subject to shocks, or even chaotically?59 Is it not reasonable to expect generational or other long-term structural shifts in the
economy to produce prices that follow a trend as opposed to stayingconstant? Might not far from equilibrium behavior be a more reasonabledescription of a real economy?60 From the computational evidenceabove, we think that there is good reason to be skeptical of the predominant
focus on fixed-point equilibria . Economies of autonomousadaptive agents- and of humans- may be far from equilibrium systems.And, in turn , far from equilibrium economics might well turn out to befar richer than equilibrium economics.