substituent group variations directing the molecular...
TRANSCRIPT
Substituent Group Variations Directing the Molecular Packing,Electronic Structure, and Aggregation-Induced Emission Property ofIsophorone DerivativesZheng Zheng, Zhipeng Yu, Mingdi Yang, Feng Jin, Qiong Zhang, Hongping Zhou,* Jieying Wu,and Yupeng Tian
College of Chemistry and Chemical Engineering, Key Laboratory of Functional Inorganic Materials Chemistry of Anhui Province,Anhui University, Hefei, 230039, People’s Republic of China
*S Supporting Information
ABSTRACT: A series of new isophorone derivatives (1−5),incorporating the heterocyclic ring or aza-crown-ether group,with large Stokes shifts (>140 nm), have been synthesized andcharacterized. 1−4 display aggregation-induced emissionbehaviors, while dye 5 is highly emissive in solution butquenched in the solid state. It was found that the tuning ofemission color of the isophorone-based compounds in thesolid state could be conveniently accomplished by changingthe terminal substituent group. The photophysical propertiesin solution, aqueous suspension, and crystalline state, alongwith their relationships, are comparatively investigated.Crystallographic data of 1−4 indicate that the existence of multiple intermolecular hydrogen bonding interactions betweenthe adjacent molecules restricts the intramolecular vibration and rotation and enables compounds 1−4 to emit intensely in thesolid state. The size and growth processes of particles with different water fractions were studied using a scanning electronmicroscope, indicating that smaller globular nanoparticles in aqueous suspension are in favor of fluorescence emissions. Theabove results suggest that substituent groups have a great influence on their molecular packing, electronic structure, andaggregation-induced emission properties. In addition, fluorescence cell imaging experiment proved the potential application of 5.
■ INTRODUCTION
Organic fluorophores exhibiting high nanoaggregation-inducedemission and solid- and crystalline-state fluorescence efficiencyhave received increasing attention owing to their potentialapplications in fluorescence imaging, light-emitting devices, andactive gain media for optically pumped solid-state lasers.1−4
However, most fluorescent organic materials suffer from thenotorious aggregation-caused quenching (ACQ) effect due tostrong π−π stacking interactions in extended π-conjugatedsystems and dipole−dipole interactions in D−A charge transfersystems, which is a typical problem of common organicchromophores and thus limited their applications in real world,which requires materials to be solid and phragmoid films.5
Up to now, a variety of conjugated molecules with twistedskeleton conformation have been demonstrated to exhibitaggregation-induced emission (AIE)6,7 since the first report byTang and colleagues in 2001.8 AIE materials are successfullyput into application in the construction of OLEDs,9−11
bioimaging systems,12,13 and chemical sensors.14−16 However,the working mechanisms of the AIE processes are socomplicated that they still remain unclear, although varioustheories have been advanced to explain the AIE phenomenon,such as planarity and rotatability,17−20 intramolecular restric-tions,21,22 intermolecular interactions,23 ACQ-to-AIE trans-
formation, etc.24 The intramolecular rotation, one of the mostinfluential mechanisms, was researched in depth.25,26 Lee et al.reported a group of isophorone-based fluorescent materials asred emitters for use in OLEDs.27 A series of near-infrared solid-state emitters based on isophorone were reported, and all of thecrystalline compounds were fluorescent in the solid state. Theresults showed that the origin of the emission depends on thenature of the substituent groups that influence the crystalpacking and trigger the formation of the long chain of emittingaggregates.28
In this paper, we report a new family of isophorone-basedfluorescent derivtatives (1−5) (Figure 1). Structurally, theimidazol, pyrazol, triazol, and carbazol groups have richer π-electron density than the phenyl group. Aza-crown-ether cannot only increase the solubility of the molecule but alsoenhance the extent of electron delocalization and the ability todonate electrons. Incorporation of the heterocyclic ring or aza-crown-ether group with different electron-donating ability isintended to enrich the π-electron density and increase thedimension of π-electron delocalization of the system. Themolecules 1−4 show good AIE characteristics and tunable
Received: January 23, 2013Published: March 18, 2013
Article
pubs.acs.org/joc
© 2013 American Chemical Society 3222 dx.doi.org/10.1021/jo400116j | J. Org. Chem. 2013, 78, 3222−3234

yellow or orange emission. We aim to reveal the structure−property relationship and learn how subtle structural changemodulates the emission color, solvatochromism, and AIEfeatures of these isophorone derivatives. The spectroscopicproperties of the compounds in solution, nanosuspensions, andtheir crystal structures were investigated to elucidate themechanism of enhanced emission in the aggregation state.
■ RESULTS AND DISCUSSIONDesign and Synthesis. To enrich the AIE research and
broaden its practical applications, we designed a series of newAIE luminogens and devised a multistep reaction route for theirsynthesis (Scheme 1). 4-(1H-Imidazol-1-yl)benzaldehyde 1a, 4-(1H-pyrazol-1-yl)benzaldehyde 2a, 4-(1H-1,2,4-triazol-1-yl)-benzaldehyde 3a, and 4-(carbazol-9-yl)benzaldehyde 4a wereobtained directly from commercial imidazole, pyrazole, triazole,carbazole, and 4-fluorobenzaldehyde, respectively. 4-(1,4,7,10-tetraoxa-13-azacyclopentadecyl)benzaldehyde was obtained
from N,N-disubstituted aniline via a Vilsmeier−Haack reactionwith phosphorus oxychloride and dry DMF. Isophorone,malononitrile, triethyene glycol, and 2,2′-(phenylimino)-diethanol were available commercially. Compounds 1−5 canbe easily synthesized starting from isophorone, malononitrile,and the corresponding 4-substituted benzaldehyde by a doubleKnoevenagel reaction sequence, which is easier than theoriginal procedure described by Lemke in 1974,31 by using dryacetonitrile instead of DMF and only piperidine as a catalyst forthe second Knoevenagel condensation.All intermediates and final products were carefully purified
and fully characterized by IR, NMR, and mass spectroscopies,which confirmed their expected molecular structures. Singlecrystals of compounds 1−4 were slowly prepared by a simplevapor diffusion method from the chloroform−methanol systemat room temperature and were characterized crystallographi-cally. Their ORTEP drawings are shown in Figures 9a−12a,while Table 2 summarizes the crystal data. All of the
Figure 1. Molecular structures of 1−5.
Scheme 1. Synthesis of Fluorophores 1−5
The Journal of Organic Chemistry Article
dx.doi.org/10.1021/jo400116j | J. Org. Chem. 2013, 78, 3222−32343223

luminogens were soluble in common organic solvents, such asethanol, tetrahydrofuran (THF), toluene, dichloromethane(DCM), and chloroform, but were insoluble in water.Photophysical Properties. Upon increasing the solvent
polarity, as shown in Supporting Information Table S1 andFigure S1, the fluorescence maxima and the Stokes shift of 1−5both show monotonically increasing tendency, especially for 4and 5. The Stokes shift of 5 increases from 96 nm in benzeneup to 147 nm in polar solvent, and the behaviors of 1−4 aresimilar to that of 5. This can be explained by the fact that theexcited state may possess a higher polarity than that of theground state, for the solvatochromism is associated withlowering energy level. An increasing dipole−dipole interactionbetween the solute and solvent leads to a lowering of theenergy level, which suggests that compounds 4 and 5 are typicalD-π-A chromophores compared with 1−3. The absorption andphotoluminescence (PL) spectra of 1−5 in ethanol at aconcentration c = 1 × 10⁻⁵ mol L−1 are shown in Figure 2. Onecan see that the absorption spectra exhibits two peaks between250 and 700 nm, where the low-energy band originates fromICT transition, while the high-energy band is assigned to theπ−π* transitions.32 This series of compounds show theirabsorption maximum with the following order: 5 (504 nm) > 4(414 nm) > 2 (404 nm) > 3 (392 nm) ≈ 1 (391 nm). Ingeneral, the extension of the π-systems and the strong electron-donating ability exerts an important influence on the absorptionspectra. For example, the absorption maximum of 4 at 414 nmis red-shifted by 10−23 nm relative to that of 1, 2, and 3, as 4containing a carbazole moiety has a larger conjugation lengththan 1, 2, or 3; the absorption maximum of 5 at 504 nm is red-
shifted by 90−113 nm compared with that of 1, 2, 3, and 4,which can be ascribed to the stronger electron-donating groupof aza-crown-ether of 5 (Figure 2a). As shown in Figure 2b, 1−5 show an emission maximum at 520, 532, 518, 583, and 641nm, respectively. The ethanol solutions of 4 and 5 emit weakyellow and strong red light, respectively, while 1, 2, and 3 arehardly emissive (Figure 3). All of the above informationsuggests that both absorption and photoluminescence (PL)spectra are in agreement with the order of the extension of theπ-systems and the increase of electron-donating ability of thedonors: aza-crown-ether > carbazole > heterocyclic ring.
Aggregation-Induced Enhanced Emission. To inves-tigate the AIE attributes of 1−5, we added different amounts ofwater, a poor solvent for the luminogens, to the pure ethanolsolutions by defining the water fractions ( fw) of 0−95% andthen monitored the absorption and PL change with theexcitation wavelengths of 391, 404, 392, 414, and 504 nm for1−5, respectively.Figure 4a2 shows that the PL intensity of 1 increases slowly
in aqueous mixtures when fw < 80% and increases dramaticallywhen fw > 80%. From the pure ethanol solution to an ethanol−water mixture with fw = 95%, the PL intensities increase by 9-fold for 1. Similar enhancement can be observed in thebehaviors of 2 and 3. The PL intensity of 2 enhances 7-foldwhen fw increases from 0 to 60%, while the intensity of 3enhances 11-fold when fw increases from 0 to 80% (Figure 4b2,c2). The behaviors of 4 are totally different from that of 1−3.With a gradual addition of water into the ethanol, the emissionof 4 is dramatically weakened and the emission color isbathochromically shifted when fw ≤ 40%. The light emission is
Figure 2. Absorption (a) and PL (b) spectra with the excitation wavelength of 391, 404, 392, 414, and 504 nm for 1−5, respectively, in ethanol witha concentration of 1 × 10⁻⁵ mol L−1.
Figure 3. (a) Fluorescent images of 1−4 in ethanol (5 × 10⁻⁵ M), ethanol/water (5/95, v/v), and in the form of powder upon excitation with a 365nm light source. (b) Crystal photographs of 1−4.
The Journal of Organic Chemistry Article
dx.doi.org/10.1021/jo400116j | J. Org. Chem. 2013, 78, 3222−32343224

invigorated from fw ≈ 50 vol % and reaches its maximum valueat 70% water content, which is 8-fold higher than that in pureethanol solution. Meanwhile, the emission maximum was
gradually red-shifted to 589 nm when fw reaches 95 vol %.Moreover, considering that the ethanol solution of 4 emitsweak yellow light while 1−3 are hardly emissive (Figure 3), 4
Figure 4. Absorption and PL spectra of 1−4 in ethanol/water mixtures with different water fraction ( fw). The inset depicts the changes of PL peakintensity with different water fractions.
The Journal of Organic Chemistry Article
dx.doi.org/10.1021/jo400116j | J. Org. Chem. 2013, 78, 3222−32343225

shows a larger torsion angle between the phenyl ring andheterocyclic ring than those of 1−3 in the gas phase or in thecrystal because of the large internal steric hindrance, as shownin Figure 8.It is presumable that in the mixtures with low water fractions
(0 to 40%), molecules of 4 may cluster together to formrandom, amorphous aggregates. When the water fractionbecomes high, its molecules may agglomerate in an orderedfashion to form crystallike aggregates.33 This phenomenon isalso probably caused by the change of solvent polarity withaddition of water at low water fractions, then the water caninteract with solute molecules immediately, which wouldweaken the emission gradually.34 As can be seen in Figure4b2,d2, after reaching a maximum intensity at 90% watercontent for 2 and 70% water content for 4, respectively, the PLintensity of the two compounds decreases with increasing watercontent. This phenomenon was often observed in somecompounds with AIE properties, but the reasons remainunclear.35,36 There are two possible explanations for thisphenomenon: (1) After the aggregation, only the molecules onthe surface of the nanoparticles emit light and contribute to thefluorescent intensity upon excitation, leading to a decrease influorescent intensity. However, the restriction of intramolecularrotations of the heterocyclic rings around the carbon−carbonsingle bonds in the aggregation state can enhance lightemission. The net outcome of these antagonistic processesdepends on which process plays a predominant role in affectingthe fluorescent behavior of the aggregated molecules.37 (2)When water is added, the solute molecules can aggregate intotwo kinds of nanoparticle suspensions: crystal particles andamorphous particles. The former one results in an enhance-ment in the PL intensity, while the latter leads to a reduction inintensity.38 Different from 1−4, with the addition of water, theemission of 5 is gradually weakened or suffers aggregation-caused quenching (ACQ) (Figure 5), more likely due to theaggregation and the presence of excitons presenting paralleltransition dipole, which was observed for isophoronederivatives by Massin.28
The changes of the integral under emission bands withdifferent water fractions ( fw) were analyzed, which is in linewith the changes of PL peak intensity with water fraction(Supporting Information Figure S3). The emission trends of1−5 remain the same as changing the excitation wavelength to470 nm for 1−4 and 590 nm for 5 (Figure S4) is probably dueto the nanoparticles being composed of molecules that haveemissive ability, and the emission trend may depend on thenumber of the individual molecules in nanoparticles. Figure 3
shows fluorescence images of 1−4 in the ethanol solutions,nanoparticle suspensions (95% water content), and powderunder UV light. In a word, these increases in fluorescenceintensity of 1−4 were considered to be a result of the AIEeffect. As aggregates formed, the restriction of intermolecularrotation increased, which led to increased fluorescenceemission. The notorious effect of ACQ of 5 indicates that theAIE effect of the compounds is dominated by substitution.The absorption spectra of compounds 1−4 in the ethanol/
water mixtures (50 μM) are shown in Figure 4a1−d1. Thespectral profiles of 1, 2, and 3 are significantly changed when fw> 85, 80, and 90%, respectively. Meanwhile, the absorptionpeaked at 400 nm, with a shoulder around 460 nm emerginginitially. The intensities of absorption peaks of the compounds1−3 positioned at 270 and 400 nm gradually decrease with theincreasing water content, while the shoulder peak located at∼460 nm emerges afterward and then gradually becomesstrong, indicating the formation of nanoscopic aggregates of thecompounds 1−3. 4 exhibits the same behaviors as 1−3, withthe increasing water fractions, the corresponding intensities ofthe peaks gradually decrease and the maximum absorptionwavelength gradually red shifts. The light scattering, or Mieeffect, of the nanoaggregate suspensions in the solvent mixtureseffectively decreases light transmission in the mixture andcauses the apparent high absorbance and level-off tail in thevisible region of the UV absorption spectrum.39,40
The growth progresses of 1 and 2 were studied by scanningelectron microscopy (SEM) with different water fractions. For1, upon injection of ethanol into the mixture of ethanol/water(40/60, v/v), nanoaggregates formed immediately with sizesvarying from 150 to 250 nm. Much smaller globularnanoparticles with a size range of 50−150 nm were obtainedin ethanol/water (5/95, v/v) (Figure 6a,b). The diameter ofthe nanoparticles decreases with the increasing proportion ofwater owing to the more compact aggregation, which is alsoverified by the SEM images for 2 (Figure 6c,d). Thisphenomenon suggests that the diameters of the nanoparticlesare correlated with the ethanol/water ratio.41,42 The decreasingdiameters of nanoparticles upon increasing amount of water, asshown in SEM images, give us direct evidence of molecularaggregation during the emission enhancement, while smallerglobular nanoparticles in ethanol/water (5/95, v/v) are in favorof fluorescence emissions.To have a quantitative comparison, we measured the
fluorescence quantum yields (ΦF) of the molecules in boththe solution and crystal. The experimental errors are estimatedto be ±15% from sample concentrations and instruments. The
Figure 5. Absorption and PL spectra of 5 in ethanol/water mixtures with different water fraction ( fw). The inset depicts the change of PL peakintensity with different water fraction.
The Journal of Organic Chemistry Article
dx.doi.org/10.1021/jo400116j | J. Org. Chem. 2013, 78, 3222−32343226

ΦF values of 1−4 in the solid state are 2.7, 12.9, 3.8, and 16.6%,respectively, measured by using an integrating sphere, which arehigher than that of 1−4 in the solution (ΦF < 0.1% for 1−3, ΦF= 0.5% for 4) and manifest their AIE feature (Table 1). On thecontrary, the ΦF value of 5 solid is <0.1%, which is much lowerthan that of its ethanol solution (ΦF = 11.1%). The changes ofthe fluorescence quantum yield (ΦF) from solution to crystalalso confirm the opposite aggregation-induced fluorescencebehaviors of 1−4 and 5 (Table 1). The substitution groupvarying from heterocycle or carbazole to aza-crown-etherproduces a significant increase in the solution fluorescenceefficiency and the obvious reduction in the solid fluorescenceefficiency. Therefore, the opposite aggregation-induced fluo-rescence behaviors of 1−4 and 5 may be mainly attributed tothe difference of the substitution group.Time-resolved fluorescence measurements were performed
and the detailed data of the fluorescence decay curves of 1−5are listed in Table 1 (Figure S2). The experimental errors areestimated to be ±11% from sample concentrations andinstruments. The lifetime of 1−5 in ethanol is obtained bymonitoring at the monomer emission. The decay behavior of1−5 is in a double-exponential manner in the solution obtainedby monitoring at the monomer emission. The lifetime of 1−4 isalmost from the contribution of the shorter lifetime species,while the lifetime of 5 is mainly from the contribution of longer
lifetime species. As shown in Table 1, the weighted meanlifetime of 5 (0.79 ns) in ethanol is much longer than that of 1(0.03 ns), 2 (0.05 ns), 3 (0.05 ns), and 4 (0.12 ns). This maybe attributed to the larger delocalization of the lone pair ofelectrons on the N atom from 5, leading to a larger molecularstabilization effect for the excited state of the aza-crown-ethergroup.43 Moreover, the solid of 1, 2, and 4 decays through threemain relaxation pathways, while the decay behavior of 3 can befitted with a double-exponential behavior, which all showobviously longer weighted mean lifetimes compared to the puresolvents when monitoring at 370 nm. The long lifetimeindicates the existence of new aggregation species or excitoniccouplings. The decay of the powder of 5 is too fast to bemeasured with our equipment (the limit is 0.01 ns).Additionally, the fluorescence lifetimes of 5 in solution were
calculated by multiplying the corresponding quantum yield onnatural lifetime, which can be easily calculated from the knownStrickler−Berg equation (eq 1).44 A calculated fluorescencelifetime of 0.72 ns was obtained, which is in excellentagreement with the experimental value (0.79 ns) and furthervalidates the experimental time-resolved technique.
∫∫∫τ
ε= ×
−
−nI v v
I v v vv
vv
12.88 10
( )d
( ) d( )
d0
9 23
(1)
in which n is the refractive index, I is the fluorescence emission,ε is the extinction coefficient, and v is the wavenumber.The natural radiative lifetime τ0 and the fluorescence lifetime
τ are related through the quantum yield Φ by
ττ
Φ =0 (2)
Different Properties at the Different States. To gainfurther insight into the AIE mechanism of 1−4, we conducted aseries of absorption and PL measurements in the puresolutions, the mixed solutions with fw = 95%, the powder,and the single crystals (Figure 7). The crystalline-stategeometries were obtained directly from single-crystal data.The geometries in the gas phase of 1−4 (generally, themolecular geometry in the dilute solution can be representedwith that of the gas phase) were obtained by geometryoptimization in vacuum, which was based on their crystallo-graphic data for quantum-chemical modeling. Figure 7a1−d1show absorption spectra of the different states of 1−4 groundedin barium sulfate. All spectra are considerably broadened andred-shifted compared to the solution. Emission spectra were
Figure 6. SEM images of 1 and 2 in ethanol/water mixtures atconcentrations of 5 × 10⁻⁵ M with different water fractions: (a) 1 inethanol/water (40/60, v/v); (b) 1 in ethanol/water (5/95, v/v); (c) 2in ethanol/water (40/60, v/v); (d) 2 in ethanol/water (10/90, v/v).
Table 1. Fluorescence Quantum Yield and Fluorescence Lifetime of 1−4 in Ethanol Solution and Solid
sample λdetc (nm) τ1
d (ns) A1e τ2
d (ns) A2e τ3
d (ns) A3e ⟨τ⟩f (ns) χ2 ΦF
g
1-solutiona 530 0.03 1.00 5.27 0.00 0.03 1.21 <0.1%1-solida 523 0.10 0.90 0.58 0.10 4.25 0.00 0.15 1.15 2.7%2-solutiona 528 0.05 1.00 5.92 0.00 0.05 1.21 <0.1%2-solida 579 0.18 0.96 1.18 0.04 4.15 0.00 0.22 1.07 12.9%3-solutiona 532 0.05 1.00 4.69 0.00 0.05 1.32 <0.1%3-solida 530 0.27 0.98 1.21 0.02 0.29 1.25 3.8%4-solutiona 579 0.12 1.00 3.72 0.00 0.12 1.31 0.5%4-solida 553 0.36 0.64 1.64 0.34 6.62 0.01 0.85 1.12 16.6%5-solutionb 648 0.43 0.25 0.90 0.75 0.79 1.23 11.1%5-solidb 648 <0.01 <0.01 <0.1%
aλex = 370 nm. bλex = 460 nm. cDetection wavelength. dFluorescence lifetime. eFractional contribution. fWeighted mean lifetime. gFluorescencequantum yield measured by using an integrating sphere.
The Journal of Organic Chemistry Article
dx.doi.org/10.1021/jo400116j | J. Org. Chem. 2013, 78, 3222−32343227

recorded with an excitation wavelength at 391, 404, 392, and414 nm for 1−4, respectively, close to the absorption maximumfound in barium sulfate. Only one structureless emission peakwas observed whatever the compound. Figure 7b2,c2 showsthat the λem values of 2 and 3 exhibit the minimum values inethanol and the maximum values in the form of crystal. Thecrystal compound 2 emits a strong orange-red fluorescencewith the peak wavelength of 590 nm, while 3 emits a strong
yellow fluorescence with the peak positioned at 550 nm (Figure3). They are obviously red-shifted 58 and 32 nm, respectively,with respect to the values of 532 nm for 2 and 518 nm for 3 inethanol solution. Figure 8 shows that the optimized geometriesof both 2 and 3 molecules in the gas phase have twistedconformation with a larger torsion angle of 13.34 and 17.32°between the phenyl ring and heterocycle than those of thecrystal state (6.57 and 7.66°) (Figure 8), respectively, which is
Figure 7. Absorption and PL spectra in the pure solvent, the mixed solution with fw = 0.95, the powder, and the crystal.
The Journal of Organic Chemistry Article
dx.doi.org/10.1021/jo400116j | J. Org. Chem. 2013, 78, 3222−32343228

Figure 8. Molecular structures of 1−4 in the crystal and in the isolated state.
Table 2. Crystallographic Data for 1−4
compound 1 2 3 4
empirical formula C22H20N4 C22H20N4 C21H19N5 C31H25N3
formula weight 340.42 340.42 341.41 439.54crystal system triclinic monoclinic monoclinic monoclinicspace group Pi P21/c P21/c P21/na [Å] 5.743(5) 6.149(5) 6.439(5) 12.286(5)b [Å] 9.430(5) 7.323(5) 7.222(5) 13.694(5)c [Å] 18.057(5) 40.953(5) 39.313(5) 15.580(5)α [°] 90.784(5) 90.000(5) 90.000(5) 90.000(5)β [°] 94.855(5) 90.751(5) 90.207(5) 110.838(5)γ [°] 106.042(5) 90.000(5) 90.000(5) 90.000(5)V [Å3] 935.7(10) 1844(2) 1828.1(19) 2449.8(16)Z 2 4 4 4T [K] 298(2) 298(2) 298(2) 298(2)Dcalcd [g·cm
−3 ] 1.208 1.226 1.240 1.192μ [mm−1] 0.073 0.075 0.077 0.070θ range [°] 1.13−25.00 0.99−25.00 1.04−25.00 1.83−24.99total no. data 6710 13493 25032 17145no. unique data 3259 3248 3233 4312no. params refined 237 237 237 309R1 0.0408 0.0475 0.0725 1.014wR2 0.1261 0.1290 0.1945 0.0400GOF 1.021 0.995 1.172 0.1253
Figure 9. (a) ORTEP diagram of 1. (b) Restricted twisting motions in crystals of 1. (c) One-dimensional chain of 1 showing the C−H···N (violet)hydrogen bond and the π−π stacking (sea green) along the b-axis. (d) Two-dimensional layer structure of 1 showing the C−H···π stacking (lime)along the a-axis. Hydrogen atoms except H10 and H18A are omitted for clarity.
The Journal of Organic Chemistry Article
dx.doi.org/10.1021/jo400116j | J. Org. Chem. 2013, 78, 3222−32343229
different from that of 4. The crystals of 4 emit a yellowfluorescence with the peak wavelength of 565 nm, which isblue-shifted 18 nm compared with that in ethanol (583 nm),which is ascribed to the smaller dihedral angle in ethanol(51.32°) than that of crystal (59.31°), and the less distortedconformations permit effective conjugation and result in red-shifted emission (Figure 7d2). However, the significantly red-shifted emission of 1 in the crystalline state and mixed solutioncompared with that of ethanol could not be explained by theabove-mentioned viewpoint; the reason is still unclear and willbe explored further.Moreover, the emission maxima of the crystals 1 and 4 are
about 540 and 565 nm, respectively, which are blue-shifted by13 and 22 nm compared with those of the mixed solution (553nm for 1 and 587 nm for 4), which may be attributable to theconformation twisting of the heterocyclic rings of the
luminogens to fit into the crystalline lattices. Without suchrestraint, the molecules in the amorphous state may assume amore planar conformation and thus show a redderluminescence.45 Furthermore, as shown in Figure 8, both 1and 4 molecules show a larger torsion angle between the phenylring and heterocycle than those of 2 and 3 in the gas phase orin the crystal because of the large internal steric hindrancebetween the two H atoms on imidazol or carbazol and the twoH atoms on phenyl.
Mechanisms of Emission Enhancement. The observa-tions of aggregation-induced emission (AIE) triggered us toelucidate the molecular arrangement in crystals. In order tobetter understand the mechanism, single crystals of 1, 2, 3, and4 were obtained by slow evaporation from methanol/CHCl3mixture solution. Their crystal data and collection parametersare summarized in Table 2.
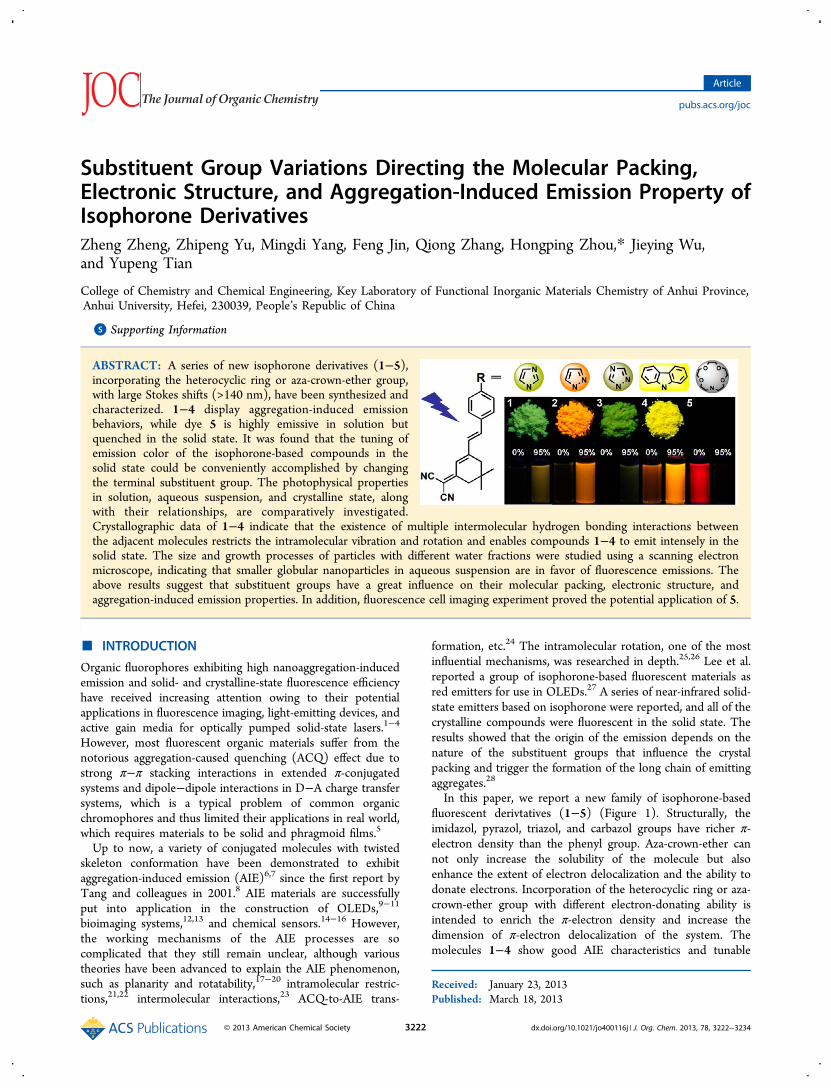
Figure 10. (a) ORTEP diagram of 2. (b) Restricted twisting motions in crystals of 2. Hydrogen atoms except H5 are omitted for clarity.
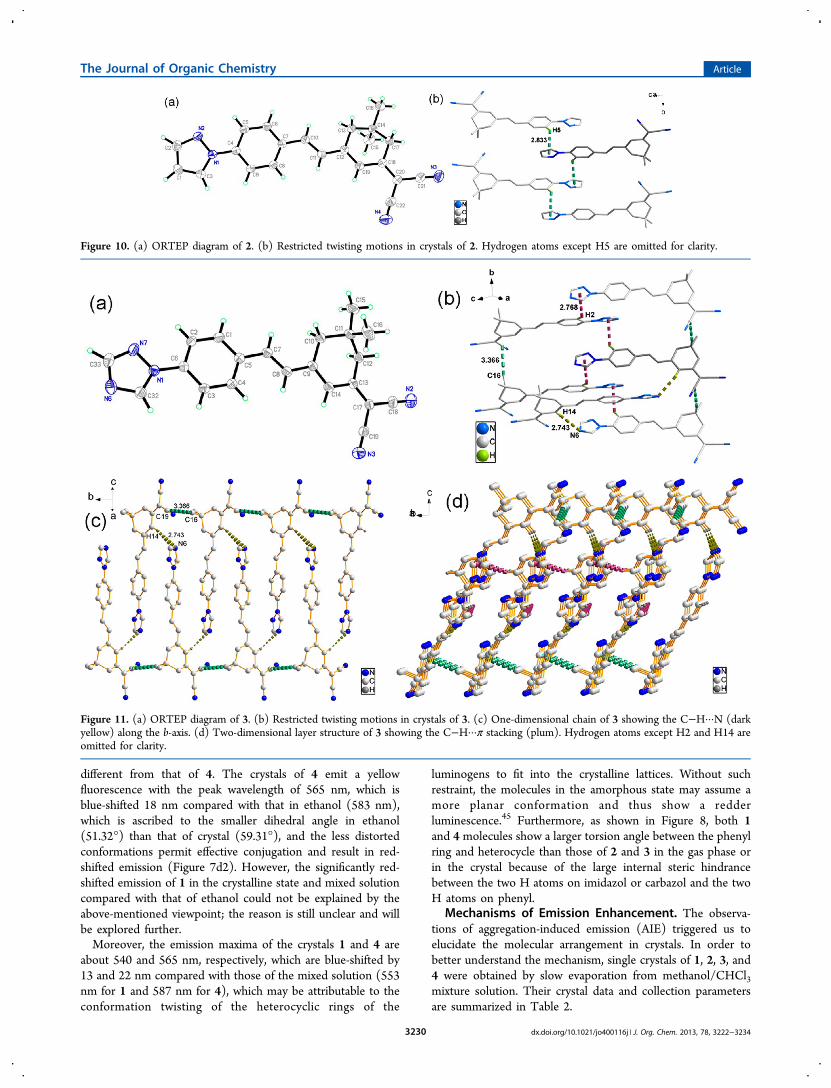
Figure 11. (a) ORTEP diagram of 3. (b) Restricted twisting motions in crystals of 3. (c) One-dimensional chain of 3 showing the C−H···N (darkyellow) along the b-axis. (d) Two-dimensional layer structure of 3 showing the C−H···π stacking (plum). Hydrogen atoms except H2 and H14 areomitted for clarity.
The Journal of Organic Chemistry Article
dx.doi.org/10.1021/jo400116j | J. Org. Chem. 2013, 78, 3222−32343230

The ORTEP diagrams with atom numbering scheme andsome of the interactions in the crystal have been depicted inFigures 9a−12a. The dihedral angles between the heterocyclicring and the phenyl plane are 49.32° for 1, 6.57° for 2, 7.66° for3, and 59.31° for 4. The data of the crystals show that theplanarity of both 2 and 3 is better than that of 1 and 4, whichmay be due to the large hindrance between the two H atoms onimidazol or carbazol and the two H atoms on phenyl. Figure 9bshows that the flexible molecule 1 is restricted by the C−H···Nhydrogen bonds (d = 2.691 Å), C−H···π staking interactions (d= 2.837 Å), and partial π···π staking interactions (a verticaldistance of 2.635 Å with an angle of 28°) from the adjacentmolecules. As for the phenyl rings slipping along the axis, thereis no overlapped phenyl rings, and the shortest C···C distance is4.064 Å, which could avoid the maximum face-to-face stackingcausing the quenched emission (as seen in the inset of Figure9b). Thus, the photoisomerization process can effectively beprevented. Furthermore, the 1D chain and 2D layer structure of1 are formed through C−H···N hydrogen bonds, π−π stakinginteractions, and C−H···π staking interactions (Figure 9c,d).The case of 3 is the same with 1 and is restricted by the C−H···N hydrogen bonds (d = 2.743 Å), C−H···π stakinginteractions (d = 2.768 Å), and C···π staking interactions (d =3.366 Å) from the adjacent molecules (Figure 11b). Theseinteractions also form the 1D chain and 2D layer structureshown in Figure 11c,d. In 4, the molecules are fixed intocentrosymmetric antiparallel dimers by the two adjacentmolecules, and the distance between them is 3.533 Å (Figure12b). Figure 12c,d shows its 1D chain and 2D layer structure,respectively. However, completely different from 1, 3, and 4, 2only exists as a C−H···π interaction as indicated from thepacking diagram shown in Figure 10b.For compounds 1−4, neither J nor H aggregates could be
observed (Figures 9−12). Meanwhile, from further inspectionof the crystal structures of 1, 2, 3, and 4, however, multiple C−
H···π hydrogen bonds with distances of 2.596−2.837 Å areformed between the hydrogen atoms of the phenyl rings in onemolecule and the π cloud of planar heterocyclic ring in anothermolecule (Figures 9−12). This is a common feature of AIEactive molecules.46−48 Beside C−H···π interactions, there alsoexist C−H···N, C···π, and partial π···π interactions within theaggregate structure. The various intermolecular interactionshelp rigidify the conformation and lock the intramolecularrotations of the heterocyclic ring and the phenyls against thecentral isophorone unit. As a result, the excited-state energyconsumed by intramolecular rotation is greatly reduced, thusenabling the molecules to emit intensely in the solid state.The molecule packing in the solid state would produce dual
roles on the fluorescence.49 On the one hand, intermolecularinteraction could possibly form the species such as excimersand exciplexes, resulting in the quenched emissions. On theother hand, aggregation can restrict the intramolecular motion,intersystem crossing, intramolecular photochemical reactions,etc., which could reduce the nonradiative decay channels andenhance the emission. The competition between these twoopposite factors determines the aggregation-induced fluores-cence. For the isophorone derivatives, the variations insubstitution group bring dramatic changes in the fluorescencein ethanol solvent and the AIE processes in mixed solution. Asfor the dual roles of molecule packing in the emission, it isobvious that the advantageous side outweighs the disadvanta-geous one for 1, 2, 3, and 4. As for 5, the solution emission isrelated to the isolated molecule instead of the excimer. Thesolution emission efficiency is much higher than that of 1, 2, 3,and 4 solution. However, the aggregation process of 5molecules, in a whole, creates a disadvantageous effect on theemission.
Electronic Structure. To understand the relationshipbetween the optical property and electronic structure, theHOMO and LUMO of 1−5 were calculated by DFT/B3LYP/
Figure 12. (a) ORTEP diagram of 4. (b) Restricted twisting motions in crystals of 4. (c) One-dimensional chain of 4 showing the C−H···π (brightgreen) along the b-axis. (d) Two-dimensional layer structure of 4 showing the C−H···π stacking (dark red). Hydrogen atoms except H8C and H7Aare omitted for clarity.
The Journal of Organic Chemistry Article
dx.doi.org/10.1021/jo400116j | J. Org. Chem. 2013, 78, 3222−32343231

6-31G (d) based on the molecule conformation in the crystalstructure (Figure 13).50−52 The results indicate that calculatedband gaps of 1−5 are different (3.08, 3.01, 3.18, 2.35, and 2.61eV for 1−5, respectively), and the values of 4 and 5 are smallerthan 1, 2, and 3, which is consistent with the absorptionmaximum. The results reveal that increasing extension of the π-systems and electron-donating ability of the donors both canlower the band gaps obviously. The theoretical study also nicelyexplains the bathochromic shift in the absorption and emissionof 4 and 5 relative to those of 1, 2, and 3.Cell Imaging Application of 5. Considering the solubility
of the molecule, the chromophore 5 containing aza-crown-ether was picked out due to its high quantum yield and largeStokes shift (147 nm). To evaluate the performance of 5 inliving cells, fluorescence microscopy imaging was performed.HepG2 cells were the testing candidates and were cultured andstained with 5. A bright-field image (Figure 14B) of each cell
was taken immediately prior to the imaging. The fluorescentimages and the merged image show that after a 2 h incubationwith HepG2 cells (Figure 14A,C), 5 went through themembrane and just localized uniformly in the cytoplasm. Theintense fluorescence is mainly because 5 internalizes in theHepG2 cell cytoplasm and the distribution in the nucleolus issignificantly lower, suggesting that only the cell cytoplasm canbe labeled by 5. These results demonstrate the bioimagingapplication of 5 by labeling HepG2 cells and also its lowtoxicity for living cells.Considering their application in intracellular imaging, the
MTT assay was performed to ascertain the cytotoxic effect of 5against HepG2 cells over a 24 h period. Cytotoxicity is apotential side effect of dyes that must be controlled whendealing with living cells or tissues. Figure 15 shows the cellviability for HepG2 cells treated with 5 at differentconcentrations for 24 h. The results clearly indicate thatHepG2 cells incubated with concentration of 5 μm of 5 remain90% viable after 24 h of feeding time, demonstrating thesuperior biocompatibility of 5. Besides, it is found that highconcentration only leads to a gradual decrease of viable cells, as
shown in Figure 15. As a result, cytotoxicity tests definitelyindicate that the low micromolar concentrations of 5 have smalltoxic effects on living cells over a period of 24 h, and 5 indeedhas great potentials for biological studies.
■ CONCLUSIONIn summary, a series of flexibly cored chromospheres 1−5 withdifferent functional terminal groups have been designed andsynthesized. All luminogenic molecules show solvatochromismwith large Stokes shifts (>130 nm). The compounds 1−4 showweak fluorescence, while 5 shows strong emission in the pureethanol solution. The PL of the nanoaggregates of 5 in aqueoussuspension is quenched by aggregate formation, while that of1−4 is enhanced, demonstrating a typical AIE phenomenon.Crystallographic data of 1−4 indicate that there is neither Jaggregates nor H aggregates observed in the crystal. Theexistence of multiple C−H···π bonds and C−H···N interactionsbetween the adjacent molecules restricts the intramolecularrotations and blocks the nonradiative processes, resulting in theenhanced emissions. The DFT calculations result in HOMOsand LUMOs consistent with the absorption spectra of thecompounds 1−5. The results demonstrate that the structuralvariation has a great influence on their photophysicalproperties, molecular packing, electronic structure, andaggregation-induced emission properties. Furthermore, wealso demonstrated that 5 can be utilized as fluorescentvisualizers for intracellular imaging due to its excellentbiocompatibility and low toxicity.
■ EXPERIMENTAL SECTIONGeneral. All reagents were obtained commercially and used as
supplied. The compound 2-(3,5,5-trimethylcyclohex-2-enylidene)-malononitrile was prepared according to the literature.28 4-(1H-imidazol-1-yl)benzaldehyde, 4-(1H-pyrazol-1-yl)benzaldehyde, 4-(1H-1,2,4-triazol-1-yl)benzaldehyde, 4-(carbazol-9-yl)benzaldehyde, and 4-(1,4,7,10-tetraoxa-13-azacyclopentadecyl)benzaldehyde were preparedaccording to literature procedures.22,29,30 IR spectra were recorded
Figure 13. Energy level and electron density distribution of frontier molecular orbitals of dyes 1−5.
Figure 14. (A) Fluorescent images of HepG2 cells and (B) bright-fieldimage of HepG2 cells stained with 5. (C) Merged image.
Figure 15. MTT assay of HepG2 cells treated with 5 at differentconcentrations for 24 h.
The Journal of Organic Chemistry Article
dx.doi.org/10.1021/jo400116j | J. Org. Chem. 2013, 78, 3222−32343232

with a FT-IR spectrometer (KBr discs) in the 4000−400 cm−1 region.The NMR spectra were recorded on a 400 MHz NMR instrumentusing CDCl3 as solvent. Chemical shifts were reported in parts permillion (ppm) relative to internal TMS (0 ppm) and couplingconstants in hertz. Splitting patterns were described as singlet (s),doublet (d), triplet (t), quartet (q), or multiplet (m). The X-raydiffraction measurements were performed on a CCD area detectorusing graphite monochromated Mo Kα radiation (λ = 0.71069 Å) at298(2) K. Intensity data were collected in the variable ω-scan mode.The structures were solved by direct methods and difference Fouriersyntheses. The non-hydrogen atoms were refined anisotropically, andhydrogen atoms were introduced geometrically. Calculations wereperformed with the SHELXTL-97 program package. For time-resolvedfluorescence measurements, the fluorescence signals were collimatedand focused onto the entrance slit of a monochromator with theoutput plane equipped with a photomultiplier tube. The decays wereanalyzed by “least squares”. The quality of the exponential fits wasevaluated by the goodness of fit (χ2). The absolute photoluminescencequantum yield (ΦF) values of the solid and ethanol solution (5 × 10⁻⁵
M) were determined using an integrating sphere. Crystallographic data(excluding structure factors) for the structure(s) reported in this paperhave been deposited with the Cambridge Crystallographic Data Centreas supplementary publication no. CCDC: 916477, 916478, 916479,916480.Preparation of 1. Under nitrogen, 4-(1H-imidazol-1-yl)-
benzaldehyde (2.4 g, 13.8 mmol) and 2-(3,5,5-trimethylcyclohex-2-enylidene)malononitrile (2.6 g, 13.8 mmol) were dissolved in dryacetonitrile (100 mL). Ten drops of piperidine were added, and thesolution was stirred at 40 °C for 8 h. After cooling the reactionmixture, the yellow solid was filtered, washed with acetonitrile, anddried: yield 2.50 g (53%); mp 222 °C; 1H NMR (400 Hz, CD3Cl) δ(ppm) 7.92 (s, 1H), 7.63 (d, 2H), 7.44 (d, 2H), 7.33 (s, 1H), 7.2 (s,1H), 7.04 (d, J = 16.0 Hz, 1H), 7.02 (d, J = 16.0 Hz, 1H), 6.88 (s, 1H),2.62 (s, 2H), 2.48 (s, 2H), 1.10 (s, 6H); 13C NMR (100 MHz, CDCl3)δ (ppm) 169.0, 153.1, 137.9, 135.4, 135.0, 134.8, 130.9, 130.0, 129.0,124.1, 121.5, 117.8, 113.3, 112.6, 79.4, 43.0, 39.2, 32.0, 28.0; IR (KBr,cm−1) 2965, 2925, 2870, 2218, 1608, 1572, 1511, 1455, 1400, 1054,813; MALDI-TOF calcd for [M + H]+, 341.177; found, 341.179.Preparation of 2. The orange crystalline solid 2 was prepared
according to a similar procedure of 1 using 4-(1H-pyrazol-1-yl)benzaldehyde instead of 4-(1H-imidazol-1-yl)benzaldehyde: yield3.62 g (77%); mp 243 °C; 1H NMR (400 Hz, CD3Cl) δ (ppm) 7.97(d, 1H), 7.76−7.74 (t, 3H), 7.61 (d, 2H), 7.09 (d, J = 16.0 Hz, 1H),7.01 (d, J = 16.0 Hz, 1H), 6.86 (s, 1H), 6.5 (s, 1H), 2.61 (s, 2H), 2.48(s, 2H), 1.00 (s, 6H); 13C NMR (100 MHz, (CD3)2SO) δ (ppm)170.2, 155.8, 141.4 140.0, 136.5, 133.7, 129.4, 129.0, 127.8, 122.8,118.4, 113.8, 113.0, 108.2, 76.3, 42.2, 38.1, 31.6, 27.4; IR (KBr, cm−1)2958, 2923, 2855, 2214, 1604, 1557, 1513, 1461, 1390, 1040, 812;MALDI-TOF calcd for [M + H]+, 341.177; found, 341.135.Preparation of 3. The yellow crystals 3 was prepared according to
a similar procedure of 1 using 4-(1H-1,2,4-triazol-1-yl)benzaldehydeinstead of 4-(1H-imidazol-1-yl)benzaldehyde: yield 4.00 g (85%); mp213 °C; 1H NMR (400 Hz, CD3Cl) δ (ppm) 8.62 (s, 1H), 8.13 (s,1H), 7.75 (d, 2H), 7.66 (d, 2H), 7.09 (d, J = 16.0 Hz, 1H), 7.04 (d, J =16.0 Hz, 1H), 6.89 (s, 1H), 2.62 (s, 2H), 2.48 (s, 2H), 1.10 (s, 6H);13C NMR (100 MHz, CDCl3) δ (ppm) 169.0, 153.0, 152.8, 140.7,137.4, 135.5, 135.0, 130.2, 128.8, 124.3, 120.2, 113.2, 112.5, 79.5, 43.0,39.2, 32.0, 28.0; IR (KBr, cm−1) 2959, 2922, 2870, 2216, 1607, 1564,1519, 1460, 1399, 1049, 811; MALDI-TOF calcd for [M + H]+,342.172; found, 342.171.Preparation of 4. The yellow crystalline solid 4 was prepared
according to a similar procedure of 1 using 4-(carbazol-9-yl)-benzaldehyde instead of 4-(1H-imidazol-1-yl)benzaldehyde: yield3.53 g (60%); mp 226 °C; 1H NMR (400 Hz, CD3Cl) δ (ppm)8.16 (d, 2H), 7.75 (d, 2H), 7.63 (d, 2H), 7.47−7.40 (m, 4H), 7.31 (t,2H), 7.12 (d, J = 16.4 Hz, 1H), 7.08 (d, J = 16.0 Hz, 1H), 6.90 (s, 1H),2.63 (s, 2H), 2.52 (s, 2H), 1.11 (s, 6H); 13C NMR (100 MHz, CDCl3)δ (ppm) 169.1, 153.4, 140.4, 138.8, 135.7, 134.4, 129.7, 128.9, 127.1,126.1, 123.9, 123.6, 120.3, 113.4, 112.6, 109.7, 79.0, 43.0 39.2, 32.0,28.0; IR (KBr, cm−1) 2957, 2925, 2868, 2218, 1598, 1566, 1511, 1450,
1398, 1227, 814; MALDI-TOF calcd for C31H25N3, 439.205; found,439.208.
Preparation of 5. Under nitrogen, 4-(1,4,7,10-tetraoxa-13-aza-cyclopentadecyl)benzaldehyde (0.5 g, 1.55 mmol) and 2-(3,5,5-trimethylcyclohex-2-enylidene)malononitrile (0.29 g, 1.55 mmol)were dissolved in dry acetonitrile (10 mL). Five drops of piperidinewere added, and the solution was stirred at 40 °C for 8 h. Afterremoving the solvents, the product was purified by chromatography(ethyl acetate/petroleum ether = 3/2) to give a red solid: yield 0.53 g(70%); mp 142 °C; 1H NMR (400 Hz, CD3Cl) δ (ppm) 7.49 (d, 2H),7.04 (d, J = 16.0 Hz, 1H), 6.90 (d, J = 16.0 Hz, 1H), 6.80 (s, 1H),3.80−3.64 (m, 20H), 2.59 (s, 2H), 2.46 (s, 2H), 1.08 (s, 6H); 13CNMR (100 MHz, CDCl3) δ (ppm) 169.2, 155.1, 148.3, 137.87,137.83, 129.55, 124.7, 121.6, 114.2, 113.4, 112.7, 75.9, 71.1, 70.3, 70.0,68.0, 53.2, 43.0, 39.2, 32.0, 28.0; IR (KBr, cm−1) 2923, 2868, 2211,1597, 1549, 1504, 1454, 1390, 1181, 1126, 818; HRMS (ESI-MS)calcd for [M + H]+, 492.286; found, 492.285.
Preparation of Nanoaggregates. Stock ethanol solutions of thecompounds with a concentration of 10−3 M were prepared. Aliquots ofthe stock solution were transferred to 10 mL volumetric flasks. Afterappropriate amounts of ethanol were added, water was added dropwiseunder vigorous stirring to furnish 5 × 10⁻⁵ M solutions with differentwater contents (0−95 vol %). The UV−vis and PL measurements ofthe resultant solutions were then performed immediately.
Cell Culture and Incubation. HepG2 cells were seeded in 6-wellplates at a density of 2 × 10⁵ cells per well and grown for 96 h. For livecell imaging, cell cultures were incubated with the chromophores (10%PBS/90% cell media) at concentrations of 40 μM and maintained at37 °C in an atmosphere of 5% CO2 and 95% air for incubation time of2 h. The cells were then washed with PBS (3 × 3 mL per well), and 3mL of PBS was added to each well. The cells were imaged usingconfocal laser scanning microscopy and water immersion lenses.Excitation energy of 458 nm was used, and the fluorescence emissionwas measured at 615−686 nm.
Fluorescence Imaging. HepG2 cells were luminescently imagedon a Zeiss LSM 710 META upright confocal laser scanningmicroscope using 40× magnification water-dipping lenses formonolayer cultures. Image data acquisition and processing wasperformed using Zeiss LSM Image Browser, Zeiss LSM Image Expertand Image J.
Cytotoxicity Assays in Cells. To ascertain the cytotoxic effect ofthe compounds’ treatment over a 24 h period, the 5-dimethylthiazol-2-yl-2,5-diphenyltetrazolium bromide (MTT) assay was performed.HepG2 cells were trypsinized and plated to ∼70% confluence in 96-well plates 24 h before treatment. Prior to the compounds’ treatment,the DMEM was removed and replaced with fresh DMEM, and aliquotsof the compound stock solutions (100 μM DMSO) were added toobtain final concentrations of 5, 10, 20, 40, and 60 μM. The treatedcells were incubated for 24 h at 37 °C and under 5% CO2.Subsequently, the cells were treated with 5 mg/mL MTT (40 μL/well) and incubated for an additional 4 h (37 °C, 5% CO2). Then,DMEM was removed, the formazan crystals were dissolved in DMSO(150 μL/well), and the absorbance at 490 nm was recorded. The cellviability (%) was calculated according to the following equation: cellviability % = OD490(sample)/OD490(control) × 100, whereOD490(sample) represents the optical density of the wells treatedwith various concentration of the compounds and OD490(control)represents that of the wells treated with DMEM + 10% FCS. Threeindependent trials were conducted, and the averages and standarddeviations are reported. The reported percent cell survival values arerelative to untreated control cells.
■ ASSOCIATED CONTENT
*S Supporting InformationSpectroscopic data, absorption spectra, and fluorescence of 1−5in seven organic solvents. Time-resolved fluorescence curves of1−5. The changes of the integral under emission bands withdifferent water fractions. NMR and mass spectra for
The Journal of Organic Chemistry Article
dx.doi.org/10.1021/jo400116j | J. Org. Chem. 2013, 78, 3222−32343233

compounds 1−5. This material is available free of charge via theInternet at http://pubs.acs.org.
■ AUTHOR INFORMATIONCorresponding Author*E-mail: [email protected]. Fax: 86-551-5107304.NotesThe authors declare no competing financial interest.
■ ACKNOWLEDGMENTSThis work was supported by the Program for New CenturyExcellent Talents in University (China), the Doctoral ProgramFoundation of the Ministry of Education of China(20113401110004), the National Natural Science Foundationof China (21271003 and 21271004), the Natural ScienceFoundation of Education Committee of Anhui Province(KJ2012A024), the Natural Science Foundation of AnhuiProvince (1208085MB22), the 211 Project of Anhui University,the Team for Scientific Innovation Foundation of AnhuiProvince (2006KJ007TD), and the Ministry of EducationFunded Projects Focus on Returned Overseas Scholar.
■ REFERENCES(1) Kim, S.; Pudavar, H. E.; Bonoiu, A.; Prasad, P. N. Adv. Mater.2007, 19, 3791.(2) Kim, S.; Ohulchanskyy, T. Y.; Pudavar, H. E.; Pandey, R. K.;Prasad, P. N. J. Am. Chem. Soc. 2007, 129, 2669.(3) Yuan, W. Z.; Lu, P.; Chen, S.; Lam, J. W. Y.; Wang, Z.; Liu, Y.;Kwok, H. S.; Ma, Y.; Tang, B. Z. Adv. Mater. 2010, 22, 2159.(4) Forrest, S. R.; Thompson, M. T. Chem. Rev. 2007, 107, 923.(5) Thomass, S. W., III; Joly, G. D.; Swager, T. M. Chem. Rev. 2007,107, 1339.(6) Hong, Y. J.; Jam, W. Y.; Tang, B. Z. Chem. Commun. 2009, 4332.(7) Liu, J.; Lam, J. W. Y.; Tang, B. Z. Chem. Rev. 2009, 109, 5799.(8) Luo, J.; Lam, J. W. Y.; Cheng, L.; Chen, H.; Qiu, C.; Kwok, H. S.;Zhan, X.; Liu, Y.; Zhu, D.; Tang, B. Z. Chem. Commun. 2001, 1740.(9) Li, Z.; Dong, Y. Q.; Lam, J. W. Y.; Sun, J.; Qin, A.; Haussler, M.;Dong, Y. P.; Sung, H. H. Y.; Williams, I. D.; Kwok, H. S.; Tang, B. Z.Adv. Funct. Mater. 2009, 19, 905.(10) Zhao, Z. J.; Chen, S. M.; Shen, X. Y.; Mahtab, F.; Yu, Y.; Lu, P.;Lam, J. W. Y.; Kwok, H. S.; Tang, B. Z. Chem. Commun. 2010, 686.(11) Yuan, W. Z.; Chen, S. M.; Lam, J. W. Y.; Deng, C. M.; Lu, P.;Sung, H. H. Y.; Williams, I. D.; Kwok, H. S.; Zhang, Y. M.; Tang, B. Z.Chem. Commun. 2011, 47, 11216.(12) Yu, Y.; Hong, Y.; Feng, C.; Liu, J.; Lam, J. W. Y.; Faisal, M.; Ng,K. M.; Luo, K. Q.; Tang, B. Z. Sci. China, Ser. B: Chem. 2009, 52, 15.(13) Yu, Y.; Feng, C.; Hong, Y. N.; Liu, J. Z.; Chen, S. J.; Ng, K. M.;Luo, K. Q.; Tang, B. Z. Adv. Mater. 2011, 23, 3298.(14) Liu, Y.; Deng, C. M.; Tang, L.; Qin, A. J.; Hu, R. R.; Sun, J. Z.;Tang, B. Z. J. Am. Chem. Soc. 2011, 133, 660.(15) Liu, Y.; Qin, A. J.; Chen, X. J.; Shen, X. Y.; Tong, L.; Hu, R. R.;Sun, J. Z.; Tang, B. Z. Chem.Eur. J. 2011, 17, 14736.(16) Wang, J.; Mei, J.; Yuan, W. Z.; Lu, P.; Qin, A. J.; Sun, J. Z.; Ma,Y. G.; Tang, B. Z. J. Mater. Chem. 2011, 21, 4056.(17) Yamaguchi, Y.; Matsubara, Y.; Ochi, T.; Wakamiya, T.; Yoshida,Z. I. J. Am. Chem. Soc. 2008, 130, 13867.(18) Loudet, A.; Burgess, K. Chem. Rev. 2007, 107, 4891.(19) Kabe, R.; Nakanotani, H.; Sakanoue, T.; Yahiro, M.; Adachi, C.Adv. Mater. 2009, 21, 4034.(20) Shimizu, M.; Tatsumi, H.; Mochida, K.; Shimono, K.; Hiyama,T. Chem.Asian J. 2009, 4, 1289.(21) Itami, K.; Ohashi, Y.; Yoshida, J. I. J. Org. Chem. 2005, 70, 2778.(22) Yu, Z. P.; Duan, Y. Y.; Cheng, L. H.; Han, Z. L.; Zheng, Z.;Zhou, H. P.; Wu, J. Y.; Tian, Y. P. J. Mater. Chem. 2012, 22, 16927.(23) Hong, Y.; Lam, J. W. Y.; Tang, B. Z. Chem. Commun. 2009,4332.
(24) Yuan, W. Z.; Lu, P.; Chen, S.; Lam, J. W. Y.; Wang, Z.; Liu, Y.;Kwok, H. S.; Tang, B. Z. Adv. Mater. 2010, 22, 2159.(25) Zhao, Z. J.; Chen, S. M.; Shen, X. Y.; Mahtab, F.; Yu, Y.; Lu, P.;Lam, J. W. Y.; Kwoka, H. S.; Tang, B. Z. Chem. Commun. 2010, 46,686.(26) Zhao, Z. J.; Chen, S. M.; Lam, J. W. Y.; Jim, C. K. W.; Chan, C.Y. K.; Wang, Z. M.; Lu, P.; Deng, C. M.; Kwok, H. S.; Ma, Y. G.; Tang,B. Z. J. Phys. Chem. C 2010, 114, 7963.(27) Li, J.; Liu, D.; Hong, Z.; Tong, S.; Wang, P.; Ma, C.; Lengyel,O.; Lee, C. S.; Kwong, H. L.; Lee, S. Chem. Mater. 2003, 15, 1486.(28) Massin, J.; Dayoub, W.; Mulatier, J. C.; Aronica, C.; Bretonniere,Y.; Andraud, C. Chem. Mater. 2011, 23, 862.(29) Zhou, H. P.; Zhou, F. X.; Wu, P.; Zheng, Z.; Yu, Z. P.; Chen, Y.X.; Tu, Y. L.; Kong, L.; Wu, J. Y.; Tian, Y. P. Dyes Pigm. 2011, 91, 237.(30) Wang, X. M.; Zhou, Y. F.; Yu, W. T.; Wang, C.; Fang, Q.; Jiang,M. H.; Lei, H.; Wang, H. Z. J. Mater. Chem. 2000, 10, 2698.(31) Lemke, R. Synthesis 1974, 5, 359.(32) Zhang, H. G.; Tao, X. T.; Chen, K. S.; Yuan, C. X.; Yan, S. N.;Jiang, M. H. Chin. Chem. Lett. 2011, 22, 647.(33) Tong, H.; Hong, Y.; Dong, Y.; Ren, Y.; Haeussler, M.; Lam, J.W. Y.; Wong, K. S.; Tang, B. Z. J. Phys. Chem. B 2007, 111, 2000.(34) Zhang, X. Q.; Chi, Z. G.; Zhou, X.; Liu, S. W.; Zhang, Y.; Xu, J.R. J. Phys. Chem. C 2012, 116, 23629.(35) Zhang, X. Q.; Chi, Z. G.; Xu, B. J.; Li, H. Y.; Yang, Z. Y.; Li, X.F.; Liu, S. W.; Zhang, Y.; Xu, J. R. Dyes Pigm. 2011, 89, 56.(36) Zhang, X. Q.; Chi, Z. G.; Xu, B. J.; Chen, C. J.; Zhou, X.; Zhang,Y.; Liu, S. W.; Xu, J. R. J. Mater. Chem. 2012, 22, 18505.(37) Dong, S.; Li, Z.; Qin, J. J. Phys. Chem. B 2009, 113, 434.(38) Yang, Z. Y.; Chi, Z. G.; Yu, T.; Zhang, X. Q.; Chen, M. N.; Xu,B. J.; Liu, S. W.; Zhang, Y.; Xu, J. R. J. Mater. Chem. 2009, 19, 5541.(39) Tang, B. Z.; Geng, Y. H.; Lam, J. W. Y.; Li, B. S. Chem. Mater.1999, 11, 1581.(40) Lechner, M. D. J. Serb. Chem. Soc. 2005, 70, 361.(41) Wang, F.; Bazan, G. C. J. Am. Chem. Soc. 2006, 128, 15786.(42) Zhu, L. N.; Yang, C. L.; Qin, J. G. Chem. Commun. 2008, 6303.(43) Li, L.; Tian, Y. P.; Yang, J. X.; Sun, P. P.; Wu, J. Y.; Zhou, H. P.;Zhang, S. Y.; Jin, B. K.; Xing, X. J.; Wang, C. K.; Li, M.; Cheng, G. H.;Tang, H. H.; Huang, W. H.; Tao, X. T.; Jiang, M. H. Chem.Asian. J.2009, 4, 668.(44) Strickler, S. J.; Berg, R. A. J. Chem. Phys. 1962, 37, 814.(45) Chan, C. Y. K.; Zhao, Z. J.; Lam, J. W. Y.; Liu, J. Z.; Chen, S. M.;Lu, P.; Mahtab, F.; Chen, X. J.; Sung, H. H. Y.; Kwok, H. S.; Ma, Y. G.;Williams, I. D.; Wong, K. S.; Tang, B. Z. Adv. Funct. Mater. 2012, 22,378.(46) Dong, Y. Q.; Lam, J. W. Y.; Qin, A. J.; Liu, J. Z.; Li, Z.; Tang, B.Z. Appl. Phys. Lett. 2007, 91, 11111.(47) Xu, J. L.; Liu, X. F.; Lv, J.; Zhu, M.; Huang, C. S.; Zhou, W. D.;Yin, X. D.; Liu, H. B.; Li, Y. L.; Ye, J. P. Langmuir 2008, 24, 8.(48) Shen, X. Y.; Yuan, W. Z.; Liu, Y.; Zhao, Q. L.; Lu, P.; Ma, Y. G.;Williams, I. D.; Qin, A. J.; Sun, J. Z.; Tang, B. Z. J. Phys. Chem. C 2012,116, 10541.(49) Li, Y. X.; Chen, Z.; Cui, Y.; Xia, G. M.; Yang, X. F. J. Phys. Chem.C 2012, 116, 6401.(50) Ju, H. D.; Tao, X. T.; Wan, Y.; Shi, J. H.; Yang, J. X.; Xin, Q.;Zou, D. C.; Jiang, M. H. Chem. Phys. Lett. 2006, 432, 321.(51) Zheng, Z.; Zhang, Q.; Yu, Z. P.; Yang, M. D.; Zhou, H. P.; Wu,J. Y.; Tian, Y. P. J. Mater. Chem. C 2013, 1, 822.(52) Zhang, H. G.; Tao, X. T.; Chen, K. S.; Yuan, C. X.; Jiang, M. H.Synth. Met. 2011, 161, 354.
The Journal of Organic Chemistry Article
dx.doi.org/10.1021/jo400116j | J. Org. Chem. 2013, 78, 3222−32343234