substance abuse wayne, michigan
TRANSCRIPT

Wayne County 2012 Community Health Assessment Page 86
Wayne County Community Health Assessment
2012
WCCHA 2012

Wayne County 2012 Community Health Assessment Page 2
Acknowledgements
The development of the 2012 Wayne County Community Health Assessment is a
collaborative effort between Wayne Memorial Hospital, Wayne County Health Department, Wayne Action Teams for Health (WATCH), Wayne County Board of Health and East Carolina University. Please see below for members of the leadership collaborative. Becky Craig Wayne Memorial Hospital
Carolyn King Wayne County Health Department
Davin Madden Wayne County Health Department
Kim Larson, RN, PhD Wayne County Board of Health
Sissy Lee-Elmore Wayne Action Teams for Community Health (WATCH)
Mandee Foushee Lancaster, MA ECU Center for Survey Research
Justin Raines ECU Center for Survey Research
Zach Love ECU Center for Survey Research
The collaborators wish to acknowledge the participation of individuals from a
number of groups throughout Wayne County who shared their understanding, skills and innovative ideas for improving community health in Wayne County. Lt. Col. Chris Hayes, MD, for SJAFB Seymour Johnson AFB
Chris Martin Mount Olive Pickle
Harold Brashear, CPA Nunn, Brashear CPAs
Cedric Bradford Century 21 - Dees & Tyndall
Sam Hunter TA Loving
Ken Jones, MPA EastPointe
Nadir Attiah, MD Local Psychiatrist
Gratiela Zbarcea, MD Local Psychiatrist
Randy Swackhammer, MD Internal Medicine Physician
Dave Tayloe, MD Pediatrician
Lloyd Smith, MD Emergency Department Physician
Phyllis Hill, RN Wayne Initiative for School Health (WISH)
Brian Smith WC Office of Emergency Services
Bill Broadaway, Chair, Board of Directors Wayne Memorial Hospital
Jana Blackman, RN Wayne Memorial Hospital
Donna Edmundson, RN Wayne Memorial Hospital
Pam Anderson, RN Wayne Memorial Hospital
Georgia Dees Wayne Memorial Hospital
Pamela Johnson Cherry Hospital
Dr. Steve Peters Cherry Hospital
Ellen Brubeck, MD O'Berry Center
Ta-Kisha Darden Wayne County Health Department
Stephanie Howard, RD Wayne County Health Department - WIC

Wayne County 2012 Community Health Assessment Page 3
Brooke Bitzenhofer, Intern Wayne County Health Department
J.D. Evans Wayne County Commissioner
Christine Smith Wayne County Extension
Bill Johnston Curtis Media
Phyllis Moore News Argus
Allison Pridgen Wayne County Schools
Sandra McCullen Wayne County Schools
Ina Rawlinson Wayne Community College
Dr. Joy Phillips, RN Mount Olive College
Eryn McAulliffe Wayne County Services on Aging
Charlie Ivey Wayne Partnership for Children
John Richards YMCA
Karen Schneider United Way
Rovonda Freeman Bradford March of Dimes
Doricia Benton Community Soup Kitchen
Dr. Marlee Ray WAGES
Chuck Waller American Red Cross
Glenda White St. Mark Church of Christ
Rev. Joe Jackson Best Grove Missionary Baptist
Cpl. Marissa Davis City of Goldsboro Police
Robert Chunn Wayne County Sheriff's Department
Tom Flores Wayne County Sheriff's Department
Trooper Larry McKeithan NC State Patrol
Jimmie Ford State Board of Community Colleges
Appreciation is also expressed to the people within Wayne County who participated
in the 2012 Community Health Assessment survey, focus groups and public presentation providing vital information about their concerns and suggested action steps to make Wayne County a healthier community.

Wayne County 2012 Community Health Assessment Page 4
Table of Contents Purpose 7 Team Composition 7 Process Overview 7 Outcomes 8 County Overview 9 Population Demographics 9 Population Estimates 9 Age Distribution 10 Race Distribution 10 Sex Distribution 11 Economic Factors 11 Income and Poverty 11 Employment 14 Education 15 Educational Attainment 15 Dropout Rates 16 SAT Scores 17 Free and Reduced Lunch 18 Crime and Violence 18 Crime Index Rates 18 Detailed Crime Statistics 19 Health Indicators 20 Infant Mortality Rates 20 General Mortality Rates 20 Leading Causes of Death 21 Age-Specific Death Rates 22 Race/Sex-Specific Death Rates 23 Health Conditions 24 Cancer 24 Heart Disease 26 Diabetes 27

Wayne County 2012 Community Health Assessment Page 5
Asthma 29 Overweight/Obesity 30 High Blood Pressure 32 High Cholesterol 33 Communicable Diseases 34 HIV 34 AIDS 35 STDs 36 Tuberculosis (TB) 39 Maternal Health 40 Birth Rates 40 Pregnancy Rates 41 Abortion Rates 44 Maternal Health Indicators 44 Other Health Status Data 47 General Health Status 47 Mental Health 48 Smoking/Tobacco 50 Exercise 52 Screenings 52 Child Health 53 Access to Healthcare 55 Insured/Uninsured Population 55 Medicare/Medicaid 56 Hospital Utilization 56 Healthcare Providers 57 Environmental Health 58 Air Quality 58 Water Quality 59 Peer County Comparisons 59 Healthcare Resources 62 Parks and Recreation Facilities 63

Wayne County 2012 Community Health Assessment Page 6
Review of Primary Data 64 Stakeholders 64 Focus Groups 64 Community Survey 66 Summary and Next Steps 81 Appendix A – Community Survey 82 Appendix B – Focus Group Questions 109 Appendix C – Community Context 110 Access to Healthcare 110 Crime 112 Natural Recreation 113 Tobacco Use 114

Wayne County 2012 Community Health Assessment Page 7
Purpose
Local health departments within North Carolina are required to conduct a community health assessment every four years. In March of 2010, legislation was passed requiring not-for-profit hospitals to also conduct community health assessments. To meet the requirements, Wayne Memorial Hospital and the Wayne County Health Department partnered with the Wayne County Board of Health, Wayne Action Teams for Community Health (WATCH) and East Carolina University (ECU) to identify the community health needs in Wayne County.
The purpose of this community health assessment is to examine the health status of the community to ascertain priority areas of focus for the next three to four years. The health needs assessment process is inclusive and transparent. It involves various key stakeholder groups, including members of the community. Action plans for addressing key community health priorities will be formulated beginning Spring 2013.
Team Composition
Representatives from the Wayne County Health Department, Wayne Memorial Hospital, Wayne County Board of Health, WATCH and ECU cooperatively conducted the community health assessment. The collaboration identified the types and sources of data to be collected, determined the methods for collecting input from the community and key stakeholders concerning health related issues as well as communicating this information to the various stakeholders in order to prioritize community health concerns.
Process Overview
The community health assessment has several requirements. One requirement is the collection of primary data from community members. Wayne County elected to elicit feedback from key stakeholder groups, conduct focus groups throughout the county, as well as conduct a health opinion survey. The health opinion survey was adapted from the Community Health Assessment Guidebook, NC Division of Public Health.
The stakeholder group of more than 50 members met quarterly throughout this
process to provide feedback. A specific meeting with Goshen clinic providers was held near the end of data collection to assess their opinions of the needs. Ten focus groups were held in specific geographic locations to discover community members’ perception of health concerns and suggestions for improving health within the community. There were a total of 86 focus group participants. The survey was available online and in paper format in both English and Spanish. A total of 1,369 surveys were completed.
A review of secondary data was conducted by examining county level health data
primarily compiled by the NC State Center for Health Statistics. Examples of such data

Wayne County 2012 Community Health Assessment Page 8
included leading causes of mortality, health care resource availability, and prevalence data from the Behavioral Risk Factor Surveillance Survey (BRFSS). Factors such as demographics, educational attainment, economic vitality and environmental issues within a community also influence health. These data were reviewed to determine the potential for impact on health status within the county. Moreover, a review of data across several years was conducted to determine trends in health status for Wayne County.
Focus areas were selected based on the convergence of stakeholder input, focus group and survey results as well as secondary data sources. Members of the Wayne County Board of Health received the data presentation electronically prior to their January 2013 meeting. A review of the data was conducted at the January Board of Health meeting, as well as a review of the process undertaken to determine the focus areas including the recommendations from the leadership team.
Outcomes
The community health assessment identified the following focus areas for 2013 – 2016. Although this was a community health assessment, the social indicators below both directly and indirectly influence community health. Without addressing both social and health together, significant health improvements will not be accomplished.
Wayne County Focus Areas
Social Indicators:
- Poverty
-Access to healthcare
- Crime
- Education
Health Indicators:
-Health literacy
- Mental health
- Health Conditions

Wayne County 2012 Community Health Assessment Page 9
County Overview: The Good Life. Grown Here.
Wayne County was established in 1779 and has a total area of 557 square miles. Wayne County is located in the rural eastern portion of North Carolina, approximately 50 miles east of Raleigh and 90 miles west of Wilmington. Out of 100 North Carolina counties, Wayne County is the fourth highest-producing county, in term of farm cash receipts, at $353 million in 2011. 1 Agriculture has been a way of life here for many years, but the mechanization of farming has had a profound impact on the lifestyles of county residents, here and across the United States. Less active lifestyles at every age, and more time in front of computer screens have impacted health statistics that are dependent on diet, exercise and health habits, while communicable diseases (which were the cause of most hospital admissions years ago) have been brought under control. The surface of the county is level to gently rolling uplands with two primary waterways including the Neuse River and the Little River. The elevations are predominantly 120 to 145 feet above sea level. The climate is mild, with an average temperature of about 62 degrees and annual precipitation of about 50 inches of rainfall per year. 2
Goldsboro is the county seat and is situated geographically in the center of the
county. The municipalities located in Wayne County include the city of Goldsboro and the towns of Eureka, Fremont, Mount Olive, Pikeville, Seven Springs, and the Village of Walnut Creek. Wayne County has been named a metropolitan statistical area by the US government. Additionally, Wayne County is home to the Seymour Johnson Air Force Base, consisting of the 4th Fighter Wing and the 916th Air Refueling Wing. 3
Population Demographics Population Estimates As of July, 2011, the estimated population of Wayne County was up to 123,710 from the April, 2010 population count of 122,623. This is a growth of 0.9% with a net migration of 0.3%. Since April, 2000, the population of Wayne County has grown from 113,449, representing an 8.3% increase. 4
1 Wayne County Agriculture Highlights. Available at: http://wayne.ces.ncsu.edu/files/library/96/WAYNE%20COUNTY%20AGRICULTURE%20HIGHLIGHTS.pdf 2 Wayne County Government Website. Available at: http://www.waynegov.com/Page/16 3 Wayne County Government Website. Available at: http://www.waynegov.com/Page/16 4 NC Office of State Budget and Management. Available at: http://www.osbm.state.nc.us/ncosbm/facts_and_figures/socioeconomic_data/population_estimates/county_estimates.shtm

Wayne County 2012 Community Health Assessment Page 10
Age Distribution The graph below represents population data for Wayne County as of 2010. The median age in Wayne County is 36.7 years, whereas the median age in North Carolina was 36.7. The majority of the population in Wayne County is between the ages of 25 and 54 (39 percent). The school age (ages 5-19) population for Wayne County comprises 21 percent of the total population. Furthermore, 14 percent of the population in Wayne County is senior citizens (65 and older), which is slightly older than the North Carolina average, and older than the major metropolitan areas where major universities are situated. 5
Race Distribution The majority of Wayne County citizens are Caucasian (55.6 percent), whereas African-Americans represent 31.1 percent of the population. Since 2000, the Hispanic population in Wayne County has grown from 4.9 percent to 9.9 percent in 2010. American Indian, Alaska Native, Asian, Pacific Islander or persons reporting two or more races represent the remaining population. Overall, the race distribution is quite different from that of North Carolina. In North Carolina, 65.5 percent of the population is Caucasian and 21.5 percent is African-American. North Carolina’s percent population of Hispanic origin is 8.4 percent compared to 16.3 percent of the US population. 6
5 US Census Bureau, American Fact Finder. Available at: http://factfinder2.census.gov/faces/nav/jsf/pages/index.xhtml 6 US Census Bureau, American Fact Finder. Available at: http://factfinder2.census.gov/faces/nav/jsf/pages/index.xhtml
7 7 7 7 7
13 12
14
6 6
8
4
2
7 7 7 7 7
13 14 14
6 6 7
4
1
0
5
10
15
20
Perc
en
tage (
%)
Agee
Wayne County and NC Population Distribution by Age (2010)
Wayne
NC

Wayne County 2012 Community Health Assessment Page 11
Sex Distribution
The sex distribution in Wayne County as of 2010 is relatively equal with 51 percent being female and 49 percent being male. These percentages are identical to that of North Carolina in 2010. 7
Economic Factors Income and Poverty The graphs below depict Wayne County’s annual household income, median annual household income, per capita income, and percent of population below the poverty threshold. In 2011, 11.7 percent of Wayne County residents reported an annual household income less than $10,000, compared to 8.8 percent in North Carolina. Additionally, only 9.1 percent of Wayne County residents reported an annual household income of $100,000 or more, compared to 16.2 percent in North Carolina. 8 The average median annual household
7 US Census Bureau, State and County Quick Facts. Available at: http://quickfacts.census.gov/qfd/states/37/37191.html 8 US Census Bureau, American Fact Finder. Available at: http://factfinder2.census.gov/faces/nav/jsf/pages/index.xhtml
55.6
31.1
9.9
0.3 1.1 0.0 2.0
65.3
21.2
8.4
1.1 2.2 0.1 1.7
0
10
20
30
40
50
60
70
80
Perc
en
tage (
%)
Race
Wayne County and NC Population Distribution by Race (2010)
Wayne
NC

Wayne County 2012 Community Health Assessment Page 12
income in Wayne County in 2011 was $39,085, compared to $43,916 in North Carolina. 9 From 2007-2011, the average per capita income in Wayne County was $21,135, compared to $25,256 and $27,915 in North Carolina and the US, respectively. 10 As of 2011, 23.5 percent of Wayne County residents reported living in poverty, whereas 17.9 percent reported living in poverty in North Carolina. 11 These statistics are similar to previously reported statistics, and are typical of rural counties compared to more urbanized counties in North Carolina. In general, North Carolina is a more rural state than the average state, and income has always been lower than national averages. The average of North Carolina per capita income in 2007-2011 per the US census is 90.5% of the US average, compared to 82.8% in 1969.
9 US Census Bureau, American Fact Finder. Available at: http://factfinder2.census.gov/faces/nav/jsf/pages/index.xhtml 10 US Census Bureau, State and County Quick Facts. Available at: http://quickfacts.census.gov/qfd/states/37/37191.html 11 US Census Bureau, American Fact Finder. Available at: http://factfinder2.census.gov/faces/nav/jsf/pages/index.xhtml
11.7
7.7
14.8
11.6
15.9
20.0
9.2 9.1 8.8
6.8
12.8 12.2
14.8
17.9
10.5
16.2
0
5
10
15
20
25
Pe
rce
nta
ge (
%)
Income
Wayne County and NC Household Income (2011)
Wayne
NC

Wayne County 2012 Community Health Assessment Page 13
40,110 39,388
40,944 40,787
39,085
44,670
46,549
43,674 43,326
43,916
34,000
36,000
38,000
40,000
42,000
44,000
46,000
48,000
2007 2008 2009 2010 2011
Inco
me
in
Do
lla
rs
Year
Wayne County and NC Median Annual Household Income
Wayne
NC
$21,135
$25,256
$27,915
0
5,000
10,000
15,000
20,000
25,000
30,000
Wayne NC US
Inco
me
in D
oll
ars
Per Capita Income (2007-2011)

Wayne County 2012 Community Health Assessment Page 14
Employment Wayne County’s unemployment rate for 2011 was estimated at 9.4 percent compared to 10.5 percent for North Carolina. The unemployment rate in Wayne County has risen 3 percent since 2002. The highest unemployment rates for Wayne County for the past ten years were reported in 2010 with 9.5 percent of the population being unemployed. 12 Though unemployment in Wayne County is lower than North Carolina averages, the average wage in Wayne County is more similar to other rural areas of North Carolina, which is less than the average wage in urban areas, giving lower per capita income.
12 The Employment Security Commission of North Carolina, Labor Market Information. Available at: http://www.ncesc1.com/LMI/workForceStats/workForceMain.asp
17.4
19.2 20.7
19.7
23.4
14.3 14.6 16.3
17.5 17.9
0
5
10
15
20
25
30
2007 2008 2009 2010 2011
Ra
tes
Year
Wayne County and NC Poverty Rates
Wayne
NC

Wayne County 2012 Community Health Assessment Page 15
Education Educational Attainment The following graph depicts the educational attainment of Wayne County’s population age 25 and older. According to the 2010 estimates, 19.9 percent of the population 25 and older have not completed high school or received an equivalency diploma, compared to 15.2 percent of North Carolina adults. Wayne County has a lower percentage of adults (14.4 percent) who report having a bachelor’s degree or higher compared to North Carolina adults (27 percent). 13 Additionally, enrollment at Wayne Community College in the fall of 2012 was at near-record levels, due to the commitment of the college to serve employer needs in Wayne County, including agriculture. In addition, many Wayne County students are transferring to 4-year colleges after the first two years at Wayne Community College. 14
13 US Census Bureau, American Fact Finder. Available at: http://factfinder2.census.gov/faces/nav/jsf/pages/index.xhtml 14 The Goldsboro News-Argus. Available at: http://www.newsargus.com/news/archives/2012/11/28/colleges_enrollment_hits_new_high/
6.4 6.2
5.3 5.2 4.7 4.6
5.9
8.6
9.5 9.4
6.6 6.5
5.5 5.3 4.8 4.8
6.3
10.5 10.9 10.5
0
2
4
6
8
10
12
2002 2003 2004 2005 2006 2007 2008 2009 2010 2011
Rat
es
Year
Wayne County and NC Unemployment Rates
Wayne
NC

Wayne County 2012 Community Health Assessment Page 16
Dropout Rates The graph below depicts the dropout rates for Wayne County and North Carolina from 2006-2010. While the dropout rate in Wayne County has decreased from 5.7 per thousand students to 4.8 per thousand students in this time period, the 2010 estimate remains higher than North Carolina (3.7). 15
15 NC Public Schools Reports and Statistics. Available at: http://www.ncpublicschools.org/data/reports/
19.9
30.7
26.2
8.9 10.1
4.3
15.2
27.3
21.8
8.7
17.8
9.2
0
5
10
15
20
25
30
35
Less thanhigh school
High school/ GED
Somecollege
Associate'sdegree
Bachelor'sdegree
Graduate /Professional
degree
Pe
rce
nta
ge
(%
)
Education Level
Wayne County and NC Educational Attainment (2010)
Wayne
NC

Wayne County 2012 Community Health Assessment Page 17
SAT Scores The following graph reports the average SAT scores for Wayne County and North Carolina, calculated by adding the verbal and quantitative scores from 2007 to 2011. In this five year period, Wayne County has remained marginally lower than North Carolina, with average scores in 2011 being 950 in Wayne County and 1001 in North Carolina. 16
16 NC Public Schools Reports and Statistics. Available at: http://www.ncpublicschools.org/data/reports/
5.7
4.16
5.25 5.09 4.84
5.04
5.27
4.97
4.27 3.75
0
1
2
3
4
5
6
7
8
2005-2006 2006-2007 2007-2008 2008-2009 2009-2010
Ra
tes
Year
Wayne County and NC Dropout Rates per 1,000 Population
Wayne
NC
961 979 972
954 950
1004 1007 1006 1005 1001
500
550
600
650
700
750
800
850
900
950
1000
1050
1100
2007 2008 2009 2010 2011
Sco
re
Year
Average SAT Scores (Verbal + Quantitative)
Wayne
NC

Wayne County 2012 Community Health Assessment Page 18
Free and Reduced Lunch According to Wayne County Schools, 66.3 percent of children enrolled in Wayne County Schools for the 2010-2011 school years were enrolled for free or reduced price meal benefits. This percentage increased from 59.8 percent in the 2006-2007 school years. In contrast, 53.9 percent of children in North Carolina were enrolled in free and reduced lunch benefits in the 2010-2011 school years. 17
Crime and Violence Crime Index Rates As illustrated in the chart below, the index crime rates for Wayne County have decreased since 2006. However, when compared to neighboring counties such as Johnston County, the index crime rates are relatively high. 18 The table below provides detailed crime statistics for Wayne County from 2011. While the overall crime index rate has decreased
17 Data Center, Kids count. Available at: http://datacenter.kidscount.org/data/bystate/Rankings.aspx?ind=2239&state=NC 18 NC Department of Justice, Crime. Available at: http://www.ncdoj.gov/Crime/View-Crime-Statistics.aspx
59.8 59.2 61.1 63.5 66.3
48.5 48.4 49.9
66.3
53.9
0
10
20
30
40
50
60
70
80
2006-2007 2007-2008 2008-2009 2009-2010 2010-2011
Pe
rce
nta
ge
(%
)
School Year
Percentage of Students Enrolled in Free and Reduced Lunch
Wayne
NC

Wayne County 2012 Community Health Assessment Page 19
since 2006, the table indicates increases in specific crimes since 2003 such as burglary and larceny. Moreover, the violent crimes including murder, rape, robbery, and aggravated assault have steadily decreased since 2003. 19 As of 2012, Wayne County and Goldsboro reported 19 cases of murder, which is the most since 2007. 20
Detailed Crime Statistics
2011 Crime Detailed Crime Statistics for Wayne County Offense 2003 2004 2005 2006 2007 2008 2009 2010 2011
Murder 10 12 13 7 20 11 14 8 10
Rape 9 11 8 8 10 5 11 6 5
Robbery 148 126 146 142 131 155 129 151 126
Aggravated Assault
418 415 356 434 362 372 348 420 402
Burglary 1,476 1,585 1,329 1,532 1,653 1,658 1,658 1,878 1,625
Larceny 3,137 3,084 3,362 3,010 3,385 3,256 2,922 2,886 3,163
MV Theft 289 332 256 284 347 428 290 250 282
Total 5,487 5,565 5,470 5,417 5,908 5,885 5,372 5,599 5,613
19 NC Department of Justice, Crime. Available at: http://www.ncdoj.gov/Crime/View-Crime-Statistics.aspx 20 The Goldsboro News-Argus. Available at: http://www.newsargus.com/news/archives/2012/12/31/the_top_ten_stories_of_wayne_county_and_goldsboro_in_2012/
4711.4
5276.9 5271.3
4791.9 4957.3 4694.5
4654.4 4658.9 4581
4178.4 3919.8 3955.3
0
1000
2000
3000
4000
5000
6000
2006 2007 2008 2009 2010 2011
Ra
tes
Year
Wayne County and NC Crime Index Rates per 100,000 Population
Wayne
NC

Wayne County 2012 Community Health Assessment Page 20
Health Indicators Infant Mortality Rates Infant mortality is the death of an infant prior to his/her first birthday. Wayne County’s total infant mortality rate in 2011 was 11.6 per thousand live births compared to North Carolina’s total infant mortality rate of 7.2 per thousand live births, respectively. The infant mortality rate in Wayne County increased from 7.4 per thousand live births in 2010 to 11.6 per thousand births in 2011. Wayne County’s infant mortality rate declined between the years of 2009 and 2010, but the rate has increased from 6.7 per thousand live births in 2007. 21
General Mortality Rates The chart below depicts the overall mortality rates for Wayne County and North Carolina in five year averages from 2003 to 2011. Each of the five year averages for Wayne County were more than 100 deaths higher per 100,000 population than North Carolina. The 2007-2011 average death rate in Wayne County was 942.0 per 100,000 population
21 NC Division of Public Health, State Center for Health Statistics, County-Level Data. Available at: http://www.schs.state.nc.us/schs/data/county.cfm
6.7
10.7
13.2
7.4
11.6
8.5
8.2 7.9
7.0 7.2
0
2
4
6
8
10
12
14
16
2007 2008 2009 2010 2011
Ra
tes
Year
Wayne County and NC Infant Mortality Rates per 1,000 Live Births
Wayne
NC

Wayne County 2012 Community Health Assessment Page 21
compared to 808.4 per 100,000 population in North Carolina. Overall, the mortality rates for both Wayne County and North Carolina have decreased steadily since 2003. 22
Leading Causes of Death A comparison of the top five leading causes of death for all ages in Wayne County and North Carolina are depicted in the graph below. Cancer and heart disease are the top two leading causes of death in both Wayne County and North Carolina. The state exceeds Wayne County in deaths caused by heart disease, respiratory diseases, and all other causes, whereas Wayne County exceeds the state in deaths caused by cancer, cerebrovascular disease, and diabetes. 23
22 NC Division of Public Health, State Center for Health Statistics, County-Level Data. Available at: http://www.schs.state.nc.us/schs/data/county.cfm 23 NC Division of Public Health, State Center for Health Statistics, County-Level Data. Available at: http://www.schs.state.nc.us/schs/data/county.cfm
992.4 973.8 972.0 960.7 942.0
875.3 861.4 845.5 819.0 808.4
0
200
400
600
800
1000
1200
2003-2007 2004-2008 2005-2009 2006-2010 2007-2011
Ra
tes
Year
Wayne County and NC Mortality Rates (All Causes)
Wayne
NC

Wayne County 2012 Community Health Assessment Page 22
Age-Specific Death Rates The table below presents the top three leading causes of death categorized by age
group from 2007-2011. For the population age 0-19 in Wayne County, the death rates per 100,000 population for perinatal deaths (31.6) and motor vehicle deaths (12.8) are higher than those for North Carolina. For the population age 20-39 in Wayne County, the death rates for motor vehicle deaths (24.9) and homicide (21.7) are higher than those for North Carolina. For the population age 40-64 in Wayne County, the death rates for cancer (215.5), heart disease (157.2) and diabetes (38.9) are higher than those for North Carolina. For the population age 65-84 in Wayne County, the death rates for cancer (1018.4), heart disease (812.6) and cerebrovascular diseases (252.8) are higher than those for North Carolina. For the population age 85 and older in Wayne County, the death rate for heart disease (3927.1) is higher than those for North Carolina. 24
24 NC Division of Public Health, State Center for Health Statistics, County Health Data Book. Available at: http://www.schs.state.nc.us/schs/data/databook/
25.2
18.5
6.6 4.6 4.2
40.8
22.8 21.3
5.4 2.9 5.9
41.7
0
5
10
15
20
25
30
35
40
45
50
Pe
rce
nta
ge
(%
)
Cause
Wayne County and NC Leading Causes of Death (2011)
Wayne
NC

Wayne County 2012 Community Health Assessment Page 23
The Top Three Leading Causes of Death in Wayne County by Age (2007-2011)
Age Groups Cause of Death # of Deaths (2007-2011)
2007-2011 Death Rate
Wayne NC 0-19 Perinatal Cond. 52 31.6 19.9
Motor Vehicle 21 12.8 7.9 Birth Defects 12 7.3 8.8
20-39 Motor Vehicle 39 24.9 21.1 Homicide 34 21.7 12.2
Injuries 31 19.8 21.0
40-64 Cancer 410 215.5 179.2 Heart Disease 299 157.2 120.5
Diabetes 74 38.9 20.5 65-84 Cancer 693 1018.4 898.0
Heart Disease 553 812.6 717.9
Cerebrovascular 172 252.8 187.7 85+ Heart Disease 308 3927.1 3871.4
Cancer 123 1568.3 1638.4 Cerebrovascular 89 1134.8 1146.8
Race/Sex-Specific Death Rates
The leading causes of death by age and sex from 2007-2011 can be found in the following table. Cancer is the leading cause of death for all age and sex groupings, except for African-American females. African-American males and females have diabetes as one of the top five leading causes of death, whereas white males and females have respiratory diseases as a top five leading cause of death. Overall, the death rates for cancer and heart disease are substantially higher in males for both whites and African-Americans. 25
25 NC Division of Public Health, State Center for Health Statistics, County Health Data Book. Available at: http://www.schs.state.nc.us/schs/data/databook/

Wayne County 2012 Community Health Assessment Page 24
The Five Leading Causes of Death in Wayne County by Race and Gender (2007-2011) White Males African-American
Males White Females African-American
Females 1 Cancer
(259.4) Cancer (263.6)
Cancer (165.3)
Heart Disease (183.3)
2 Heart Disease (254.4)
Heart Disease (257.5)
Heart Disease (153.4)
Cancer (159.6)
3 Cerebrovascular Disease (63.0)
Cerebrovascular Disease (84.6)
Cerebrovascular Disease (46.3)
Diabetes (61.5)
4 Respiratory Diseases (43.9)
Diabetes (76.0)
Respiratory Diseases (40.3)
Cerebrovascular Disease (47.0)
5 Injuries (43.0)
Nephritis (62.3)
Alzheimer’s Disease (31.3)
Nephritis (38.6)
Health Conditions Cancer The leading cause of death in Wayne County is cancer, and the following graph depicts the cancer mortality rates for Wayne County and North Carolina from 2007 to 2011 per 100,000 population. From 2010 to 2011, Wayne County experienced an increase in cancer mortality rates of almost 46 deaths per 100,000 population. As of 2011 the cancer mortality rate in Wayne County is nearly 46 deaths per 100,000 population higher than the state. 26
26 NC Division of Public Health, State Center for Health Statistics, County-Level Data. Available at: http://www.schs.state.nc.us/schs/data/county.cfm

Wayne County 2012 Community Health Assessment Page 25
The following tables report the cancer incidence rates, cancer mortality rates, and projected new cancer cases and deaths by type of cancer. From 2006 to 2010, the incidence rates for prostate, lung, and colon cancers were higher than the state. From 2007 to 2011, the mortality rates for all four major types of cancer were higher than the state. Wayne County is projected to have 706 new cancer cases and 250 cancer deaths in 2013. Breast cancer is projected to have the most new cases in 2013, whereas lung cancer is projected to have the most deaths in 2013 for Wayne County. 27
Cancer Incidence Rates by Type per 100,000 Population (2006-2010) Place Prostate Breast Lung Colon
Wayne 155.9 151.7 80.6 51.0
NC 153.7 155.9 74.8 43.4
Cancer Mortality Rates by Type per 100,000 Population (2007-2011) Place Lung Prostate Breast Colon
Wayne 61.8 27.5 27.5 17.1 NC 54.1 24.3 22.6 15.2
27 NC Division of Public Health, State Center for Health Statistics, Cancer Data. Available at: http://www.schs.state.nc.us/schs/data/cancer.cfm
214.4
188.6
231.7
188.9
235.3
192.1 188.4 186.3 181.0
188.5
0
50
100
150
200
250
300
2007 2008 2009 2010 2011
Ra
tes
Year
Wayne County and NC Cancer Mortality Rates per 100,000 Population
Wayne
NC

Wayne County 2012 Community Health Assessment Page 26
Projected New Cancer Cases and Deaths - 2013 Projected New Cases Projected Deaths
Wayne NC Wayne NC Total 706 56,164 250 19,855
Lung 108 8,559 77 6,126 Breast 117 9,339 18 1,393
Prostate 104 8,316 12 1,015
Colon 61 4,852 21 1,671 Heart Disease The second leading cause of death in Wayne County is heart disease, and the following graph depicts the heart disease mortality rates for Wayne County and North Carolina from 2007 to 2011. Although heart disease rates in Wayne County are high, the rates have decreased dramatically since 2007. As of 2011, the heart disease rate for Wayne County was marginally higher than that of the state. 28
28 NC Division of Public Health, State Center for Health Statistics, County-Level Data. Available at: http://www.schs.state.nc.us/schs/data/county.cfm

Wayne County 2012 Community Health Assessment Page 27
Diabetes The fourth leading cause of death in Wayne County is diabetes. The graph below shows a comparison of the percentage of the population diagnosed with diabetes among Wayne County and North Carolina. From 2006 to 2010, Wayne County has demonstrated a consistently higher percentage of residents having diabetes than the state. Furthermore, the percentage of the population of Wayne County diagnosed with diabetes has steadily increased since 2007, with the 2010 percentage being 12%. 29
29 Centers for Disease Control and Prevention. Available at: http://www.cdc.gov/
233.5
197.9 190.5 198.2 175.6
193.0 188.8 182.6 179.2 172.2
0
50
100
150
200
250
300
2007 2008 2009 2010 2011
Ra
tes
Year
Wayne County and NC Heart Disease Mortality Rates per 100,000 Population
Wayne
NC

Wayne County 2012 Community Health Assessment Page 28
The following graph shows the diabetes mortality rates for Wayne County and North Carolina from 2007 to 2011. The mortality rate for diabetes in Wayne County has increased 7.4 per 100,000 population from 2008 (35.4) to 2011 (42.8). As of 2011, the diabetes rate in Wayne County is 19.2 per 100,000 population higher than that of the state. Furthermore, the 2007-2011 diabetes mortality rate per 100,000 population was higher for African-American males (50.9) and females (40.4) than white males (21.7) and females (14.2). 30
30 NC Division of Public Health, State Center for Health Statistics, County-Level Data. Available at: http://www.schs.state.nc.us/schs/data/county.cfm
10.8 10.4
11.1 11.6 12.0
9.1 9.0 9.3 9.6 10.0
0
2
4
6
8
10
12
14
2006 2007 2008 2009 2010
Ra
tes
Year
Wayne County and NC Percentage of Population Diagnosed with Diabetes
Wayne
NC

Wayne County 2012 Community Health Assessment Page 29
Asthma The following graph details the percentage of the population diagnosed with asthma in Wayne County and North Carolina from 2007 to 2010. The percentage has decreased in Wayne County from 2009 (18 percent) to 2010 (14.2), but remains higher than that of the state as of 2010 (12.6 percent). 31 The table below the graph reports the 2011 hospital discharge statistics for asthma in Wayne County and North Carolina. Both the total discharge rate and the age-specific discharge rate (ages 0-14) were higher in Wayne County than the state. 32
31 NC Division of Public Health, State Center for Health Statistics, Behavioral Risk Factor Surveillance System (BRFSS). Available at: http://www.schs.state.nc.us/schs/brfss/ 32 NC Division of Public Health, State Center for Health Statistics, County-Level Data. Available at: http://www.schs.state.nc.us/schs/data/county.cfm
37.3 35.4 36.9 39.1
42.8
23.7 23.5 22.5 21.4 23.6
0
10
20
30
40
50
60
2007 2008 2009 2010 2011
Ra
tes
Year
Wayne County and NC Diabetes Mortality Rates per 100,000 Population
Wayne
NC

Wayne County 2012 Community Health Assessment Page 30
2011 Hospital Discharges with Asthma
Residence Total Number Total Rate Ages 0-14 Rate Ages 0-14 Wayne 166 134.2 44 172.4
NC 9,880 102.3 3,004 157.3
Overweight/Obesity Obesity has been shown to contribute to the leading causes of death including heart disease, some cancers, and diabetes. The graph below depicts a comparison between Wayne County and North Carolina from 2010 to 2012 on the percentage of adults reporting obesity. The percentage of obese adults in Wayne County has increased from 31 percent to 33 percent, whereas the percentage of obese adults in North Carolina has remained constant at 29 percent from 2010 to 2012. 33
33 NC State University Institute for Emerging Issues. Available at: http://www.ncsu.edu/iei/wp-content/uploads/2012/03/Wayne.pdf
14.1 13.4
18.0
14.2
12.1 11.7 12.9 12.6
0
2
4
6
8
10
12
14
16
18
20
2007 2008 2009 2010
Pe
rce
nta
ge
Year
Wayne County and NC Percentage of Population Diagnosed With Asthma
Wayne
NC

Wayne County 2012 Community Health Assessment Page 31
The following graph illustrates the number of people reporting normal weight, overweight, and obesity across age groups. In 2010, the age groups of 35-44, 45-54, and 55-64 reported higher numbers in the overweight and obese categories than the normal weight category. Conversely, more than half of the population age 18-25 reported being at a normal weight. 34
34 NC State University Institute for Emerging Issues. Available at: http://www.ncsu.edu/iei/wp-content/uploads/2012/03/Wayne.pdf
31 32 33
29 29 29
0
5
10
15
20
25
30
35
40
45
50
2010 2011 2012
Pe
rce
nta
ge
(%
)
Year
Wayne County and NC Percentage of Obese Adults
Wayne
NC

Wayne County 2012 Community Health Assessment Page 32
High Blood Pressure High blood pressure, or hypertension, has been found to be correlated with the leading causes of death including heart disease, some cancers, and diabetes. The following graph depicts the percentage of Wayne County and North Carolina residents informed of hypertension by a physician. The percentages in Wayne County have decreased from 2007 (34.1 percent) to 2011 (26.4 percent). In contrast, the percentages for North Carolina have increased from 2007 (28.8 percent) to 2011 (32.4 percent). 35
35 NC Division of Public Health, State Center for Health Statistics, Behavioral Risk Factor Surveillance System (BRFSS). Available at: http://www.schs.state.nc.us/schs/brfss/
0.0
2000.0
4000.0
6000.0
8000.0
10000.0
12000.0
14000.0
16000.0
18000.0
20000.0
18-25 25-34 35-44 45-54 55-64 65+
Nu
mb
er
of
Pe
op
le
Age
Wayne County Overweight and Obese by Age (2010)
Obese
Overweight
"Normal"

Wayne County 2012 Community Health Assessment Page 33
High Cholesterol A third precipitating factor in relation to leading causes of death including heart disease, some cancers, and diabetes is high cholesterol. The graph below shows the comparison of Wayne County and North Carolina with regards to the percentage of the population informed by a doctor of high cholesterol. The percentage of Wayne County residents informed of high cholesterol increased from 2007 (32.9 percent) to 2009 (38.7 percent), but decreased from 2009 to 2011 (36.9 percent). In comparison, the percentages for North Carolina have remained higher than Wayne County in 2007, 2009, and 2011. 36
36 NC Division of Public Health, State Center for Health Statistics, Behavioral Risk Factor Surveillance System (BRFSS). Available at: http://www.schs.state.nc.us/schs/brfss/
34.1
29.2
26.4 28.8
31.5 32.4
0
5
10
15
20
25
30
35
40
45
50
2007 2009 2011
Pe
rce
nta
ge
(%
)
Year
Wayne County and NC Percentage of Population Informed by Doctor of High
Blood Pressure
Wayne
NC

Wayne County 2012 Community Health Assessment Page 34
Communicable Diseases HIV While the number of HIV diagnoses, asthma and AIDS diagnoses rates are not large compared to heart disease and cancer, these trends are reported as they have been in the past, when mortality was very high. These are managed as chronic diseases in the US now. The following graph depicts the HIV rates per 100,000 population for Wayne County and North Carolina from 2007 to 2011. In the period between 2010 and 2011, the HIV rate nearly doubled from 10.6 to 20.4 per 100,000 population in Wayne County. As of 2011, Wayne County’s HIV rate has surpassed that of the state. 37
37 NC Department of Health and Human Services, Facts and Figures. Available at: http://epi.publichealth.nc.gov/cd/stds/figures.html#annual
32.9
38.7 36.9
39.6 40.0 38.5
0
5
10
15
20
25
30
35
40
45
50
2007 2009 2011
Pe
rce
nta
ge
(%
)
Year
Wayne County and NC Percentage of Population Informed by Doctor of High
Cholesterol
Wayne
NC

Wayne County 2012 Community Health Assessment Page 35
AIDS The following graph depicts the AIDS rates per 100,000 population for Wayne County and North Carolina from 2007 to 2011. In the period between 2010 and 2011, the AIDS rate more than doubled from 7.3 to 14.7 per 100,000 population in Wayne County. As of 2011, Wayne County’s AIDS rate has almost doubled that of the state. 38
38 NC Department of Health and Human Services, Facts and Figures. Available at: http://epi.publichealth.nc.gov/cd/stds/figures.html#annual
15.0
13.2 14.9
10.6
20.4 19.9 19.6
17.4
15.4 16.4
0.0
5.0
10.0
15.0
20.0
25.0
2007 2008 2009 2010 2011
Ra
tes
Year
Wayne County and NC HIV Rates per 100,000 Population
Wayne
NC

Wayne County 2012 Community Health Assessment Page 36
STDs Syphilis: Sexually transmitted diseases have increased in Wayne County compared to the state of North Carolina, and the Health Department is working with various agencies to bring these under control. The following graph depicts the syphilis rates per 100,000 population for Wayne County and North Carolina from 2006 to 2010. Wayne County has experienced a dramatic increase in syphilis rates since 2006, with an increase of 27.3 per 100,000 population from 2006 to 2010. The highest syphilis rates were recorded in 2009 with a rate of 51.9 per 100,000 population. As of 2010, Wayne County has a syphilis rate more than five times higher than that of North Carolina. 39
39 NC Department of Health and Human Services, Facts and Figures. Available at: http://epi.publichealth.nc.gov/cd/stds/figures.html#annual
7.9 8.8
7.9 7.3
14.7
9.4 10.1 10.0
8.3 8.7
0.0
2.0
4.0
6.0
8.0
10.0
12.0
14.0
16.0
2007 2008 2009 2010 2011
Ra
tes
Year
Wayne County and NC AIDS Rates per 100,000 Population
Wayne
NC

Wayne County 2012 Community Health Assessment Page 37
Gonorrhea: The following graph reports the gonorrhea rates per 100,000 population for Wayne County and North Carolina from 2006 to 2010. The gonorrhea rates in Wayne County have increased dramatically since 2006, with an increase of more than 75 per 100,000 population as of 2010. Wayne County experienced the highest gonorrhea rates in 2009 (292.1). As of 2010, the gonorrhea rate in Wayne County is more than 100 per population higher than the state. 40
40 NC Department of Health and Human Services, Facts and Figures. Available at: http://epi.publichealth.nc.gov/cd/stds/figures.html#annual
13.1
14.9
24.6
51.9
40.4
7.0 6.4 5.5 10.2
7.7 0
10
20
30
40
50
60
2006 2007 2008 2009 2010
Ra
te
Year
Wayne County and North Carolina Syphilis Rates per 100,000 Population
Wayne
NC

Wayne County 2012 Community Health Assessment Page 38
Chlamydia: The most prevalent STD in Wayne County is chlamydia. The following graph depicts the chlamydia rates in Wayne County and North Carolina from 2006 to 2010. The chlamydia rate in Wayne County has doubled from 2006 to 2010. As of 2010, the chlamydia rates in Wayne County were almost 330 per 100,000 population higher than the state. 41
41 NC Department of Health and Human Services, Facts and Figures. Available at: http://epi.publichealth.nc.gov/cd/stds/figures.html#annual
180.9 159.0
227.9 292.1
257.4 199.3 188.2
162.8 160.6 150.9
0
50
100
150
200
250
300
2006 2007 2008 2009 2010
Ra
te
Year
Wayne County and North Carolina Gonorrhea Rates per 100,000 Population
Wayne
NC

Wayne County 2012 Community Health Assessment Page 39
Tuberculosis (TB) The following graph shows the tuberculosis rates for Wayne County and North Carolina from 2006 to 2010. In 2008, Wayne County experienced a dramatic decrease in the tuberculosis rate, but the rate in 2010 is nearly two times higher than that of 2008. As of 2010, the tuberculosis rate in Wayne County is more than twice that of the state. 42
42 NC Department of Health and Human Services, Disease and Topics. Available at: http://epi.publichealth.nc.gov/cd/diseases/tb.html
397.6 371.6
631.6 626.4
779.4
387.0
346.0
411.0 474.0 450.0
0
100
200
300
400
500
600
700
800
2006 2007 2008 2009 2010
Ra
te
Year
Wayne County and North Carolina Chlamydia Rates per 100,000 Population
Wayne
NC

Wayne County 2012 Community Health Assessment Page 40
Maternal Health Birth Rates The following graph reports the overall birth rates for Wayne County and North Carolina from 2006 to 2010. The birth rate in Wayne County has steadily decreased since 2007. As of 2010, the birth rate in Wayne County (13.2) is marginally higher than that of the state (12.8). 43
43 NC Division of Public Health, State Center for Health Statistics, County-Level Data. Available at: http://www.schs.state.nc.us/schs/data/county.cfm
7.1
7.7
2.6
7.0 6.8
4.6 3.8
3.6
2.7 3.1
0
1
2
3
4
5
6
7
8
9
10
2006 2007 2008 2009 2010
Ra
te
Year
Wayne County and North Carolina Tuberculosis Rates per 100,000 Population
Wayne
NC

Wayne County 2012 Community Health Assessment Page 41
Pregnancy Rates The following graph depicts the pregnancy rates for females ages 15 to 44 in Wayne County and North Carolina from 2007 to 2011. Over the five year period, Wayne County has demonstrated consistently lower pregnancy rates than the state. As of 2011, the pregnancy rate in North Carolina (84.4) is higher than that of Wayne County (73.3). 44
44 NC Division of Public Health, State Center for Health Statistics, County Health Data Book. Available at: http://www.schs.state.nc.us/schs/data/databook/
15.6 15.3
14.3
13.2
14.0
14.4 14.2
13.5
12.8 12.5
10
11
12
13
14
15
16
17
2007 2008 2009 2010 2011
Ra
te
Year
Wayne County and North Carolina Birth Rates per 1,000 Population
Wayne
NC

Wayne County 2012 Community Health Assessment Page 42
The next two graphs depict overall teen pregnancy rates and teen pregnancy rates by race from 2006 to 2010 for Wayne County and North Carolina. The overall teen pregnancy rate in Wayne County has steadily declined from 2007 to 2010. However, the teen pregnancy rates in Wayne County have remained higher than the state over the five year period. As of 2010, Wayne County reported more than 17 teen pregnancies per 1,000 population than the state. 45 Teen pregnancy is an issue that differentially affects races, as shown in the second graph. Non-white residents of Wayne County have reported at least 25 more teen pregnancies per 1,000 population than white residents each year over the five year period. However, the teen pregnancy rates for both non-white and white residents of Wayne County have decreased since 2007. 46
45 NC Division of Public Health, State Center for Health Statistics, County Health Data Book. Available at: http://www.schs.state.nc.us/schs/data/databook/ 46 NC Division of Public Health, State Center for Health Statistics, County Health Data Book. Available at: http://www.schs.state.nc.us/schs/data/databook/
84.7 83.9
78.9 76.4
73.3
92.0 91.0
84.2 82.6
84.4
50
55
60
65
70
75
80
85
90
95
100
2007 2008 2009 2010 2011
Ra
te
Year
Wayne County and North Carolina Pregnancy Rates for Females Ages 15-44 per
1,000 Population
Wayne
NC

Wayne County 2012 Community Health Assessment Page 43
79.9 73.5
68.2 67.4
57.3
63.0 58.6 56.0
49.7 43.8
0
10
20
30
40
50
60
70
80
90
100
2007 2008 2009 2010 2011
Ra
te
Year
Wayne County and North Carolina Teen Pregnancy Rates per 1,000 Population
Wayne
NC
63.0 59.7 53.7
47.9 41.6
110.7
87.3 87.2 86.6 80.1
0
20
40
60
80
100
120
2007 2008 2009 2010 2011
Ra
te
Year
Wayne County Teen Pregnancy Rates by Race per 1,000 Population
White
Non-White

Wayne County 2012 Community Health Assessment Page 44
Abortion Rates The following graph depicts the abortion rates for Wayne County and North Carolina from 2007 to 2011. The abortion rates in Wayne County surpassed those of the state in 2009 and remain marginally higher than the state as of 2011. Overall, the abortion rates in Wayne County have decreased by 2.4 per 1,000 population since 2007. 47
Maternal Health Indicators The following graph details the percentage of resident live births classified as low birth weight in Wayne County and North Carolina in five year periods from 1994 to 2008. The percentages of low birth weights have remained fairly constant across this time period for both Wayne County and the state. Since the 1994 to 1998 time period, Wayne County’s percentage of low birth weights has increased 1.1 percent, whereas the state has increased 0.3 percent. 48
47 NC Division of Public Health, State Center for Health Statistics, County Health Data Book. Available at: http://www.schs.state.nc.us/schs/data/databook/ 48 NC Division of Public Health, State Center for Health Statistics, Trends in Key Health Indicators. Available at: http://www.schs.state.nc.us/schs/data/trends/pdf/Wayne.pdf
14.8
12.9 12.7
14.7
12.7
15.1 14.4 13.4
13.2
11.4
0
5
10
15
20
2007 2008 2009 2010 2011
Ra
te
Year
Wayne County and North Carolina Abortion Rates per 1,000 Population
Wayne
NC

Wayne County 2012 Community Health Assessment Page 45
The following graph portrays the percentage of resident live births where the mother smoked during pregnancy for Wayne County and North Carolina in five year periods beginning in 1994. The percentages of mothers who smoked during pregnancy have steadily decreased for Wayne County and the state from 1994 to 2008. From 2004 to 2008, 12.4 percent of mothers in Wayne County smoked during pregnancy, whereas 11.5 percent of mothers in the state smoked during pregnancy. 49
49 NC Division of Public Health, State Center for Health Statistics, Trends in Key Health Indicators. Available at: http://www.schs.state.nc.us/schs/data/trends/pdf/Wayne.pdf
8.1
8.9 9.2 8.8
8.9 9.1
0
5
10
15
1994-1998 1999-2003 2004-2008
Ra
te
Year
Percentage of Resident Live Births Classified As Low Birthweight (2,500 grams/ 5 lbs 8
ozs or less)
Wayne
NC

Wayne County 2012 Community Health Assessment Page 46
The graph below portrays the percentage of mothers who received prenatal care in the first trimester for Wayne County and North Carolina. Although the percentage of mothers who received prenatal care in the first trimester in Wayne County has increased since the 1994 to 1998 time period, the percentage in the 2004 to 2008 time period remains 11.5 percent lower than the state. 50
50 NC Division of Public Health, State Center for Health Statistics, Trends in Key Health Indicators. Available at: http://www.schs.state.nc.us/schs/data/trends/pdf/Wayne.pdf
15.9 15.4 12.4
15.7
13.6
11.5
0
5
10
15
20
25
30
1994-1998 1999-2003 2004-2008
Ra
te
Year
Percentage of Resident Live Births Where Mother Smoked During Pregnancy
Wayne
NC

Wayne County 2012 Community Health Assessment Page 47
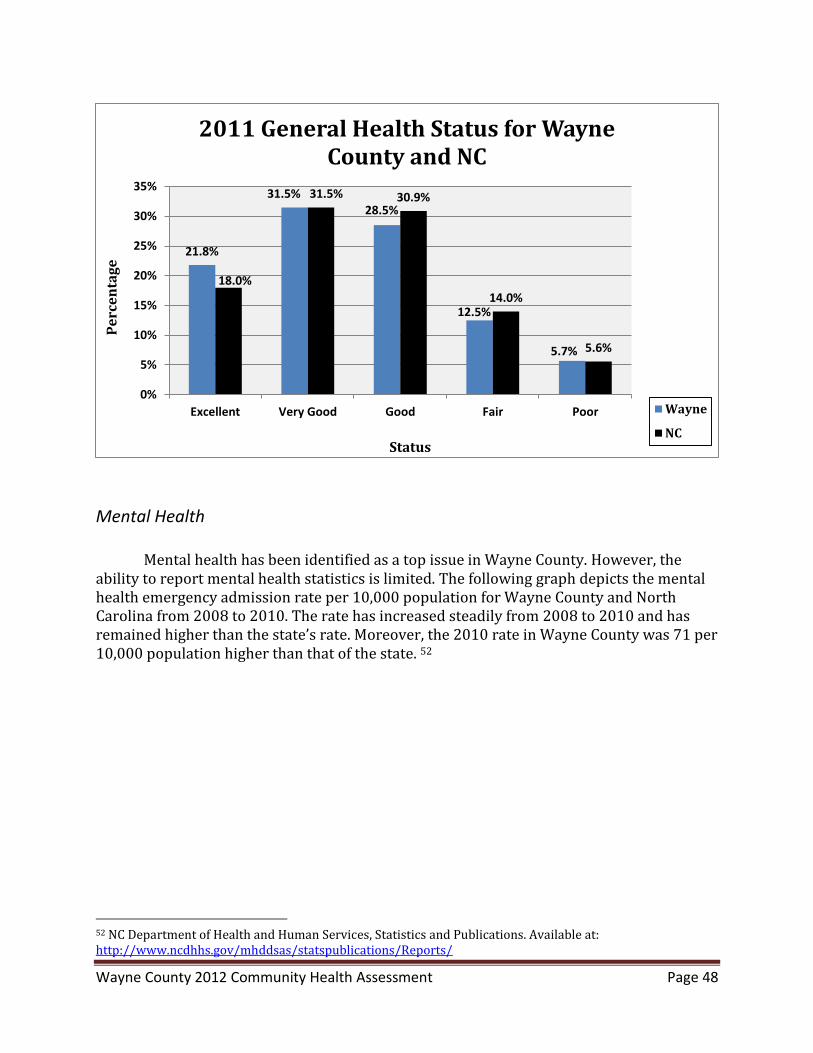
Other Health Status Data General Health Status The following graph depicts the results of the Center for Disease Control’s Behavioral Risk Factor Surveillance System (BRFSS) survey question regarding general health status for Wayne County and North Carolina residents. A higher percentage of residents in Wayne County report having excellent health (21.8 percent) than the state (18 percent). Additionally, the majority of Wayne County residents report have good, very good, or excellent health (81.8 percent). 51
51 NC Division of Public Health, State Center for Health Statistics, Behavioral Risk Factor Surveillance System (BRFSS). Available at: http://www.schs.state.nc.us/schs/brfss/
65.2 69.3 70.6
83.1 84.0 82.1
0
10
20
30
40
50
60
70
80
90
100
1994-1998 1999-2003 2004-2008
Ra
te
Year
Percentage of Resident Live Births Where Mother Received Prenatal Care in the 1st Trimester
Wayne
NC
Wayne County 2012 Community Health Assessment Page 48
Mental Health Mental health has been identified as a top issue in Wayne County. However, the ability to report mental health statistics is limited. The following graph depicts the mental health emergency admission rate per 10,000 population for Wayne County and North Carolina from 2008 to 2010. The rate has increased steadily from 2008 to 2010 and has remained higher than the state’s rate. Moreover, the 2010 rate in Wayne County was 71 per 10,000 population higher than that of the state. 52
52 NC Department of Health and Human Services, Statistics and Publications. Available at: http://www.ncdhhs.gov/mhddsas/statspublications/Reports/
21.8%
31.5% 28.5%
12.5%
5.7%
18.0%
31.5% 30.9%
14.0%
5.6%
0%
5%
10%
15%
20%
25%
30%
35%
Excellent Very Good Good Fair Poor
Pe
rce
nta
ge
Status
2011 General Health Status for Wayne County and NC
Wayne
NC

Wayne County 2012 Community Health Assessment Page 49
The following tables report the number of Wayne County residents served in area mental health programs and alcohol / drug treatment centers from 2006 to 2010. The number of residents served in area mental health programs has increased by over 2,500 from 2006 to 2010. Additionally, the number of residents served in alcohol / drug treatment centers has increased by 37 from 2006 to 2010. 53
Wayne County Residents Served in Area Mental Health Programs
2006 2007 2008 2009 2010
4,020 3,574 4,267 4,832 6,546
Wayne County Residents Served in Alcohol / Drug Treatment Centers
2006 2007 2008 2009 2010
65 88 95 85 102
Suicide: Another conceptualization of the mental health issue can be determined by the suicide rates in a particular location. The following graph portrays the suicide rates per 100,000 population in Wayne County and North Carolina from 2006 to 2011. The rates in this time period for Wayne County have fluctuated but have steadily decreased from 2009
53 Log Into North Carolina (LINC). Available at: http://data.osbm.state.nc.us/pls/linc/dyn_linc_main.show
196.6 199.9 215.0
128.4
153.6 144.0
0.0
50.0
100.0
150.0
200.0
250.0
2008 2009 2010
Ra
tes
Year
Wayne County and NC Mental Health Local Emergency Department Admission Rate per
10,000
Wayne
NC

Wayne County 2012 Community Health Assessment Page 50
to 2011. As of 2011, the suicide rate in Wayne County is lower than that of the state. However, the 6-year average from 2006 to 2011 for Wayne County is very close to the state. 54
Smoking /Tobacco Smoking and tobacco use are notorious precipitating factors in cancer-related deaths. Specifically, the smoking statistics presented below are indicative of the prevalence and mortality rates associated with lung cancer in Wayne County and the state. The following graph depicts the percentage of smokers in Wayne County and North Carolina from 2007 to 2011 as reported by the BRFSS survey. According to the results of the survey, the percentage of smokers in Wayne County has decreased by 6.4 percent from 2007 to 2011. As of 2011, the percentage of smokers in Wayne County and North Carolina are identical at 21.8 percent. 55
54 NC Division of Public Health, State Center for Health Statistics, County-Level Data. Available at: http://www.schs.state.nc.us/schs/data/county.cfm 55 NC Division of Public Health, State Center for Health Statistics, Behavioral Risk Factor Surveillance System (BRFSS). Available at: http://www.schs.state.nc.us/schs/brfss/
13.1
17.4
7.8
18.0
11.4
8.9
12.3 11.8
12.6
12.4
12.2 12.4
0
2
4
6
8
10
12
14
16
18
20
2006 2007 2008 2009 2010 2011
Ra
tes
Year
Wayne County and NC Suicide Rates per 100,000 Population
Wayne
NC

Wayne County 2012 Community Health Assessment Page 51
The following tables report additional information concerning tobacco and tobacco use as reported by the BRFSS survey. As of 2011, half of the residents in Wayne County never smoked and 27.9 percent indicated that they were a former smoker. Furthermore, 16.3 percent of respondents reported that they smoke every day, whereas 5.4 percent smoke some days. The next table indicates that 8.8 percent of residents in Wayne County chew tobacco, whereas 5.2 percent of residents in the state chew tobacco. The third table shows that 16 percent of Wayne County residents report being exposed to secondhand smoke in their homes, whereas only 5 percent report exposure in the workplace. 56
2011 Smoking Status
Residence Smoke Everyday Smoke Some Days Former Smoker Never Smoked
Wayne 16.3% 5.4% 27.9% 50.3%
NC 15.6% 6.1% 24.8% 53.4%
2011 Chewing Tobacco Use
Residence Yes No
Wayne 8.8% 91.2%
NC 5.2% 94.8%
56 NC Division of Public Health, State Center for Health Statistics, Behavioral Risk Factor Surveillance System (BRFSS). Available at: http://www.schs.state.nc.us/schs/brfss/
28.2 28.6
22.4 24.3 21.8
22.9
20.9 20.3 19.8 21.8
0
5
10
15
20
25
30
35
2007 2008 2009 2010 2011
Pe
rce
nta
ge
(%
)
Year
Wayne County and NC Percentage of Smokers
Wayne
NC

Wayne County 2012 Community Health Assessment Page 52
Percentage of People Exposed to Secondhand Smoke in the Past Seven Days (2011)
Residence Home Work
Wayne 16% 5%
NC 14% 8%
Exercise The following graph depicts the percentage of residents who exercised in the past month from according to the BRFSS survey. From 2010 to 2011, the percentage of Wayne County residents who exercised in the past month increased 10.8 percent and surpassed the 73.3 percent of North Carolina residents who exercised in the past month in 2011. 57
Screenings The following graph portrays the percentage of residents in Wayne County and North Carolina who got a flu shot in the past year from 2007 to 2011 according to the BRFSS survey. From 2010 to 2011, the percentage of Wayne County residents who got flu shots increased 8.6 percent. As of 2011, the percentage of residents who got flu shots in
57 NC Division of Public Health, State Center for Health Statistics, Behavioral Risk Factor Surveillance System (BRFSS). Available at: http://www.schs.state.nc.us/schs/brfss/
68.6 68.7 65.3 64.9
75.7 75.7 75.4 73.6 74.3 73.3
0
10
20
30
40
50
60
70
80
90
100
2007 2008 2009 2010 2011
Pe
rce
nta
ge
(%
)
Year
Wayne County and NC Percentage of Residents who Exercised in the Past Month
Wayne
NC

Wayne County 2012 Community Health Assessment Page 53
Wayne County was 7.2 percent higher than the state. The combined efforts of Wayne Memorial Hospital and the Wayne County Health Department have been important with regard to the increases in flu shots amongst residents in Wayne County. 58
Child Health The following graph depicts the leading causes of child deaths ages 0 to 19 in Wayne County and North Carolina in the 2007 to 2011 time period. Prenatal conditions are the highest percentage of child deaths (42.6 percent), followed by illness (18 percent) and birth defects (9.8 percent) in Wayne County. Alternatively, the highest percentage of child deaths in North Carolina is birth defects (42.6 percent), followed by prenatal conditions (34.5 percent) and illness (19.8 percent). 59 The table below the graph reports the total number of child deaths in Wayne County and North Carolina by cause of death and age. The majority of child deaths are the result of prenatal conditions and occur before the age of one. 60
58 NC Division of Public Health, State Center for Health Statistics, Behavioral Risk Factor Surveillance System (BRFSS). Available at: http://www.schs.state.nc.us/schs/brfss/ 59 NC Division of Public Health, State Center for Health Statistics, County-Level Data. Available at: http://www.schs.state.nc.us/schs/data/county.cfm 60 NC Division of Public Health, State Center for Health Statistics, County-Level Data. Available at: http://www.schs.state.nc.us/schs/data/county.cfm
39.2 36.2
34.1
39.8
48.4
38.5 40.4 40.9
42.2 41.2
0
10
20
30
40
50
60
2007 2008 2009 2010 2011
Pe
rce
nta
ge
(%
)
Year
Wayne County and NC Percentage of Residents Who Got a Flu Shot in the Past
Year
Wayne
NC

Wayne County 2012 Community Health Assessment Page 54
Location (2007-2011)
Total Cause of Death Age
Bir
th
De
fect
s
Pe
rin
atal
Co
nd
itio
ns
SID
S
Illn
ess
Mo
tor
Ve
hic
le
Ho
mic
ide
Suic
ide
Oth
er
Un
de
r 1
1-4
5-9
10
-14
15
-17
Wayne 122 12 52 11 22 9 3 3 10 85 12 8 7 10
NC 7,331 1,082 2,527 435 1,449 577 240 129 892 4,899 713 428 472 819
Childhood Obesity: The following graph portrays the percentage of children ages 2-18 identified as overweight or obese in Wayne County and North Carolina from 2005 to 2009. This percentage for Wayne County has steadily declined from 2005 to 2009. As of 2009, the percentage of obese children in Wayne County was 5.7 percent less than the state. 61 One important program in place has been the partnership between the Goldsboro YMCA and Goldsboro Pediatrics, to educate at-risk children through the CHANGE For CHILDREN program, a 10-week physical activity and nutrition program for overweight children ages 6-15 years old. CHANGE runs Monday through Thursday afternoons “to help children raise their self-esteem and confidence, and improve their health through fun physical activity
61 Eat Smart Move More NC. Available at: http://www.eatsmartmovemorenc.com/Data/Texts/
9.8
42.6
9.0
18.0
7.4 2.5 2.5
8.2
42.6
34.5
5.9
19.8
7.9
3.3 1.8
12.2
0
5
10
15
20
25
30
35
40
45
50
BirthDefects
PerinatalCondition
SIDS Illness MotorVehicle
Homicide Suicide Other
Pe
rce
nta
ge
(%
)
Cause
Leading Causes of Child Deaths (Ages 0-19) in Wayne County and NC (2007-2011)
Wayne
NC

Wayne County 2012 Community Health Assessment Page 55
and exercise”, with the goal of bringing about life-changing behaviors that lead to a healthier child.
Access to Health Care Insured/Uninsured Population Access to health care has been identified as a top issue in Wayne County. The following graph depicts the percent of uninsured residents in Wayne County and North Carolina from 2006 to 2010. The percentage of uninsured residents in Wayne County increased 4 percent from 2009 to 2010. As of 2010, the percentage of uninsured residents in Wayne County (20.4 percent) surpassed that of the state (19.1 percent). 62
62 US Census Bureau, Small Area Health Insurance Estimates. Available at: http://www.census.gov/did/www/sahie/
34.0 37.3
33.0
30.9 28.5
32.4 33.3 33.3 33.9 34.2
0
5
10
15
20
25
30
35
40
2005 2006 2007 2008 2009
Pe
rce
nta
ge
(%
)
Year
Percentage of Children Ages 2-18 Identified as Overweight or Obese
Wayne
NC

Wayne County 2012 Community Health Assessment Page 56
Medicare/Medicaid The following table reports the Medicaid eligible statistics for Wayne County and North Carolina as of July 2009. The majority of Wayne County and North Carolina Medicaid eligible are between the ages of 0 and 5. In Wayne County, 20 percent of the total population was Medicaid eligible, whereas 17 percent of North Carolina residents were Medicaid eligible. 63
Medicaid Eligibles by Age or Group for Wayne County and NC for June 2009
Health Choice
0-5 6-11 12-20 21+ Non ABD
21+ ABD
Family Planning
Total Medicaid Population
Total Population July 2009
% of Pop.
WC 2,261 6,376 3,976 4,323 4,429 5,690 912 24,794 122,623 20%
NC 143,022 408,023 253,855 274,805 300,954 339,484 57,966 1,577,121 9,543,537 17%
Hospital Utilization The following table reports the hospital utilization statistics for Wayne County and North Carolina in 2011. The discharge rate in Wayne County was 12.8 per 1,000 population higher than the discharge rate of North Carolina. Additionally, the days stay rate for Wayne
63 NC Department of Health and Human Services, Statistics and Reports. Available at: http://www.ncdhhs.gov/dma/pub/index.htm
18.1 17.7 17.5 17.4
20.4
18.6 18.2 17.4 18.0
19.1
0
5
10
15
20
25
2006 2007 2008 2009 2010
Pe
rce
nta
ge
(%
)
Year
Wayne County and North Carolina Percentage of Population Uninsured
(Ages <65)
Wayne
NC

Wayne County 2012 Community Health Assessment Page 57
County was nearly 100 per 1,000 population higher than North Carolina. However, the average charge per day and the average charge per case were lower in Wayne County than the state. 64
Location Total
Cases Discharge Case Rate (Per 1,000)
Avg. Days Stay
Days Stay Rate (Per 1,000)
Total Charges Avg. Charge per day
Avg. Charge per Case
Wayne 13,988 113.1 5.2 583.7 $358,701,607 $4,968 $25,645
NC 968,063 100.3 4.9 489.8 $26,779,613,000 $5,663 $27,683
Healthcare Providers One critical statistic in examining health care access is the number of providers within a given county. The following tables report the primary care provider as a ratio of the population and the health professional per 10,000 population in Wayne County and North Carolina. The table below indicates that there are almost 300 more people per primary care provider in Wayne County than the state. Furthermore, there are greater than 500 more people per primary care provider in Wayne County than the national benchmark. 65 In the second table, Wayne County has a lower rate of every type of health professional per 10,000 population than the state. The most notable difference in rates between Wayne County and the state are for total physicians and registered nurses (RN’s). 66
Primary Care Provider as a Ratio of the Population (2012)
Wayne 1,554:1
NC 1,135:1
National Benchmark 631:1
2010 Health Professionals per 10,000 Population
Location Total Physicians
Total Primary Care
Dentists Pharmacists RN’s Nurse Practitioners
Certified Nurse Midwives
Physician Assistants
Wayne 14.4 6.3 3.7 7.2 90.2 2.8 0.0 3.2
NC 21.7 9.4 4.4 9.1 97.3 3.8 1.2 3.8
64 NC Division of Public Health, State Center for Health Statistics, County Health Data Book. Available at: http://www.schs.state.nc.us/schs/data/databook/ 65 County Health Rankings and Roadmaps. Available at: http://www.countyhealthrankings.org/app/north-carolina/2012/measures/factors/4/map 66 Cecil G. Sheps Center for Health Services Research, NC Health Professions Data System. Available at: http://www.shepscenter.unc.edu/hp/prof2010.htm

Wayne County 2012 Community Health Assessment Page 58
Environmental Health Air Quality The NC Division of Air Quality utilizes the Air Quality Color Code Guide (see table below) to alert the public of air quality issues related to ozone and fine particles. Air pollution levels within the range of orange, red, purple or maroon are considered exceeding the Environmental Protection Agency (EPA) standard. Furthermore, the American Lung Association provides county-level grades for air quality based on EPA standards. In 2010, Wayne County received a letter grade of “B” for daily particle pollution, having only one “orange” particle day. Additionally annual average levels of air pollution are calculated by the EPA based on air pollution levels. The chart below depicts the 3-year averages from 2004 to 2010 in annual average air quality for Wayne County. 67
67 American Lung Association, State of the Air. Available at: http://www.stateoftheair.org/2012/states/north-carolina/wayne-37191.html
Air Quality Index Levels of Health Concern
Numerical Value
Meaning
Green/Good 0-50 Air quality is considered satisfactory, and air pollution poses little or no risk.
Yellow/Moderate 51-100 Air quality is acceptable; however, for some pollutants there may be a moderate health concern for a very small number of people who are unusually sensitive to air pollution.
Orange/Unhealthy for Sensitive Groups
101-150 Members of sensitive groups may experience health effects. The general public is not likely to be affected.
Red/Unhealthy 151-200 Everyone may begin to experience health effects; members of sensitive groups may experience more serious health effects.
Purple/Very Unhealthy 201-300 Health alert: everyone may experience more serious health effects.
Maroon/Hazardous >300 Health warnings of emergency conditions. The entire population is more likely to be affected.

Wayne County 2012 Community Health Assessment Page 59
Water Quality (EPA measures watershed quality using 15 indicators)
Based on EPA measures of watershed quality using 15 different indicators, Sperling’s Best Places has created a rating system on a 100 point scale, with 100 being the highest possible water quality. According to this 2010 report, Wayne County scored 70 out of 100, compared to 74 out of 100 for the state, and 55 out of 100 for the US. 68
Peer County Comparisons According to the CHA Guidelines, comparisons must be made between the county of interest and peer counties regarding secondary data. Peer counties are determined by their similarity in population size, density, age/race distributions, and poverty levels. The following counties have been identified as peer counties for Wayne County: (1) Alamance, (2) Gaston, (3) Pitt, (4) Robeson, and (5) Rowan.
68 Sperling’s Best Places. Available at: http://www.bestplaces.net/health/county/north_carolina/wayne
13.1 12.6 12.3 11.1 10.8
15.0 15.0 15.0 15.0 15.0
0.0
2.0
4.0
6.0
8.0
10.0
12.0
14.0
16.0
18.0
2004-2006 2005-2007 2006-2008 2007-2009 2008-2010
Va
lue
Year
Wayne County Average Annual Concentration Compared to the EPA
Standard
Wayne
EPA

Wayne County 2012 Community Health Assessment Page 60
Please find below a listing of common priority areas for Wayne County’s peer counties. Alamance:
Access to healthcare
Obesity
Mental health
Substance abuse
Education
Poverty
Gaston: Obesity
Cardiovascular disease/high blood pressure
Cancer
HIV/STDs
Mental health
Substance abuse
Access to healthcare
Pitt: Chronic disease
STD
Access to healthcare
Healthy weight
Violence
Robeson: Obesity
Substance abuse
Rowan: Obesity
Access to healthcare
The following table reports whether Wayne County is below average, average, or above average with regards to peer counties in four data domains including: (1) education, (2) economy, (3) social, and (4) health. Wayne County needs most improvement in the health domain, followed by economy and education. Regarding the social domain, Wayne County is doing better that its peer counties.

Wayne County 2012 Community Health Assessment Page 61
Indicator Wayne Peer County Comparison Below Avg. Average Above Avg.
Ed
uca
tio
n
Percent with High School Diploma or Higher
80.1%
Percent with Associate’s Degree
8.9%
Percent with Bachelor’s Degrees or Higher
14.4%
Drop-Out Rate 4.84
SAT Scores 950
Eco
no
my
Median Annual Household Income
$39,085
Per Capita Income $20,141
Poverty Rates 23.4
Unemployment 9.4
Percent of Students on Free and Reduced Lunch
66.3%
So
cia
l
Violent Crime Rate 454.1
Property Crime Rate 4,240.4
Percent Population Uninsured
20.4%
Primary Care Provider Ratio 1,554:1
He
alt
h
Infant Mortality Rate 11.6
Teen Pregnancy Rate 57.3
Cancer Mortality Rate 235.3
Heart Disease Mortality Rate 172.2
Diabetes Mortality Rate 42.8
STD Rates 1077.2
HIV / AIDS Rates 35.1

Wayne County 2012 Community Health Assessment Page 62
Health Care Resources
Cliffs of the Neuse State Park
Edgewood Community Development School
o Services for autistic and moderate to profoundly mentally handicapped children
between the ages of 3 and 21 years of age
Eastern Associates Speech and Language Services, Inc.
o Speech language and communicative disorder therapy for adults and children
Eastpointe
o Information, referral, crisis intervention telephone services provided by Wayne
County Mental Health Association
Goldsboro Pediatrics
o Provides quality pediatric care and referrals as needed
Goshen Medical Center
o Provides income-based health care services
Habitat for Humanity of Greater Goldsboro
o Provides home ownership opportunities for low-income families
Mount Olive Family Medicine
Mount Olive Pediatrics
Salvation Army
o Provides food, clothing, medicine, and other necessities to low income families
The Shelter of Wayne County
o Emergency shelter for abused women and children
Soup Kitchen
o Provides meals Monday through Saturday to needy people in downtown Goldsboro
United Church Ministries
o Interdenominational organization providing emergency assistance
WAGES
o Community action agency dedicated to helping Wayne County mobilize its resources
to combat poverty
WATCH Healthcare Program
o Provides a medical home to the uninsured of Wayne County. A mobile medical unit
and a stationary clinic at the Goldsboro Family YMCA provide free acute and
primary health care with indicated labs and free prescription medications for those
who qualify.
Wayne Community College
o Provides adult high school, GED, post-secondary, and continuing educational
opportunities to Wayne County citizens
Wayne County Communities in Schools

Wayne County 2012 Community Health Assessment Page 63
o Community based organization that works to prevent students from dropping out of
school
Wayne County Department of Social Services
o Comprehensive financial and family preservation services provided to income
eligible and at risk residents
Wayne County Health Department
Wayne County Mental Health Center
o Treatment for mental illness and substance abuse
Wayne Memorial Hospital
Wayne Uplift Resource Center
o Provides comprehensive family development services to residents of low-income
housing communities in Goldsboro
Wayne Initiative for School Health (WISH)
o School-based program that provides services for minor illness, injuries,
immunizations, nutrition services, lab services, comprehensive physicals, health
education, chronic illness management, and dental screenings
o Brogden Middle, Dillard Middle, Goldsboro High, Wayne School of Engineering,
Mount Olive Middle, Southern Wayne High
Parks and Recreation Facilities
Goldsboro Family YMCA
Parks
o Berkley Park
o Fairview Park
o Henry C. Mitchell Park
o Herman Park
o H.V. Brown Park
o Mina Weil Park
o North End Park
o Peacock Park
o Quail Park
o South End Park
o Stoney Creek Park
Recreation:
o Boys and Girls Club
o Herman Park Center
o Senior Citizens Building
o W.A. Foster Recreation Center

Wayne County 2012 Community Health Assessment Page 64
Review of Primary Data The review that follows summarizes data collected from stakeholders, focus groups and the community survey. The leadership team compared the primary data to secondary data as well as contextual information, not included in this section, about Wayne County to determine the focus areas of this Community Health Assessment. These data are meant to portray a snapshot of community perceptions during the assessment period.
Stakeholders
The leadership team compiled a list of key stakeholders representing multiple sectors including municipal, health, education, philanthropy, and faith-based organizations. A community meeting with 43 stakeholders convened to gain support for the community health assessment and to gather opinions about community health best practices. A group of up to 10 stakeholders sat at each of seven tables. Each table was assigned one of the following categories: church, family, government/health department, hospital/physicians, neighborhood, schools and other. Stakeholders were asked to answer the question, “What would a health County look like?” Responses were recorded and organized according to the categories.
Themes included access to care, healthy eating, physical activity, community safety,
and mental health. In relation to access to care, stakeholders discussed strategies such as screening, health education and outreach. Barriers to access included the high cost of health care and lack of health insurance as well as cultural and language differences. In relation to healthy eating and physical activity, most participants expressed an understanding of the link between unhealthy food choices and lack of physical activity on particular health outcomes, such as obesity and diabetes. In relation to community safety, stakeholders wanted the “ability to walk everywhere safely.” Mental health was discussed it in terms of prevention. Stakeholders approached health care from a proactive perspective, with emphasis on prevention, such as access to lighted sidewalks, walking trails and bicycle lanes. For multiple stakeholders, prevention also included more school nurses, primary care and mental health services.
A meeting was conducted with providers in a local clinic that targets uninsured and
low income residents. This group noted that some patients with poor family health history were resigned to having high blood pressure, or diabetes, as per: “It runs in my family; that’s just the way it is”. This group suggested that increasing the understanding of how changes in diet and exercise and/or treatment with medications could often help delay or correct health conditions would be a good strategy to consider.
Focus Groups Focus groups (N = 86) with community members were conducted to solicit feedback regarding the health needs in the community. Three focus groups were comprised of

Wayne County 2012 Community Health Assessment Page 65
primarily under-represented populations. The other seven met in strategic geographic locations throughout the county. A number of first responders, due to location, were asked to participate in the seven focus groups along with the general public that lived in or in close proximity to the area or region. Although efforts were made to have under-represented populations present at the seven focus groups, the participants were predominantly White. There was an equal gender representation in the ten focus groups. Two team members conducted each session by asking a series of questions. Results were transcribed and analyzed for themes.
Focus Group Summary Table (34 females, 32 males) Location Date Attendance
Community Soup Kitchen 2/8/12 1 female, 6 males
WATCH free clinic 2/15/12 3 females, 3 males
Latino Market 2/15/12 3 females, 4 males
Grantham Fire Department 5/21/12 9 females, 3 males
Wayne County Public Library 5/22/12 4 females, 5 males
Pinewood Fire Department 5/31/12 4 females, 3 males
Fremont Fire Department 6/4/12 3 females, 5 males
Seymour Johnson Air Force Base 6/14/12 7 females, 8 males
Dudley Fire Department 6/19/12 4 females, 5 males
Seven Springs Fire Department 6/21/12 3 females, 3 males
When asked about the best thing about living in their community, the majority of participants agreed on characteristics such as community support, friendliness, a feeling of connectedness and both size and location. People primarily walk, ride bikes, participate in youth sports and go to the YMCA to stay healthy. Participants also discussed involvement in personal gardening as well as community gardens as a way to stay healthy. Health information was received actively from doctors, the WATCH van and health fairs. Multiple dissemination sources were also discussed, such as newspaper articles, the hospital newsletter, churches, schools, the health department and word of mouth. Participants cited obesity, cancer, mental health issues, diabetes, high blood pressure, heart disease and drugs/alcohol as serious community health problems. The common causes were listed as poor diet, lack of exercise, smoking, and a busy lifestyle. Moreover, participants frequently discussed the inability to pay for healthcare, lack of insurance and lack of access to and ability to afford healthy foods as causes for the aforementioned health problems. Common barriers to healthy community members were lack of information, education and time, costs associated with eating healthy, transportation issues, and lack of access to healthy foods. Other barriers included lack of exercise for children due to technology and decreased time spent outdoors. Additionally, poverty, culture and a shortage of doctors were discussed.

Wayne County 2012 Community Health Assessment Page 66
Participants were asked to suggest solutions to the community problems. Answers included more satellite healthcare centers and clinics, more doctors with longer available hours, having the WATCH van run more frequently and more advertising about available transportation services. Additional resources such as farmer’s markets and community gardens were also cited. Participants thought more education and information regarding healthy eating and exercise would be beneficial as well as increased access to healthy foods and exercise programs. Incentivizing healthy eating and exercise was a common idea as was utilizing churches, workplaces, schools and other organizations to disseminate information, offer exercise programs and provide healthy foods to community members. When requested to think about any group not receiving enough healthcare, the elderly, migrant workers, the Hispanic population, and new college graduates and teenagers were discussed. Additionally, both the uninsured and the population that is slightly above the poverty threshold, therefore receive no assistance, but barely makes enough money to pay for health insurance were common responses.
Community Survey
A community survey was developed and implemented to compliment and reinforce secondary data collected from a variety of sources. The purpose of the survey was to collect the varying opinions of community members regarding a variety of community health topics.
The community survey (N = 1369) was administered in both online and paper format, in order to capture the opinions of individuals with and without Internet access. Research team members made community members aware of the survey at the focus group sessions. Focus group attendants were also given information cards, which included an Internet link to the online survey, to distribute to additional community members. Paper-format surveys were strategically placed at select locations around the county. The survey took approximately 30 minutes to complete and consisted of fixed-answer and open-answer question types. As an incentive for participation, a free two-week membership to the local YMCA was offered. The majority of survey respondents were women (83.2 percent) and approximately half (49.4 percent) were between the ages of 35 and 54. The racial distribution of respondents primarily consisted of 66.8 percent White, 27.2 percent Black, and 3.4 percent Hispanic/Latino. Educational attainment was high among respondents with 65 percent reporting that they had an Associate’s degree or higher. Half of survey respondents (50.1 percent) had an annual household income of at least $50,000. Population calibration or “data weighting” was conducted to compensate for discrepancies between the survey population demographic profile and that of the county.

Wayne County 2012 Community Health Assessment Page 67
Weighting procedures were conducted on demographic variables age, sex, race, income, and education. The weighting process allows underrepresented demographic groups to have equivalent opinions as those who are overrepresented. All data presented below has been weighted to the demographics of Wayne County. Respondents were asked to rate the quality of life in Wayne County. The majority of respondents agreed or strongly agreed that Wayne County has clean air and water (79 percent), is a good place to grow old (69 percent) and raise children (67 percent), has good healthcare (65 percent), and that they are able to receive help from other community members in time of need (60 percent). In contrast, more than half of respondents (66 percent) did not agree that there was plenty of economic opportunity in Wayne County.
Quality of Life Survey Results Indicators Percent who agree or strongly agree
Clean air and water 79
Good place to grow old 69
Good place to raise children 67
Good healthcare 65
Help for people in time of need 60
Safe place to live 57
Plenty of economic opportunity 34
From a list of 18 possible choices, respondents identified the health condition(s) that they had been diagnosed with by a doctor or health care professional. The most frequently reported diseases are listed below. At 38 percent, the top health condition selected was overweight/obesity. Closely related, high blood pressure (31 percent) and high cholesterol (25 percent) trailed overweight/obesity as the second and third health conditions selected, respectively.
Self-Reported Chronic Disease Disease Percent reporting diagnosis
Overweight/obesity 38
High blood pressure 31
High cholesterol 25
Depression/anxiety 24
Asthma 17
Diabetes 11

Wayne County 2012 Community Health Assessment Page 68
Respondents selected five top issues for Wayne County out of 54 options. The table below includes the most frequently reported social issues. The top three social issues selected include job availability (45 percent), poverty/low income (36 percent) and drug abuse (36 percent).
Social issues Social Issues (selected 5) Percent respondents (sums to >100%)
Job availability 45
Poverty/low income 36
Drug abuse 36
Violent crime 24
Gang activity 24
Recreation opportunities 18
Discrimination/racism 16
The table below includes the most frequently reported health issues, out of the 54 options for top issues in Wayne County. The top three health issues selected included alcohol use (21 percent), overweight children (19 percent) and overweight adults (19 percent).
Health issues Health Issues (selected 5) Percent respondents (sums to <100%)
Alcohol use 21
Overweight children 19
Overweight adults 19
Cancer 13
Allergies 9
Heart disease 4
Chronic diseases 4
Survey respondents indicated if they participated, during a normal week, in any physical activity or exercise that lasts at least a half an hour. More than two-thirds of respondents (69 percent) indicated that they did engage in exercise.
Exercise behaviors of community members Engage in Exercise Percent respondents
Yes 69
No 31

Wayne County 2012 Community Health Assessment Page 69
The graph below indicates the type of exercise activities in which survey respondents engaged. Three-fourths (74.7 percent) indicated they engaged in walking as an exercise. Less than half of respondents indicated weight training (42.3 percent), running (31.7 percent), bicycling (30.6 percent) and sports team participation (18.7 percent) as a form of physical activity in which they engaged.
Exercise Activities
The table below indicates the locations in Wayne County where survey respondents participated in physical activity. Half of respondents (49 percent) indicated that they exercised at home. Following, a quarter of respondents (26 percent) indicated that they used the sidewalks and roads in their neighborhoods to exercise.
Exercise locations Location Percent respondents (sums to >100%)
Home 49
Neighborhood sidewalks/roads 26
YMCA 9
Private gym 7
Herman Park 6
Stoney Creek Park 5
Public recreation center 3
Cliffs of the Neuse State Park 3
Waynesborough Park Trails 1
74.7
42.3
31.7 30.6
18.7
0
10
20
30
40
50
60
70
80
Walk Weights Run Bicycling Sports team
Pe
rce
nta
ge (
%)
Rating
Exercise Activities

Wayne County 2012 Community Health Assessment Page 70
Respondents identified the services within the community that they believed needed the most improvement. Services indicated as needing the most improvement by at least 10 percent of survey respondents included recreational facilities (18 percent), higher paying employment (14 percent), positive teen activities (11 percent) and availability of employment (10 percent).
Services needing most improvement Service (selected 1) Percent respondents (sums to <100%)
Recreational facilities 18
Higher paying employment 14
Positive teen activities 11
Availability of employment 10
Affordable health services 6
Healthier food choices 5
Road maintenance 4
Respondents identified health behavior topics for which they believed people needed the most information about in Wayne County. Health topics that at least 10 percent of survey respondents indicated their community needed more information about included eating well/nutrition (13 percent), crime prevention (11 percent), stress management (10 percent) and preventing pregnancy and STDs (10 percent).
Top information needed Topic (selected 1) Percent respondents (sums to <100%)
Eating well/nutrition 13
Crime prevention 11
Stress Management 10
Preventing pregnancy and STDs 10
Managing weight 8
Substance abuse prevention 8
Exercising/fitness 6

Wayne County 2012 Community Health Assessment Page 71
Similarly, respondents identified health behavior topics for which they believed the children needed more information about in Wayne County. The top three health topics selected were nutrition (13 percent), drug abuse (10 percent) and sexually transmitted diseases (9 percent).
Top information needed for children Topic Percent respondents (sums to <100%)
Nutrition 13
Drug abuse 10
Sexually transmitted diseases 9
Sexual intercourse 8
Reckless driving/speeding 8
Alcohol 7
Tobacco 4
When respondents were asked about their personal tobacco use, a large portion (88 percent) indicated that they did not smoke. Furthermore, nearly the entire survey population (99 percent) indicated that they did not chew tobacco products.
Drug use Drug Use Percent respondents
Do not smoke 88
Do not chew tobacco 99
Respondents who indicated that they currently used tobacco products were asked about their intentions to cease their usage. A large portion of tobacco users (72 percent) indicated that they had intentions to quit using tobacco products and nearly half (46 percent) had attempted to quit using.
Intentions to quit using tobacco products Intention Percent respondents
Want to stop using tobacco 72
Tried to stop using 46

Wayne County 2012 Community Health Assessment Page 72
Over half (58 percent) of the survey population indicated that they did not consume alcohol. The majority of remaining respondents indicated that they consumed less than or equal to 1-2 drinks per week at 21 and 12 percent, respectively.
Alcohol consumption Frequency Percent respondents
I do not consume alcohol 58
Less than 1-2 drinks per week 21
Consume 1-2 drinks per week 12
Consume 1-2 drinks per day 5
Consume 3 or more drinks per sitting 4
Self-reported drug use was extremely low among survey respondents. A combined 8 percent indicated that they were either confused about their prescription drug use or believed that they may abuse their prescription drugs. Additionally, only 2 percent of the survey population self-reported illegal drug use.
Self-reported drug abuse Drug Use Percent respondents
I am confused about my prescription drug use 1
I think I may abuse prescription drugs 7
I use illegal drugs 2
Over half of survey respondents (54 percent) indicated that they had been exposed to secondhand smoke within the last year. The most frequently selected locations in which they were exposed to secondhand smoke included the home (31 percent) and workplace (25 percent). Furthermore, a portion of respondents (34 percent) indicated that they were exposed in other locations than were provided to them as choices on the survey. The other locations provided by participants were primarily outdoors. Secondhand smoke exposure within the last year Exposure in the past year Percent respondents
Yes 54
No 46

Wayne County 2012 Community Health Assessment Page 73
Location of secondhand smoke exposure Location Percent respondents
Home 31
Workplace 25
Restaurants 8
School 1
Hospitals 1
Other (primarily outdoors) 34
Survey respondents were asked the extent to which they agreed with a set of potential solutions to health problems. All presented solutions received strong support. Notably, health education (74 percent), parenting education (73 percent) and providing alternatives for teens (71 percent) received large amounts of respondents who agreed or strongly agreed with them as solutions.
Solutions to health problems Solution Percent who agree or strongly agree
Health education 74
Parenting education 73
Providing alternatives for teens 71
Dealing with stress 68
Education about eating right 65
Classes to stop smoking 58
Reminders to exercise 53
Respondents were asked the where they receive most of their health-related information. The top two sources of health information included a doctor/nurse and the Internet, each with 32 percent.
Source of health information Source of health information Percent respondents (sums to <100%)
Doctor/nurse 32
Internet 32
Health department 9
Hospital 8
Friends and family 8
Books/magazines 5
In addition to indicating agreement with possible solutions to health problems, respondents were asked about the importance of additional solutions. The majority of

Wayne County 2012 Community Health Assessment Page 74
survey respondents rated all possible solutions as very or extremely important. The two solutions that were selected as most important included that individuals take personal responsibility of their health (93 percent) and that schools provide more health education (88 percent).
Importance of possible solutions Solution Percent very or extremely
important
Individuals take personal responsibility of their health
93
Schools provide more health education 88
Hospitals recruit more health providers 78
Employers take an active role in health promotion 75
Restaurants provide healthier choices 71
Government provide more exercise facilities 60
Churches take an active role in health promotion 59
The graph below demonstrates the breakdown of type of health insurance among survey respondents. Top insurance options included Blue Cross Blue Shield NC (26 percent), other private insurance (19 percent) and state employee coverage (10 percent). Additionally, 20 percent of survey respondents indicated that they did not have any insurance coverage. The final portion of respondents indicated that they had Medicare (10 percent), Medicaid (7 percent) or Military/Tricare (8 percent) coverage.

Wayne County 2012 Community Health Assessment Page 75
Type of Health Insurance Coverage
When asked where survey respondents went to receive healthcare, 59 percent indicated that they went to a private physician’s office. Furthermore, a combined 42 percent of respondents received their care at either urgent care or the hospital/emergency department.
Location where community members receive healthcare Location Percent respondents (sums to >100%)
Private physician 59
Urgent care 24
Hospital/emergency department 18
Private dentist 18
GOSHEN Medical Center 6
Health department 6
Seymour Johnson AFB 5
State Employee 10%
BCBS NC 26%
Other Private 19%
Medicare 10%
Medicaid 7%
Military / Tricare 8%
None 20%
Type of Health Insurance Coverage

Wayne County 2012 Community Health Assessment Page 76
Survey respondents were asked when they had last visited a health care professional. The majority of respondents (81 percent) had seen a health care professional within the last year.
Last visit to a doctor Last visit Percent respondents
Less than 1 year ago 81
1-2 years ago 9
2-3 years ago 2
3 or more years ago 8
If survey respondents indicated that they were unable to receive access to the healthcare they needed, they were asked to cite the barrier to care. The top barrier to healthcare was a lack of health insurance (9 percent), followed by limited coverage (5 percent) and costly deductible (4 percent).
Barriers to healthcare Barrier Percent respondents (sums
to <100%)
No health insurance 9
Limited coverage 5
Costly deductible 4
Too long of a wait 2
Could not get an appointment 1
Doctor wouldn’t accept form of insurance 1
Dentist wouldn’t accept form of insurance 1
Respondents were asked to rate, in general, their personal health. The largest percentage of respondents rated their health as very good (34.6 percent), followed closely by good (31.7 percent). Nearly equal portions believed their health was either excellent (15 percent) or fair (17 percent). A small percentage rated their health as poor (1.7 percent).

Wayne County 2012 Community Health Assessment Page 77
General health rating
Respondents indicated whether they had undergone a preventative screening for a variety of health conditions within the last 3 years. Over half of all respondents (57 percent) indicated that they had been screened for high blood pressure. A similar percentage of females (53 percent) reported that they had been screened for breast cancer. Fewer respondents reported undergoing screenings for diabetes (46 percent) and less than a quarter of respondents indicated undergoing screenings for color cancer (24 percent) and HIV/AIDS (21 percent).
Health screening behavior Screening Yes No
High blood pressure 57% 43%
Breast cancer (F) 53% 47%
Diabetes 46% 54%
Prostate cancer (M) 34% 66%
Uterine cancer (F) 27% 73%
Colon cancer 24% 76%
HIV/AIDS 21% 79% Respondents were asked if they participated in an assortment of health promoting
behaviors. The top three healthy behaviors included practicing safe sex (80 percent), relaxing daily (74 percent) and getting adequate sleep (61 percent). The remaining
15
34.6
31.7
17
1.7
0
5
10
15
20
25
30
35
40
Excellent Very Good Good Fair Poor
Pe
rce
nta
ge (
%)
Rating
General Health Rating

Wayne County 2012 Community Health Assessment Page 78
behaviors also received high levels of participation, ranging from eating fast food less than twice a week (57 percent) to getting an annual flu shot (31 percent).
Health promoting behaviors Health Behavior Yes No
Safe sex 80% 20%
Relax daily 74% 26%
7+ hours of sleep 61% 39%
Fast food (<2/week) 57% 43%
Take vitamins daily 57% 43%
Worry about needs 40% 60%
Flu Shot 31% 69%
Emergency Preparedness The emergency preparedness of survey respondents was assessed with multiple questions. Basic preparedness was questioned by asking respondents if they had working smoke and carbon monoxide detectors and a basic emergency kit in their home. 58 percent of respondents indicated that their home was equipped with only smoke detectors, whereas 29 percent indicating having both smoke and carbon monoxide detectors. Half of respondents reported having an emergency supply kit in their home. Regarding disaster response, 51 percent of respondents reported using the television as their main source of information during a large-scale disaster. 83 percent reported that they would leave their home if they were instructed to do so by public authorities during an evacuation. If participants were unwilling to evacuate if instructed to do so, the top reasons they would not leave included concerns about family safety (22 percent), leaving property (20 percent), leaving pets (14 percent) and personal safety (13 percent). Finally, 54 percent of households had at least one family member who was trained in CPR, 85 percent of households consisted of members who were all trained in turning off household utilities and 64 percent of adults were aware of their workplaces’ disaster plan.

Wayne County 2012 Community Health Assessment Page 79
Working smoke and carbon monoxide detectors in the home
Percent respondents (sums to <100%)
Yes, smoke detectors only 58
Yes, carbon monoxide detectors only 1
Yes, both 29
No 8
Basic emergency supply kit in the home
Percent respondents
Yes 49
No 51
Main source of information during a large-scale disaster
Percent respondents
Television 51
Radio 21
Text message (emergency alert system) 11
Internet 9
Social networking site 4
Neighbors 3
Newspaper 1
Would you leave your home if public authorities announced a mandatory evacuation?
Percent respondents
Yes 83
No 3
Don’t know/not sure 14

Wayne County 2012 Community Health Assessment Page 80
Main reason you would not evacuate
Percent respondents (sums to <100%)
Concern about family safety 22
Concern about leaving property 20
Concern about leaving pets 14
Concern about personal safety 13
Lack of trust in public officials 7
Concern about traffic jams 3
Lack of transportation 3
Member in your household trained in CPR Percent respondents
Yes 54
No 46
All family members trained to turn off all household utilities
Percent respondents
Yes 85
No 15
Do you know the disaster plan for the following areas? Percent respondents
Yes No N/A
Your workplace 64 18 18
Your child’s school 22 21 57
Your child’s daycare center 10 14 76

Wayne County 2012 Community Health Assessment Page 81
Summary and Next Steps
As mentioned previously, this comprehensive community health needs assessment identified the following focus areas for 2013 – 2016. Moreover, without addressing both social and health together, significant health improvements will not be accomplished.
As seen in the table below, there was significant overlap between the current health findings and those from 2008. Teen pregnancy and infant mortality did not arise as focus areas in the current assessment and the rates for these indicators are improving. However, these areas continue to need attention as Wayne County’s infant mortality and teen pregnancy rates are worse than those of North Carolina. In 2012, health literacy and mental health were cited as key areas needing attention.
2008 Health Focus Areas 2012 Health Focus Areas
Obesity Obesity
Chronic Disease (Cancer, Heart Disease, Diabetes) Chronic Disease (Cancer, Heart Disease, Diabetes)
STDs (Sexually Transmitted Diseases) STDs (Sexually Transmitted Diseases)
Teen Pregnancy Health Literacy
Infant Mortality Mental Health
From January – May 2013 committees will be formed around the focus areas for the
purpose of developing action plans. These action plans will be used to guide initiatives for the next four years and serve as a basis for reporting status annually toward addressing the areas identified in this community health assessment process.
Wayne County Focus Areas
Social Indicators:
- Poverty
-Access to healthcare
- Crime
- Education
Health Indicators:
-Health literacy
- Mental health
- Health Conditions

Wayne County 2012 Community Health Assessment Page 82
Appendix A – Community Survey This community survey was available online and in paper format in both English and Spanish.

Wayne County 2012 Community Health Assessment Page 83
Wayne County Community Health Needs Assessment
We are conducting a survey of our county to learn about the health and quality of life in Wayne
County. The results of the survey will be used to help address the major health and community issues
in our county.
If you are at least 18 years old and live in Wayne County, please complete the following survey (limit
one per household). All survey responses will remain anonymous.
To thank you for your participation, the Goldsboro Family YMCA is granting a free two-week
membership to all who complete the survey (limit one per household). You will receive more
information on how to claim this upon completion of the survey.
Part 1: Quality of Life Statements
Please indicate your level of agreement with the following statements.
Strongly
Agree Agree Neutral Disagree
Strongly Disagree
There is good healthcare in Wayne County. (Consider the cost and quality, number of options and availability of healthcare in
the county.)
Wayne County is a good place to raise children. (Consider the quality and safety of schools and child care programs, after school
programs and places to play in this county.)
Wayne County is a good place to grow old. (Consider the county’s elder-friendly housing, transportation to medical
services, recreation and services for the elderly.)
There is plenty of economic opportunity in Wayne County. (Consider the number and quality of jobs, job training/higher
education opportunities and availability of affordable housing in the county.)
Wayne County is a safe place to live. (Consider how safe you feel at home, in the workplace, in schools, at playgrounds, parks and
shopping centers in the county.)
There is plenty of help for people during times of need in Wayne County. (Consider social support in this county: neighbors,
support groups, faith community outreach, community organizations and emergency monetary assistance.)
There is good air and water quality in Wayne County.
Part 2: Community Improvement Please look at the following list of community issues on the next page. In your opinion, which are the TOP FIVE issues that most affect the quality of life in Wayne County?

Wayne County 2012 Community Health Assessment Page 84
Alcohol use
Allergies
Asbestos Exposure
Asthma and other respiratory disorders
Bio-terrorism
Bulimia or Anorexia
Cancer
Child care (safe, affordable, available)
Child abuse
Chronic diseases
Discrimination/racism
Domestic violence
Drug abuse
Education (K-12) - Dropout rate
Elder abuse
Elder care (safe, affordable, available)
Farming safety
Firearms
Fire protection
Gambling
Gang activity
Health care availability
Health care affordability
Heart disease
Homelessness
Hopelessness
Infant health
Infectious diseases (hepatitis, meningitis, TB)
Job availability
Job security
Lack of parenting skills
Lack of/inadequate health insurance
Land use/development
Law enforcement
Lead paint
Loneliness
Mental illness
Mosquitoes
Nursing home care (safe, affordable, available)
Overweight adults
Overweight children
Pollution (air, water, land)
Poverty/low income
Prenatal health
Radioactive materials (contamination)
Rape/sexual assault
Recreation opportunities
Recycling availability
Roads
Secondhand smoke
School violence
Services for the disabled
Theft
Violent crime (murder, assault)

Wayne County 2012 Community Health Assessment Page 85
Please indicate your level of agreement with the following statements as good solutions to many of
the problems in the previous question.
Strongly Disagree
Disagree Neutral Agree Strongly
Agree
Education about eating right
Classes to stop smoking
Reminders to exercise
Dealing with stress
Providing alternatives for teens
Parenting education
Health education
Please indicate any other possible solutions you believe can address the problems in Wayne County.
(Please indicate which problem(s) you are addressing)
_____________________________________________________________________________________
_____________________________________________________________________________________
_____________________________________________________________________________________

Wayne County 2012 Community Health Assessment Page 86
In your opinion, which ONE of the following services needs the most improvement in your
neighborhood or community? If there is a service that you think needs improvement that is not on
this list, please write it in.
Animal control
Child care options
Elder care options
Services for disabled people
More affordable health services
Better/more healthy food choices
More affordable/better housing
Number of health care providers (specify type of provider): ____________________
Culturally appropriate health services
Counseling/mental health/support groups
Better/more recreational facilities (parks, trails, community centers)
Healthy family activities
Positive teen activities
Transportation options
Availability of employment
Higher paying employment
Road maintenance
Road safety
Parent education
Other: ____________________
None

Wayne County 2012 Community Health Assessment Page 87
Part 3: Health Information
In your opinion, which ONE health behavior do people in your own community need more
information about?
Eating well/nutrition
Exercising/fitness
Managing weight
Going to a dentist for check-ups/preventive care
Going to the doctor for yearly check-ups and screenings
Getting prenatal care during pregnancy
Getting flu shots and other vaccines
Preparing for an emergency/disaster
Using child safety seats
Using seat belts
Driving safely
Quitting smoking/tobacco use prevention
Child care/parenting
Elder care
Caring for family members with special needs/disabilities
Preventing pregnancy and sexually transmitted disease (safe sex)
Substance abuse prevention (ex: drugs and alcohol)
Suicide prevention
Stress management
Anger management
Domestic violence prevention
Crime prevention
Rape/sexual abuse prevention
Other: ____________________
None

Wayne County 2012 Community Health Assessment Page 88
Where do you get most of your health-related information?
Friends and family
Doctor/nurse
Pharmacist
Church
Internet
My child's school
Hospital
Health department
Help lines
Books/magazines
Other: ____________________
What health topic(s)/disease(s) would you like to learn more about?
_____________________________________________________________________________________
_____________________________________________________________________________________
Do you have children between the ages of 9 and 19 for which you are the caretaker? (Includes step-
children, grandchildren or other relatives)
Yes
No
ONLY ANSWER the next question IF you do have children between the ages of 9 and 19 for which you
are the caretaker:
Which of the following health topics do you think your child/children need(s) more information
about? Please check all that apply.
Dental hygiene
Nutrition
Eating disorders
Asthma management
Diabetes management
Tobacco
Sexually transmitted diseases (STDs)
Sexual intercourse
Alcohol
Drug abuse
Reckless driving/speeding
Mental health issues
Suicide prevention
Other: ____________________

Wayne County 2012 Community Health Assessment Page 89
Part 4: Personal Health
Would you say that, in general, your health is...
Excellent
Very good
Good
Fair
Poor
Have you ever been told by a doctor, nurse or other health professional that you have any of the
following health conditions?
Yes No Not Sure
Asthma
Depression or anxiety
High blood pressure
High cholesterol
Diabetes (not during pregnancy)
Osteoporosis
Overweight/obesity
Angina/heart disease
Breast cancer
Colon cancer
Prostate cancer
Skin cancer
Uterine cancer
HIV
Sickle cell anemia
COPD or emphysema
Tuberculosis
Chronic back pain

Wayne County 2012 Community Health Assessment Page 90
Diabetes affects 1 in 10 Wayne County adults. Please indicate your status or awareness of the
following items.
Yes No Not Sure
Have you ever been tested for diabetes?
Are you pre-diabetic (screening test)?
Do you have knowledge of the symptoms of diabetes?
Do you have knowledge of the health consequences of diabetes?
Are healthy foods available to you?
Do you have knowledge of the impact exercise can have on diabetes?
ANSWER the next table ONLY IF you have ever been told by a doctor, nurse or other health care
professional that you have diabetes (not during pregnancy).
Please indicate your status on the following items.
Yes No Not Sure
Do you currently receive routine care for diabetes?
Are you a part of a diabetes support group?
Have you had success in healing wounds, which may be hindered by diabetes?
Have you undergone any treatment for your eyes due to a diabetes induced condition?
Are your diabetic needs met?
Have you been to WADEC (Wayne Area Diabetes Education Center) on Williams Street?

Wayne County 2012 Community Health Assessment Page 91
Have you undergone any preventive screenings for the following conditions (in the last 3 years)?
Yes No Not Sure
High Blood Pressure
Breast cancer
Colon cancer
Prostate cancer
Uterine cancer
HIV
Diabetes - blood sugar
Sickle cell anemia
COPD or emphysema
Tuberculosis- skin test
Dental exam
Asthma
Depression or anxiety
Skin cancer

Wayne County 2012 Community Health Assessment Page 92
Please indicate if you participate in any of the following.
Yes No Not Sure
Get the one-time pneumonia vaccination
Take vitamins daily
Wash your hands before eating
Eat fast food less than 2 times per week
Get 7+ hours of sleep each night
Practice safe sex (condoms, other barriers)
Use sunscreen outside
Routinely wear a seat belt
Find time to relax daily
Talk to friends daily
Feel safe in your neighborhood
Worry about basic necessities
Spend money on gambling more than once a month
Attend religious services routinely
Volunteer in your community
In the past 30 days, have there been any days when feeling sad or worried kept you from going about
your normal business?
Yes
No
In the past 30 days, have you had any physical pain or health problems that made it hard for you to
do your usual activities such as driving, working around the house or going to work?
Yes
No
During a normal week, other than in your regular job, do you engage in any physical activity or
exercise that lasts at least a half an hour?
Yes
No
If you said YES about exercising, how many times do you exercise or engage in physical activity during
a normal week?
Please write in a number: _____________

Wayne County 2012 Community Health Assessment Page 93
If you said YES about exercising, where do you go to exercise or engage in physical activity? Please
choose all that apply.
Home
Private gym
YMCA
Sidewalks/roads in your own neighborhood
Stoney Creek Park
Public recreation center
Herman Park
Cliffs of the Neuse State Park
Waynesborough Park (trails)
Seymour Johnson AFB facilities
Other: ____________________
If you said YES about exercising, please indicate your participation in any of the following activities as
part of your exercise routine (at least 3 times per week).
Yes No
Neighborhood walk
Neighborhood run
Weights
Sports team participation
Bicycling

Wayne County 2012 Community Health Assessment Page 94
If you said NO about exercising, what are the reasons you do not exercise for at least a half hour
during a normal week? Please choose all that apply.
My job is physical or hard labor.
Exercise is not important to me.
I don't have access to a facility that has the things I need, like a pool, golf course or a track.
I don't have enough time to exercise.
I would need child care and I don't have it.
I don't know how to find exercise partners.
I don't like to exercise.
It costs too much to exercise.
There is no safe place to exercise.
Not enough bike trails
I'm too tired to exercise.
I'm physically disabled.
I don't know.
Other: ____________________
Not counting lettuce salad or potato products, think about how often you eat fruits and vegetables in
an average week. How many cups PER WEEK of fruits and vegetables would you say you eat? One
apple or 12 baby carrots equal one cup. Lettuce salad is the typical "house salad" with iceberg lettuce
or the salad mixes you get at the store or fast food restaurants, even if they have meat on top. Potato
products are French Fries, baked potatoes, hash browns, mashed potatoes - anything made from
white potatoes. For the purposes of this study, ketchup is NOT considered a vegetable.
Number of cups of fruit per week ____________
Number of cups of vegetables per week ___________
Number of cups 100% fruit juice per week ___________

Wayne County 2012 Community Health Assessment Page 95
Please indicate how frequently you consume alcohol.
I do not consume alcohol
Less than 1 - 2 drinks per week
Consume 1 - 2 alcoholic drinks per week
Consume 1 - 2 alcoholic drinks per day
Consume 3 or some drinks in one sitting
Have you been exposed to secondhand smoke in the past year?
Yes
No
If you said YES about secondhand smoke, where do you think you are exposed to secondhand smoke
most often?
Home
Workplace
Hospitals
Restaurants
School
Other: ____________________
I am not exposed to secondhand smoke.
Please indicate your status on the following items.
Yes No
Do you smoke?
Do you chew tobacco?
If you said YES to either of the previous items, please indicate your status on the following items.
Yes No
Do you want to stop using tobacco products?
Have you tried to stop in the last year?
Have you tried medication to stop?
Would you attend smoking cessation classes?

Wayne County 2012 Community Health Assessment Page 96
Where would you go for help if you wanted to quit?
Quit Line NC
Doctor
Church
Pharmacy
Private counselor/therapist
Health Department
I don't know
Other: ____________________
Not applicable; I don't want to quit.
Please indicate your status on the following items.
Yes No Not Sure
I use less than 3 prescriptions currently
I use more than 3 prescriptions currently
I am confused about my prescription drugs
I think I may abuse prescription drugs
Do you use illegal drugs?
Never
Occasionally
Routinely
An influenza/flu vaccine can be a "flu shot" injected into your arm or spray like "FluMist" which is
sprayed into your nose. During the past 12 months, have you had a seasonal flu vaccine?
Yes, flu shot
Yes, flu spray
Yes, both
No

Wayne County 2012 Community Health Assessment Page 97
Part 5: Access to Care/Family Health
Where do you go when you are sick? (Please select all that apply)
Health Department
SJAFB
Private physician office
Private dentist office
WATCH van
WATCH clinic at YMCA
Hospital Emergency Dept.
Goshen Medical Clinic
Urgent Care Center
Provider outside Wayne County
Other, please specify: ____________________
Is your primary health care provider outside of Wayne County?
Yes
No
If you said YES above, please indicate the reasons why your primary health provider is located outside
of Wayne County. (Please select all that apply)
Specialty not available in Wayne County
History with provider
Cannot get appointment in Wayne County
Reputation of provider
Other, please specify: ____________________
If your provider is outside of Wayne County, in which county is your primary health care provider
located?
Pitt County
Wake County
Other, please specify: ____________________

Wayne County 2012 Community Health Assessment Page 98
When was your last visit to a doctor?
Less than 1 year ago
1 - 2 years ago
2 - 3 years ago
3 or more years ago
What is your primary health insurance plan? This is the plan which pays the medical bills first or pays
most of the medical bills.
State Employee Health Plan
Blue Cross and Blue Shield of North Carolina
Other private health insurance plan purchased from employer or workplace
Other private health insurance plan purchased directly from an insurance company
Medicare
Medicaid or Carolina ACCESS or Health Choice 55
The military, Tricare, CHAMPUS or the VA
The Indian Health Service
Other (government plan)
No health plan of any kind
In your opinion, is your employer provided medical health insurance affordable?
Yes
No
N/A

Wayne County 2012 Community Health Assessment Page 99
In the past 12 months, did you have a problem getting the health care you needed for you personally
or for a family member from any type of health care provider, dentist, pharmacy or other facility?
Yes
No
If you had trouble getting the care you needed, what type of provider or facility did you or your family
member have trouble getting health care from? Please choose all that apply and write in any that are
not listed here.
Dentist
General practitioner
Eye care/optometrist/ophthalmologist
Pharmacy/prescriptions
Pediatrician
OB/GYN
Health department
Hospital
Urgent Care Center
Medical Clinic
Specialist: ____________________
Specialist: ____________________
If you had a problem, which of these problems prevented you or your family member from getting the
necessary health care? Please choose all that apply and write in any that are not listed here.
No health insurance.
Insurance didn't cover what I/we needed.
My/our share of the cost (deductible/co-pay) was too high.
Doctor would not take my/our insurance or Medicaid.
Hospital would not take my/our insurance.
Pharmacy would not take my/our insurance or Medicaid.
Dentist would not take my/our insurance or Medicaid.
No way to get there.
Didn't know where to go.
Couldn't get an appointment.
The wait was too long.
Other: ____________________

Wayne County 2012 Community Health Assessment Page 100
If a friend or family member needed counseling for a mental health or a drug/alcohol abuse problem,
who is the first person you would tell them to talk to?
Private counselor or therapist
Support group (e.g., AA, Al-Anon)
School counselor
Doctor
Minister/religious official
Other: ____________________
Don't Know
Please indicate which of the following dental care facilities that you routinely visit. (Please select all
that apply)
Health Department
Private dentist
Other, please specify: ____________________
What is your dental health insurance status?
TRICARE (Military)
Medicaid
Other insurance, please specify: ____________________
No insurance
Is dental health insurance available by your employer?
Yes
No
If it is available, in your opinion, is your employer provided dental health insurance affordable?
Yes
No
Was there a teenage pregnancy in your home in 2011?
Yes
No

Wayne County 2012 Community Health Assessment Page 101
If there was a teenage pregnancy in your home in 2011, please indicate the status of the pregnant
teenager in your home regarding the following items. Did she...
Yes No
Receive sufficient education about prevention?
Receive prenatal care in the 1st trimester?
Take parenting classes?
Complete high school?
If there was a teenage pregnancy, where did she receive your prenatal care in the 1st trimester?
(Please choose all that apply)
Health Department
Private obstetrician
Other, please specify: ____________________
Do you provide care for an elderly person?
Yes
No
If YES, please indicate your level of agreement with the following statements.
Strongly Disagree
Disagree Neutral Agree Strongly
Agree
I have sufficient access to physicians
My adult day care needs are met
There are sufficient resources for caregivers
There are sufficient options for dementia

Wayne County 2012 Community Health Assessment Page 102
Please indicate the importance of the following items.
Not at all Important
Very Unimportant
Neither Important nor Unimportant
Very Important Extremely Important
Individuals take more personal responsibility for
their health
Hospitals recruit more health providers
Government provide more exercise facilities
Restaurants provide more healthy choices
Schools provide more health education
Churches take active role in promoting health
Employers take active role in promoting health

Wayne County 2012 Community Health Assessment Page 103
Part 6: Emergency Preparedness
Does your household have working smoke and carbon monoxide detectors?
Yes, smoke detectors only
Yes, carbon monoxide detectors only
Yes, both
No
Don't know/not sure
Does your family have a basic emergency supply kit? (This kit includes water, non-perishable food,
any necessary prescriptions, first aid supplies, flashlight and batteries, non-electric can opener,
blanket, etc.)
Yes
No
If YES, how many days do you have supplies for?
Write in the number of days _____________

Wayne County 2012 Community Health Assessment Page 104
What would be your main way of getting information from authorities in a large-scale disaster or
emergency?
Television
Radio
Internet
Print media (ex: newspaper)
Social networking site
Neighbors
Text message (emergency alert system)
Other, please describe: ____________________
If public authorities announced a mandatory evacuation from your neighborhood or community due
to a large-scale disaster or emergency, would you evacuate?
Yes
No
Don't know/not sure
If NO or NOT SURE, what would be the main reason you might not evacuate if asked to do so?
Lack of transportation
Lack of trust in public officials
Concern about leaving property behind
Concern about personal safety
Concern about family safety
Concern about leaving pets
Concern about traffic jams and inability to get out
Health problems (could not be moved)
Other, please describe: ____________________
Are you or anyone in your household current in CPR?
Yes
No
Do all responsible family members know when and how to turn off all utilities to the house?
Yes
No

Wayne County 2012 Community Health Assessment Page 105
Do you know what the disaster plan is for the following areas? your workplace? For your children’s
school and/or daycare center?
Yes No Not Sure
Your workplace
Your child's school
Your child's daycare center
Part 7: Demographic Questions
The next questions are general questions about you, which will only be reported as a summary of all
answers given by survey participants. Your answers will remain anonymous.
How old are you?
15 - 19
20 - 24
25 - 29
30 - 34
35 - 39
40 - 44
45 - 49
50 - 54
55 - 59
60 - 64
65 - 69
70 - 74
75 - 79
80 - 84
85 or older
Are you Male or Female?
Male
Female
Are you of Hispanic, Latino or Spanish origin?
Yes
No

Wayne County 2012 Community Health Assessment Page 106
If you are of Hispanic, Latino or Spanish origin, are you:
Mexican, Mexican American or Chicano
Puerto Rican
Cuban
Other Hispanic or Latino (please specify): ____________________
What is your race? Please check all that apply.
White
Black or African American
American Indian or Alaska Native
Asian Indian
Other Asian including Japanese, Chinese, Korean, Vietnamese and Filipino/a: ___________________
Pacific Islander including Native Hawaiian, Samoan, Guamanian/Chamorro: ____________________
Other race not listed here: ____________________
Do you speak a language other than English at home?
Yes
No
If YES, what language do you speak at home? ___________________________________________
What is your marital status?
Never married/single
Married
Unmarried partner
Divorced
Widowed
Separated
Other
What is the highest level of school, college or vocational training that you have finished?
Less than 9th grade
9 - 12th grade, no diploma
High school graduate (or GED/equivalent)
Associate's degree or vocational training
Some college (no degree)
Bachelor's degree
Graduate or professional degree
Other: ____________________

Wayne County 2012 Community Health Assessment Page 107
What is your combined annual household income?
Less than $10,000
$10,000 to $14,999
$15,000 to $24,999
$25,000 to $34,999
$35,000 to $49,999
$50,000 to $74,999
$75,000 to $99,999
$100,000 or more
How many people does this income support? (If you are paying child support but your child is not
living with you, this still counts as someone living on your income.)
________________________ people
What is your employment status? Please check all that apply.
Employed full-time
Employed part-time
Retired
Armed Forces
Disabled
Student
Homemaker
Self-employed
Unemployed for 1 year or less
Unemployed for more than 1 year
If you chose ARMED FORCES, what is your current Military status?
Active
Retired
Do you have access to the Internet?
Yes
No
Please enter your zip code:
Your 5 digit zip code (home) _____________
Your 5 digit zip code (work) _____________

Wayne County 2012 Community Health Assessment Page 108
What are the best ways to communicate upcoming Wayne County events related to health to you?
(Please select all that apply)
Newspaper
Radio
Church bulletin
TV cable channel 10
Thank you for your participation!

Wayne County 2012 Community Health Assessment Page 109
Appendix B – Focus Group Questions
1. What is the best thing about living in this community?
2. What do people in this community do to stay healthy?
3. How do people get information about health?
4. What are the serious health problems in your community? What are the causes of
these problems?
5. What keeps people in your community from being healthy?
6. What could be done to solve these problems?
7. Is there anyone you know not receiving enough health care? If so, why?

Wayne County 2012 Community Health Assessment Page 110
Appendix C – Community Context
Access to Healthcare
Hospital emergency visits are an extremely expensive alternative to a visit compared to a doctor’s office, or even an urgent care center, due to the expensive equipment and services required to support true emergencies (such as MRI, CT, pharmacy and 24-hour coverage). The incentive for some patients to use Emergency Departments (without an emergency) is the obligation of the hospital, under federal law, to triage a patient, without regard to payment status. At Wayne Memorial, about 25 percent of all charges in the Emergency department are incurred without any payment source. The WATCH mobile van and office at the Goldsboro YMCA provide a low-cost (no charge) venue for some uninsured patients to visit, which keeps even higher numbers of ED visits from occurring, and provides continuity of care to patients. Ideally, more doctors’ offices would have late hours, and provide a lower-cost alternative to ED visits, similar to the extended evening and weekend hours provided by Goldsboro Pediatrics at their offices around the county.
The WATCH Healthcare Program provides a medical home to the uninsured
population of Wayne County. The WATCH mobile unit travels to predetermined locations throughout the county on a monthly basis to provide continuity of care. A second clinic, which is stationary, is located at the Goldsboro Family YMCA. WATCH is open one Saturday each month because 50 percent of their patient population is employed and this offers these patients an alternative to missing work hours for healthcare provision. WATCH provides free acute and primary healthcare to the uninsured. Free labs are provided by Quest Diagnostics and they value +$445,000 each year. Qualified patients with chronic diseases are enrolled in the prescription assistance program which provides in excess of $2 million in free medications annually. Health education and an obesity program are offered to patients as indicated. The WATCH Healthcare Program keeps even higher numbers of ED visits from occurring, and provides continuity of care to patients. Ideally, more doctors' offices would have late hours, and provide a lower-cost alternative to ED visits, similar to the extended evening and weekend hours provided by Goldsboro Pediatrics at their offices around the county. WATCH employs a professional clinical team at each site which includes a family nurse practitioner, medical assistant and medical office assistant. WATCH also utilizes volunteer physicians from the community for specialty clinics. Referrals are made for patients with advanced disease states (i.e. cancer). In 2012, Wayne Memorial's Emergency Department provided more than 60,000 visits, and WATCH provided 10,000 visits. While it is difficult to measure the impact of WATCH on disease rates, the downward direction of smoking and heart disease in Wayne County (through increased access to providers and health education) may be partly attributable to efforts in this arena since 2000.
Another location where patients under 18 (not included in the survey) receive care is through a partnership between the State of North Carolina, the Wayne County school

Wayne County 2012 Community Health Assessment Page 111
system, Goldsboro Pediatrics (which provides access to their electronic medical records) and Wayne Memorial Hospital. Wayne County Public Schools employs school nurses through Wayne Memorial Hospital, which provides employee benefits, including continuing education and supervision. There are a total of 19 full time school nurses. Two of these school nurses serve Edgewood Developmental School full time and the others cover several schools. Ten school nurses are funded by the State of North Carolina, five of which are through the School Nurse Funding Initiative. Five are Child and Family Support Team (CFST) Nurses. The CFST Nurses are teamed with Social Workers to identify students at risk of academic failure and out of home placement. Each team serves one school. The remaining schools have a school nurse available to provide services to students up to three days per week. All school nurses must become nationally certified within three years of employment. The school nurses will assess any student for any reason free of charge and without an appointment. The program’s main purpose is to ensure that students with health problems are able to attend school and that staff members are able to safely manage their care. In addition to student assessment, school nurses provide a variety of trainings for employees including medication, blood borne pathogen, CPR/First Aid and diabetes trainings. Asthma is the most frequent health problem of students; however, the number of students with diabetes and other chronic health conditions requiring invasive procedures (ex. EpiPens, tube feedings, catheterizations, injections) increases each school year.
WISH is a more intensive school-based health clinic started in 1997 to address five specific health problems; asthma, mental health, lack of well care/ dental care, teen pregnancy and attention deficit disorders. WISH, with parental permission, provides easy access for children to a medical provider who is a physician extender (can prescribe medications, etc). WISH centers are based in four middle schools: Goldsboro Intermediate, Mt. Olive Middle, Brogden Middle, Dillard Middle, and two high schools: Goldsboro High School and Southern Wayne High School. The rate of emergency room visits and the number of school suspensions have declined in the schools housing WISH centers. Each center has a part time mid-level provider (PA or FNP) and a full time RN. The Health Department contributes registered dieticians and health educators. Mental health services are provided as needed. The goal of the WISH Health Centers is to help students succeed in school by promoting healthy lifestyles and providing comprehensive health care services.
Despite the statistical shortage of physicians in Wayne County solid, innovative programs like WATCH, WISH and school nursing have provided access to many citizens who otherwise may have fallen through the cracks. There are appointments available for adults who need a primary care physician, and for children who need to be seen by a doctor. In addition, an endocrinologist (a specialist in diabetes treatment) is accepting new patients. The hospital has also opened an outpatient wound care center, staffed by a full-time doctor, to help with healing of diabetic sores, preventing amputations. Routine care is the key to healing diabetic wounds.

Wayne County 2012 Community Health Assessment Page 112
Crime
City, police, community target crime By John Joyce Published in News Argus on December 9, 2012 1:50 AM (direct excerpts) The Goldsboro Police Department and the city of Goldsboro are uniting with the community in a program they hope will significantly reduce violent crime in and around the city. Police hope those who attended an organizational meeting Thursday will choose to become part of Goldsboro Partners Against Crime -- an initiative designed to engage the citizenry in not only catching criminals, but encouraging them to change their lives. GPAC will work with police, members of the judicial system and the city administration to target violent offenders in the city and engage them in efforts to deter them from continuing in a life of crime. Their methods will include individually targeted investigations, pressure from within their own neighborhoods and stiffer prison sentences -- all moves that law enforcement officers hope will compel offenders to either cut out their illicit activities, to take them elsewhere or to suffer the consequences. The number of murders in the city this year, 12, exceeds those in any year so far this millennium. Of those 12, only three remain unsolved. Assaults and armed robberies, sexual assaults and breaking and entering reports have escalated as well.

Wayne County 2012 Community Health Assessment Page 113
Natural Recreation
Herman Park, the city’s oldest park (but without any specific exercise trails or equipment) was most often cited as a place respondents exercised (6%), followed by Stoney Creek Park (5%), Cliffs of the Neuse State Park (3%), and Waynesborough Park Trails (1%). Stoney Creek Park was developed over the last several years, as a result of a joint venture between WATCH and the City of Goldsboro with funds from the North Carolina Trails Program. The 32-acre park includes improvements to Stoney Creek itself, a disk golf course which is attracting state-wide attention, and a dogpark to encourage outside play. A trail along Stoney Creek is in progress to encourage more walking, running, and biking. The city and volunteers have built a three-mile single-track bicycle trail across Ash Street from Stoney Creek Park, along the greenway, and signage has just been added to increase its visibility; it’s open. More trails are planned in the woods owned by the City in that area, adjacent to the greenway.
In May, 2012, the City of Goldsboro reclassified all city-owned sanitary sewer easements (to protect in case of hurricane/floods) as greenways. The City and Wayne County governments have applied for funds from the North Carolina Trails Program, to complete a paved trail along Stoney Creek through the heart of Goldsboro, eventually linking the Neuse River with Wayne Community College. In addition, the State has included Wayne County in its plan for the North Carolina Mountains-to-Sea Trail, which will connect the western border of North Carolina at Clingman’s Dome to Jockey’s Ridge on the Outer Banks. Both a paddling trail (which exists in the Neuse River) and pedestrian and biking trails are being considered along the Neuse River which would connect the Cliffs of the Neuse State Park, 892 acres, featuring a unique geological cliff in an otherwise fairly flat part of eastern NC, with Goldsboro, Smithfield and Kinston.

Wayne County 2012 Community Health Assessment Page 114
Tobacco Use
Survey respondents said they do not smoke (88 percent) or chew tobacco (99
percent) which is likely not representative of Wayne County’s greater population. Smoking by Wayne County residents has, according to the BRFSS in 2011, declined from 28 percent in 2007 to about 22 percent. It is encouraging that more people in Wayne County have quit smoking (28 percent) than are currently smoking (22 percent) and that half never started.
Smoking trends in Wayne County are closer to the average for North Carolina than
ever before, which is surprising, given Wayne County’s historical association with growing tobacco. In 2010, Wayne County was still the fourth largest producer of tobacco with $31 million in receipts (after Sampson, Johnston and Wilson), but was also the 8th largest producer of vegetables and fruits, with $16 million in receipts. In the future, it is possible that vegetables (including sweet potatoes and corn) will overtake tobacco and even more of these locally grown vegetables will become available to local consumers. This may inspire more farm to table opportunities.