chapter 10: substance abuse€¦ · chapter 10: substance abuse . 266 2014-2015 health of boston...
TRANSCRIPT

265
Substance Abuse 2014-2015
Chapter 10: Substance Abuse
266
2014-2015 Health of Boston
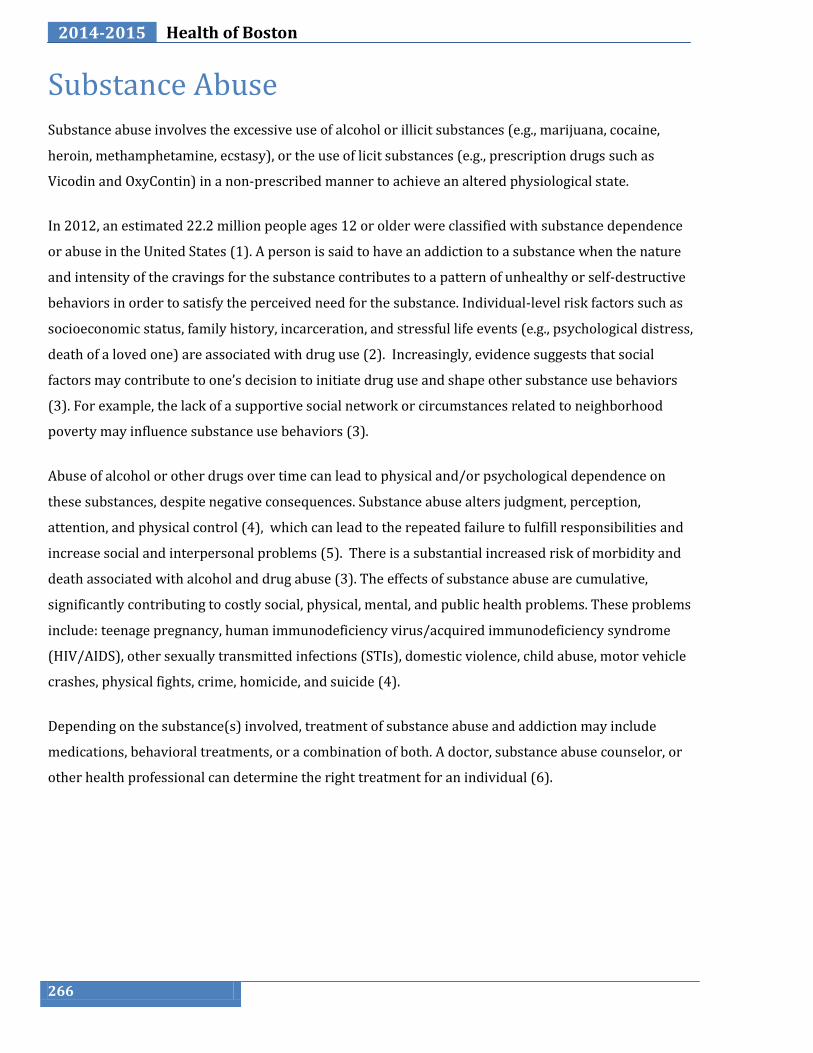
Substance Abuse Substance abuse involves the excessive use of alcohol or illicit substances (e.g., marijuana, cocaine,
heroin, methamphetamine, ecstasy), or the use of licit substances (e.g., prescription drugs such as
Vicodin and OxyContin) in a non-prescribed manner to achieve an altered physiological state.
In 2012, an estimated 22.2 million people ages 12 or older were classified with substance dependence
or abuse in the United States (1). A person is said to have an addiction to a substance when the nature
and intensity of the cravings for the substance contributes to a pattern of unhealthy or self-destructive
behaviors in order to satisfy the perceived need for the substance. Individual-level risk factors such as
socioeconomic status, family history, incarceration, and stressful life events (e.g., psychological distress,
death of a loved one) are associated with drug use (2). Increasingly, evidence suggests that social
factors may contribute to one’s decision to initiate drug use and shape other substance use behaviors
(3). For example, the lack of a supportive social network or circumstances related to neighborhood
poverty may influence substance use behaviors (3).
Abuse of alcohol or other drugs over time can lead to physical and/or psychological dependence on
these substances, despite negative consequences. Substance abuse alters judgment, perception,
attention, and physical control (4), which can lead to the repeated failure to fulfill responsibilities and
increase social and interpersonal problems (5). There is a substantial increased risk of morbidity and
death associated with alcohol and drug abuse (3). The effects of substance abuse are cumulative,
significantly contributing to costly social, physical, mental, and public health problems. These problems
include: teenage pregnancy, human immunodeficiency virus/acquired immunodeficiency syndrome
(HIV/AIDS), other sexually transmitted infections (STIs), domestic violence, child abuse, motor vehicle
crashes, physical fights, crime, homicide, and suicide (4).
Depending on the substance(s) involved, treatment of substance abuse and addiction may include
medications, behavioral treatments, or a combination of both. A doctor, substance abuse counselor, or
other health professional can determine the right treatment for an individual (6).
267
Substance Abuse 2014-2015
Marijuana Cocaine Ecstasy Heroin Steroid Rx
41.9% (37.5-46.3)
3.5% (2.0-5.0)
4.6% (3.3-6.0)
2.8% (1.5-4.1)
3.1% (2.0-4.3)
7.8% (6.0-9.6)
2005 2007 2009 2011 2013
Lifetime Use
39.3% (35.6-43.0)
34.3% (31.1-37.6)
37.7% (33.7-41.6)
40.3% (36.9-43.7)
41.9% (37.6-46.2)
Past 30 Days Use
21.2% (18.8-23.7)
17.4% (15.0-19.8)
21.7% (18.6-24.8)
27.0% (24.1-30.0)
25.6% (22.0-29.2)
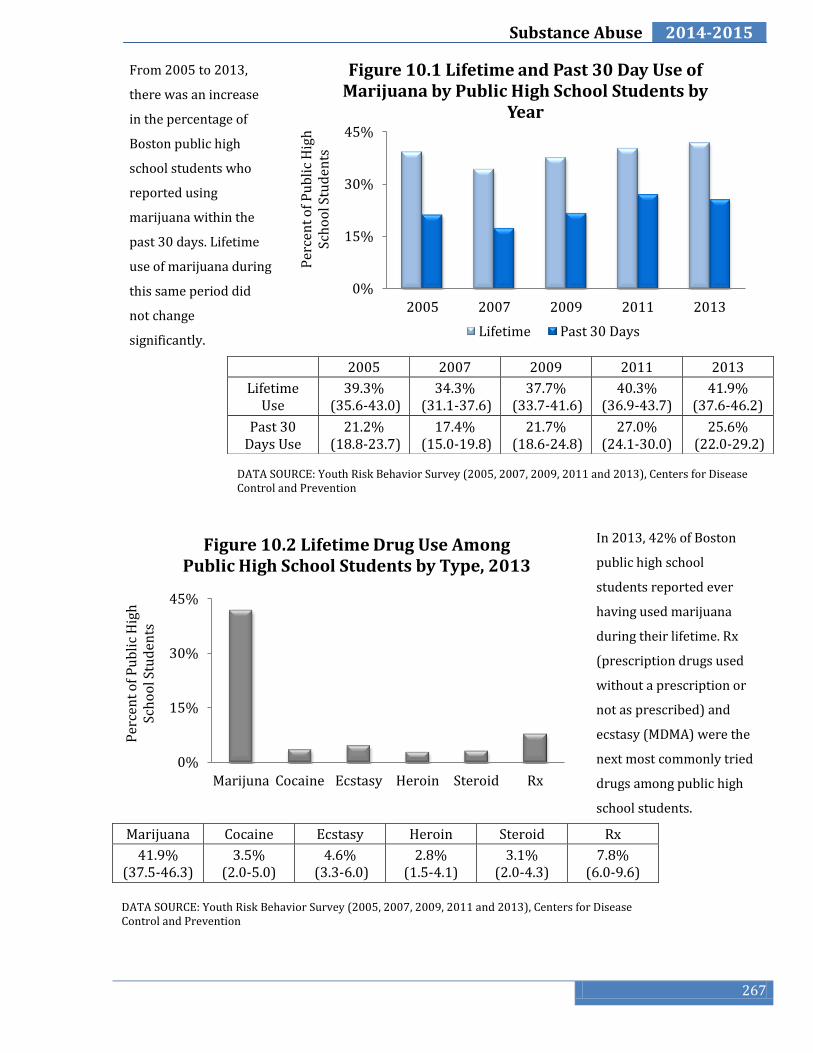
From 2005 to 2013,
there was an increase
in the percentage of
Boston public high
school students who
reported using
marijuana within the
past 30 days. Lifetime
use of marijuana during
this same period did
not change
significantly.
0%
15%
30%
45%
2005 2007 2009 2011 2013 P
erce
nt
of
Pu
bli
c H
igh
Sc
ho
ol S
tud
ents
Figure 10.1 Lifetime and Past 30 Day Use of Marijuana by Public High School Students by
Year
Lifetime Past 30 Days
DATA SOURCE: Youth Risk Behavior Survey (2005, 2007, 2009, 2011 and 2013), Centers for Disease Control and Prevention
0%
15%
30%
45%
Marijuna Cocaine Ecstasy Heroin Steroid Rx
Per
cen
t o
f P
ub
lic
Hig
h
Sch
oo
l Stu
den
ts
Figure 10.2 Lifetime Drug Use Among Public High School Students by Type, 2013
DATA SOURCE: Youth Risk Behavior Survey (2005, 2007, 2009, 2011 and 2013), Centers for Disease Control and Prevention
In 2013, 42% of Boston
public high school
students reported ever
having used marijuana
during their lifetime. Rx
(prescription drugs used
without a prescription or
not as prescribed) and
ecstasy (MDMA) were the
next most commonly tried
drugs among public high
school students.
268
2014-2015 Health of Boston
31.2 31.8
29.5 28.9 28.3
15.3 15.7 14.3 14.2 13.8
0
10
20
30
40
2009 2010 2011 2012 2013
Ad
mis
sio
ns
per
1,0
00
R
esid
ents
Age
s 1
2+
Figure 10.3 Treatment Admissions by Year*
All Admissions Unique Persons
*Age-adjusted rates DATA SOURCE: Bureau of Substance Abuse Services, Massachusetts Department of Public Health
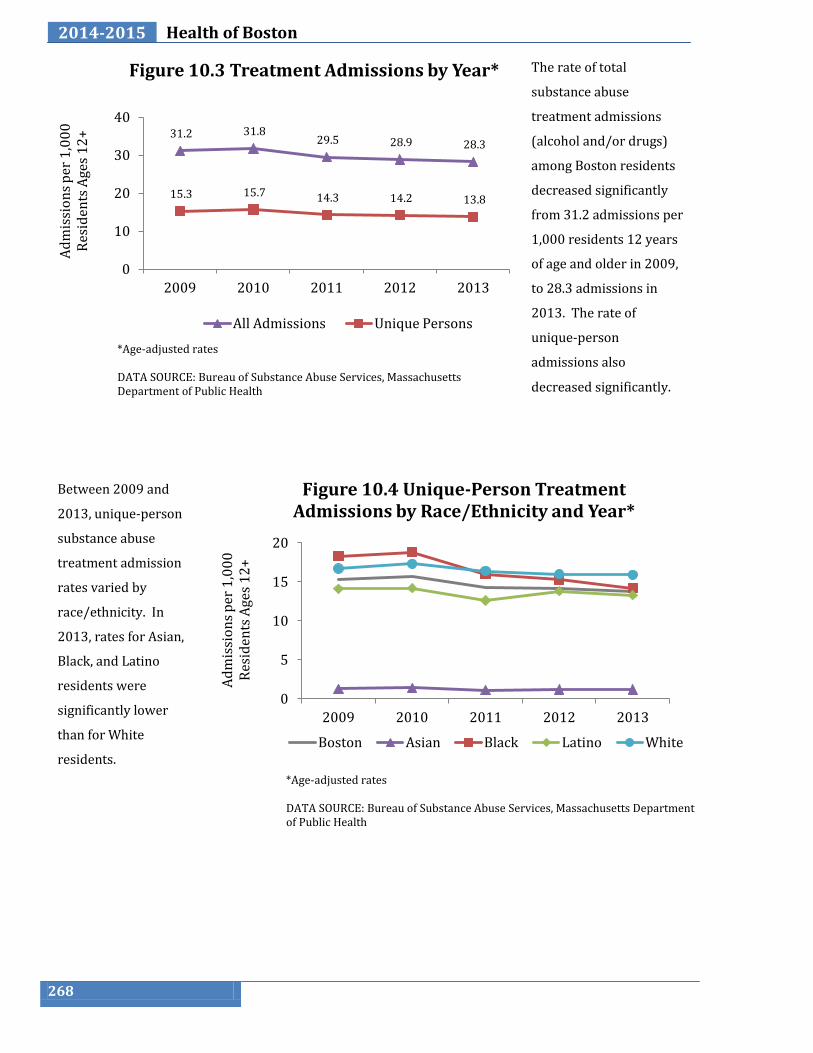
The rate of total
substance abuse
treatment admissions
(alcohol and/or drugs)
among Boston residents
decreased significantly
from 31.2 admissions per
1,000 residents 12 years
of age and older in 2009,
to 28.3 admissions in
2013. The rate of
unique-person
admissions also
decreased significantly.
*Age-adjusted rates DATA SOURCE: Bureau of Substance Abuse Services, Massachusetts Department of Public Health
Between 2009 and
2013, unique-person
substance abuse
treatment admission
rates varied by
race/ethnicity. In
2013, rates for Asian,
Black, and Latino
residents were
significantly lower
than for White
residents.
0
5
10
15
20
2009 2010 2011 2012 2013
Ad
mis
sio
ns
per
1,0
00
R
esid
ents
Age
s 1
2+
Figure 10.4 Unique-Person Treatment Admissions by Race/Ethnicity and Year*
Boston Asian Black Latino White
269
Substance Abuse 2014-2015
0
4
8
12
2009 2010 2011 2012 2013
Ad
mis
sio
ns
per
1,0
00
R
esid
ents
Age
s 1
2+
Figure 10.5 Unique-Person Treatment Admissions* by Drug† and Year
Heroin Cocaine Rx Alcohol Marijuana
*Age-adjusted rates †Self-identified as primary, secondary, or tertiary drug of abuse. DATA SOURCE: Bureau of Substance Abuse Services, Massachusetts Department of Public Health
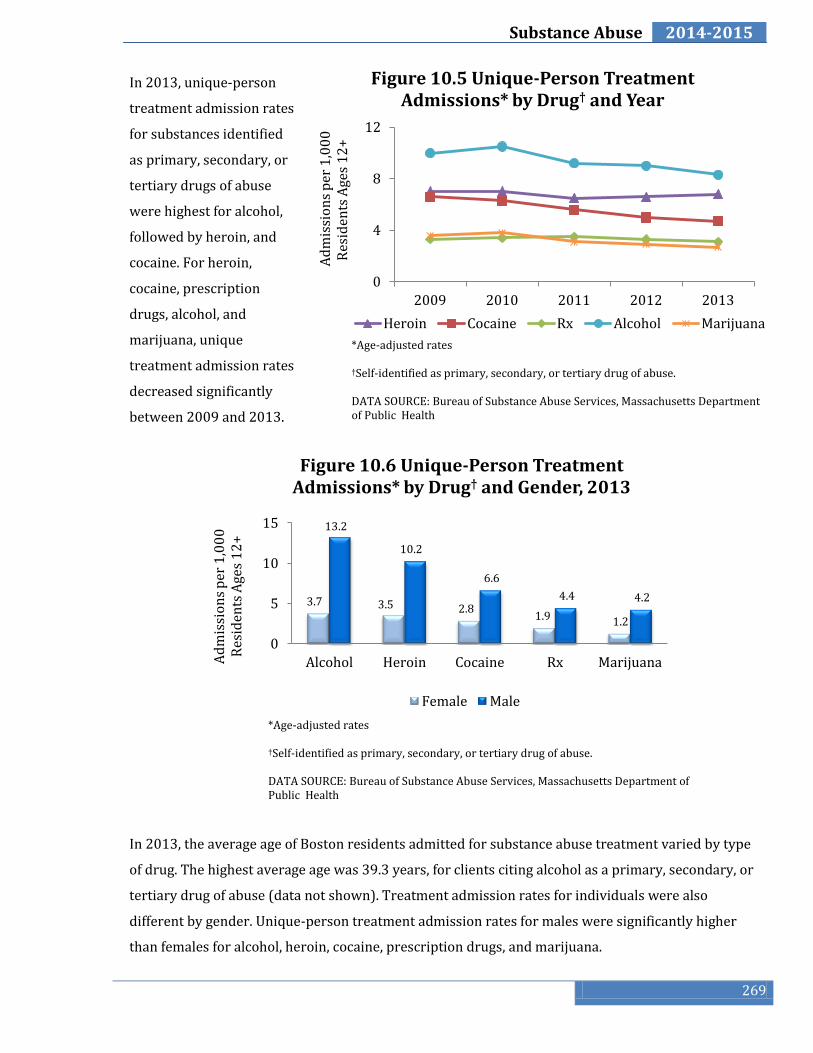
In 2013, unique-person
treatment admission rates
for substances identified
as primary, secondary, or
tertiary drugs of abuse
were highest for alcohol,
followed by heroin, and
cocaine. For heroin,
cocaine, prescription
drugs, alcohol, and
marijuana, unique
treatment admission rates
decreased significantly
between 2009 and 2013.
3.7 3.5 2.8 1.9 1.2
13.2
10.2
6.6
4.4 4.2
0
5
10
15
Alcohol Heroin Cocaine Rx Marijuana Ad
mis
sio
ns
per
1,0
00
R
esid
ents
Age
s 1
2+
Figure 10.6 Unique-Person Treatment Admissions* by Drug† and Gender, 2013
Female Male
*Age-adjusted rates
†Self-identified as primary, secondary, or tertiary drug of abuse. DATA SOURCE: Bureau of Substance Abuse Services, Massachusetts Department of Public Health
In 2013, the average age of Boston residents admitted for substance abuse treatment varied by type
of drug. The highest average age was 39.3 years, for clients citing alcohol as a primary, secondary, or
tertiary drug of abuse (data not shown). Treatment admission rates for individuals were also
different by gender. Unique-person treatment admission rates for males were significantly higher
than females for alcohol, heroin, cocaine, prescription drugs, and marijuana.
270
2014-2015 Health of Boston
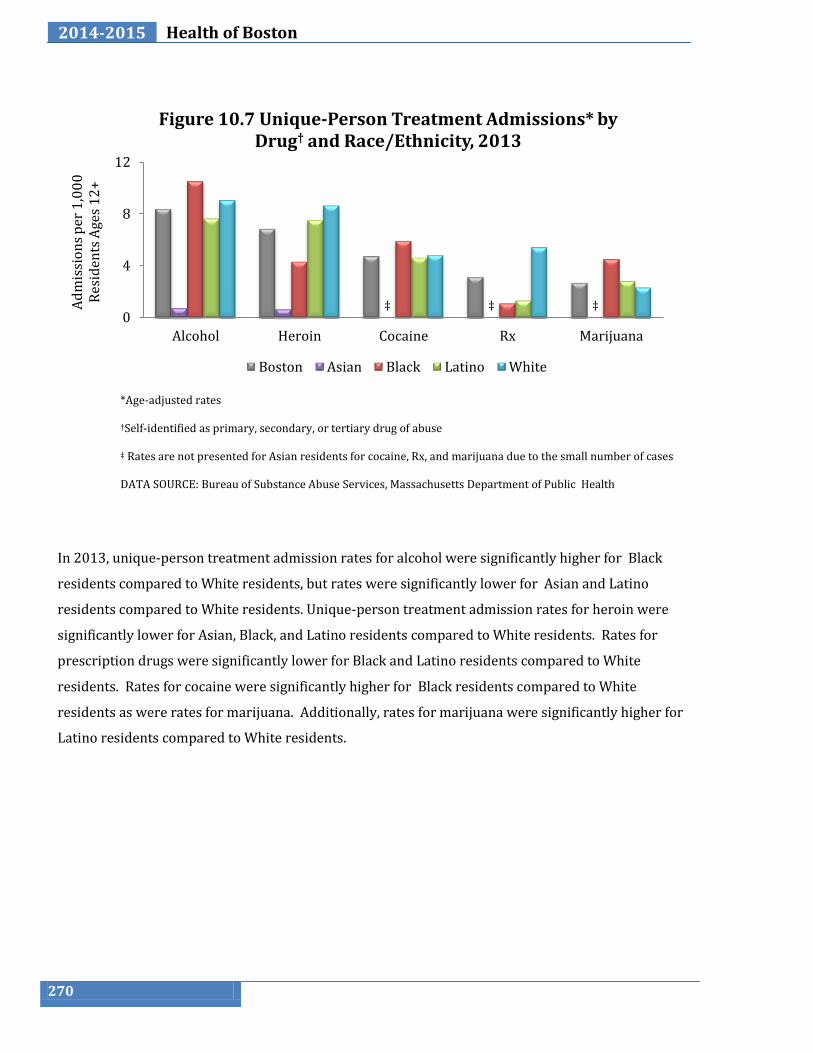
*Age-adjusted rates †Self-identified as primary, secondary, or tertiary drug of abuse ‡ Rates are not presented for Asian residents for cocaine, Rx, and marijuana due to the small number of cases DATA SOURCE: Bureau of Substance Abuse Services, Massachusetts Department of Public Health
In 2013, unique-person treatment admission rates for alcohol were significantly higher for Black
residents compared to White residents, but rates were significantly lower for Asian and Latino
residents compared to White residents. Unique-person treatment admission rates for heroin were
significantly lower for Asian, Black, and Latino residents compared to White residents. Rates for
prescription drugs were significantly lower for Black and Latino residents compared to White
residents. Rates for cocaine were significantly higher for Black residents compared to White
residents as were rates for marijuana. Additionally, rates for marijuana were significantly higher for
Latino residents compared to White residents.
‡ ‡ ‡ 0
4
8
12
Alcohol Heroin Cocaine Rx Marijuana
Ad
mis
sio
ns
per
1,0
00
R
esid
ents
Age
s 1
2+
Figure 10.7 Unique-Person Treatment Admissions* by Drug† and Race/Ethnicity, 2013
Boston Asian Black Latino White
271
Substance Abuse 2014-2015
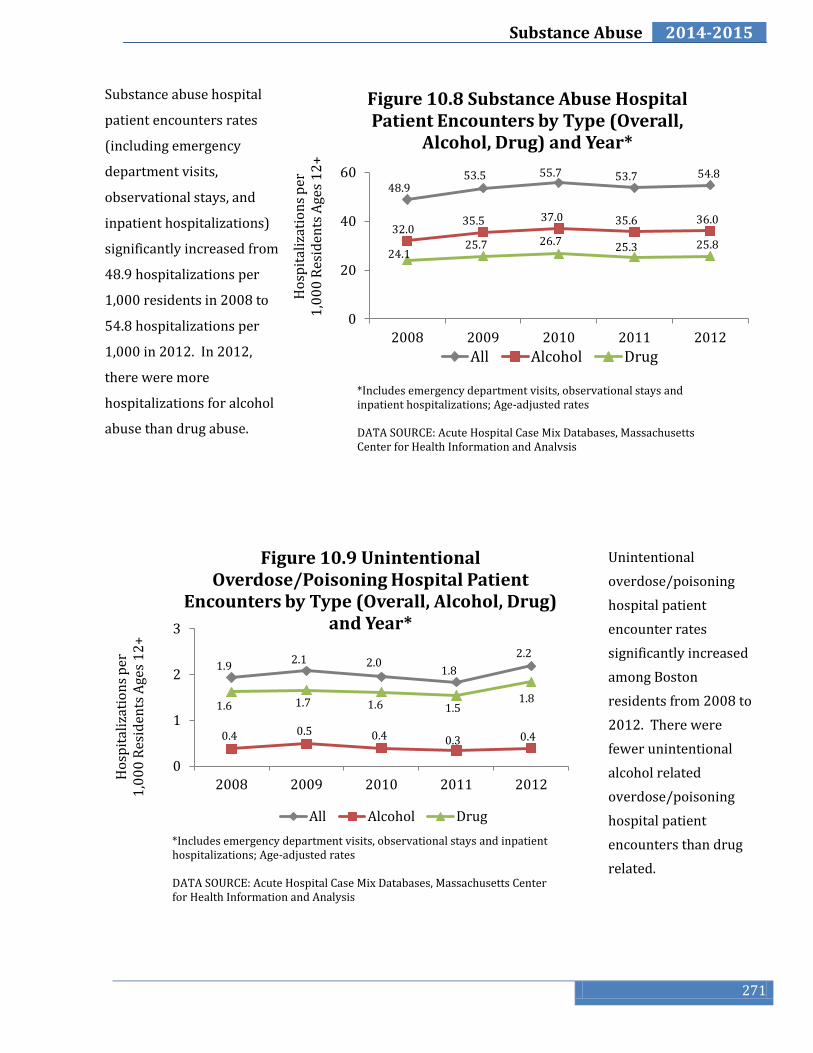
*Includes emergency department visits, observational stays and inpatient hospitalizations; Age-adjusted rates DATA SOURCE: Acute Hospital Case Mix Databases, Massachusetts Center for Health Information and Analysis
Substance abuse hospital
patient encounters rates
(including emergency
department visits,
observational stays, and
inpatient hospitalizations)
significantly increased from
48.9 hospitalizations per
1,000 residents in 2008 to
54.8 hospitalizations per
1,000 in 2012. In 2012,
there were more
hospitalizations for alcohol
abuse than drug abuse.
Unintentional
overdose/poisoning
hospital patient
encounter rates
significantly increased
among Boston
residents from 2008 to
2012. There were
fewer unintentional
alcohol related
overdose/poisoning
hospital patient
encounters than drug
related.
48.9 53.5 55.7 53.7 54.8
32.0 35.5 37.0 35.6 36.0
24.1 25.7 26.7
25.3 25.8
0
20
40
60
2008 2009 2010 2011 2012
Ho
spit
aliz
atio
ns
per
1
,00
0 R
esid
ents
Age
s 1
2+
Figure 10.8 Substance Abuse Hospital Patient Encounters by Type (Overall,
Alcohol, Drug) and Year*
All Alcohol Drug
*Includes emergency department visits, observational stays and inpatient hospitalizations; Age-adjusted rates DATA SOURCE: Acute Hospital Case Mix Databases, Massachusetts Center for Health Information and Analysis
1.9 2.1 2.0
1.8
2.2
0.4 0.5 0.4 0.3 0.4
1.6 1.7 1.6 1.5 1.8
0
1
2
3
2008 2009 2010 2011 2012
Ho
spit
aliz
atio
ns
per
1
,00
0 R
esid
ents
Age
s 1
2+
Figure 10.9 Unintentional Overdose/Poisoning Hospital Patient
Encounters by Type (Overall, Alcohol, Drug) and Year*
All Alcohol Drug
272
2014-2015 Health of Boston
1.1
0.4 0.3
† † †
0.8
0.3
0.8 0.8
0.4 0.2
1.6
0.6
0.2
0
1
2
Opioids (incl. Heroin) Benzodiazepines Cocaine
Ho
spit
aliz
atio
ns
per
1
,00
0 R
esid
ents
Age
s 1
2+
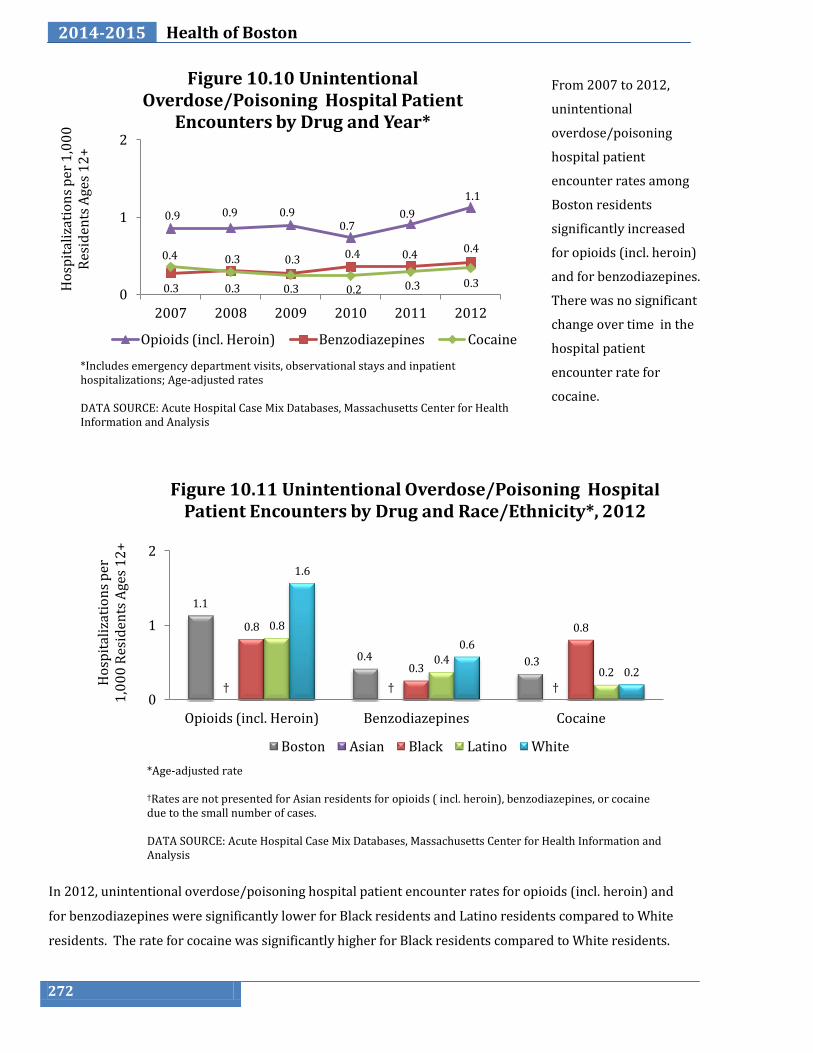
Figure 10.11 Unintentional Overdose/Poisoning Hospital Patient Encounters by Drug and Race/Ethnicity*, 2012
Boston Asian Black Latino White
0.9 0.9 0.9 0.7
0.9
1.1
0.3
0.3 0.3 0.4 0.4 0.4
0.4
0.3 0.3 0.2 0.3 0.3 0
1
2
2007 2008 2009 2010 2011 2012
Ho
spit
aliz
atio
ns
per
1,0
00
R
esid
ents
Age
s 1
2+
Figure 10.10 Unintentional
Overdose/Poisoning Hospital Patient Encounters by Drug and Year*
Opioids (incl. Heroin) Benzodiazepines Cocaine
From 2007 to 2012,
unintentional
overdose/poisoning
hospital patient
encounter rates among
Boston residents
significantly increased
for opioids (incl. heroin)
and for benzodiazepines.
There was no significant
change over time in the
hospital patient
encounter rate for
cocaine.
*Includes emergency department visits, observational stays and inpatient hospitalizations; Age-adjusted rates DATA SOURCE: Acute Hospital Case Mix Databases, Massachusetts Center for Health Information and Analysis
*Age-adjusted rate
†Rates are not presented for Asian residents for opioids ( incl. heroin), benzodiazepines, or cocaine due to the small number of cases. DATA SOURCE: Acute Hospital Case Mix Databases, Massachusetts Center for Health Information and Analysis
In 2012, unintentional overdose/poisoning hospital patient encounter rates for opioids (incl. heroin) and
for benzodiazepines were significantly lower for Black residents and Latino residents compared to White
residents. The rate for cocaine was significantly higher for Black residents compared to White residents.
.
.
273
Substance Abuse 2014-2015
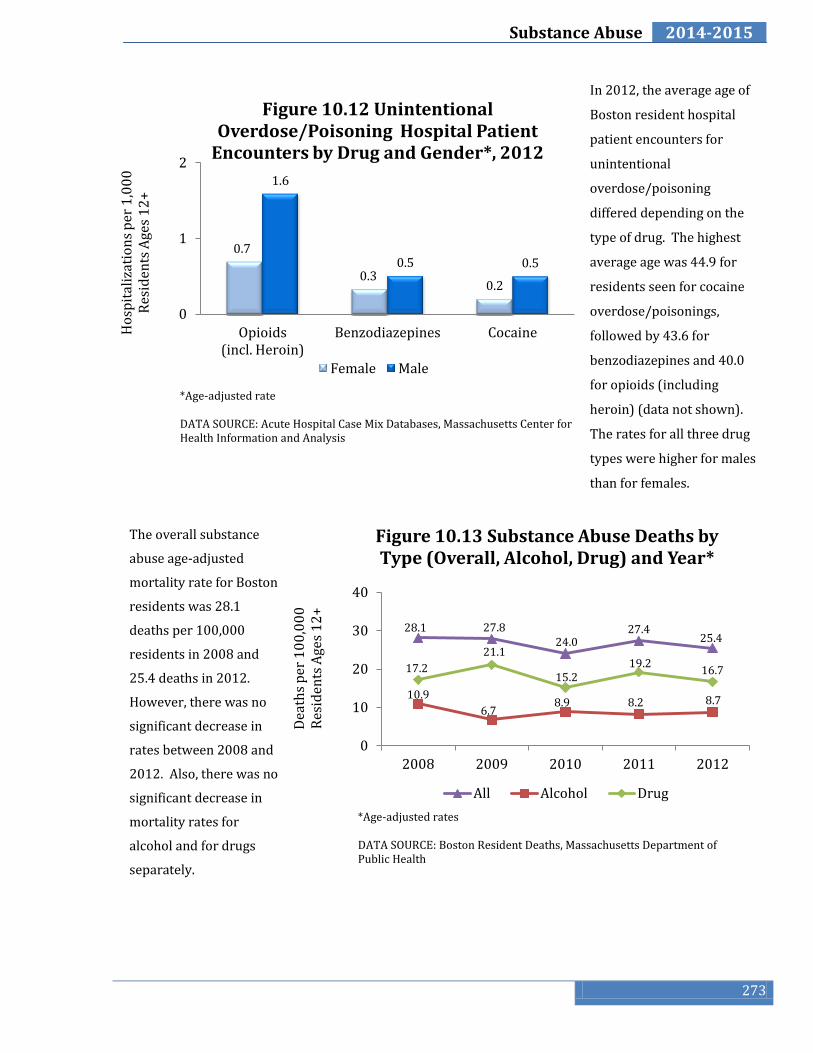
*Age-adjusted rate DATA SOURCE: Acute Hospital Case Mix Databases, Massachusetts Center for Health Information and Analysis
*Age-adjusted rates DATA SOURCE: Boston Resident Deaths, Massachusetts Department of Public Health
The overall substance
abuse age-adjusted
mortality rate for Boston
residents was 28.1
deaths per 100,000
residents in 2008 and
25.4 deaths in 2012.
However, there was no
significant decrease in
rates between 2008 and
2012. Also, there was no
significant decrease in
mortality rates for
alcohol and for drugs
separately.
0.7
0.3 0.2
1.6
0.5 0.5
0
1
2
Opioids (incl. Heroin)
Benzodiazepines Cocaine Ho
spit
aliz
atio
ns
per
1,0
00
R
esid
ents
Age
s 1
2+
Figure 10.12 Unintentional Overdose/Poisoning Hospital Patient
Encounters by Drug and Gender*, 2012
Female Male
In 2012, the average age of
Boston resident hospital
patient encounters for
unintentional
overdose/poisoning
differed depending on the
type of drug. The highest
average age was 44.9 for
residents seen for cocaine
overdose/poisonings,
followed by 43.6 for
benzodiazepines and 40.0
for opioids (including
heroin) (data not shown).
The rates for all three drug
types were higher for males
than for females.
28.1 27.8 24.0
27.4 25.4
10.9
6.7 8.9 8.2 8.7
17.2
21.1
15.2 19.2
16.7
0
10
20
30
40
2008 2009 2010 2011 2012
Dea
ths
per
10
0,0
00
R
esid
ents
Age
s 1
2+
Figure 10.13 Substance Abuse Deaths by Type (Overall, Alcohol, Drug) and Year*
All Alcohol Drug
274
2014-2015 Health of Boston
30.4
37.1
20.4 16.7
18.8 20.6
25.9
10.6 15.2
24.0
35.2
27.3
35.7
44.2
34.1
0
10
20
30
40
50
2008 2009 2010 2011 2012
Dea
ths
per
10
0,0
00
R
esid
ents
Figure 10.14 Substance Abuse Deaths by Race/Ethnicity and Year*
Black Latino White
*Age-adjusted rates per 100,000 residents 12 years of age and older NOTE: Asian residents death rates cannot be presented as the number of deaths for each year was too few to present a rate. DATA SOURCE: Boston Resident Deaths, Massachusetts Department of Public Health
DATA SOURCE: Boston Resident Deaths, Massachusetts Department of Public Health
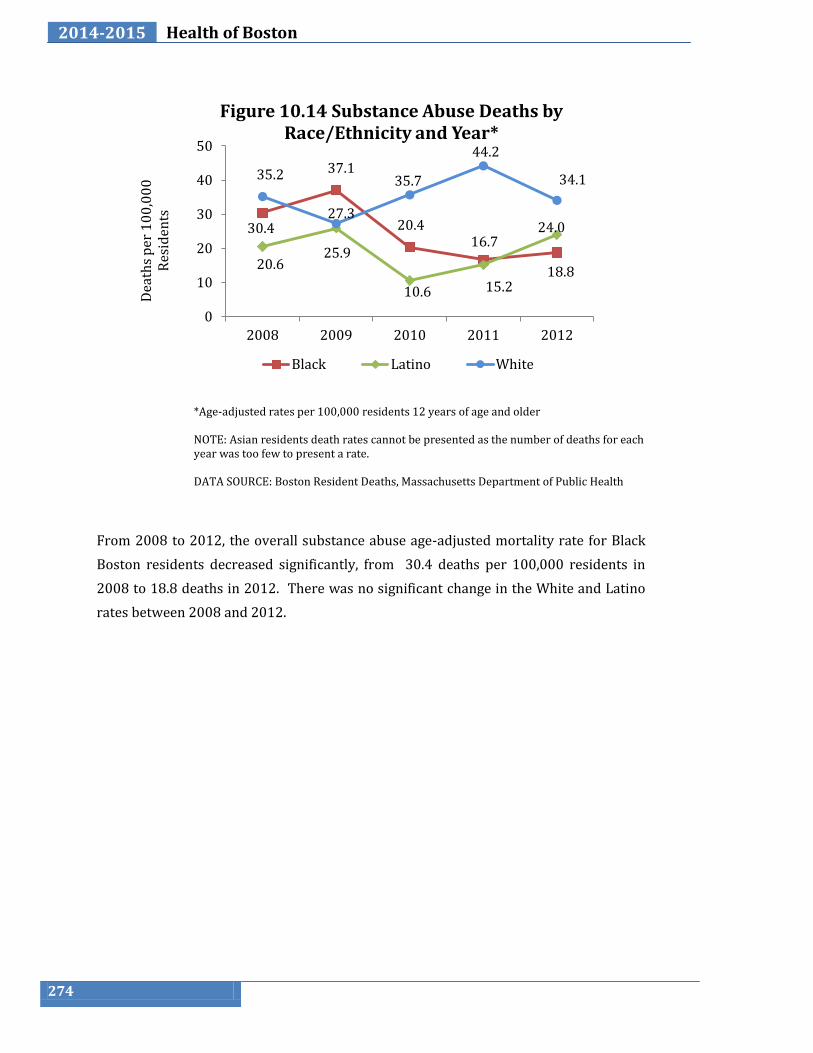
From 2008 to 2012, the overall substance abuse age-adjusted mortality rate for Black
Boston residents decreased significantly, from 30.4 deaths per 100,000 residents in
2008 to 18.8 deaths in 2012. There was no significant change in the White and Latino
rates between 2008 and 2012.
275
Substance Abuse 2014-2015
*Age-adjusted rates DATA SOURCE: Boston Resident Deaths, Massachusetts Department of Public Health
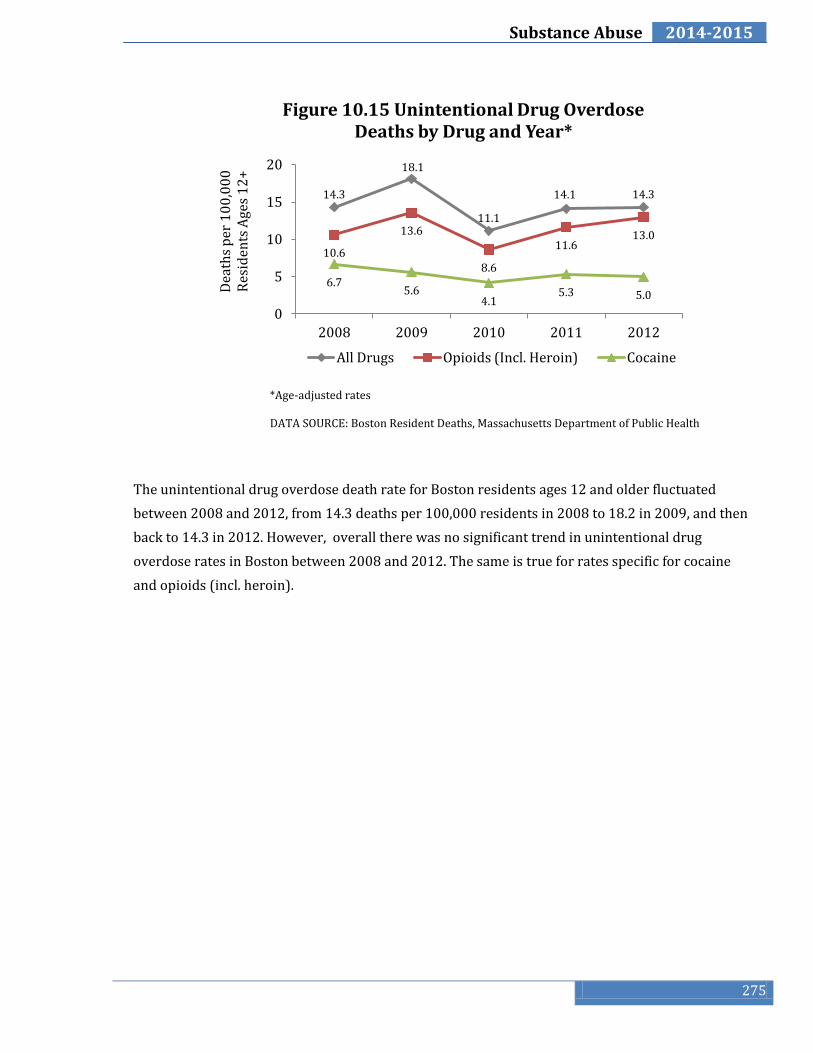
The unintentional drug overdose death rate for Boston residents ages 12 and older fluctuated
between 2008 and 2012, from 14.3 deaths per 100,000 residents in 2008 to 18.2 in 2009, and then
back to 14.3 in 2012. However, overall there was no significant trend in unintentional drug
overdose rates in Boston between 2008 and 2012. The same is true for rates specific for cocaine
and opioids (incl. heroin).
14.3
18.1
11.1
14.1 14.3
10.6
13.6
8.6
11.6 13.0
6.7 5.6
4.1 5.3 5.0
0
5
10
15
20
2008 2009 2010 2011 2012
Dea
ths
per
10
0,0
00
R
esid
ents
Age
s 1
2+
Figure 10.15 Unintentional Drug Overdose Deaths by Drug and Year*
All Drugs Opioids (Incl. Heroin) Cocaine
276
2014-2015 Health of Boston
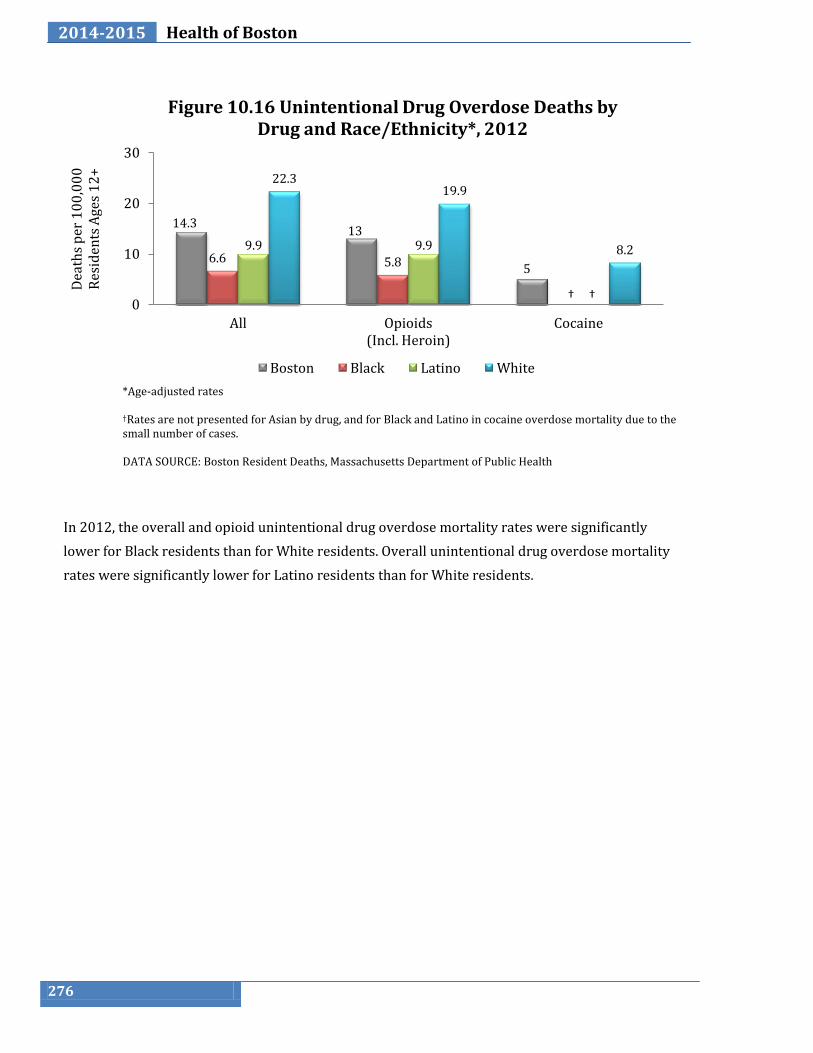
In 2012, the overall and opioid unintentional drug overdose mortality rates were significantly
lower for Black residents than for White residents. Overall unintentional drug overdose mortality
rates were significantly lower for Latino residents than for White residents.
*Age-adjusted rates †Rates are not presented for Asian by drug, and for Black and Latino in cocaine overdose mortality due to the small number of cases. DATA SOURCE: Boston Resident Deaths, Massachusetts Department of Public Health
14.3 13
5 6.6 5.8
†
9.9 9.9
†
22.3 19.9
8.2
0
10
20
30
All Opioids (Incl. Heroin)
Cocaine
Dea
ths
per
10
0,0
00
R
esid
ents
Age
s 1
2+
Figure 10.16 Unintentional Drug Overdose Deaths by
Drug and Race/Ethnicity*, 2012
Boston Black Latino White
277
Substance Abuse 2014-2015
*Age-adjusted rates DATA SOURCE: Boston Resident Deaths, Massachusetts Department of Public Health
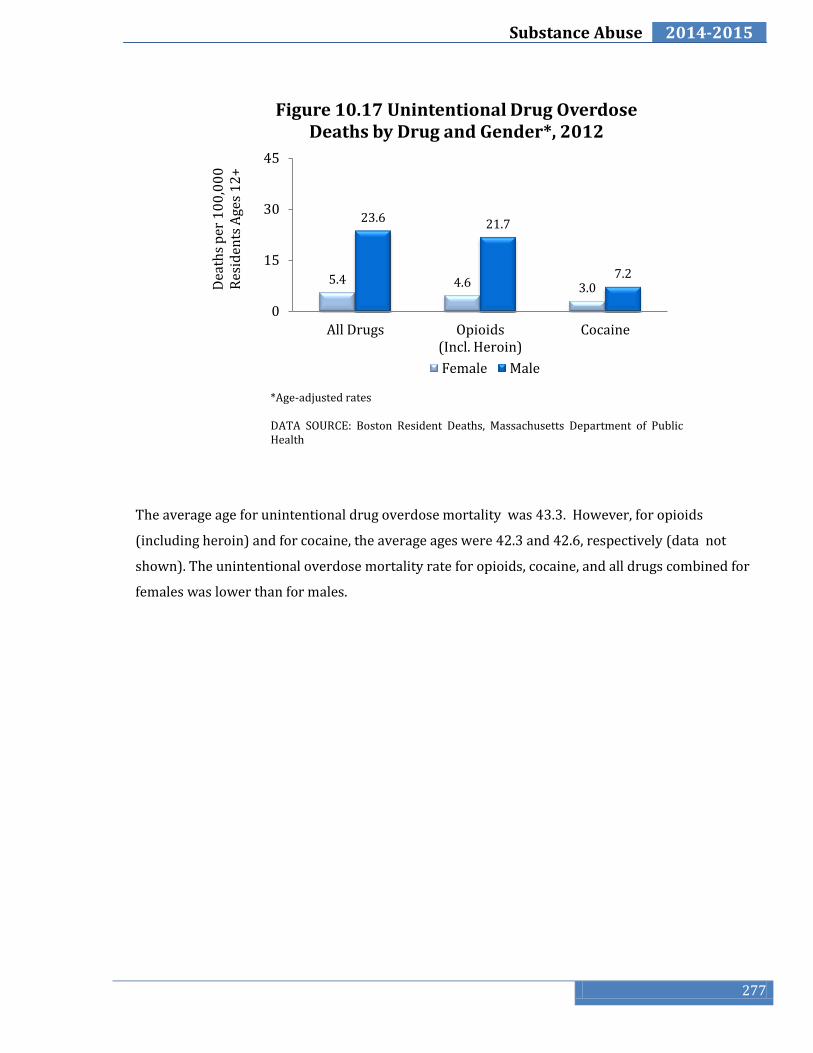
The average age for unintentional drug overdose mortality was 43.3. However, for opioids
(including heroin) and for cocaine, the average ages were 42.3 and 42.6, respectively (data not
shown). The unintentional overdose mortality rate for opioids, cocaine, and all drugs combined for
females was lower than for males.
.
5.4 4.6 3.0
23.6 21.7
7.2
0
15
30
45
All Drugs Opioids (Incl. Heroin)
Cocaine
Dea
ths
per
10
0,0
00
R
esid
ents
Age
s 1
2+
Figure 10.17 Unintentional Drug Overdose Deaths by Drug and Gender*, 2012
Female Male
278
2014-2015 Health of Boston
References
1. Substance Abuse and Mental Health Services . Results from the 2012 National Survey on Drug Use and Health: Summary of National Findings. Rockville : s.n., 2013.
2. Drug Use, Misuse and the Urban Environment. Galea, S., Rudenstine, S. and Vlahov, D. 2, s.l. : Drug and Alcohol Review, 2005, Vol. 24.
3. The Social Epidemiology of Substance Use. Galea, S., Nandi, A. and Vlahov, D. 1, s.l. : Epidemiologic Reviews, 2004, Vol. 26.
4. Center for Substance Abuse Treatment. Substance Abuse Treatment for Persons With Co-Occurring Disorders. Rockville : Substance Abuse and Mental Health Services Administration (US), 2005.
5. WebMD. Substance Abuse. Mental Health Center. [Online] [Cited: January 29, 2014.] http://www.webmd.com/mental-health/substance-abuse.
6. National Institute on Aging. Prescription and Illicit Drug Abuse. [Online] [Cited: January 29, 2014.] http://nihseniorhealth.gov/drugabuse/treatingsubstanceabuse/01.html.