submitted to: perception and psychophysics, february 17 ...bes/bibliography/papers/psychglue.pdf ·...
TRANSCRIPT
Submitted to: Perception and Psychophysics, February 17, 2000.
USE OF INTERREFLECTION AND SHADOW FOR SURFACE CONTACT
Cindee Madison*, William Thompson†, Daniel Kersten*, Peter Shirley† & Brian Smits†
*Department of Psychology, University of Minnesota
†Department of Computer Science, University of Utah
Corresponding Author:
Cindee Madison
University of Minnesota
75 East River Road
Minneapolis, MN 55455
Phone (612) 625-1337
FAX (612) 626-2079
Email [email protected]

2
ABSTRACT
The interaction of light with surfaces results in a number of lighting effects that may
serve as valuable visual cues. Previous research on shadows has shown them to be
effective in determining the 3D layout of a scene, but interreflections have been ignored
as a cue for spatial layout. The addition of interreflection as well as shadows may help to
disambiguate the 3D layout of objects by providing information about object contact with
a surface. We generated computer images of a box on an extended textured ground plane
that was either in contact with the ground or slightly above the ground. Images were
rendered for four conditions: 1) no shadow plus no interreflection, 2) shadow only, 3)
interreflection only, and 4) shadow plus interreflection. A photometrically incorrect
condition was also included. Participants rated the degree of contact for each image on a
scale which was used to generate ROC curves and a measure of sensitivity. In the images
with no shadow or interreflections, the participants performed at chance. Interreflections,
shadows, and a combination of interreflections and shadows all resulted in a high
sensitivity for judging object contact. More importantly information from shadows and
interreflections can be combined to result in near-perfect judgement of surface contact.
Interreflections and shadows can be effective cues for object contact.
Key Words: spatial layout, interreflection, shadow

3
INTRODUCTION
In our everyday experience we interact with objects and need to determine their relative
positions. Determining the spatial relationships between objects in a scene is important
for actions such as path planning, object avoidance, reaching, and grasping. There is a
considerable body of knowledge regarding both quantitative and qualitative perception of
relative depth between objects (Sedgwick, 1986; Cutting & Vishton, 1995). Quantitative
judgments, such as estimation and discrimination, are based on a representation of
distance as a continuous variable. Relative judgments of depth can also be qualitative and
based on a categorical representation of object relations. An object can be inferred to be
“in front of” or “behind” another, without an explicit estimation of metric distance. For
example, when one object occludes another the resultant T-junction is a monocular cue
for a qualitative depth relationship. The focus of this paper is on another useful, but less
studied qualitative judgement, that of deciding whether or not two surfaces are in contact.
Contact is useful for deciding if a region is an object or part of an object, or if an object is
detachable or graspable. Contact information can also be used to support the estimation
of absolute or relative distances both to and between objects. For example, by
determining the contact between an object and a homogeneously textured ground plane
observers can quite accurately judge the distance to the object (Sinai, Ooi & He, 1998).
So what are the cues for contact, and are there any which may be particularly important
for contact judgements as distinct from other judgements of relative spatial relationships?

4
Different pictorial cues can be used for determining contact, primarily by generating
reliable depth judgements to different surfaces. Reliable depth judgements rely on image
measurements that are correlated well with surface features. Image variation associated
with illumination change typically confounds the detection of surface features. Because
illumination effects such as shadows, interreflections, and specularities are highly
variable and not tied unambiguously to object location, these effects of illumination have
historically been considered something to be discounted in studies of shape and depth
perception in both human and computer vision. However, the interaction of light with
objects results in a number of illumination effects, which may be useful cues for surface
attributes and relations. For example, shadows have been found to be useful for
determining spatial layout. In children, shadows have been found to be effective in
influencing depth and height judgements of an object on a plane (Yonas, Goldsmith &
Halstrom, 1978). The displacement between a cast shadow and the casting object in an
image grows with the relative depth between two surfaces (Kersten, Knill, Mamassian
&Bulthoff, 1996; Kersten, Mamassian &Knill, 1997). This displacement measure is
very effective for correctly evaluating the 3D spatial layout of a scene.
(Insert Figure 1 here)

5
Interreflections are a subtle lighting effect that may also provide information for suface
relations. Interreflections are the result of light bouncing between multiple surfaces
(figure 1). They are responsible for illuminating areas that are not directly illuminated by
the light source. Interreflections also add to the color and luminance reflected by areas
receiving both direct and indirect illumination. In trying to create 3D photorealistic
computer images, accounting for interreflections has proven to be very important, and has
lead to radiosity and ray-tracing rendering techniques in computer graphics (Foley,
vanDamme, Feiner & Hughes, 1996).
Interreflections may be important to determining surface contact partially because of their
close relationship to shadows. Though they are the result of light transport as opposed to
light occlusion, Langer has recently described an insightful relation between the two
(Langer, 1999). Consider the intersection of two surfaces. Decreasing the angle between
the surfaces also decreases the likelihood for a randomly placed light source to strike
either of the surfaces; hence the more likely for there to be a shadow. However, as the
angle between the two surfaces decreases, any light source that does enter will result in
more bounces between the surfaces, and hence the more likely for there to be
interreflection. This close relation to shadows, which are effective in relating spatial
layout, suggest interreflections may also be a source of information useful for
determining spatial layout.

6
Interreflections seem to be visually rather subtle. Although shadows can also be subtle
effects, they can be quite sharp and salient, such as on a sunny day. Might the greater
subtlty of interreflections reduce their effectiveness as a contact cue? Gilchrist &
Jacobsen have shown interreflections to be potentially useful (Gilchrist & Jacobsen,
1984). They constructed a world of one reflectance in which observers were able to
distinguish a matte white room from a matte black room, even when they were both
illuminated so as to have the same average luminance values. The difference was the
luminance profile of the room. The matte white room has a higher number of ambient
bounces (interreflections) than the matte black room resulting in flatter profile, while the
matte black room had a more variable profile. Another study showed that the visual
system can discount the effects of interreflection in determining surface color, given 3D
knowledge of the surface arrangement (Bloj, Kersten & Hurlbert, 1999). They created a
colored “mach” card, one side red the other side white. In the concave condition people
were able to discount the pink color-bleeding on the white side which was due to
interreflection, thereby seeing the side as primarily white, but with a tinge of pink. In the
convex condition the pinkish color was not discounted, and the same surface (previously
seen as whitish) was perceived as a magenta-colored, a change in material property. In
computer vision, interreflection has also been shown to be useful in algorithms which

7
identify edge discontinuities (Forsyth & Zisserman, 1992; Nayar, Ikeuchi & Kanade,
1991).
Although we have experimental evidence that the visual system is sensitive and can make
use of some of the subtle effects of interreflections, are they also useful for judging
contact? If so, what is the image information for contact? In order to answer these
questions, it is important to dissociate the contributions of cast shadows and
interreflections. We measured the ability of observers to reliably judge the contact
between two surfaces under conditions for which we could control the contributions of
cast shadows and interreflections. Further, we also tested whether a simple geometrical
constraint typical of certain types of contact might be important for contact judgments.
METHODS
Computer graphics was used to simulate images of a rectangular box which was either in
contact with or slightly above a floor (figure 2).
(Insert Figure 2 here)
8
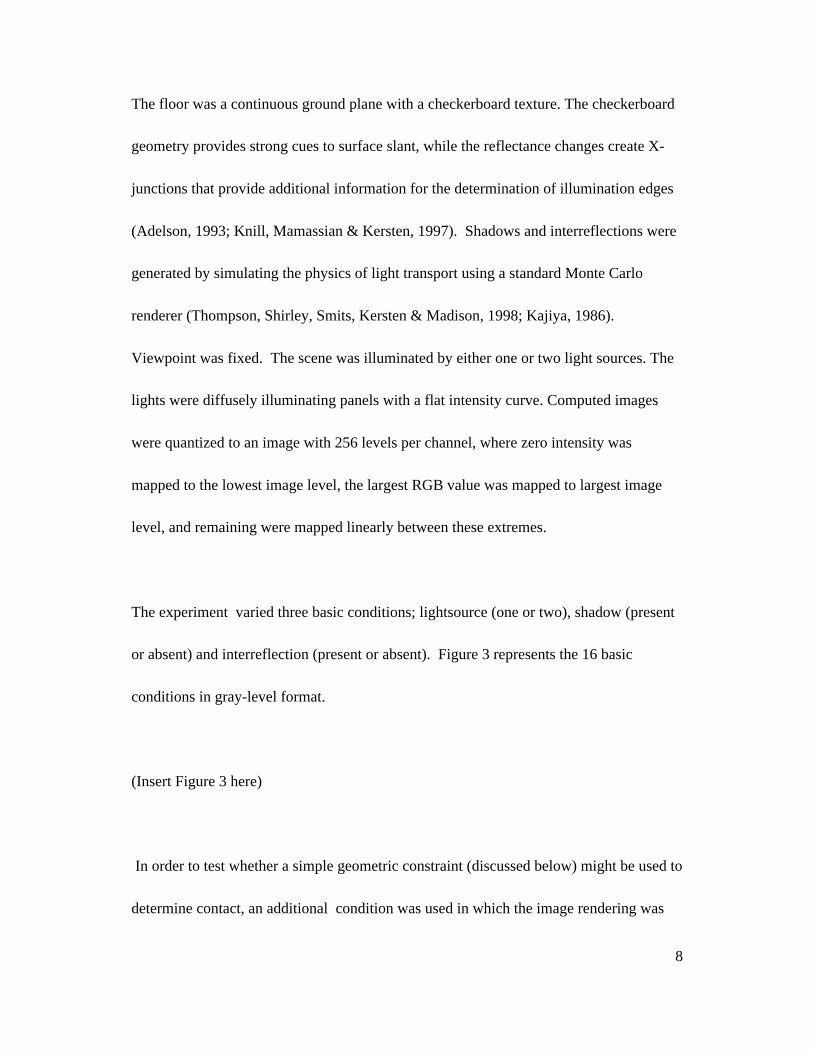
The floor was a continuous ground plane with a checkerboard texture. The checkerboard
geometry provides strong cues to surface slant, while the reflectance changes create X-
junctions that provide additional information for the determination of illumination edges
(Adelson, 1993; Knill, Mamassian & Kersten, 1997). Shadows and interreflections were
generated by simulating the physics of light transport using a standard Monte Carlo
renderer (Thompson, Shirley, Smits, Kersten & Madison, 1998; Kajiya, 1986).
Viewpoint was fixed. The scene was illuminated by either one or two light sources. The
lights were diffusely illuminating panels with a flat intensity curve. Computed images
were quantized to an image with 256 levels per channel, where zero intensity was
mapped to the lowest image level, the largest RGB value was mapped to largest image
level, and remaining were mapped linearly between these extremes.
The experiment varied three basic conditions; lightsource (one or two), shadow (present
or absent) and interreflection (present or absent). Figure 3 represents the 16 basic
conditions in gray-level format.
(Insert Figure 3 here)
In order to test whether a simple geometric constraint (discussed below) might be used to
determine contact, an additional condition was used in which the image rendering was

9
not based on a realistic model of the physics of light. This “faked” condition had one
light source, a white shadow, and a photometrically incorrect (red instead of green)
interreflection. (Figure 4)
(Insert Figure 4 here)
In each of the above conditions the scene was rendered twice, with the box slightly above
the floor, and with the box touching the floor.
Twenty-two participants viewed each image ten times in a random order. Participants
made a judgement in which they ranked their confidence regarding the contact between
the floor and the box. The degree of contact choices were: definitely touching, maybe
touching, unsure, maybe above, and definitely above. The images were displayed at a
resolution of 1024 X 768 on an Applevision 1710AV display at a distance of 64cm. The
monitor had a gamma of 1.8 and the images were gamma-corrected to use the standard
Macintosh look-up table. The images had a mean luminance of 120 cd/m2, with shadow
areas averaging 15 cd/m2 and the highly illuminated areas averaging 200 cd/m2. All
participants had normal or corrected to normal vision, gave their informed consent, and
received extra credit for their participation in a research experience program connected to
a first year psychology class.

10
DATA ANALYSIS
Participant responses were analyzed independently. Because each image can be
considered as having a “correct answer”, either touching or above as determined by the
geometry of the 3D model, Receiver Operating Characteristic (ROC) curves could be
generated for each individual, for each condition. The ROC curve represents a graph of
hits vs. false alarms for various criterion levels. The ROC can be generated by
determining the correct number of responses for each criterion level (definitely touching,
maybe touching, unsure, maybe above, and definitely above), and plotting hits (object is
touching and participant says it is touching) against false alarms (object is not touching
and participant says it is touching) (Green & Swets, 1974). The area under the ROC
curve provides a measure of sensitivity and ranges from 0.5 (chance) to 1 (perfect). Our
summary measure of contact was z-score of the area under the ROC curve1.
RESULTS
(Insert Figure 5 here)
1 The zscore of the area is proportional to a d’, a standard measure of sensitivity. Specifically, the area
under the ROC curve equals the predicted proportion correct in a two-alternative forced-choice experiment,assuming equal-variance gaussian distributions on the underlying decision variable.
11
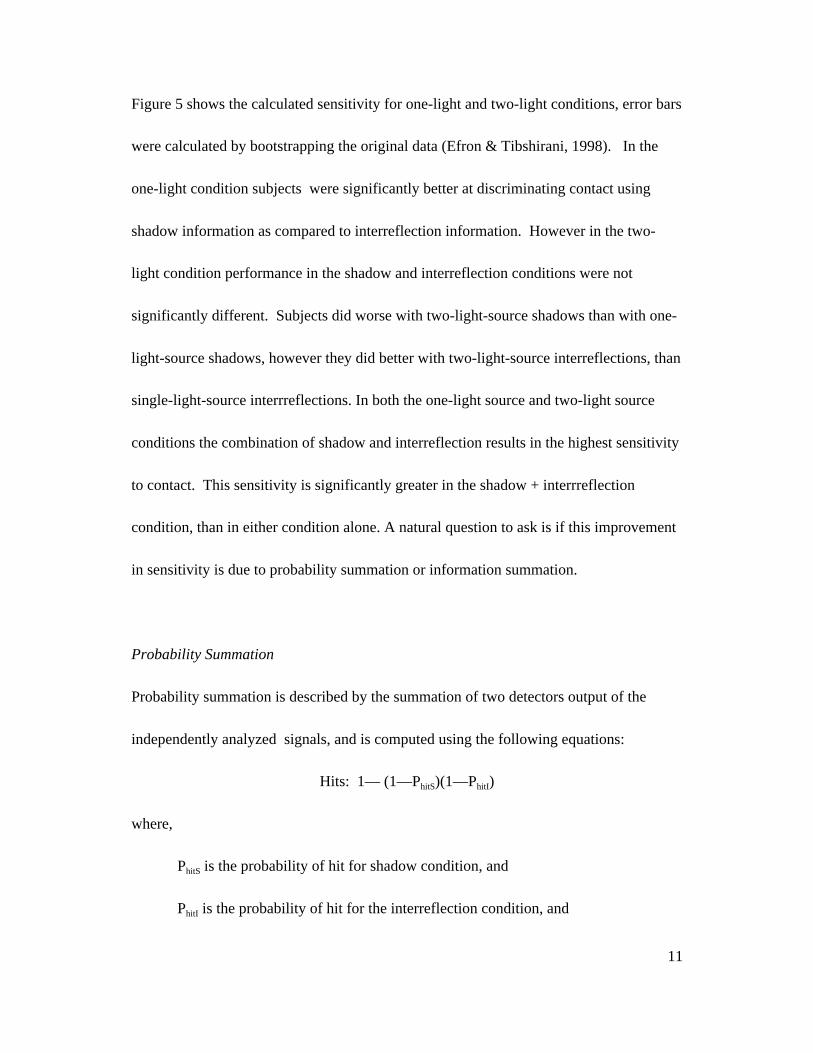
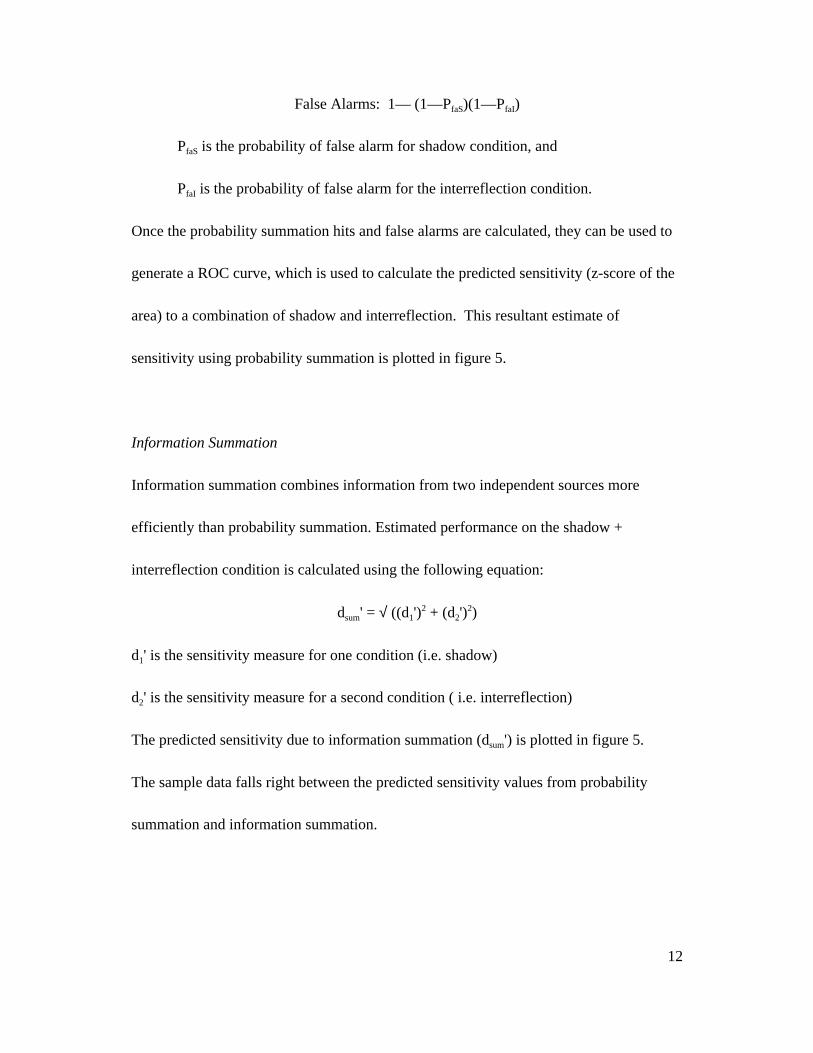
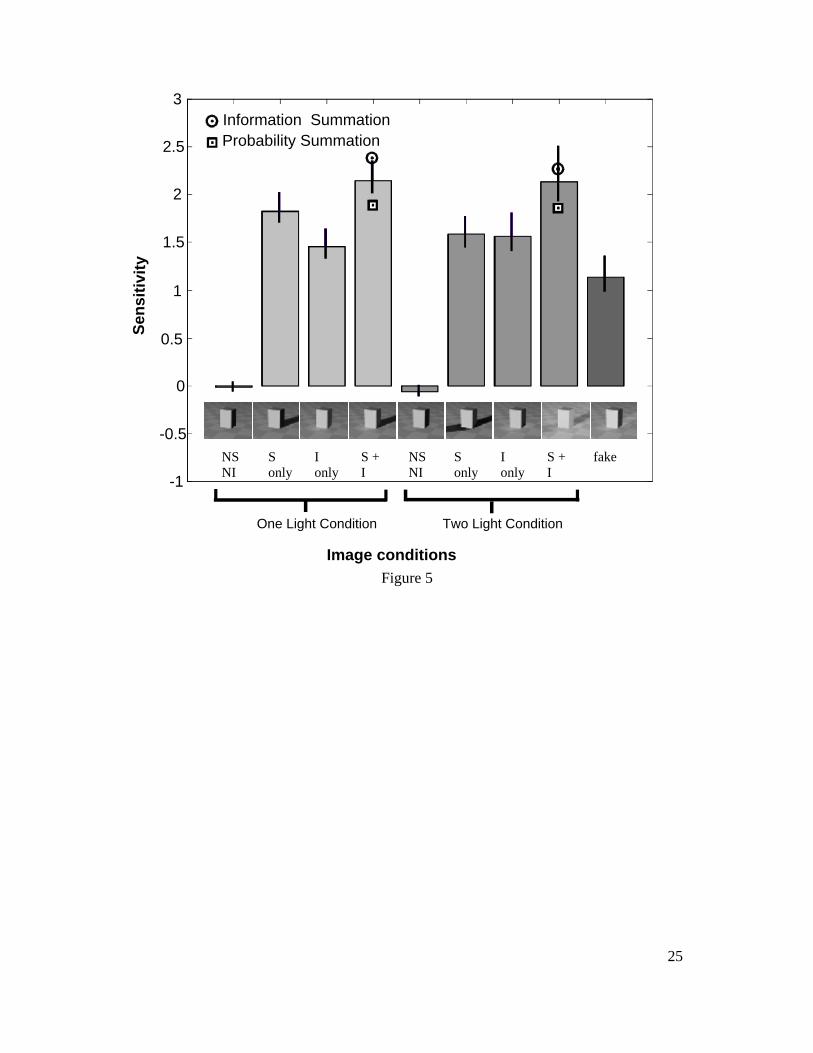
Figure 5 shows the calculated sensitivity for one-light and two-light conditions, error bars
were calculated by bootstrapping the original data (Efron & Tibshirani, 1998). In the
one-light condition subjects were significantly better at discriminating contact using
shadow information as compared to interreflection information. However in the two-
light condition performance in the shadow and interreflection conditions were not
significantly different. Subjects did worse with two-light-source shadows than with one-
light-source shadows, however they did better with two-light-source interreflections, than
single-light-source interrreflections. In both the one-light source and two-light source
conditions the combination of shadow and interreflection results in the highest sensitivity
to contact. This sensitivity is significantly greater in the shadow + interrreflection
condition, than in either condition alone. A natural question to ask is if this improvement
in sensitivity is due to probability summation or information summation.
Probability Summation
Probability summation is described by the summation of two detectors output of the
independently analyzed signals, and is computed using the following equations:
Hits: 1— (1—PhitS)(1—PhitI)
where,
PhitS is the probability of hit for shadow condition, and
PhitI is the probability of hit for the interreflection condition, and
12
False Alarms: 1— (1—PfaS)(1—PfaI)
PfaS is the probability of false alarm for shadow condition, and
PfaI is the probability of false alarm for the interreflection condition.
Once the probability summation hits and false alarms are calculated, they can be used to
generate a ROC curve, which is used to calculate the predicted sensitivity (z-score of the
area) to a combination of shadow and interreflection. This resultant estimate of
sensitivity using probability summation is plotted in figure 5.
Information Summation
Information summation combines information from two independent sources more
efficiently than probability summation. Estimated performance on the shadow +
interreflection condition is calculated using the following equation:
dsum' = √ ((d1')2 + (d2')
2)
d1' is the sensitivity measure for one condition (i.e. shadow)
d2' is the sensitivity measure for a second condition ( i.e. interreflection)
The predicted sensitivity due to information summation (dsum') is plotted in figure 5.
The sample data falls right between the predicted sensitivity values from probability
summation and information summation.
13
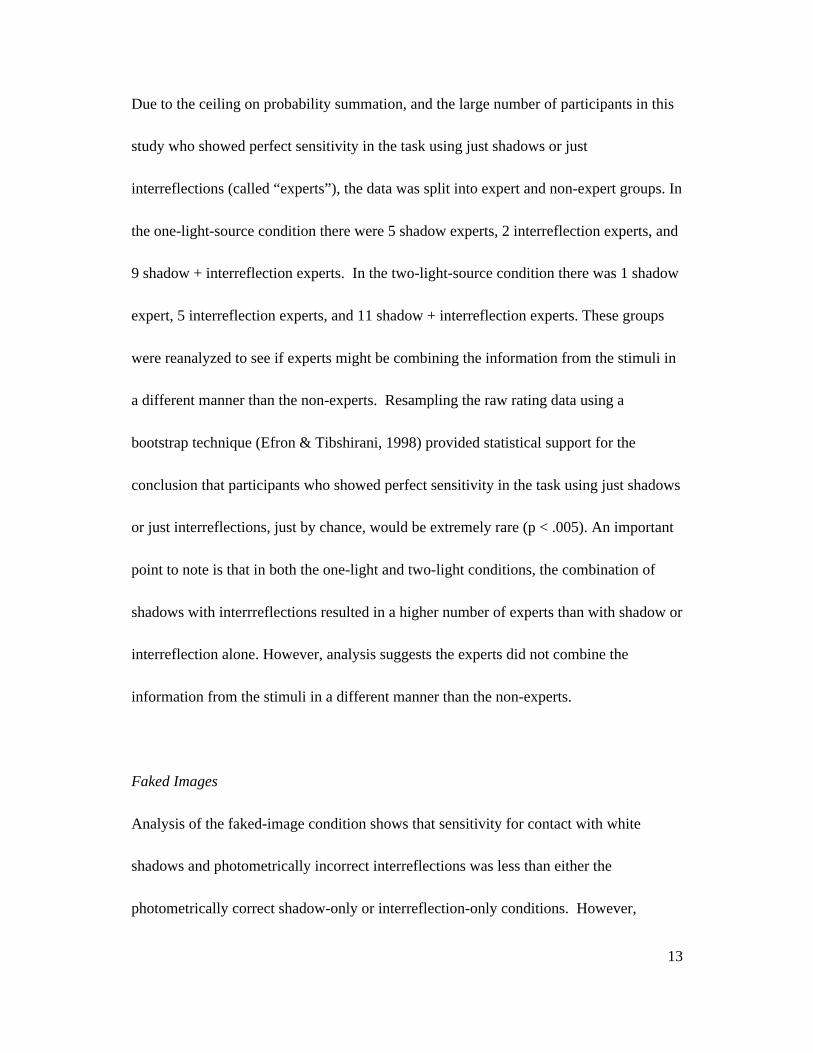
Due to the ceiling on probability summation, and the large number of participants in this
study who showed perfect sensitivity in the task using just shadows or just
interreflections (called “experts”), the data was split into expert and non-expert groups. In
the one-light-source condition there were 5 shadow experts, 2 interreflection experts, and
9 shadow + interreflection experts. In the two-light-source condition there was 1 shadow
expert, 5 interreflection experts, and 11 shadow + interreflection experts. These groups
were reanalyzed to see if experts might be combining the information from the stimuli in
a different manner than the non-experts. Resampling the raw rating data using a
bootstrap technique (Efron & Tibshirani, 1998) provided statistical support for the
conclusion that participants who showed perfect sensitivity in the task using just shadows
or just interreflections, just by chance, would be extremely rare (p < .005). An important
point to note is that in both the one-light and two-light conditions, the combination of
shadows with interrreflections resulted in a higher number of experts than with shadow or
interreflection alone. However, analysis suggests the experts did not combine the
information from the stimuli in a different manner than the non-experts.
Faked Images
Analysis of the faked-image condition shows that sensitivity for contact with white
shadows and photometrically incorrect interreflections was less than either the
photometrically correct shadow-only or interreflection-only conditions. However,
14
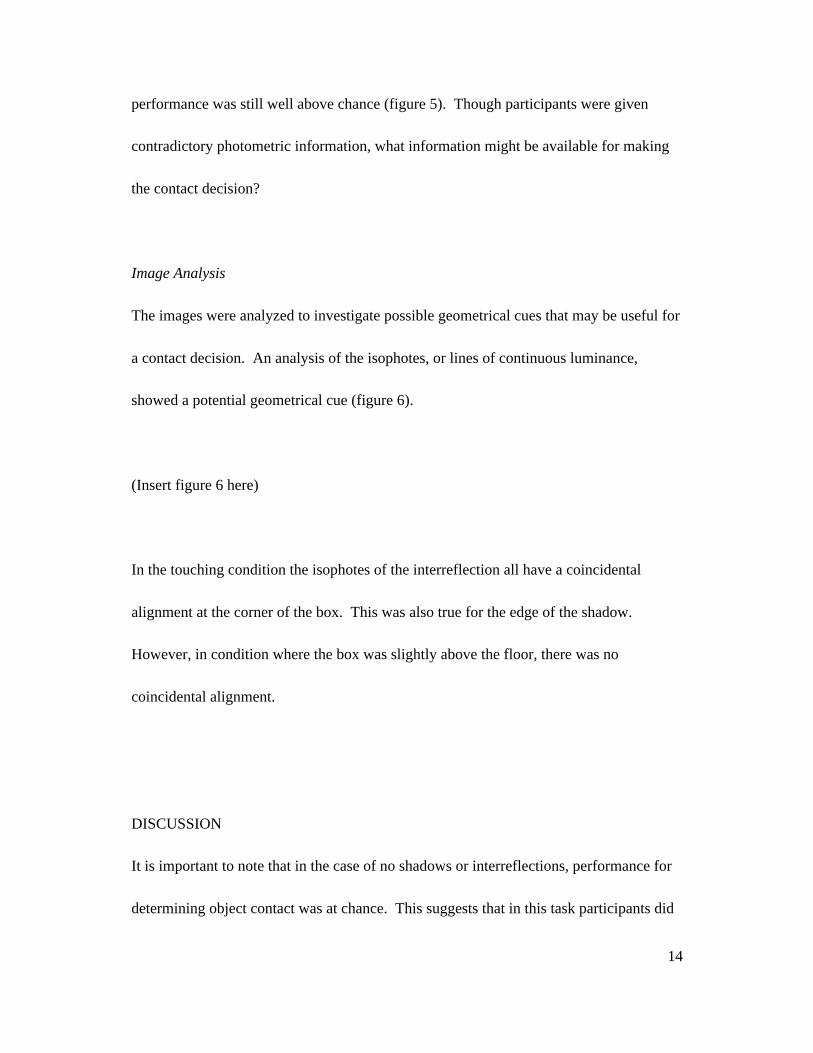
performance was still well above chance (figure 5). Though participants were given
contradictory photometric information, what information might be available for making
the contact decision?
Image Analysis
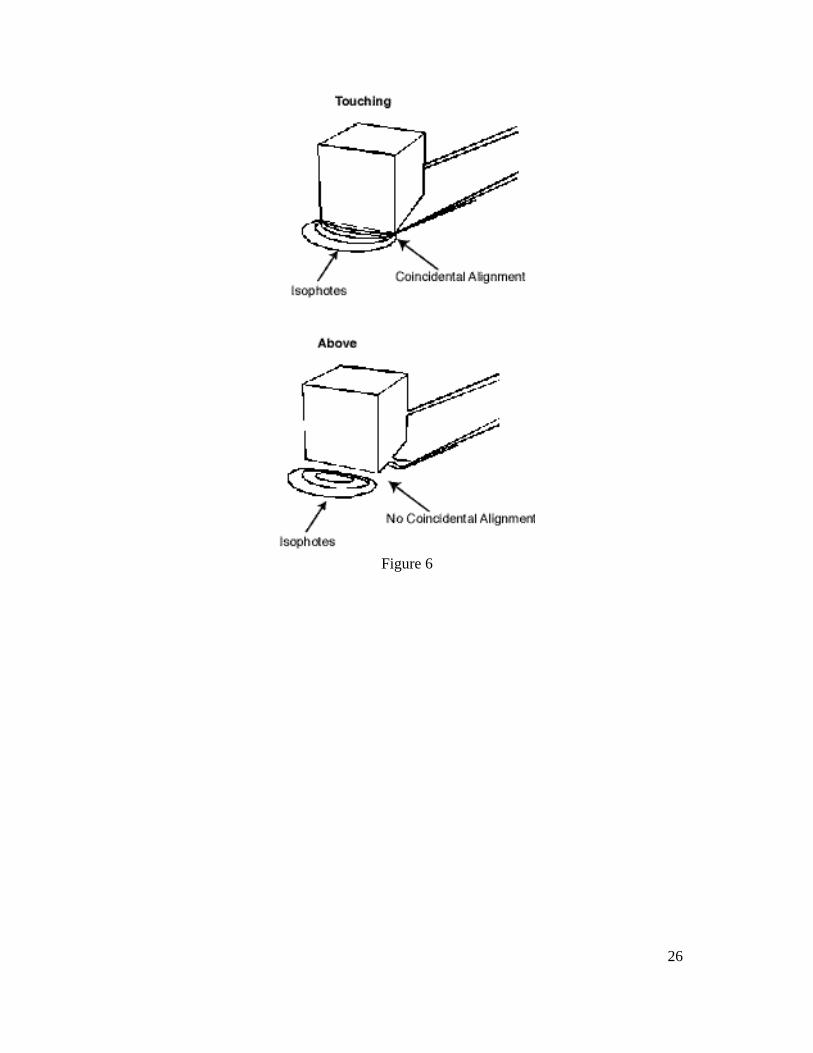
The images were analyzed to investigate possible geometrical cues that may be useful for
a contact decision. An analysis of the isophotes, or lines of continuous luminance,
showed a potential geometrical cue (figure 6).
(Insert figure 6 here)
In the touching condition the isophotes of the interreflection all have a coincidental
alignment at the corner of the box. This was also true for the edge of the shadow.
However, in condition where the box was slightly above the floor, there was no
coincidental alignment.
DISCUSSION
It is important to note that in the case of no shadows or interreflections, performance for
determining object contact was at chance. This suggests that in this task participants did

15
not have biased judgements resulting from the effect of other cues, (such as co-planarity
with the floor plane). Adding just shadows or just interreflections resulted in a higher
sensitivity to object contact. The decrease in sensitivity for discrimination with two-
light-source shadows may be due to the coincidental alignment of the shadows, which
may result in interpreting the shadows as a pigment change or a rug and not an
illumination effect. Improvement in the two-light-source interreflection condition may
be due to increased geometrical cues to contact, as is addressed in the image analysis
section of this paper. The combination of shadows with interreflections resulted in the
highest sensitivity and was significantly greater than in images that had only shadows or
only interreflections. Though analysis of the data does not clearly point to probability
summation or information summation, it is clear that there is some form of cue
combination occurring in the participants. This combined effect of shadows and
interrreflections results in much higher sensitivity to contact, suggesting the importance
of shadows and interreflection in making subjective contact decisions.
The “faked” condition, which combined shadow and interreflection resulted in a
relatively high sensitivity to contact. Though the illumination effects were not physically
correct subjects could still make an accurate response, however sensitivity was much
worse than for the photometrically correct shadow-only and interreflection-only
conditions. Image analysis provides one potentially useful cue in the geometry of the

16
isophotes. The alignment of the shadow and or the interreflection at the corner of the box
may provide some information for the decision contact. However, the most accurate
judgement did require both photometrically correct shadow and interreflection,
suggesting that agreement of all the cue information lead to the best judgement.
CONCLUSION
Though shadows have generally been assumed to be a cue for contact, this research
validates this assumption and also introduces interreflection as an equally important cue
for object contact. Though interreflections appear subtler than shadows in the image,
under the conditions of this experiment, they convey equally strong information about
object contact. However, the greatest sensitivity results from a combination of both
shadows and interreflections. When taken together, shadows and interreflection prove to
be valuable cues to contact and therefor also for spatial layout. This study provides
support to the growing importance of considering illumination effects in investigation of
human visual perception of spatial layout.
ACKNOWLEDGMENTS
This research was supported by NSF Grant SBR 9631682 and NIH Grant EY 11507.
17
REFERENCES
Adelson, E.H. (1993) Perceptual organization and the judgement of brightness. Science,
262, 2042-2044.
Bloj, M. G., Kersten, D., & Hurlbert, A. C. (1999). Perception of three-dimensional shape
influences colour perception via mutual illumination. Nature, 402, 877-879.
Cutting, J. E., & Vishton, P. M. (1995). Perceiving Layout and Knowing Distances: The
Integration, Relative Potency, and Contextual Use of Different Information about Depth.
In W. Epstein, & S. Rogers (Ed.), Perception of Space and Motion (pp. 69-117). San
Diego:Academic Press, Inc.
Efron, B. & Tibshirani, R. J. (1998) An introduction to the bootstrap. New York:
Chapman & Hall/CRC.
Foley, J., van Dam, A., Feiner, S., & Hughes, J. (1996) Computer Graphics: Principles
and Practice, 2nd Edition in C, Reading, Massachusetts: Addison-Wesley.
Forsyth, D. & Zisserman, A. (1992) Reflections on shading. In L.B.Wolff, S.A. Shafer
& G. E. Healey (Eds.), Physics Based Vision: Principles and Practice: Shape Recovery.
Boston:Jones and Bartlett Publishers.
Gilchrist, A. & Jacobsen, A. (1984) Perception of lightness and illumination in a world
of one reflectance. Perception , 13, 5-19.

18
Green, D.M., and Swets, J. A. (1974). Signal detection theory and psychophysics.
Huntington, New York: Robert E. Krieger Publishing Company.
Kajiya, J. (1986) The rendering equation. SIGGRAPH 1986 Proceedings, 20, 143-150.
Kersten, D., Knill, D.C., Mamassian, P. & Bulthoff, I. (1996) Illusory motion form
shadow. Nature, 379, 31.
Kersten, D., Mamassian, P. & Knill, D.C. (1997) Moving cast shadows induce apparent
motion in depth. Perception, 26, 171-192.
Knill, D. C., Mamassian, P. & Kersten, D. (1997) The geometry of shadows. Journal of
the Optical Society of America A., 14 (12), 3216 - 3232.
Langer, M. (1999) When do shadows become interreflections? International Journal of
Computer Vision, 34, 1-12.
Nayar, S.K., Ikeuchi, K. & Kanade, T. (1991) Shape from interreflections. International
Journal of Computer Vision, 6, 173-195.
Sedgwick, H. A. (1986). Space Perception. In K. R. Boff, L. Kaufman, & J. P. Thomas(Ed.), Handbook of Perception and Performance (pp. 21-1- 21-57). New York: Wiley -Interscience.
Sinai, M.J., Ooi, T.L. & He, Z.J. (1998) Terrain influences the accurate judgement of
distance. Nature, 395, 497-500.

19
Thompson, W.B., Shirley, P., Smits, B., Kersten, D. J. & Madison, C. (1998, March).
Visual Glue, Technical Report UUCS-98-007. University of Utah.
Yonas, A., Goldsmmith, L.T. & Halstrom, J. L. (1978) Development of sensitivity to
information provided by cast shadows in pictures. Perception, 7, 333-341.

20
FIGURES
Figure 1: Interreflection: The dashed line shows direct reflection from a surface. Thesolid line shows the addition of light bouncing from a nearby object.
Figure 2: Geometry of the Scene: The green rectangle is centered at the origin. Light 1 iscentered at (-4.0, 2.25, 12.0). Light 2 is centered at (1.0, 2.25, -12.0). Both lights are 1.5
units by 1.5 units. In the touching condition the rectangle lies on the floor plane (y=0). Inthe above condition it is 0.010 units above the floor plane. All measurements are inabsolute units.
Figure 3:Images used in the experiment: Gray-level versions of images used in theexperiments. The original images are on the following web site:
http://vision.psych.umn.edu/www/people/cindee/glueimages.html
Figure 4: Faked images: Gray-level versions. These images had the wrong color
interreflection (red instead of green) and the wrong polarity shadow (white instead ofblack). The original images are on the following web site:http://vision.psych.umn.edu/www/people/cindee/glueimages.html
Figure 5: Sensitivity Measures for each condition: The light bars are for the one-light
condition. The medium bars for the two-light condition. Darkest bars represent the fakedcondition (white shadows and photometrically incorrect interreflections). Sensitivity ismeasured in z-score of area under the ROC curve (note 0.0 is chance). Error bars were
calculated using bootstrap analysis. Predicted performance in the shadow +interreflection based on probability summation (circle) and information summation(square) are plotted with the actual shadow + interreflection data. NS NI = no shadow,
no interreflection; S only = shadow only; I only = interreflection only; S + I = shadowplus interreflection.
Figure 6: Image analysis; one-light source: Isophotes are lines of continuous luminance,and include interreflection isophotes, shadow isophotes and shading isophotes.

21
Figure 1

22
Figure 2

23
No ShadowNo Interreflection
ShadowNo Interreflection
No ShadowInterreflection
ShadowInterreflection
No ShadowNo Interreflection
ShadowNo Interreflection
No ShadowInterreflection
ShadowInterreflection
No ShadowNo Interreflection
ShadowNo Interreflection
No ShadowInterreflection
ShadowInterreflection
No ShadowNo Interreflection
ShadowNo Interreflection
No ShadowInterreflection
One-Light Source
Two-Light Source
ShadowInterreflection
Touching
Above
Above
Touching
Figure 3

24
White ShadowRed InterreflectionTouching
White ShadowRed InterreflectionAbove
Figure 4
25
-1
-0.5
0
1
1.5
2
2.5
3
Image conditions
Sen
siti
vity
NSNI
NSNI
Sonly
Sonly
Ionly
Ionly
S +I
S +I
fake
One Light Condition Two Light Condition
Information SummationProbability Summation
0.5
Figure 5
26
Figure 6