lecture 4: psychophysics and user studies
TRANSCRIPT

ME 327: Design and Control of Haptic Systems Autumn 2020
Lecture 4:Psychophysics
and User Studies
Allison M. OkamuraStanford University

psychophysics
the scientific study of the relation between stimulus and sensation
• fundamental to psychology• has become fundamental to understanding
haptic devices and virtual environments
More information & sources of figures in this section: Gescheider, “Psychophysics: Method, Theory and Application,” 1984
Stanford University ME 327: Design and Control of Haptic Systems © Allison M. Okamura, 2020

two principal functions
• Descriptive: Involves the specification of sensory capacities
• Analytical: Testing of hypothesis about the underlying biological mechanisms that determine human sensory capacity
Stanford University ME 327: Design and Control of Haptic Systems © Allison M. Okamura, 2020

history• 1879 Wundt (British empiricist) articulated the
idea of senses as key to human understanding
• Simultaneous advances in sensory physiology–Facilitated transition of psychology from a
philosophical to scientific discipline–1860: Fechner published “Elements of
Psychophysics”: techniques for measuring mental events
Stanford University ME 327: Design and Control of Haptic Systems © Allison M. Okamura, 2020

measurement thresholds• “sensory threshold” is a central idea• absolute threshold–sensitivity–smallest amount of stimulus energy required to produce a sensation
• difference threshold–resolving power–amount of change in the stimulus required to produce a just noticeable difference (JND) in the sensation
Stanford University ME 327: Design and Control of Haptic Systems © Allison M. Okamura, 2020

Just Noticeable Difference (JND)
the amount of change in a stimulus that creates a perceptible increment in sensation
example:• stimulus intensity = 10 units• goes up to 12 units before observer notices a change• therefore, JND = 2 units at that stimulus level
Stanford University ME 327: Design and Control of Haptic Systems © Allison M. Okamura, 2020

sensory dimensions• intensity or magnitude
e.g., amplitude, frequency
• quality or sensory modalitye.g., visual or auditory stimulus haptic: vibration, force, movement
• extensione.g., size, location, separation haptic: bump width, space between bumps
• durationStanford University ME 327: Design and Control of Haptic Systems © Allison M. Okamura, 2020
psychophysical “laws”
• Empirically derived• Hold true across all senses in many situations
• Many such “laws” existOldest example still has experimental relevance (after almost 200 years!)
Stanford University ME 327: Design and Control of Haptic Systems © Allison M. Okamura, 2020

Weber’s Fraction, 1834 German Physiologist E. H. Weber
Gescheider, 1984
Linear relationship between differential threshold and stimulus intensity
For example: to feel different, 2 heavy weights must differ more than two light weights
Stanford University ME 327: Design and Control of Haptic Systems © Allison M. Okamura, 2020

Weber Fraction
• for weights placed on the skin, the Weber fraction is approximately 1/30
• this provides a useful index of sensory discrimination that can be compared across different conditions and modalities
• however, the WF “law” is not always perfect, especially near the absolute threshold (φ=0)
Stanford University ME 327: Design and Control of Haptic Systems © Allison M. Okamura, 2020
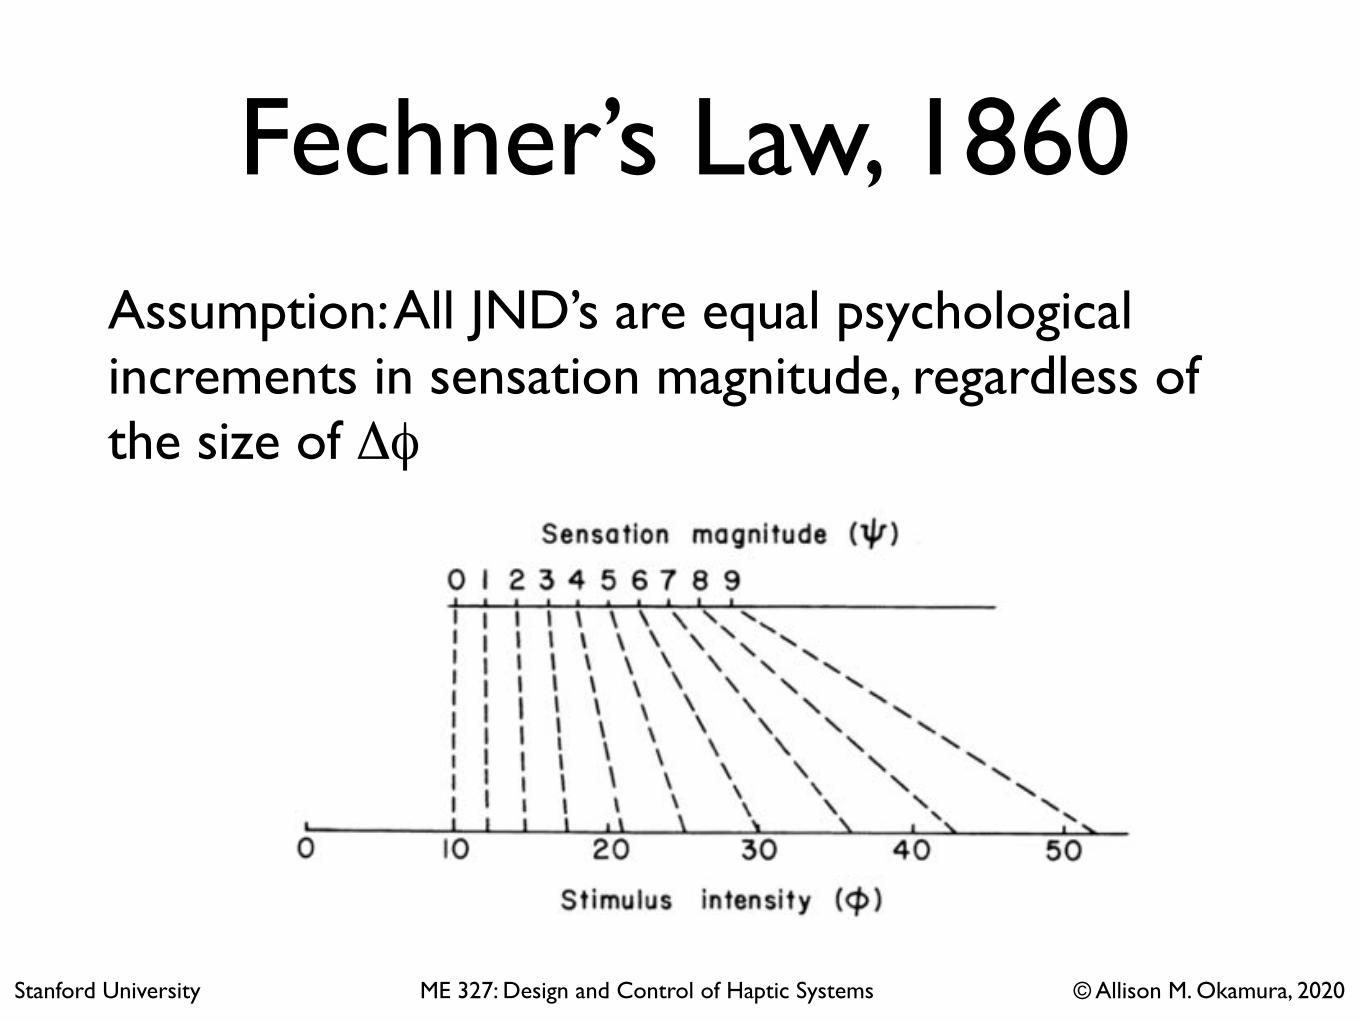
Fechner’s Law, 1860Assumption: All JND’s are equal psychological increments in sensation magnitude, regardless of the size of Δφ
Stanford University ME 327: Design and Control of Haptic Systems © Allison M. Okamura, 2020

Fitts’ Law
For a haptic virtual environment or teleoperation system, you often want to show that you can minimize difficulty via haptic feedback
Fitt’s Law states that the time to acquire a target (T) is a function of the distance to (D) and size (W) of the target
D
W
Stanford University ME 327: Design and Control of Haptic Systems © Allison M. Okamura, 2020
index of difficulty

Demonstration of Fitts’ Law
psychophysical methods
methods for determining sensory thresholds:
• method of limits (and staircase method)• method of constant stimuli• method of adjustment
Stanford University ME 327: Design and Control of Haptic Systems © Allison M. Okamura, 2020

method of limitsmeasures absolute and difference threshold location
Present subjects with ascending and descending stimulus series, and ask: is a comparison >, =, or < a reference?
Stanford University ME 327: Design and Control of Haptic Systems © Allison M. Okamura, 2020
absolute difference: average transitionJND: size of “equal” band

staircase method (Modified Method of Limits)
l Begin with high-intensity stimulus
l Intensity is reduced until observer makes error
l Stimulus intensity reverses until subject detects stimulus
l Reversal values averagedl Multiple staircase methods: step size up/down increments
H. Levitt, “Transformed Up-Down Methods in Psychoacoustics,” The Journal of the Acoustical Society of America, vol. 49, 1971, pp. 467-477.
Stanford University ME 327: Design and Control of Haptic Systems © Allison M. Okamura, 2020

example study
Yes No
X, Indentation depth (m
m)
1
2
3
4
n Reversal 1
Reversal 2
dB = 2 dB = 1 dB = 0.5
“Staircase” Tracking Algorithm
indentation depth defined by:
l subjects trained with 5 modelsl initial indentation is random, below thresholdl trial ends when last 10 indentations are within 2 dBl indentation depth required for detection is mean of
last five indentation values
Finger fixed in placewith dental gum
Model held at target depth for 500 ms.
Stanford University ME 327: Design and Control of Haptic Systems © Allison M. Okamura, 2020

method of constant stimuli
• repeat same 5-9 stimuli• randomly present each ~100x• detect stimulus? (Y/N)• percent of positive responses calculated for each stimulus intensity• fit curve to get psychometric function (usually s-shaped)• advantage: subject can not predict level of next stimulus intensity
(removes errors of habituation and expectation)
Absolute threshold location at 50%
JND between 25% and 75%
Stanford University ME 327: Design and Control of Haptic Systems © Allison M. Okamura, 2020

method of adjustment
gives absolute and difference threshold
locations
l set stimulus intensity far above or below thresholdl subject “tunes” stimulus intensity to:
l be perceptible (absolute threshold)l match a reference stimulus (difference threshold)
l mean = subjective equalityl difference threshold = standard deviation
Stanford University ME 327: Design and Control of Haptic Systems © Allison M. Okamura, 2020

perceptual and performance experiments
not all haptic experiments are psychophysical experiments...
some are perceptual (i.e., they ask different questions about perception)
some are related to user performance
Stanford University ME 327: Design and Control of Haptic Systems © Allison M. Okamura, 2020

example study, part 1
Stanford University ME 327: Design and Control of Haptic Systems © Allison M. Okamura, 2020
Design and Performance of a Two-Dimensional Tactile Slip Display 3
sliding contact surface. As ball diameter is reduced, the contact area with the fingertip
becomes smaller and at its limit approaches a point contact. A larger ball increases the
size and weight of the device. We selected a 25.4 mm diameter Delrin ball as the
contact object and designed around this centerpiece.
To determine the required driving torque, we estimated that the normal force
applied by a user on the ball would be 1.5N. This was measured by pushing on a scale
with a force comparable to that used when sliding across a real-world surface. To
determine motor torque, the coefficient of friction between the fingertip and a sanded
Delrin ball was also required. Several sources (e.g. [10]) suggest a value of µ = 0.5 as
a reasonable estimate. Combining these specifications with the known ball size and
estimated gear ratios led to a motor torque requirement of 7.5 mNm.
Another important specification necessary for motor selection was the desired
maximum speed at which the ball would turn. We desired the ability to accurately
recreate the slip sensation for hand speeds up to 50 cm/s. Using the 25.4 mm ball
diameter, this requires a rotational speed of approximately 6.3 rpm for the ball.
From [5], we knew the size of the aperture where the fingertip contacts the ball
would affect users’ perception of the device. Using this reference and our own testing,
we targeted for an aperture of 15 mm in diameter.
2.3 Design
Users experience a slip contact with the ball, which is spun by two orthogonal
wheels via friction contact. The ball is supported by low-friction rolling contact in a
Fig. 1. The two-degree of freedom slip display
mounted on the output link of a PHANTOM
haptic interface
A
B
2 1
ball
bearing
2
1
bearing
ball
path
Fig. 2. The positions of the drive wheels (1
and 2) result in additional frictional contact
and off-axis ball rotation (axis A is desired
and axis B results)
132
Design and Performance of a Two-Dimensional Tactile Slip Display 5
using the encoders on the PHANTOM. The position is differentiated and filtered to
obtain an estimate of the fingertip velocity. The environment contained two types of
virtual objects. When the cursor was moved over the first type of object, the ball was
driven at the user’s estimated linear velocity, but in the opposite direction, to simulate
the sensation of sliding a finger across a tabletop. The second type of object behaved
like a conveyor belt; users were displayed slip at a constant speed while positioned
over the object. Subjective evaluation of this system by a number of users indicates
that these virtual surfaces provide realistic slip sensations.
4 Psychophysical Experiments
Two experiments were performed to evaluate the impact of device limitations. As
mentioned earlier, the location of the drive wheels induces some error in the ball’s
axis of rotation. Thus, the first experiment evaluates the level at which angular
differences in the direction of slip become noticeable to users of the device. Other
potential sources of error in ball motion come from friction or inconsistencies on the
rotating portions of the device. For example, there are finite tolerances for holes
drilled in round parts (such as drive wheels and gears), and in the straightness of
rotating shafts. Such manufacturing tolerances could induce periodic variation in the
velocity of the ball, even with perfect control of the motor speed. Thus, the second
experiment explores the level at which these variations are detectable by a typical
user. Both experiments were conducted using the device shown in Figure 4. This
device mimics the tactile interface of the slip display by using the same lightly sanded
Delrin ball and a similar aperture. In this arrangement, the ball is directly attached to
the shaft of a single encoded motor, so it spins around a known axis at a known
angular velocity.
Fig. 3. An exploded view of the device
assembly
Fig. 4. Single-axis slip device used in
psychophysical experiments
134
Design and Performance of a Two-Dimensional Tactile Slip DisplayTodd E. Murphy, Robert J. Webster III, and Allison M. Okamura
Proceedings of EuroHaptics 2004, Munich Germany, June 5-7, 2004.
Part 1: Design

Stanford University ME 327: Design and Control of Haptic Systems © Allison M. Okamura, 2020
Design and Performance of a Two-Dimensional Tactile Slip DisplayTodd E. Murphy, Robert J. Webster III, and Allison M. Okamura
Proceedings of EuroHaptics 2004, Munich Germany, June 5-7, 2004.
Part 2: User StudyDesign and Performance of a Two-Dimensional Tactile Slip Display 5
using the encoders on the PHANTOM. The position is differentiated and filtered to
obtain an estimate of the fingertip velocity. The environment contained two types of
virtual objects. When the cursor was moved over the first type of object, the ball was
driven at the user’s estimated linear velocity, but in the opposite direction, to simulate
the sensation of sliding a finger across a tabletop. The second type of object behaved
like a conveyor belt; users were displayed slip at a constant speed while positioned
over the object. Subjective evaluation of this system by a number of users indicates
that these virtual surfaces provide realistic slip sensations.
4 Psychophysical Experiments
Two experiments were performed to evaluate the impact of device limitations. As
mentioned earlier, the location of the drive wheels induces some error in the ball’s
axis of rotation. Thus, the first experiment evaluates the level at which angular
differences in the direction of slip become noticeable to users of the device. Other
potential sources of error in ball motion come from friction or inconsistencies on the
rotating portions of the device. For example, there are finite tolerances for holes
drilled in round parts (such as drive wheels and gears), and in the straightness of
rotating shafts. Such manufacturing tolerances could induce periodic variation in the
velocity of the ball, even with perfect control of the motor speed. Thus, the second
experiment explores the level at which these variations are detectable by a typical
user. Both experiments were conducted using the device shown in Figure 4. This
device mimics the tactile interface of the slip display by using the same lightly sanded
Delrin ball and a similar aperture. In this arrangement, the ball is directly attached to
the shaft of a single encoded motor, so it spins around a known axis at a known
angular velocity.
Fig. 3. An exploded view of the device
assembly
Fig. 4. Single-axis slip device used in
psychophysical experiments
134
6 Murphy, Webster and Okamura
4.1 Angle Discrimination Experiment
To determine the effect of the angular direction of slip on user perception, we
performed an experiment to determine the absolute threshold of the direction of
relative slip on the index finger. We placed the test apparatus on a table oriented such
that the direction of ball motion simulated the feeling of placing one’s finger on a
horizontal surface and drawing the finger towards oneself.
Twelve subjects (seven male, five female, aged 21 to 31 years) participated in the
experiments. Each participant was instructed to use the index finger of the right hand
to press on the surface of the ball with a light, constant pressure of approximately
0.5 N. Each user was asked to press on a scale at the start of the experiment until the
reading showed 50 g in order to get a feel for this level of force. All test participants
were familiarized with the device and the intent of the experiment before starting. The
device was aligned so that the axis of rotation was parallel with the participant’s
coronal plane, identified as the “straight” orientation, and each subject had a chance to
experience this. The device was then rotated 50 degrees counterclockwise and each
subject experienced this as an example of an “angled” configuration.
Subjects were then blindfolded and presented with a random sequence of 10 angles
ranging from 0-50 degrees, in 5 degree increments. During the experiment the ball
was spun at approximately 1.25 rev/s, creating a linear slip rate under the fingertip of
10 cm/s. Between presentation of each individual angle, subjects were asked to lift
their index finger off the device. Subjects were allowed to feel each angle for as long
as they liked, but were instructed not to conduct search activities such as moving their
index finger in the horizontal plane or varying contact pressure. For each angle, the
subjects verbally selected either “angled” or “straight” as the best description of the
sensation they were experiencing. Subject responses are presented in Figure 5. These
results demonstrate that the average user cannot discriminate angles up to about 20
degrees of deviation from the nominal value. The results are encouraging for our
application, as they suggest that users’ perceptual experience will not be affected by
the limitations of our device.
0.0
0.2
0.4
0.6
0.8
1.0
0 5 10 15 20 25 30 35 40 45 50
Slip Angle (deg)
Pro
po
rtio
n o
f "A
ng
led
"
Re
sp
on
se
s
Fig. 5. Subject responses from the angle discrimination experiment. The average angle of
detection was between 20 and 25 degrees.
135
example study, part 2

Stanford University ME 327: Design and Control of Haptic Systems © Allison M. Okamura, 2020
Follow-on Study
A Novel Two-Dimensional Tactile Slip Display: Design, Kinematics and Perceptual Experiments. Robert J. Webster III, Todd E. Murphy, Lawton Verner,
and Allison M. Okamura. ACM Transactions on Applied Perception, 2005.
156 • R. J. Webster, III et al.
Fig. 5. (a) Considering one wheel only, the axis of rotation of the ball can be anywhere in the plane shown. (b) Wheels on equatorshare a common plane of permissible axes. (c) Wheels off the equator constrain rotation axis to a line. (d, e) Tilting the drivewheels properly regains 2 DOF motion by realigning constraint planes.
Fig. 6. Angle and vector definitions for the slip display. The two drive wheels are shown, while the ball (omitted from the figure)is centered at the origin.
coverage of constraint types and effects for ball–wheel systems can be found in Nakamura et al. [2001]and Gillespie et al. [2002].
Applying these principles to the slip display, we can consider the constraints on the ball and determinehow to command desired contact velocities at the fingertip. In general, a ball has 3 DOF in which it canrotate. A wheel in contact with the ball constrains the ball axis of rotation to 2 DOF. The ball axis ofrotation is constrained to lie in the plane defined by the point at the center of the ball and the rotationaxis of the wheel. When two wheels contact the ball, the ball axis of rotation depends on the positionand orientation of the drive wheels. These constraints are illustrated in Figure 5.
Figure 6 shows the wheel positions. The wheel constraints then lead to the following simple relation-ship between ball-fingertip contact point velocity and drive wheel input velocity,
[vxvz
]= η
[sin α sin β cos β
cos β sin α sin β
] [u1u2
], (1)
where vx and vz are the linear velocities of the ball as it passes under the user’s finger, u1 and u2 arethe drive wheel velocities, and η is the ratio of drive wheel radius to ball radius (a “gear ratio”). TheACM Transactions on Applied Perception, Vol. 2, No. 2, April 2005.
160 • R. J. Webster, III et al.
Fig. 9. Subject responses from the slip velocity variation experiment showing average amplitude ratio detection of 30–40% ofthe nominal velocity. The proportion of “varying” responses is the number of “varying” responses divided by the total number ofresponses.
Fig. 10. A screen shot of the virtual environment used in the delicate manipulation task. Users manipulated the paper to thetarget position with the goal of applying minimum force to the tabletop.
table or paper. When the user contacted the paper with at least 1.5 N of vertical force, the paper wouldslide and rotate in the plane of the table, following the user’s motion.
At the start of an experiment, each element of the virtual environment was described to the user, andthe task of translating and rotating the paper from the initial pose to the target pose on the tabletopwas explained. Users were instructed to complete the task in a reasonable amount of time, with theprimary objective of applying minimum force to the virtual tabletop. The user’s finger was then fixedin place via a velcro strap on a small plastic finger rest attached to the front of the slip display. Thisfinger rest maintained the position of the finger over the ball and provided a grip point for the thumband middle finger. Users were then allowed a brief trial period to become acquainted with the virtualenvironment and the task. The trial period lasted for approximately 1 minute with slip feedback and1 minute without slip feedback, and force feedback was provided in both cases.
Users then put on headphones and white noise was played while the task was performed, to en-sure that no auditory information could be obtained from device during operation. Each user thenACM Transactions on Applied Perception, Vol. 2, No. 2, April 2005.
A Novel Two-Dimensional Tactile Slip Display • 161
Fig. 11. (Left) Average force used with and without slip feedback with standard error bars. (Right) A force histogram averageof all users showing the amount of time spent at discrete force intervals under the slip and no slip conditions. The time spentmoving above the table/paper surface is reflected in the large values near 0 N. The vertical line indicates the minimum verticalforce at which the finger stops sliding over the surface of the paper and the paper begins to move.
performed the paper manipulation task twice with slip feedback and twice without. The order in whichthese conditions were presented to each user was randomized, with the constraint that two identicalconditions were never presented as the first two conditions to a given user. The results of 10 users arepresented here.
Analysis of variance (ANOVA) tests were completed to investigate the effect of slip feedback on op-erator performance of the paper manipulation task. Two possible criteria quantifying performanceimprovement are (1) total time to completion and (2) average force applied during the task. Us-ing a significance level of α = 0.05%, we conducted an ANOVA analysis with subject and slip con-dition (with slip and without slip) included as a factors. Subject was included as a factor becausethere was significant difference in both time (p = 0.003) and average force (p = 0.004) betweensubjects.
Average applied force was reduced significantly with slip feedback (p = 0.004), demonstrating thatthe slip sensation improved subjects’ ability to modulate their force accurately, the stated primaryobjective of the experiment. Figure 11 illustrates the average force and standard error for the twofeedback conditions. Although mean completion time was lowered via slip feedback (11.22 s withoutslip and 10.42 s with slip feedback), the difference was not statistically significant (p > 0.05). Weexpect that, with a more complex and longer-duration task, time to completion could become significant.Another interesting way to look at the data is as a force histogram (Figure 11), showing an apparentdifference in the forces users apply near the threshold for moving the paper.
These results, particularly the improved average applied force, demonstrate that the addition of ourslip display to a kinesthetic force feedback device can improve user performance in delicate manipula-tion tasks.
6. CONCLUSIONS AND FUTURE WORK
We have presented a two-dimensional tactile device that displays sliding contact to the user. The slipdisplay, used in conjunction with a force feedback haptic interface (such as the PHANTOM), provides asystem capable of accurately rendering both tactile slip and kinesthetic haptic sensations. Anecdotally,users report that the tactile sensations they feel are effective in simulating slip. More rigorous exper-iments demonstrate that the slip display is able to improve user performance in modulating appliedforce in virtual environments. This shows that the slip display has the potential to improve performancein virtual and teleoperated manipulation of delicate objects, perhaps eventually obtaining performance
ACM Transactions on Applied Perception, Vol. 2, No. 2, April 2005.
example study, part 3
Types of user studies
Stanford University ME 327: Design and Control of Haptic Systems © Allison M. Okamura, 2020

types of haptics human subjects experiments
• system performance: measures human-machine system performance, typically during execution of a specific task
• psychophysics: measures fundamental human capabilities
• ergonomics: measures comfort or effect of system on human health
Stanford University ME 327: Design and Control of Haptic Systems © Allison M. Okamura, 2020

system performance• design and implement system• form hypotheses• determine experiment conditions• select performance metrics• implement experiment conditions• preliminary testing (pilot study)• final experiment (sometimes w/supplementary studies)
• Think carefully about experiment design• “Storyboard”
Stanford University ME 327: Design and Control of Haptic Systems © Allison M. Okamura, 2020

psychophysics
• the scientific study of the relation between stimulus and sensation
• psychophysical methods were covered earlier
Stanford University ME 327: Design and Control of Haptic Systems © Allison M. Okamura, 2020

ergonomics
• we don’t usually study this in haptics research, but this (and human factors) could certainly be relevant
Stanford University ME 327: Design and Control of Haptic Systems © Allison M. Okamura, 2020

process of implementing a user study
Stanford University ME 327: Design and Control of Haptic Systems © Allison M. Okamura, 2020

experiment design considerations
• length of experiment/user fatigue
• location
• subject recruiting (payment?)
• statistical significance (number of users, groups)
• reliability of data; confounding factors
• what constitutes data you can “throw out”?Stanford University ME 327: Design and Control of Haptic Systems © Allison M. Okamura, 2020

experiment procedure• develop a strict experimental procedure (called a
protocol)
• develop a very clear set of instructions for your subjects (written, oral, video)
• develop a questionnaire of relevant information about your subjects
• submit an IRB application; receive approval
• perform experiment and analyze data; document thoroughly (save records)
Stanford University ME 327: Design and Control of Haptic Systems © Allison M. Okamura, 2020

IRB procedure• any project involving human subjects must be
cleared by an IRB before research begins (sometimes this is an exemption)
• this presentation covers non-medical human subject experiments for expedited review
• experiments that qualify for expedited review are those with minimum risk to subjects.
http://humansubjects.stanford.eduStanford University ME 327: Design and Control of Haptic Systems © Allison M. Okamura, 2020

IRBThe primary concerns of the IRB in all deliberations is to determine that:
1. the rights and welfare of the subjects are protected adequately,
2. the risks to subjects are outweighed by the potential benefits of the research,
3. the selection of subjects is equitable, and
4. informed consent will be obtained and, when appropriate, documented.
Stanford University ME 327: Design and Control of Haptic Systems © Allison M. Okamura, 2020
deciding whether or how to apply• if a project involves human subjects and research, you
must complete an application for one of these forms of clearance:
–an exemption issued by the IRB
–IRB approval based on an expedited review–IRB approval based on a full-board review
• study is qualified for an expedited review if it presents no more than minimum risk to subjects and falls under one of the categories listed by DHHS and FDA
• exemption and expedited review typically take one month
Stanford University ME 327: Design and Control of Haptic Systems © Allison M. Okamura, 2020

expedited reviewTo complete an application, you must submit
1. IRB Application: A general application form stating the purpose, design, and procedure of the human subject experiment you want to run. Include any forms/surveys you will have the subjects fill out.
2. Consent Form: A form for subjects to sign that makes sure they understand the risks, benefits and procedure of the experiment and agree to be a subject.
3. Recruitment Methods: A copy of what you will send out to your target audience in order to get them to participate.
Stanford University ME 327: Design and Control of Haptic Systems © Allison M. Okamura, 2020

expedited review, cont’d
4. List of Team Members and Certification of Training: After taking the human subject training test, a copy of certification is needed for each experimenter
5. Copy of Grant Proposal: You must include this if the research is funded or proposed to be funded
Stanford University ME 327: Design and Control of Haptic Systems © Allison M. Okamura, 2020

things to consider when writing your application
• know your audience The people reading this are not engineers, but typically psychologists or sociologists. Give a brief but clear background of what you are trying to do. Make sure acronyms are spelled out.
• recruiting Your recruiting has to reach a large population in order to get a representative sampling of volunteers. Check for representation in terms of race, gender, experience. Better if recruiting is not done by a supervisor (who might make volunteers feel pressured into participating).
Stanford University ME 327: Design and Control of Haptic Systems © Allison M. Okamura, 2020

• safety Emphasize the safety of your experiments. It is wise to schedule in a rest time if a session is long or strenuous.
• certification The person submitting the application and anyone running the experiments must be certified. The Training and Certification Test is available at https://www.citiprogram.org/
things to consider when writing your application
Stanford University ME 327: Design and Control of Haptic Systems © Allison M. Okamura, 2020

approval typically lasts for one year, then it has
to be renewed
no protocol changes, consent form changes,
amendments, or addenda may be made without re-review and
approval
Stanford University ME 327: Design and Control of Haptic Systems © Allison M. Okamura, 2020

general experiment planning• 6 weeks or more before experiment:
- do human subjects training - write IRB application and edit
• 5 weeks (or more): - submit IRB application
• 2 weeks (or more): - have complete system working - go through procedure with "expert" subject - revise experiment (get pilot data and modify system parameters as needed)
• 1 week (or more): - send out recruitment notices and schedule subjects
Stanford University ME 327: Design and Control of Haptic Systems © Allison M. Okamura, 2020