submission of environmental management plans for …
TRANSCRIPT
11
Project Reference: 733.08016.00001 File Ref. Letter to MET_ECC submission and Reports
6 January 2019
Ministry of Environment and Tourism
Directorate of Environmental Affairs
Private Bag 13346
Windhoek
Namibia
ATTENTION: Deputy Environmental Commissioner: Dr. Freddy Sikabongo
Dear Dr. Sikabongo
SUBMISSION OF ENVIRONMENTAL MANAGEMENT PLANS FOR HENNING CRUSHER BRICK MAKING FACTORY IN ONDANGWA, OSHANA REGION.
INTRODUCTION 1.
The Henning Crusher (Pty) Ltd’s Brick making factory is located approximately 2 km north-west of Ondangwa city center in an
industrial area and can be accessed via the C46 main road (refer to figure 1 below for map). The brick making factory produces
and supplies bricks to various (commercial and non- commercial) clients in the north east and west of Namibia. The factory
produces approximately 2,250 000 bricks per month and employs 73 number of people on its premises. The factory was
constructed within a semi-enclosed warehousing with bunded floors and depends on electricity for its operations. The process
for producing bricks from crusher dust and sand that is delivered by train requires no drying or firing processes as is the case
with the traditional method of brick manufacturing. This process includes mixing of crusher dust and sand with cement and
water, and then moulding it without applying pressure.
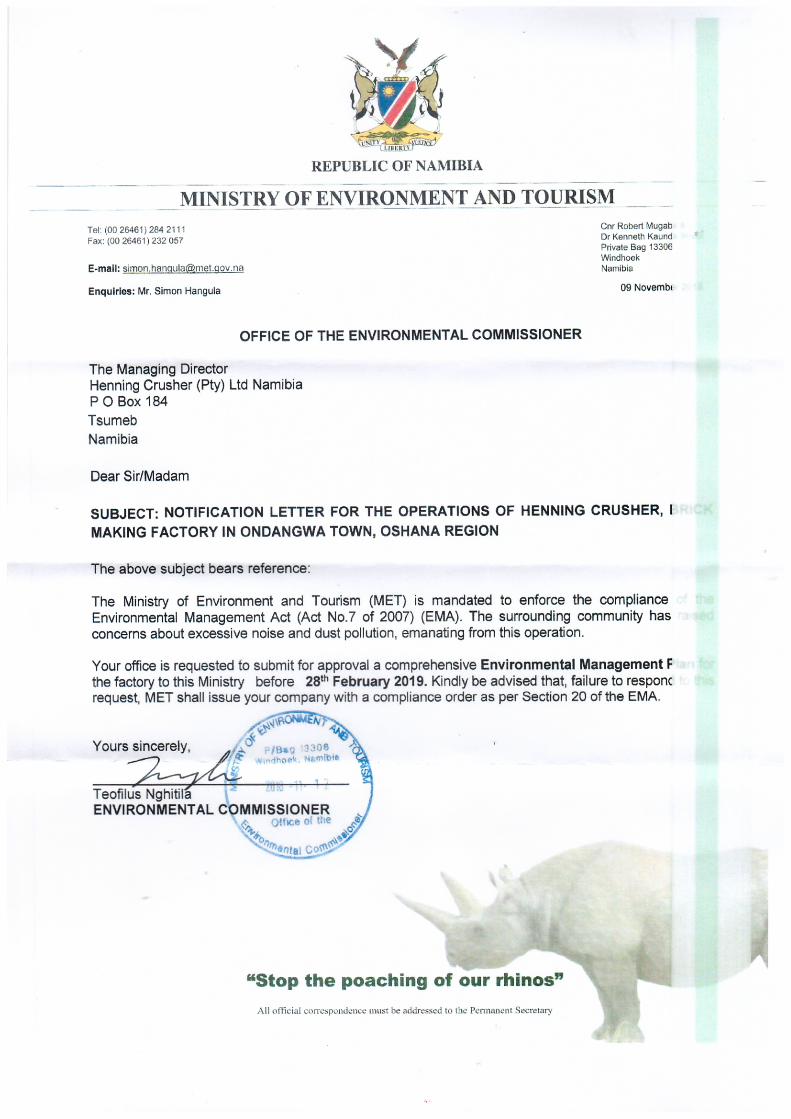
With reference to the notification letter dated the 12th
of November 2018 (Appendix A), requesting the Brick Making Factory in
Ondangwa, to submit an Environmental Management Plan (EMP) for approval related to the Noise and Dust aspect raised as a
concern. We would like to highlight the following information and submit corresponding reports as appendices for approval:
Specialists Study for the Noise and Dust aspect have been undertaken. Mitigations and Management measures have
been raised and compiled as EMPs in the corresponding Reports for the Noise and Dust aspects; these are attached
as (Appendices B and C).
An application form for an Environmental Clearance Certificate (ECC) have been completed and shall be submitted
with this letter to your office and uploaded on the EIA portal.
We hope you take into consideration the above mentioned and attached reports for your review and approval.

Project Reference: 733.08016.00001 Page 2 File Ref. Letter to MET_ECC submission and Reports
Please don’t hesitate to contact me shall you require further clarity.
Looking forward to your responses soonest.
Kind regards
[Marvin Sanzila]
Project Manager

Project Reference: 733.08016.00001 Page 3 File Ref. Letter to MET_ECC submission and Reports
Figure 1: Henning Crusher (PTY) Ltd Brick Making Factory locality Map in Ondangwa.
Project Reference: 733.08016.00001 Page 4 File Ref. Letter to MET_ECC submission and Reports
APPENDIX A: MET’S NOTIFICATION LETTER FOR OPERATIONS OF HENNING CRUSHER
Project Reference: 733.08016.00001 Page 5 File Ref. Letter to MET_ECC submission and Reports
APPENDIX B: HENNING CRUSHER’S BRICK MAKING FACTORY IN ONDANGWA, DUST MANAGEMENT PLAN

Project Reference: 733.08016.00001 Page 6 File Ref. Letter to MET_ECC submission and Reports
APPENDIX C: HENNING CRUSHER BRICK MAKING FACTORY IN ONDANGWA, BASELINE ENVIRONMENTAL NOISE ASSESSMENT

11

11
APPENDIX B: HENNING CRUSHER’S BRICK MAKING FACTORY IN ONDANGWA, DUST MANAGEMENT PLAN
Address: 480 Smuts Drive, Halfway Gardens | Postal: P O Box 5260, Halfway House, 1685 Tel: +27 (0)11 805 1940 | Fax: +27 (0)11 805 7010
www.airshed.co.za
Report No: 18SLR21 | Date: August 2019
Henning Crusher Ondangwa, Namibia: Dust Management Plan
Project done for SLR Environmental Consulting (Namibia) (Pty) Ltd
Project Compiled by: Hanlie Liebenberg-Enslin

Henning Crusher Ondangwa, Namibia: Dust Management Plan
Report Number: 18SLR21 i
Report Details
Report Title Henning Crusher Ondangwa, Namibia: Dust Management Plan
Applicant Henning Crusher (Pty) Ltd
Client SLR Environmental Consulting (Namibia) (Pty) Ltd
Report Number 18SLR21
Report Version Final Rev0
Date August 2019
Prepared by Hanlie Liebenberg-Enslin, PhD (University of Johannesburg
Reviewed by Nick Grobler, (BEng Hons. (Chem. Eng.), UP)
Notice
Airshed Planning Professionals (Pty) Ltd is a consulting company located in Midrand, South Africa, specialising in all aspects of air quality, ranging from nearby neighbourhood concerns to regional air pollution impacts as well as noise impact assessments. The company originated in 1990 as Environmental Management Services, which amalgamated with its sister company, Matrix Environmental Consultants, in 2003.
Declaration Airshed is an independent consulting firm with no interest in the project other than to fulfil the contract between the client and the consultant for delivery of specialised services as stipulated in the terms of reference.
Copyright Warning
Unless otherwise noted, the copyright in all text and other matter (including the manner of presentation) is the exclusive property of Airshed Planning Professionals (Pty) Ltd. It is a criminal offence to reproduce and/or use, without written consent, any matter, technical procedure and/or technique contained in this document.
Revision Record
Version Date Section(s) Revised Summary Description of Revision(s)
Final Rev0 August 2019 Entire report Submitted to client for review
Henning Crusher Ondangwa, Namibia: Dust Management Plan
Report Number: 18SLR21 ii
Specialist Declaration
I, Hanlie Liebenberg-Enslin, as the appointed independent air quality specialist for the proposed Henning Crusher Project,
hereby declare that I:
• acted as the independent specialist in this Environmental Clearance Certificate application;
• performed the work relating to the application in an objective manner;
• regard the information contained in this report as it relates to my specialist input/study to be true and correct,
• do not have and will not have any financial interest in the undertaking of the activity, other than remuneration for
work performed in terms of the Environmental Impact Assessment;
• declare that there are no circumstances that may compromise my objectivity in performing such work;
• have expertise in conducting the specialist report relevant to this application;
• have no, and will not engage in, conflicting interests in the undertaking of the activity;
• have no vested interest in the proposed activity proceeding;
• undertake to disclose to the applicant and the competent authority all material information in my possession that
reasonably has or may have the potential of influencing the decision of the competent authority; and
• all the particulars furnished by us in this specialist input/study are true and correct.
Signature of the specialist:
Name of Specialists: Hanlie Liebenberg-Enslin
Date: 5 August 2019

Henning Crusher Ondangwa, Namibia: Dust Management Plan
Report Number: 18SLR21 iii
Abbreviations
Airshed Airshed Planning Professionals (Pty) Ltd
AQGs Air Quality Guidelines
ASTM American Standard Test Method
DEA Department of Environmental Affairs
EC European Commission
IFC International Finance Corporation
IT Interim target
LMo Monin Obukhov Length
MET Ministry of Environment and Tourism
MM5 The MM5 model is an acronym for the Fifth-Generation NCAR / Penn State Mesoscale Model, which is a limited-area, non-hydrostatic, terrain-following sigma-coordinate model designed to simulate or predict mesoscale and regional-scale atmospheric circulation
NAAQS National Ambient Air Quality Standard
ND No data
NDCR National Dust Control Regulations
NPI National Pollutant Inventory (Australia)
PM2.5 Particulate Matter with an aerodynamic diameter of less than 2.5m
PM10 Particulate Matter with an aerodynamic diameter of less than 10m
SA South Africa
SABS South African Bureau of Standards
SEA Strategic Environmental Assessment
TSP Total Suspended Particles
US EPA United States Environmental Protection Agency
WBG World Bank Group
WHO World Health Organisation
Henning Crusher Ondangwa, Namibia: Dust Management Plan
Report Number: 18SLR21 iv
Units
°C Degree Celsius
km kilometre
m metres
mm millimetre
mg/m²/day milligram per square metre per day
t tonne
tpa tonnes per annum
tpm tonnes per month
µg/m³ microgram per cubic metre
% percent

Henning Crusher Ondangwa, Namibia: Dust Management Plan
Report Number: 18SLR21 v
Glossary
Air pollution: means any change in the composition of the air caused by smoke, soot, dust (including fly ash), cinders, solid
particles of any kind, gases, fumes, aerosols and odorous substances.
Atmospheric emission: means any emission or entrainment process emanating from a point, non-point or mobile sources
that result in air pollution.
Averaging period: This implies a period of time over which an average value is determined.
Dust: Solid materials suspended in the atmosphere in the form of small irregular particles, many of which are microscopic in
size.
Frequency of Exceedance: A frequency (number/time) related to a limit value representing the tolerated exceedance of that
limit value, i.e. if exceedances of limit value are within the tolerances, then there is still compliance with the standard.
Particulate Matter (PM): These comprise a mixture of organic and inorganic substances, ranging in size and shape and can
be divided into coarse and fine particulate matter. The former is called Total Suspended Particulates (TSP), whilst PM10 and
PM2.5 fall in the finer fraction referred to as Inhalable particulate matter.
TSP: Total suspended particulates refer to all airborne particles and may have particle sizes as large as 150 µm, depending
on the ability of the air to carry such particles. Generally, suspended particles larger than 75 to 100 micrometre (µm) do not
travel far and deposits close to the source of emission.
PM10: Thoracic particulate matter is that fraction of inhalable coarse particulate matter that can penetrate the head airways
and enter the airways of the lung. Also referred to as PM10, it consists of particles with a mean aerodynamic diameter of 10 µm
or smaller, and deposit efficiently along the airways. Particles larger than a mean size of 10 µm are generally not inhalable
into the lungs. These particles are typically found near roadways and dusty industries.
PM2.5: Respirable particulate fraction is that fraction of inhaled airborne particles that can penetrate beyond the terminal
bronchioles into the gas-exchange region of the lungs. Also known as fine particulate matter, it consists of particles with a
mean aerodynamic diameter equal to or less than 2.5 µm (PM2.5) that can be inhaled deeply into the lungs. These particles
can be directly emitted from sources such as forest fires, or they can form when gases emitted from power plants, industries
and automobiles react in the air.
Vehicle entrainment: This is the lifting and dropping of particles by the rolling wheels leaving the road surface exposed to
strong air current in turbulent shear with the surface. The turbulent wake behind the vehicle continues to act on the road
surface after the vehicle has passed.

Henning Crusher Ondangwa, Namibia: Dust Management Plan
Report Number: 18SLR21 vi
Executive Summary
Airshed Planning Professionals (Pty) Ltd (Airshed) was appointed by SLR Environmental Consulting (Namibia) (Pty) Ltd to
develop a Dust Management Plan for Henning Crusher in Ondangwa, Namibia. The operations at Henning Crusher is primarily
the manufacturing of bricks. The aim of the investigation was to assess the current air quality within the vicinity of the facility
and to provide recommendations on mitigation measures to be implemented at Henning Crusher to reduce dust emissions
from the facility.
The main findings from the assessment are as follows:
Atmospheric conditions
• Weather data for Ondangwa was obtained from MM5 simulated database for the year 2018.
• The wind field is dominated by winds from the east to northeast, as well as the southwest. The period average wind
speed for 2018 was 2.7 m/s, with calm conditions prevailing for 15% of the time. Higher wind speeds occurred during
the day, with a maximum wind speed of 9.6 m/s. Wind speeds exceeding 5 m/s occurred for 4.7% of the time and
were mostly from the east, northeast and southwest.
• Seasonal variation in the wind field indicated more frequent easterly to north-northwesterly flow during the summer
months with a shift to dominant easterly to north-easterly winds during the autumn months. Winter showed similar
wind fields to autumn with more frequent southwesterly winds which increased in frequency during the spring
months.
• Maximum, minimum, and mean temperatures were given as 35°C, 8.5°C and 23.5°C respectively, based on
modelled MM5 data for the period 2018.
• Based on the MM5 modelled data, the area received between 0 mm and 472 mm of rain over the one year (2018),
with the highest rainfall during the summer months.
Site description
• Potential sources of air pollution in the area include the railway to the east, the national road (C46) directly to the
south and other commercial operations around the site with an airstrip located to the west-northwest
• Identified sensitive receptors near Henning Crusher include a kindergarten to the west, temporary housing to the
north, a residential area to the south and the town’s residential area further away to the southwest.
Dust fallout and air quality impacts
• A dustfall monitoring network, following the ASTM D1739 method, was installed in January 2019 at four (4) locations
around the site, referenced as No.1, No.2, No.3 and No.4.
• Dust fallout collected at No. 1 and No. 4 dustfall units is screened against the residential limit of 600 mg/m²/day
since these are near a kindergarten and house, whereas No. 2 and No. 3 are screened against the non-residential
limit of 1 200 mg/m²/day.
• Dustfall rates over the three-month period (Feb – Apr’19) were highest at No.1, exceeding the residential limit for
two months and resulting in the highest average dustfall rate over the three months. No. 3 exceeded the non-
residential limit for one month and had the second highest average dustfall rate over the three months.

Henning Crusher Ondangwa, Namibia: Dust Management Plan
Report Number: 18SLR21 vii
• The main sources of dust generation at Henning crusher include vehicle entrainment on the unpaved on-site roads;
material transfer points (off-loading of sand and crusher dust, and FEL loading the materials into the mixer bins);
screening of sand; and windblown dust from the sand stockpiles, crusher dust stockpiles and dusty exposed
surfaces. Vehicle entrainment on the on-site roads resulted in the highest dust emissions, with windblown dust the
lowest.
• PM10 concentrations were modelled using SCREEN3 model which simulates only hourly concentrations using
various stability classes. Annual and 24-hour average concentrations were calculated to determine the potential for
impacts at the various sensitive receptors. Two scenarios were modelled with one reflecting the average emissions
from the site and the second, the highest emissions from the site – assuming windblown dust would occur
continuously (it would in reality only occur when the wind speeds exceed 5 m/s, which is 4.7% of the time).
• The maximum impact from the Henning Crusher operations are at a distance of between 60 m and 120 m, reducing
significantly at further distances.
• The PM10 24-hour concentrations exceeded the limit of 75 µg/m³ at all the sensitive receptors but were below the
annual limit of 40 µg/m³ at all receptors. These modelled concentrations are regarded conservative and worse case.
• Windblown dust could have a significant impact when it happens, and the kindergarten is the receptor that will be
affected the most.
Recommendations
The implementation of emission controls for the management of significant emission sources at Henning Crusher operations
is recommended. These include:
• On-site roads at Henning Crusher – wet suppression is recommended since the roads are used for relatively short
durations at a time. It is further recommended that the areas be kept clean by sweeping or spraying it with water. A
minimum control efficiency of 75% is required.
• Material handling points – the recommended mitigation is to use water sprays at the sand and crusher dust
stockpiles, and to keep the drop heights to a minimum. The target control efficiency of these dust suppression
procedures should be at least 50%.
• Screening operations – the water sprays applied to the sand materials handling points at the sand stockpile should
also reduce dust emission from the screening.
• Windblown dust – a water spray system to maximise control efficiency in combination with a netting fence along the
western side of the facility along the sand stockpile area is recommended. A 50% control efficiency is required.
• Should dust fallout rates at the kindergarten not reduce after these mitigation measures have been implemented, it
is recommended that a PM10 sampling campaign be conducted at the kindergarten to determine the inhalable dust
concentrations.

Henning Crusher Ondangwa, Namibia: Dust Management Plan
Report Number: 18SLR21 i
Table of Contents
1 INTRODUCTION ................................................................................................................................................. 1
1.1 Terms of Work ........................................................................................................................................................ 1
1.2 Project Description ................................................................................................................................................. 2
1.3 Assumptions, Exclusions and Limitations ............................................................................................................... 2
2 LEGAL OVERVIEW ............................................................................................................................................ 4
2.1 Namibian Legislation .............................................................................................................................................. 4
2.2 International Criteria ............................................................................................................................................... 5
2.2.1 WHO Air Quality Standards ............................................................................................................................... 5
2.2.2 SA National Ambient Air Quality Standards ....................................................................................................... 6
2.2.3 Dustfall Limits .................................................................................................................................................... 7
2.3 International Conventions ....................................................................................................................................... 7
2.3.1 Degraded Airsheds or Ecological Sensitive Areas ............................................................................................ 8
2.3.2 Fugitive Source Emissions ................................................................................................................................ 8
2.4 Recommended Guidelines and Targets ................................................................................................................. 8
3 DESCRIPTION OF THE RECEIVING ENVIRONMENT ............................................................................................. 10
3.1 Site Description .................................................................................................................................................... 10
3.2 Atmospheric Dispersion Potential ......................................................................................................................... 10
3.2.1 Surface Wind Field .......................................................................................................................................... 10
3.2.2 Temperature .................................................................................................................................................... 13
3.2.3 Precipitation ..................................................................................................................................................... 14
3.2.4 Atmospheric Stability ....................................................................................................................................... 14
4 DUSTFALL RESULTS ...................................................................................................................................... 16
4.1 Existing Sources of Emissions in the Area ........................................................................................................... 16
4.2 Baseline Dustfall Monitoring ................................................................................................................................. 16
5 EXPECTED AMBIENT AIR QUALITY IMPACTS .................................................................................................... 19
5.1 Emissions Quantification ...................................................................................................................................... 19
5.1.1 Vehicle entrainment on road surfaces ............................................................................................................. 19
5.1.2 Material transfer points .................................................................................................................................... 19
5.1.3 Screening ......................................................................................................................................................... 19
5.1.4 Wind-blown dust .............................................................................................................................................. 19
5.1.5 Emission Rate Summary ................................................................................................................................. 21
5.2 Qualitative Assessment ........................................................................................................................................ 21
5.2.1 Potential for impacts from Henning Crusher operations .................................................................................. 22
5.3 Main Findings ....................................................................................................................................................... 23
6 DUST MANAGEMENT PLAN ............................................................................................................................. 25
6.1 Source ranking ..................................................................................................................................................... 25
6.2 Source Specific Recommended Management and Mitigation Measures ............................................................. 25
6.2.1 On-site roads ................................................................................................................................................... 25
6.2.2 Materials handling ............................................................................................................................................ 26
6.2.3 Screening ......................................................................................................................................................... 26
6.2.4 Windblown dust ............................................................................................................................................... 27
6.3 Performance Indicators ........................................................................................................................................ 27
6.3.1 Performance thresholds ................................................................................................................................... 28

Henning Crusher Ondangwa, Namibia: Dust Management Plan
Report Number: 18SLR21 ii
6.3.2 Source based Performance Indicators ............................................................................................................ 28
6.3.3 Receptor based Performance Indicators ......................................................................................................... 28
7 REFERENCES ................................................................................................................................................. 29
List of Tables
Table 1: Brick making activities resulting in air pollution ........................................................................................................... 2
Table 2: International assessment criteria for criteria pollutants ................................................................................................ 6
Table 3: Bands of dustfall rates ................................................................................................................................................. 7
Table 4: Proposed evaluation criteria for Henning Crusher ....................................................................................................... 9
Table 5: Atmospheric stability classes ..................................................................................................................................... 15
Table 6: Dustfall sampling locations ........................................................................................................................................ 16
Table 7: Dustfall rates over the period February to April 2019 (highlighted cells indicate an exceedance of the limit) ........... 17
Table 8: Emission factors used to quantify fugitive dust emissions from Henning Crusher operations ................................... 20
Table 9: Calculated emissions from Henning Crusher operations ........................................................................................... 21
Table 10: Simulated PM10 24-hour and annual average inferred concentrations at the sensitive receptors ........................... 23
Table 11: On-site roads – Dust Suppression Improvement Plan ............................................................................................. 25
Table 12: Materials handling – Dust Suppression Improvement Plan .................................................................................... 26
Table 13: Screening – Dust Suppression Improvement Plan ................................................................................................. 26
Table 13: Windblown dust – Dust Suppression Improvement Plan ........................................................................................ 27
List of Figures
Figure 1: Location of the Henning Crusher facility .................................................................................................................... 3
Figure 2: Henning Crusher dustfall network and sensitive receptors ....................................................................................... 11
Figure 3: Period, day- and night-time wind roses based on modelled MM5 data for Ondangwa (2018) ................................. 12
Figure 4: Seasonal wind roses based on modelled MM5 data for modelled MM5 data for Ondangwa (2018) ...................... 12
Figure 5: Wind frequency classes for the year 2018. ............................................................................................................... 13
Figure 6: Daily average temperatures based on modelled MM5 data for Ondangwa (2018) ................................................. 13
Figure 7: Average rainfall based on modelled MM5 data for Ondangwa (2018) .................................................................... 14
Figure 8: Dust fallout unit according to the ASTM D1739-98 method design ......................................................................... 17
Figure 9: Graphic representation of the dustfall rates over the period February to April 2019 ................................................ 18
Figure 10: Box-and-whisker plot of on-site dustfall for the period February to April 2019 ....................................................... 18
Figure 11: Impact distance due to Henning Crusher operations assuming average emissions ............................................. 22
Figure 12: Impact distance due to Henning Crusher operations assuming worst case emissions ......................................... 22

Henning Crusher Ondangwa, Namibia: Dust Management Plan
Report Number: 18SLR21 1
1 INTRODUCTION
Henning Crusher, located to the north-west of the town of Ondangwa, is an existing brickmaking facility. Operations mainly
include loading and transport of material, stockpiling and brick making.
Airshed Planning Professionals (Pty) Ltd (Airshed) was appointed by SLR Environmental Consulting (Namibia) (Pty) Ltd to
develop a Dust Management Plan for Henning Crusher. The aim of the investigation is to assess the current air quality within
the vicinity of the facility and to provide recommendations on mitigation measures to be implemented at Henning Crusher to
reduce dust emissions from the facility. To achieve this, a good understanding of the regional climate and local dispersion
potential of the site is necessary and subsequently an understanding of existing sources of air pollution in the region and the
resulting impact on air quality.
The investigation followed the methodology required for a specialist baseline report, including collection of dust fallout,
quantification of dust emissions at the facility, identifying the main sources of dust emissions and provide implementable
mitigation measures.
1.1 Terms of Work
Based on the scope of work the following tasks were conducted:
1. A review of available detailed information.
2. Development of a Dust Management Plan, including
a. Install a minimum of four (4) single dust fallout units to collect dust on a monthly basis.
b. Conduct a site visit to identify air quality sensitive receptors and to get an understanding of other dust generating
sources in the vicinity of the crusher operations.
c. A study of atmospheric dispersion potential by referring to available weather records or simulated hourly
sequential meteorological data for a period of at least one year.
d. A review of legal requirements such as emission limits and dust control regulations.
e. Analysis of available ambient air quality data.
f. Establishment an atmospheric emissions inventory for the Henning Crusher operations. Pollutants quantified
are limited to particulate matter (TSP, PM10 and PM2.5). Use was made of international accepted methods such
as emissions factors published by the United States Environmental Protection Agency (US EPA) and Australian
National Pollutant Inventory (NPI).
g. Conduct a screening assessment using the US EPA SCREEN3 model to determine the potential impacts from
the brick making operations.
h. Rank source contributions based on emission strengths and potential impact significance.
i. Compile a Dust Management Plan

Henning Crusher Ondangwa, Namibia: Dust Management Plan
Report Number: 18SLR21 2
1.2 Project Description
The procedure for producing bricks from crusher dust and sand is understood to require no drying or firing processes as is the
case with the traditional method of brick manufacturing. This process includes mixing of crusher dust and sand with cement
and water, and then moulding it without applying pressure.
Air pollution associated with the brick making process includes air emissions emitted during the transport of the raw materials
to site, the of-loading and handling thereof, and the mixing of materials. A summary of the activities and associated air
pollutants are provided in Table 1.
Table 1: Brick making activities resulting in air pollution
Activity Associated pollutants
Trucks delivering sand to site mostly PM(a), gaseous emissions from truck exhaust (SO2; NOx; CO; CO2(b))
Train delivering crusher dust to site mostly PM, gaseous emissions from train (assuming it’s a diesel locomotive) and
equipment (SO2; NOx; CO; CO2)
Front-end-Loader (FEL) moving sand and
crusher dust to the mixer bins
mostly PM, gaseous emissions from front-end-loader (FEL) exhaust (SO2; NOx; CO;
PM, CO2)
Windblown dust from the sand stockpiles and
exposed surfaces
PM (TSP, PM10 and PM2.5)
Trucks collecting product (bricks) from site mostly PM, gaseous emissions from FEL exhaust (SO2; NOx; CO; CO2)
Notes: (a) Particulate matter (PM) comprises a mixture of organic and inorganic substances, ranging in size and shape and can be divided
into coarse and fine particulate matter. Total Suspended Particulates (TSP) represents the coarse fraction >10m, with particulate
matter with an aerodynamic diameter of less than 10m (PM10) and particulate matter with an aerodynamic diameter of less than
2.5m (PM2.5) falling into the finer inhalable fraction. TSP is associated with dust fallout (nuisance dust) whereas PM10 and PM2.5
are considered a health concern.
(b) CO2 is a greenhouse gas (GHG).
The main pollutant of concern from the operations at Henning Crusher is particulate matter (PM) and this is the focus of this
study.
1.3 Assumptions, Exclusions and Limitations
The main assumptions, exclusions and limitations are summarized below:
• Meteorological data: to our knowledge is there no weather station in Ondangwa, and use was made of modelled
MM5 meteorological data for the area for the year 2018.
• Ambient monitoring data: three months of dustfall data from four dustfall units at the Henning Crusher facility were
available for analysis and this is regarded sufficient to provide an indication of the dust impacts from the operations
on the surrounding environment.
• Modelled results: PM10 concentrations were modelled using the SCREEN3 model which simulates only hourly
concentrations using various stability classes. These concentrations are regarded to be conservative. In order to
compare to the modelled results to the relevant guidelines, the Beychok method was used to convert hourly
exposures to inferred highest daily- and annual averages, and this method always provides the highest inferred
value (Beychok, 2005). Thus, the modelled results can be regarded as conservative.

Henning Crusher Ondangwa, Namibia: Dust Management Plan
Report Number: 18SLR21 3
Figure 1: Location of the Henning Crusher facility
Henning Crusher Ondangwa, Namibia: Dust Management Plan
Report Number: 18SLR21 4
2 LEGAL OVERVIEW
Prior to assessing the potential impacts from the Henning Crusher operations on the surrounding environment and human
health, reference needs to be made to the environmental regulations and guidelines governing the emissions and impact of
such activities. Ambient air quality guidelines/limits for particulate matter is discussed in the following sections to provide an
indication of the risk associated with the pollutants of concern.
Air quality guidelines and standards are fundamental to effective air quality management, providing the link between the source
of atmospheric emissions and the user of that air at the downstream receptor site. Air quality guidelines and standards are
based on benchmark concentrations that normally indicate safe daily exposure levels for the majority of the population,
including the very young and the elderly, throughout an individual’s lifetime. Benchmark concentrations could therefore be
based on health effects, such as SO2 or carcinogenic consequences, such as benzene.
Air quality guidelines and standards are normally given for specific averaging or exposure periods and are evaluated as the
observed air concentration expressed as a fraction of a benchmark concentration. A standard, as opposed to a benchmark
concentration only, is a set of instructions which include a limit value and may contain a set of conditions to meet this limit
value. Standards are normally associated with a legal requirement as implemented by the country’s relevant authority;
however, organisations such as the World Bank (WB) International Finance Corporation (IFC) and private companies also
issue standards for internal compliance. The benchmark concentrations issued by the World Health Organisation (WHO), on
the other hand, are not standards, but rather guidelines that may be considered for use as limit values in standards.
A common condition included in a standard is the allowable frequency of exceedances of the limit value. The frequency of
exceedances recognises the potential for unexpected meteorological conditions coupled with emission variations that may
result in outlier air concentrations and would normally be based on a percentile, typically the 99 th percentile.
Standards are normally issued for criteria pollutants, i.e. those most commonly emitted by industry including SO2, NO2, CO,
PM10 and PM2.5, but may also include secondary pollutants such as O3. Some countries include other pollutants, specifically
when these are considered to be problematic emissions.
In addition to ambient air quality standards or guidelines, emission limits aim to control the amount of pollution from a point
source1. Emissions to air should be avoided or controlled according to Good International Industry Practice (GIIP) applicable
to the specific industry sector (IFC, 2007).
Namibia does not have air quality guidelines or limits, and for the purpose of the current study, reference was made to
international ambient air quality guidelines and standards. The World Health Organisation (WHO) is widely referenced and
since South Africa, a neighbouring country with similar environmental and socio-economic conditions, has recently developed
air quality standards, these were included. This is discussed in the following sub sections.
2.1 Namibian Legislation
The Atmospheric Pollution Prevention Ordinance (No. 11 of 1976) deals with the following:
Part I : Appointment and powers of officers;
Part II : Control of noxious or offensive gases;
Part III : Atmospheric pollution by smoke;
Part IV : Dust control;
1 Point sources are discrete, stationary, identifiable sources of emissions that release pollutants to the atmosphere (IFC, 2007).
Henning Crusher Ondangwa, Namibia: Dust Management Plan
Report Number: 18SLR21 5
Part V : Pollution of the atmosphere by gases emitted by vehicles;
Part IV : General provisions; and
Schedule 2: Scheduled processes.
The Ordinance does not include any ambient air standards with which to comply, but opacity guidelines for smoke are provided
under Part III. It is implied that the Director2 provides air quality guidelines for consideration during the issuing of Registration
Certificates, where Registration Certificates may be issued for “Scheduled Processes” which are processes resulting in
noxious or offensive gases and typically pertain to point source emissions. To our knowledge no Registration Certificates have
been issued in Namibia. However, an Environmental Clearance Certificate is required for any activity entailing a scheduled
process as referred to in the Atmospheric Pollution Prevention Ordinance, 1976.
The operations at Henning Crusher do not fall under a Scheduled Process.
Also, the Ordinance defines a range of pollutants as noxious and offensive gases, but no ambient air quality guidelines or
standards or emission limits are provided for Namibia.
Part II of the Ordinance pertains to the regulation of noxious or offensive gases. The Executive Committee may declare any
area a controlled area for the purpose of this Ordinance by notice in the Official Gazette. Any scheduled process carried out
in a controlled area must have a current registration certificate authorising that person to carry on that process in or on that
premises.
The recently published Public and Environmental Health Act 1 of 2015 provides “a framework for a structured uniform public
and environmental health system in Namibia; and to provide for incidental matters”. The act identifies health nuisances, such
as chimneys sending out smoke in quantities that can be offensive, injurious or dangerous to health and liable to be dealt with.
2.2 International Criteria
Typically, when no local ambient air quality criteria exist, or are in the process of being developed, international criteria are
referenced. This serves to provide an indication of the severity of the potential impacts from proposed activities. The most
widely referenced international air quality criteria are those published by the World Bank Group (WBG), the WHO, and the
European Community (EC). The South African (SA) National Ambient Air Quality Standards (NAAQS) are also referenced
since it is regarded representative indicators for Namibia due to the similar environmental, social and economic characteristics
between the two countries.
2.2.1 WHO Air Quality Standards
Air Quality Guidelines (AQGs) were published by the WHO in 1987 and revised in 1997. Since the completion of the second
edition of the AQGs for Europe, which included new research from low-and middle-income countries where air pollution levels
are at their highest, the WHO has undertaken to review the accumulated scientific evidence and to consider its implications
for its AQGs. The result of this work is documented in ‘Air Quality Guidelines – Global Update 2005’ in the form of revised
guideline values for selected criteria air pollutants, which are applicable across all WHO regions.
Given that air pollution levels in developing countries frequently far exceed the recommended WHO AQGs, interim target (IT)
levels were included in the update. These are in excess of the WHO AQGs themselves, to promote steady progress towards
2 Director means the Director of Health Services of the Administration, and, where applicable, includes any person who, in terms of any authority granted to him under section 2(2) or (3) of the Ordinance.

Henning Crusher Ondangwa, Namibia: Dust Management Plan
Report Number: 18SLR21 6
meeting the WHO AQGs (WHO, 2005). There are two or three interim targets depending on the pollutant, starting at WHO
interim target-1 (IT-1) as the most lenient and IT-2 or IT-3 as more stringent targets before reaching the AQGs. The SA NAAQS
are, for instance, in line with IT-1 for SO2 and IT-3 targets for PM10 and PM2.5. It should be noted that the WHO permits a
frequency of exceedance of 1% per year (4 days per year) for 24-hour average PM10 and PM2.5 concentrations. These are
provided in Table 2 for the pollutants considered in this study.
2.2.2 SA National Ambient Air Quality Standards
The South African Bureau of Standards (SABS) assisted the (SA) Department of Environmental Affairs (DEA) in the
development of ambient air quality standards for criteria pollutants. NAAQS were determined based on international best
practice for SO2, NO2, PM2.5, PM10, O3, CO, Pb and benzene.
The final revised SA NAAQSs were published in the Government Gazette on 24 of December 2009 and included a margin of
tolerance (i.e. frequency of exceedance) and with implementation timelines linked to it. SA NAAQSs for PM2.5 were published
on 29 July 2012. As mentioned previously, SA NAAQS closely follow WHO interim targets, which are targets for developing
countries, for PM2.5 and PM10. SA NAAQS referred to in this study are also given in Table 2.
Table 2: International assessment criteria for criteria pollutants
Pollutant Averaging Period WHO Guideline Value
(µg/m³)
South Africa NAAQS (µg/m³)
Particulate Matter (PM10) 1-year
24-hour
70 (IT-1)
50 (IT-2)
30 (IT-3)
20 (guideline)
150 (IT-1)
100 (IT-2)
75 (IT-3)
50 (guideline)
40 (a)(b)
75 (b)
Particulate Matter (PM2.5) 1-year
24-hour
35 (IT-1)
25 (IT-2)
15 (IT-3)
10 (guideline)
75 (IT-1)
50 (IT-2)
37.5 (IT-3)
25 (guideline)
25 (c)
20 (d)
15 (e)
65 (c)
40 (d)
25 (e)
Notes:
(a) 4 permissible frequencies of exceedance per year (b) Applicable from 1 January 2015. (c) Applicable immediately to 31 December 2015. (d) Applicable 1 January 2016 to 31 December 2029. (e) Applicable 1 January 2030.

Henning Crusher Ondangwa, Namibia: Dust Management Plan
Report Number: 18SLR21 7
2.2.3 Dustfall Limits
Air quality standards are not defined by all countries for dust deposition, although some countries may make reference to
annual average dust fall thresholds above which a 'loss of amenity' may occur. In the southern African context, widespread
dust deposition impacts occur as a result of windblown dust from mine tailings and natural sources, as well as other fugitive
dust sources.
South Africa has published the National Dust Control Regulations (NDCR) on the 1st of November 2013 (Government Gazette
No. 36974). The purpose of the regulations is to prescribe general measures for the control of dust in all areas including
residential and light commercial areas. Similarly, Botswana published dust deposition evaluation criteria (BOS 498:2013).
According to these limits, an enterprise may submit a request to the authorities to operate within the Band 3 (action band) for
a limited period, providing that this is essential in terms of the practical operation of the enterprise (for example the final
removal of a tailings deposit) and provided that the best available control technology is applied for the duration. No margin of
tolerance will be granted for operations that result in dustfall rates in the Band 4 (alert band). This four-band scale is presented
in Table 3.
Table 3: Bands of dustfall rates
Band Number
Band Description
30 Day Average Dustfall Rate
(mg/m2-day)
Comment
1 Residential D < 600 Permissible for residential and light commercial
2 Industrial 600 < D < 1 200 Permissible for heavy commercial and industrial
3 Action
1 200 < D < 2 400 Requires investigation and remediation if two sequential months lie in this band, or more than three occur in a year.
4 Alert
2 400 < D Immediate action and remediation required following the first exceedance. Incident report to be submitted to relevant authority.
2.3 International Conventions
The technical reference documents published in the IFC Environmental, Health and Safety (EHS) Guidelines provide general
and industry specific examples of Good International Industry Practice (GIIP). The General EHS Guidelines are designed to
be used together with the relevant Industry Sector EHS Guidelines (IFC, 2007).
The IFC EHSG provide a general approach to air quality management for a facility, including the following:
• Identifying possible risks and hazards associated with the project as early on as possible and understanding the
magnitude of the risks, based on:
o the nature of the project activities; and,
o the potential consequences to workers, communities, or the environment if these hazards are not
adequately managed or controlled.
• Preparing project- or activity-specific plans and procedures incorporating technical recommendations relevant to the
project or facility;
• Prioritising the risk management strategies with the objective of achieving an overall reduction of risk to human
health and the environment, focusing on the prevention of irreversible and / or significant impacts;
• When impact avoidance is not feasible, implementing engineering and management controls to reduce or minimise
the possibility and magnitude of undesired consequence; and,

Henning Crusher Ondangwa, Namibia: Dust Management Plan
Report Number: 18SLR21 8
• Continuously improving performance through a combination of ongoing monitoring of facility performance and
effective accountability.
Significant impacts to air quality should be prevented or minimised by ensuring that:
• Emissions to air do not result in pollutant concentrations exceeding the relevant ambient air quality guidelines or
standards. These guidelines or standards can be national guidelines or standards or in their absence WHO AQGs
or any other international recognised sources.
• Emissions do not contribute significantly to the relevant ambient air quality guidelines or standards. It is
recommended that 25% of the applicable air quality standards are allowed to enable future development in a given
airshed.
• The EHS recognises the use of dispersion models to assess potential ground level concentrations. The models used
should be internationally recognised or comparable.
Emission guidelines are available from the IFC (2007) for Base Metal Smelting and Refining, with emission limits for Copper
Smelting. Since the proposed process indicates cobalt/ copper smelting the IFC copper smelting emission limits are provided
as guidance.
2.3.1 Degraded Airsheds or Ecological Sensitive Areas
The IFC provides further guidance on projects located in degraded airsheds (IFC, 2007), i.e. areas where the national/ WHO/
other recognised international Air Quality Guidelines are significantly exceeded or where the project is located next to areas
regarded as ecological sensitive such as national parks.
2.3.2 Fugitive Source Emissions
According to the IFC (IFC, 2007), fugitive source emissions refer to emissions that are distributed spatially over a wide area
and not confined to a specific discharge point. These sources have the potential to result in more significant ground level
impacts per unit release than point sources. It is therefore necessary to assess this through ambient quality assessment and
monitoring practices.
2.4 Recommended Guidelines and Targets
The IFC references the WHO guidelines but indicates that any other internationally recognized criteria can be used such as
the US EPA NAAQS or the European Council Air Quality Directives. It was however found that merely adopting the WHO
guidelines would result in potential non-compliance in many areas due to the arid environment in the country. The WHO states
that these AQG and interim targets should be used to guide standard-setting processes and should aim to achieve the lowest
concentrations possible in the context of local constraints, capabilities, and public health priorities. These guidelines are also
aimed at urban environments within developed countries (WHO, 2005). For this reason, the South African NAAQS are also
referenced since these were developed after a thorough review of all international criteria and selected based on the socio,
economic and ecological conditions of the country.
In the absence of guidelines on ambient air concentrations for Namibia, reference is made to the AQOs recommended as part
of the Erongo Strategic Environmental Assessment (SEA) (Liebenberg-Enslin, et al., 2019). These objectives are based on
the WHO interim targets and SA NAAQSs (Table 4Error! Reference source not found.). The criteria were selected on the
following basis:

Henning Crusher Ondangwa, Namibia: Dust Management Plan
Report Number: 18SLR21 9
• The WHO IT3 was selected for particulates since these limits are in line with the South African NAAQSs, and the
latter is regarded feasible limits for the arid environment of Namibia.
• Even though PM2.5 emissions are mainly associated with combustion sources and mainly a concern in urban
environments, it is regarded good practice to include as health screening criteria given the acute adverse health
effects associated with this fine fraction. Also, studies found that desert dust with an aerodynamic diameter 2.5 μm
cause premature mortality (Giannadaki et al., 2014).
• The Botswana and South African criteria for dust fallout are the same and with limited international criteria for dust
fallout, these were regarded applicable.
Table 4: Proposed evaluation criteria for Henning Crusher
Pollutant Averaging Period Criteria Reference
Particulate matter
(PM10)
24-hour Mean (µg/m³) 75(a) WHO IT3 & SA NAAQS
Annual Mean (µg/m³) 40 SA NAAQS
Particulate matter
(PM2.5)
24-hour Mean (µg/m³) 37.5(a) WHO IT3 & SA NAAQS
Annual Mean (µg/m³) 15 WHO IT3
Dustfall 30-day average (mg/m2/day)
600(b) SA NDCR & Botswana residential limit
1 200(b) SA NDCR & Botswana industrial limit
2 400 Botswana Alert Threshold
Notes: (a) Not to be exceeded more than 4 times per year (SA)
(b) Not to be exceeded more than 3 times per year or 2 consecutive months

Henning Crusher Ondangwa, Namibia: Dust Management Plan
Report Number: 18SLR21 10
3 DESCRIPTION OF THE RECEIVING ENVIRONMENT
3.1 Site Description
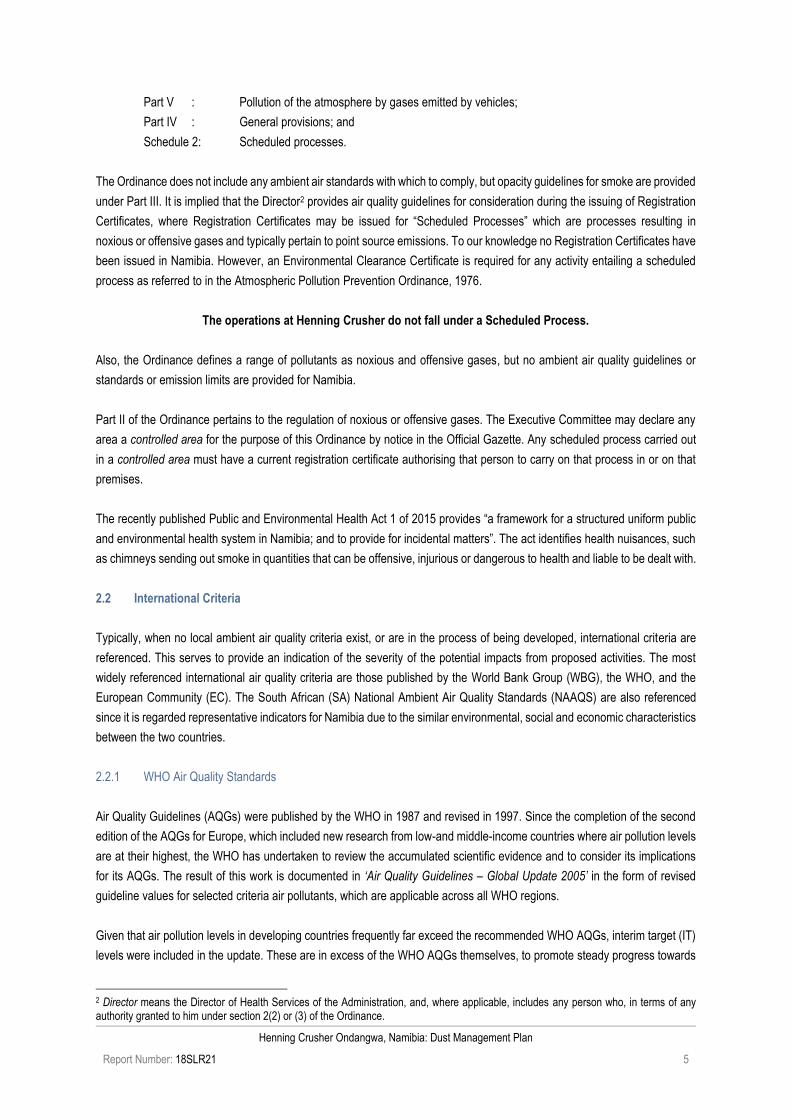
Henning Crusher is located in the commercial area of Ondangwa, on the north-western side of town. The C46, a national road,
runs past the facility on the southern side. The terrain surrounding Henning Crusher and the town of Ondangwa is flat.
Sensitive receptors, from an air quality perspective, primarily relate to places where people reside. One of Ondangwa’s
residential areas is located approximately 120 m to the south of Henning Crusher, with the town approximately 650 m to the
southeast. There is a kindergarten to the west of Henning Crusher (about 65 m) and an informal settlement some 60 m to the
north (Figure 2). These residential areas represent the Air Quality Sensitive Receptors (AQSRs).
Other potential sources of air pollution in the area include the railway siding about 1 km to the east, the C46 directly to the
south and other commercial operations around the site. An airstrip is located about 2.3 km to the west-northwest.
3.2 Atmospheric Dispersion Potential
Meteorological mechanisms govern the dispersion, transformation and eventual removal of pollutants from the atmosphere.
The extent to which pollution will accumulate or disperse in the atmosphere is dependent on the degree of thermal and
mechanical turbulence within the earth’s boundary layer. Dispersion comprises vertical and horizontal components of motion.
The stability of the atmosphere and the depth of the surface-mixing layer define the vertical component. The horizontal
dispersion of pollution in the boundary layer is primarily a function of the wind field. The wind speed determines both the
distance of downwind transport and the rate of dilution as a result of plume ‘stretching’. The generation of mechanical
turbulence is similarly a function of the wind speed, in combination with the surface roughness. Pollution concentration levels
therefore fluctuate in response to changes in atmospheric stability, to concurrent variations in the mixing depth, and to shifts
in the wind field.
A description of the wind field, temperature, precipitation and atmospheric stability is provided in the following section. For the
assessment, use was made of modelled MM53 meteorological data for Ondangwa for a period of one year (2018).
3.2.1 Surface Wind Field
The wind direction, and the variability in wind direction, determines the general path air pollutants will follow, and the extent of
crosswind spreading. Wind roses comprise 16 spokes, which represent the directions from which winds blew during the period.
The colours used in the wind roses below reflect the different categories of wind speeds; the red area, for example,
representing winds between higher than 5 m/s. The dotted circles provide information regarding the frequency of occurrence
of wind speed and direction categories. The frequency with which calms occurred refers to periods during which the wind
speed was below 1 m/s.
Period, day-time and night-time wind roses for the study area, based on modelled MM5 data for the year 2018, are depicted
in Figure 3 with the seasonal variability in the wind field shown in Figure 4.
3 The MM5 model is an acronym for the Fifth-Generation NCAR / Penn State Mesoscale Model, which is a limited-area, non-hydrostatic, terrain-following sigma-coordinate model designed to simulate or predict mesoscale and regional-scale atmospheric circulation.
Henning Crusher Ondangwa, Namibia: Dust Management Plan
Report Number: 18SLR21 11
Figure 2: Henning Crusher dustfall network and sensitive receptors

Henning Crusher Ondangwa, Namibia: Dust Management Plan
Report Number: 18SLR21 12
The wind field is dominated by winds from the east to northeast, and from the southwest (Figure 3a). The period average wind
speed for 2018 is 2.7 m/s, with calm conditions prevailing for 15% of the time. During the day (Figure 3b), the easterly and
east-northeasterly winds prevail with wind calm conditions for 14% of the time and speeds of up to 9.6 m/s. At night (Figure
3c), the wind field shifts to more frequent southwesterly winds and lower wind speeds from the easterly sector. The highest
winds speeds (more than 5 m/s) occurred for 4.7% of the time.
(a) Period 2018 (b) Daytime 2018 (c) Night-time 2018
Figure 3: Period, day- and night-time wind roses based on modelled MM5 data for Ondangwa (2018)
Seasonal variation in the wind field is shown in Figure 4; with predominantly easterly to north-northwesterly winds during the
summer months (Nov – Feb). During the autumn months (Mar – May), the easterly to north-easterly winds dominated with
almost no winds from the westerly sector. The winter months reflected similar easterly flow but with an increase in
southwesterly winds. During springtime (Aug – Oct) the easterly flow subsided with more frequent flow from the southwest.
(a) Summer (b) Autumn
(c) Winter (d) Spring
Figure 4: Seasonal wind roses based on modelled MM5 data for modelled MM5 data for Ondangwa (2018)

Henning Crusher Ondangwa, Namibia: Dust Management Plan
Report Number: 18SLR21 13
Average wind speeds were low at 2.7 m/s with a maximum hourly wind speed of 9.6 m/s. Wind speeds ranged mainly between
1 and 7 m/s, with only 0.3% exceeding 7 m/s (Figure 5).
Figure 5: Wind frequency classes for the year 2018.
3.2.2 Temperature
Air temperature is important, both for determining the effect of plume buoyancy (the larger the temperature difference between
the plume and the ambient air, the higher the plume can rise), and determining the development of the mixing and inversion
layers.
Maximum, minimum and mean temperatures for the study area are given as 35°C, 8.5°C and 23.5°C respectively, based on
modelled MM5 data for the year 2018. Average daily maximum temperatures range from 35°C in November to January, to
25°C in July. The daily minima ranged from 19°C in January to 8.5°C in June (Figure 6).
Figure 6: Daily average temperatures based on modelled MM5 data for Ondangwa (2018)

Henning Crusher Ondangwa, Namibia: Dust Management Plan
Report Number: 18SLR21 14
3.2.3 Precipitation
Precipitation is important to air pollution studies since it represents an effective removal mechanism for atmospheric pollutants
and inhibits dust generation potentials. Based on simulated MM5 rainfall data for Ondangwa, the area received a total of
442 mm in 2018, ranging between 0 mm and 120 mm over the various months. The rainy season is between October and
March, with the dry season from April to September (Figure 7).
Figure 7: Average rainfall based on modelled MM5 data for Ondangwa (2018)
3.2.4 Atmospheric Stability
The new generation air dispersion models differ from the models traditionally used in several aspects, the most important of
which are the description of atmospheric stability as a continuum rather than discrete classes. The atmospheric boundary
layer properties are therefore described by two parameters; the boundary layer depth and the Monin-Obukhov length, rather
than in terms of the single parameter Pasquill Class. The Monin-Obukhov length (LMo) provides a measure of the importance
of buoyancy generated by the heating of the ground and mechanical mixing generated by the frictional effect of the earth’s
surface. Physically, it can be thought of as representing the depth of the boundary layer within which mechanical mixing is the
dominant form of turbulence generation (CERC, 2004).
The atmospheric boundary layer constitutes the first few hundred metres of the atmosphere. During the daytime, the
atmospheric boundary layer is characterised by thermal turbulence due to the heating of the earth’s surface and the
predominance of an unstable layer. In unstable conditions, ground level pollution is readily dispersed thereby reducing ground
level concentrations. Elevated emissions, however, such as those released from a chimney, are returned more readily to
ground level, leading to higher ground level concentrations.
Night times are characterised by weak vertical mixing and the predominance of a stable layer. These conditions are normally
associated with low wind speeds and less dilution potential. During windy and/or cloudy conditions, the atmosphere is normally
neutral (which causes sound scattering in the presence of mechanical turbulence). For low level releases, the highest ground
level concentrations would occur during weak wind speeds and stable (night-time) atmospheric conditions.
Atmospheric stability is frequently categorised into one of six stability classes. These are briefly described in Table 5.

Henning Crusher Ondangwa, Namibia: Dust Management Plan
Report Number: 18SLR21 15
Table 5: Atmospheric stability classes
Designation Stability Class Atmospheric Condition
A Very unstable calm wind, clear skies, hot daytime conditions
B Moderately unstable clear skies, daytime conditions
C Unstable moderate wind, slightly overcast daytime conditions
D Neutral high winds or cloudy days and nights
E Stable moderate wind, slightly overcast night-time conditions
F Very stable low winds, clear skies, cold night-time conditions

Henning Crusher Ondangwa, Namibia: Dust Management Plan
Report Number: 18SLR21 16
4 DUSTFALL RESULTS
4.1 Existing Sources of Emissions in the Area
Activities in the project area are primarily limited to small commercial operations surrounding Henning Crusher, residential fuel
burning for heating and cooking purposes, traffic on the C46, the railway siding and the airstrip. Regional sources would
include small scale livestock farming, vehicles travelling on paved and unpaved roads, wind erosion from the exposed areas
and dust generated by cattle grazing. Occasional wildfires would add to the background air quality as well as biomass burning
for the production of charcoal.
The main pollutant of concern would be particulate matter (TSP; PM10 and PM2.5) resulting from vehicle entrainment on the
paved and especially unpaved roads, windblown dust, residential burning and veld fires. Gaseous pollutants such as SO2,
NOx, CO and CO2 would result from vehicles, residential burning and veld fires, but these are expected to be at low
concentrations.
Another source of air pollution is aerosols as a result of regional-scale transport of mineral dust and ozone (due to vegetation
burning) from the north of Namibia (http://www.fao.org/docrep/005/x9751e/x9751e06.htm).
4.2 Baseline Dustfall Monitoring
A dustfall monitoring network comprising of four (4) singe dust fallout units were installed at the Henning Crusher site in
January 2019. Suitable locations were identified for ongoing dustfall sampling around the site. The four locations are described
in Table 6 and shown in Figure 2.
Table 6: Dustfall sampling locations
Site Name Latitude Longitude Description Applicable dustfall limit
No.1 17° 53.825'S 15° 57.867'E close to the kindergarten 600 mg/m²/day(a)
No.2 17° 53.872'S 15° 57.877'E close to C46 1 200 mg/m²/day(b)
No.3 17° 53.773'S 15° 57.982'E near main factory building 1 200 mg/m²/day(b)
No.4 17° 53.729'S 15° 58.015'E Near temporary housing 600 mg/m²/day(a)
Notes: (a) Chosen the SA NDCR for non-residential/ industrial areas since these locations are within the mining area.
(b) Chosen the SA NDCR for residential areas since these locations are near homesteads.
In the sampling of daily dustfall rates, the procedure set out in American Standard Test Method (ASTM) D1739 (ASTM
International, 1998) re-approved 2010), was adopted which includes the use of a wind-shield not required by ASTM D1739
(1970). The latter is no longer supported by ASTM, while the former has been shown to be more conservative in the sense
that it records at least the same, and in cases of severe deposition up to twice, the deposition rate of the previous standard
under similar exposure (Kornelius, et al., 2015). It is therefore considered to be ‘an equivalent method approved by any
internationally recognized body’ as allowed by the SA NDCR.
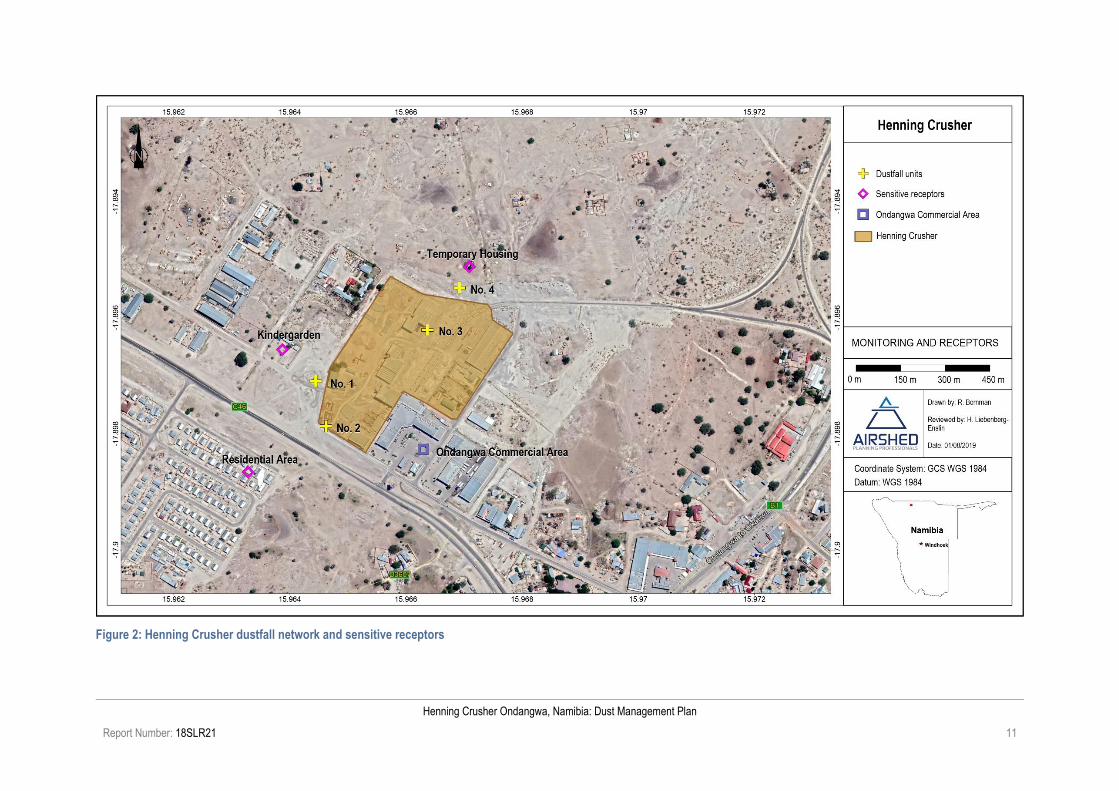
The ASTM method covers the procedure of collection of dustfall and its measurement and employs a simple device consisting
of a cylindrical container (not less than 150 mm in diameter) exposed for one calendar month (30 ± 2 days) (Error! Reference s
ource not found.). The ASTM method also covers the procedure for collection, handling and laboratory analysis of samples
Henning Crusher Ondangwa, Namibia: Dust Management Plan
Report Number: 18SLR21 17
Figure 8: Dust fallout unit according to the ASTM D1739-98 method design
Dustfall rates for the three-month period from February to April 2019 are provided in Table 14, and graphically displayed in
Figure 9. A box-and-whisker plot is provided in Figure 10 showing dustfall trends over the three months.
During the three-month period from February to April 2019, dustfall rates exceeded the SA NDCR for residential areas
(600 mg/m²/day) and for non-residential areas (1 200 mg/m²/day) at No.1and No.3 at least for one month (highlighted in Table
7). Only No.4 collected dustfall rates below the residential limit over the three months (Table 7 and Figure 9).
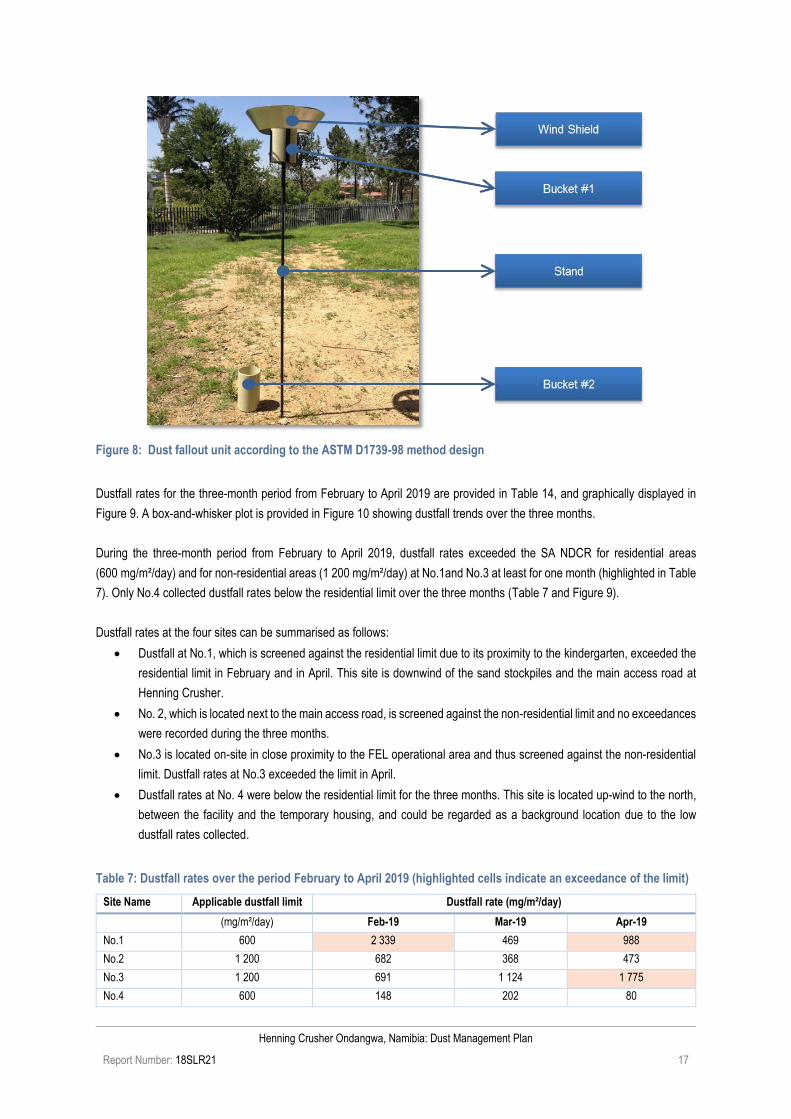
Dustfall rates at the four sites can be summarised as follows:
• Dustfall at No.1, which is screened against the residential limit due to its proximity to the kindergarten, exceeded the
residential limit in February and in April. This site is downwind of the sand stockpiles and the main access road at
Henning Crusher.
• No. 2, which is located next to the main access road, is screened against the non-residential limit and no exceedances
were recorded during the three months.
• No.3 is located on-site in close proximity to the FEL operational area and thus screened against the non-residential
limit. Dustfall rates at No.3 exceeded the limit in April.
• Dustfall rates at No. 4 were below the residential limit for the three months. This site is located up-wind to the north,
between the facility and the temporary housing, and could be regarded as a background location due to the low
dustfall rates collected.
Table 7: Dustfall rates over the period February to April 2019 (highlighted cells indicate an exceedance of the limit)
Site Name Applicable dustfall limit Dustfall rate (mg/m²/day)
(mg/m²/day) Feb-19 Mar-19 Apr-19
No.1 600 2 339 469 988
No.2 1 200 682 368 473
No.3 1 200 691 1 124 1 775
No.4 600 148 202 80
Henning Crusher Ondangwa, Namibia: Dust Management Plan
Report Number: 18SLR21 18
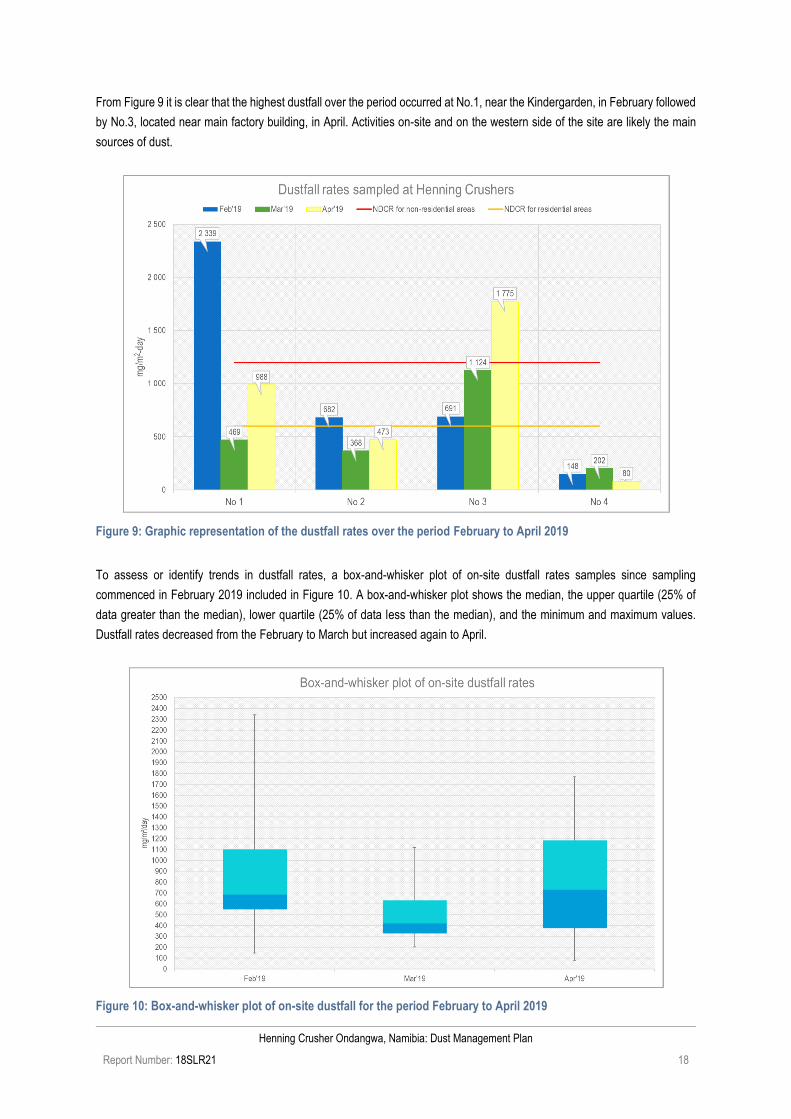
From Figure 9 it is clear that the highest dustfall over the period occurred at No.1, near the Kindergarden, in February followed
by No.3, located near main factory building, in April. Activities on-site and on the western side of the site are likely the main
sources of dust.
Figure 9: Graphic representation of the dustfall rates over the period February to April 2019
To assess or identify trends in dustfall rates, a box-and-whisker plot of on-site dustfall rates samples since sampling
commenced in February 2019 included in Figure 10. A box-and-whisker plot shows the median, the upper quartile (25% of
data greater than the median), lower quartile (25% of data less than the median), and the minimum and maximum values.
Dustfall rates decreased from the February to March but increased again to April.
Figure 10: Box-and-whisker plot of on-site dustfall for the period February to April 2019

Henning Crusher Ondangwa, Namibia: Dust Management Plan
Report Number: 18SLR21 19
5 EXPECTED AMBIENT AIR QUALITY IMPACTS
5.1 Emissions Quantification
The main sources of PM at Henning crusher include:
• Vehicle entrainment on the unpaved on-site roads;
• Material transfer points (off-loading of sand and crusher dust, and FEL loading the materials into the mixer bins);
• Screening of sand; and
• Windblown dust from the sand stockpiles, crusher dust stockpiles and dusty exposed surfaces.
The emission factors were obtained from the Australian National Pollutant Inventory (NPI) (NPI, 2012) and the information
used in the quantification of particulate matter is provide in Table 8.
5.1.1 Vehicle entrainment on road surfaces
The force of the wheels travelling on roads causes the pulverisation of surface material. Particles are lifted and dropped from
the rotating wheels, and the road surface is exposed to strong air currents in turbulent shear with the surface. The turbulent
wake behind the vehicle continues to act on the road surface after the vehicle has passed. The quantity of dust emissions
from roads will vary linearly with the volume of traffic expected on that road and the amount of loose material on the surface.
The road surfaces at Henning Crusher has a lot of loose material on it and were treated as unpaved roads.
5.1.2 Material transfer points
The handling of sand and crusher dust are potential sources of dust generation at the various transfer points i.e. loading onto
the stockpiles and unloading by front-end-loader and tipping into the mixer bin. The quantity of dust generated will depend on
various climatic parameters, such as wind speed and precipitation, in addition to non-climatic parameters such as the nature
and volume of the material handled. Fine particulates are most readily disaggregated and released to the atmosphere during
the material transfer process, as a result of exposure to strong winds. Increases in the moisture content of the material being
transferred will decrease the potential for dust emissions, since moisture promotes the aggregation and cementation of fines
to the surfaces of larger particles (NPI, 2012).
5.1.3 Screening
The sand is screened before loaded into the mixer bin by the FEL. Screening plants represent significant dust-generating
sources if uncontrolled. Dust fallout in the vicinity of screens also give rise to the potential for the re-entrained of dust by
vehicles or by the wind at a later stage. The large percentage of fines in this deposited material enhances the potential for it
to become airborne. Fugitive dust emissions from screening operations at the site were quantified using US-EPA single valued
emission factors for such operations, as listed by the NPI (NPI, 2012).
5.1.4 Wind-blown dust
Wind erosion is a complex process, including three different phases of particle entrainment, transport and deposition. It is
primarily influenced by atmospheric conditions (e.g. wind, precipitation and temperature), soil properties (e.g. soil texture,
composition and aggregation), land-surface characteristics (e.g. topography, moisture, aerodynamic roughness length,
vegetation and non-erodible elements) and land-use practice (e.g. farming, grazing and mining) (Shao, 2008).

Henning Crusher Ondangwa, Namibia: Dust Management Plan
Report Number: 18SLR21 20
For wind erosion to occur, the wind speed needs to exceed a certain threshold, called the threshold velocity. This relates to
gravity and the inter-particle cohesion that resists removal. Surface properties such as material texture, material moisture and
vegetation cover influence the removal potential. Conversely, the friction velocity or wind shear at the surface, is related to
atmospheric flow conditions and surface aerodynamic properties. Thus, for particles to become airborne, the wind shear at
the surface must exceed the gravitational and cohesive forces acting upon them, called the threshold friction velocity (Shao,
2008).
Estimating the number of wind-blown particles to be generated from exposed surfaces is not a trivial task and requires detailed
information on the particle size distribution, moisture content, silt content and bulk density. Dust will only be generated under
conditions of high wind speed which is likely to occur when the wind exceeds 5 m/s (US EPA, 1995). The US EPA emission
factors apply only to dry, exposed surfaces of mixed size aggregate with limited erosion potential. These emission factors
have been based on the highest wind speed event occurring between material disturbances. A uniform particle distribution is
assumed and variations in moisture content, particle density, roughness elements or large surface areas have not been
considered (US-EPA, 1996).
Table 8: Emission factors used to quantify fugitive dust emissions from Henning Crusher operations
Activity Emission Factor Information provided/assumed
General information
Hours of operation were assumed as 10 hrs per day, 6 days per week.
Bulk density of sand = 1 602 kg/m³ (a)
Bulk density of crusher dust = 1 150 kg/m³ (a)
Wheel generated dust from unpaved roads at industrial sites
TSP = 4.23 kg/VKT
PM10 = 1.25 kg/VKT
PM2.5 = ND
Operational transport activities on-site include the delivery of sand and the collection of bricks, and the movement of sand and crusher dust from the storage piles to the mixer bins.
Delivery of sand:
• Truck capacity = 30 tonne trucks
• Amount of sand delivered = 10 000 tonne per month (tpm)
• Number of loads = 335 per month
• Road length = 170 m
• Road width = 6 m (assumed)
Collection of bricks:
• Truck capacity = 30 tonne trucks
• Amount of bricks collected = 10 800 tpm
• Number of loads = 360 per month
• Road length = 115 m
• Road width = 6 m (assumed)
FEL sand and crusher dust from storage piles to mixer:
• FEL bucket volume = 36 m³ (b)
• Amount of sand moved = 10 000 tpm
• Amount of crusher dust moved = 12 000 tpm
• Number of loads = 463 per month (calculated)
• Road length = 348 m
• Road width = 6 m (assumed)
Materials handling Loading to Stockpile
TSP = 0.004 kg/tonne
PM10 = 0.0017 kg/ tonne
PM2.5 = ND
Unloading Stockpile
The moisture content of material is as follows:
• Sand: 1% (assumed range of 0.5% - 1.5% (c))
• Crusher dust: 1% (assume to be similar to sand)
The amount of sand processed = 10 000 tpm
The amount of crusher dust processed = 12 000 tpm

Henning Crusher Ondangwa, Namibia: Dust Management Plan
Report Number: 18SLR21 21
Activity Emission Factor Information provided/assumed
TSP = 0.03 kg/tonne
PM10 = 0.013 kg/tonne
PM2.5 = ND
Screening TSP = 0.08 kg/tonne
PM10 = 0.06 kg/tonne
PM2.5 = ND
The amount of sand screened = 10 000 tpm
Wind Erosion TSP = 0.004 kg/tonne
PM10 = 0.0017 kg/tonne
PM2.5 = ND
Sand Stockpile 1 = 1 123 m² (from Google earth)
Sand Stockpile 2 = 674 m² (from Google earth)
Crusher dust stockpile area = 1 333 m² (from Google earth)
Wind speed > 5 m/s occurred for 4.7% of the time (MM5 data for 2018)
Notes:
(a) https://www.quora.com/What-is-bulk-density-of-cement-aggregate-sand (accessed 29/07/2019)
(b) https://en.wikipedia.org/wiki/Loader_(equipment) (accessed 29/07/2019)
(c)https://www.researchgate.net/post/Is_there_a_specific_range_for_the_percentage_of_moisture_content_of_Saturated_Surface_Dry_Sand_SSD
(accessed 29/07/2019))
5.1.5 Emission Rate Summary
The calculated emissions from Henning Crusher operations are provided in Table 9. The main source of dust emissions is
vehicle entrainment from the trucks and the FEL on the on-site roads. Screening of sand and handling of sand and crusher
dust are the second and third most significant dust generating sources. Windblown dust is the least significant source of dust
emissions on average, but this is an intermittent source, occurring only under high wind speeds (typically > 5 m/s) and could
be perceived as a significant source under windy conditions.
Table 9: Calculated emissions from Henning Crusher operations
Emission Sources Total Emissions (tpa)
TSP PM10 PM2.5
Materials Handling 8.98 3.88 ND
Screening 9.60 7.20 ND
On-site roads 26.79 7.92 ND
Wind Erosion 2.24 1.12 ND
TOTAL 47.60 20.12 -
Notes: ND – no data (there are no emission factors for PM2.5)
5.2 Qualitative Assessment
Only the potential impacts from PM10 emissions on the surrounding environment and human health were assessed. Modelling
was done using SCREEN34 to get an indication of the potential health impact distance and significance. The SCREEN3 model
cannot simulate dust fallout rates and it was therefore not assessed.
4 The South African Regulations on Dispersion Modelling (DEA, 2014) indicates that screening models, such as the US EPA SCREEN3,
are adequate in Level 1 screening assessments which aim to reflect the worst-case air quality impacts. The purpose of these Level 1
assessments is to preliminary identify air quality issues associated with new sources and to determine if more detailed assessments are
needed. SCREEN3, a Gaussian plume model that can provide maximum ground level concentrations for point, area, flare, and volume
sources were used in this assessment (US EPA, 1992).

Henning Crusher Ondangwa, Namibia: Dust Management Plan
Report Number: 18SLR21 22
5.2.1 Potential for impacts from Henning Crusher operations
The calculated PM10 emissions from the Henning Crusher brick making operations were combined for modelling since the aim
is to determine the impact from the operations. Emission rates were combined for vehicle entrained dust, materials handling,
screening and wind erosion and modelled as an area source (Figure 3). Two scenarios were modelled namely:
1. Scenario 1 – average operational emissions applying the 4.7% time that the wind erosion would occur.
2. Scenario 2 – worst case scenario assuming wind erosion occur continuously.
Guidelines for PM10 are provided for daily and annual averages (Table 4) whereas the SCREEN3 model only simulates hourly
concentrations. In order to compare to the modelled results to the relevant guidelines, the Beychok method was used to
convert hourly exposures to inferred highest daily- and annual averages (Beychok, 2005). It should be noted that the Beychok
method always provides the highest inferred value.
For both Scenario 1 (assuming wind erosion to only occur for 4.7% of the time) and Scenario 2 (assuming continuous wind
erosion) the maximum impact from the Henning Crusher operations are at a distance of between 60 m and 120 m, reducing
at further distances (Figure 11 and Figure 12). There is also very little difference in the maximum ground level PM10 24-hour
concentrations between the two scenarios – 465 µg/m³ for Scenario 1 and 476 µg/m³ for Scenario 2.
Figure 11: Impact distance due to Henning Crusher operations assuming average emissions
Figure 12: Impact distance due to Henning Crusher operations assuming worst case emissions

Henning Crusher Ondangwa, Namibia: Dust Management Plan
Report Number: 18SLR21 23
The inferred 24-hour and annual PM10 concentrations at the various sensitive receptors are provided in Table 10. The PM10
24-hour concentrations exceed the limit of 75 µg/m³ at all the sensitive receptors. Over an annual average however, the values
are likely to be below the annual limit of 40 µg/m³ at all receptors. It should be noted that the modelled concentrations were
the highest under “very stable” atmospheric conditions which occur during night-time with low wind speeds, clear skies, and
low temperatures. Since Henning Crusher does not operate during night-time, these modelled concentrations are regarded
conservative and worse case.
Table 10: Simulated PM10 24-hour and annual average inferred concentrations at the sensitive receptors
Sensitive Receptors
PM10 24-hour concentration (µg/m³) PM10 annual concentration (µg/m³)
Scenario 1 – average Scenario 2 – worst case
Scenario 1 – average Scenario 2 – worst
case
Town of Ondangwa 82 84 2 4
Residential area to the south 465 476 20 21
Kindergarten 425 435 19 19
Informal residence 421 431 18 19
The assessment could not account for dust impacts under high wind conditions (i.e. wind speeds >5 m/s), which is likely to
result in windblown dust from the Henning Crusher operations. Based on the hourly wind speeds from the MM5 data, winds
only exceeded 5 m/s for 4.7% of the time and were mostly from the northeast, the east and to a lesser extent from the
southwest. This would imply that the kindergarten would be mostly affected by windblown dust from the sand stockpile and
the crusher stockpile areas.
5.3 Main Findings
The main findings from the assessment are as follows:
Atmospheric conditions
• The wind field is dominated by winds from the east to northeast, and from the southwest. The period average wind
speed for 2018 was 2.7 m/s, with calm conditions prevailing for 15% of the time. Higher wind speeds occurred during
the day, with a maximum wind speed of 9.6 m/s. Wind speeds exceeding 5 m/s occurred for 4.7% of the time and
were mostly from the east, northeast and southwest.
• Seasonal variation in the wind field indicated more frequent easterly to north-northwesterly flow during the summer
months with a shift to dominant easterly to north-easterly winds during the autumn months. Winter showed similar
wind fields to autumn with more frequent southwesterly winds which increased in frequency during the spring
months.
• Maximum, minimum, and mean temperatures were given as 35°C, 8.5°C and 23.5°C respectively, based on
modelled MM5 data for the period 2018.
• Based on the MM5 modelled data, the area received between 0 mm and 472 mm of rain over the one year (2018),
with the highest rainfall during the summer months.
Site description
• Potential sources of air pollution in the area include the railway to the east, the C46 directly to the south and other
commercial operations around the site with an airstrip located to the west-northwest

Henning Crusher Ondangwa, Namibia: Dust Management Plan
Report Number: 18SLR21 24
• Identified sensitive receptors near Henning Crusher include a kindergarten to the west, temporary housing to the
north, a residential area to the south and the town’s residential area further away to the southwest.
Dust fallout and air quality impacts
• Dustfall locations No. 1 and No. 4 are screened against the residential limit of 600 mg/m²/day since these are near
a kindergarten and a temporary house, whereas No. 2 and No. 3 are located on-site and screened against the non-
residential limit of 1 200 mg/m²/day.
• Dustfall rates over the three-month period (Feb – Apr’19) were highest at No.1, exceeding the residential limit for
two months and resulting in the highest average dustfall rate over the three months. No. 3 exceeded the non-
residential limit for one month and had the second highest average dustfall rate over the three months.
• The main sources of dust generation at Henning crusher include vehicle entrainment on the unpaved on-site roads;
material transfer points (off-loading of sand and crusher dust, and FEL loading the materials into the mixer bins);
screening of sand; and windblown dust from the sand stockpiles, crusher dust stockpiles and dusty exposed
surfaces. Vehicle entrainment on the on-site roads resulted in the highest dust emissions, with windblown dust the
lowest.
• Annual and 24-hour average PM10 concentrations were modelled to determine the potential for impacts at the various
sensitive receptors. The maximum impact from the Henning Crusher operations are at a distance of between 60 m
and 120 m, reducing at further distances.
• The PM10 24-hour concentrations exceed the limit of 75 µg/m³ at all the sensitive receptors. Over an annual average
however, the values are likely to be below the annual limit of 40 µg/m³ at all receptors. These modelled
concentrations are regarded conservative and worse case.
• Windblown dust could have a significant impact when it happens, and the kindergarten is the receptor that will be
affected the most.

Henning Crusher Ondangwa, Namibia: Dust Management Plan
Report Number: 18SLR21 25
6 DUST MANAGEMENT PLAN
A dust management plan should form part of the daily operations at Henning Crusher. A dust management plan provides
options on the control of dust at the main sources with the monitoring network designed as such to track the effectiveness of
the mitigation measures. The sources need to be prioritised based on the source strengths (emissions) and potential for
impacts at the sensitive receptors. Target control efficiencies for each source should be defined to ensure acceptable off-site
impacts.
6.1 Source ranking
Based on the emissions quantification (Section 5.1), the main source of dust generation at Henning Crusher is vehicle
entrainment on the on-site roads by trucks and the FEL. Screening of sand and handling of the sand and crusher dust are
also significant sources. Windblown dust, even though regarded to be a small source of emissions, could be a significant
impacting source under conditions of high wind speeds (> 5m/s).
6.2 Source Specific Recommended Management and Mitigation Measures
6.2.1 On-site roads
Vehicle-entrained dust emissions from unpaved road surfaces or areas with loose material are significant sources of fugitive
dust when vehicles drive over it. Four types of measures may be taken to reduce emissions from unpaved roads: (a) initial
design and construction to minimise wear and silt generation; such measures include proper selection and compaction of road
material and careful attention to the design of the drainage system, (b) paving the areas and keeping it clean, (c) traffic control
measures aimed at reducing the entrainment of material by restricting traffic volumes, and (d) measures aimed at binding the
surface material or enhancing moisture retention, such as wet suppression and chemical stabilization (Cowherd, et al., 1988)
(APCD , 1995).
Because the on-site roads at Henning Crusher are used for a relatively short duration, wet suppression is recommended. It is
further recommended that the areas be kept clean by sweeping.
Table 11: On-site roads – Dust Suppression Improvement Plan
Criteria Description
Vehicle entrainment • Trucks delivering sand
• Trucks collecting bricks
• Movement of sand with FEL to mixing bin
• Movement of crusher dust with FEL to mixing bin
Operational hours 10 hours per day, 6 days per week.
Accountable person(s) Site manager
Target control At least 75% control efficiency
Performance indicators • Dust fallout rates less than 1 200 mg/m2/day at dustfall unit No.2.
• Dust fallout rates less than 1 200 mg/m2/day at dustfall unit No.3.
• Dust fallout rates less than 600 mg/m2/day at dustfall unit No.1.
Operating procedures • Water sprays on road surfaces to bind the loose material.
• Sweeping of road surfaces to reduce the amount of loose material.

Henning Crusher Ondangwa, Namibia: Dust Management Plan
Report Number: 18SLR21 26
6.2.2 Materials handling
Material handling operations were calculated (Section 5.1.2) to be a significant source of fugitive dust emissions. The high
emission variability (due to the dependence in material moisture content and wind speed) increases the risk for potential large
emissions from materials handling. Since moisture content is critical in minimising emissions from materials handling the
operating procedures should include regular watering of materials handling points, (if possible) reduce the drop height of dry
materials and regular clean-up of loading areas to minimise loose dust that could become entrained by gusts of wind or by
vehicle activity. Material handling points should be mitigated with water sprays. The target control efficiency of these dust
suppression procedures should be at least 50%.
Table 12: Materials handling – Dust Suppression Improvement Plan
Criteria Description
Materials handling • Unloading of sand from trucks
• Unloading of crusher dust from rail trucks
• Movement of sand with FEL to mixing bin
• Movement of crusher dust with FEL to mixing bin
Operational hours 10 hours per day, 6 days per week.
Accountable person(s) Site manager
Target control At least 50% control efficiency
Performance indicators • Dust fallout rates less than 1 200 mg/m2/day at dustfall unit No.3.
• Dust fallout rates less than 1 200 mg/m2/day at dustfall unit No.2.
• Dust fallout rates less than 600 mg/m2/day at dustfall unit No.1.
• Dust fallout rates less than 600 mg/m2/day at dustfall unit No.4.
Operating procedures • Have water sprays at sand stockpiles.
• Have mist curtains around the crusher dust stockpiles.
• Drop height from trucks to be kept at a minimum.
• Regular clean-up at the sand and crusher dust stockpile areas.
6.2.3 Screening
Wet suppression of screening operations is critical to meeting the minimum target for dust control. Other actions include
regular inspection and clean-up of the screening area, reducing the loose material on the surface will reduce the risk of re-
entrainment by vehicles moving in the area. Wetting of the loose dust in between clean-up will also reduce potential emissions.
The water sprays applied to the sand materials handling operations should also reduce the dust emission from the screening.
Table 13: Screening – Dust Suppression Improvement Plan
Criteria Description
Screening Screening of sand at sand stockpile area
Operational hours 10 hours per day, 6 days per week.
Accountable person(s) Site manager
Target control At least 50% control efficiency
Performance indicators • No loose dust around screening facility

Henning Crusher Ondangwa, Namibia: Dust Management Plan
Report Number: 18SLR21 27
Criteria Description
• Dust fallout rates less than 1 200 mg/m2/day at dustfall unit No.3.
• Dust fallout rates less than 600 mg/m2/day at dustfall unit No.1.
Operating procedures • Water spray system to maximise control efficiency.
• Spillage clean up, at least once a week.
6.2.4 Windblown dust
Windblown dust emissions from the sand and crusher dust stockpiles and exposed surfaces with loose material could be a
significant intermittent source of fugitive dust emissions during periods of high wind speeds. High windspeed events (>5 m/s)
are mostly from the northeast and the east, and it is possible that wind erosion emissions could impact on the kindergarten.
Wet suppression would act as a temporary binding agent and reduce the potential for particles to be lifted by strong winds.
The use of netting along the western side of the facility would reduce the wind speeds and hence the potential for on-site
windblown dust.
Table 14: Windblown dust – Dust Suppression Improvement Plan
Criteria Description
Wind erosion • Sand stockpile and area
• Crusher dust stockpile and area
• All areas with loose material
Operational hours 24 hours per day, 7 days per week.
(windblown dust would not be bound to operational hours)
Accountable person(s) Site manager
Target control At least 50% control efficiency
Performance indicators • No visible dust plumes under conditions of high wind speeds
• Dust fallout rates less than 1 200 mg/m2/day at dustfall unit No.3.
• Dust fallout rates less than 1 200 mg/m2/day at dustfall unit No.2.
• Dust fallout rates less than 600 mg/m2/day at dustfall unit No.1.
Operating procedures • Water spray system to maximise control efficiency.
• Netting along the western side of the facility, especially along the sand stockpile area.
6.3 Performance Indicators
Indicators are defined as a single measure of a condition of an environmental element that represents the status or quality of
that element. An index is a combination of a group of indicators to measure the overall status of an environmental element,
and a threshold is the value of an indicator or index. For example, dustfall rates monitored at Henning Crusher are the
indicators, with the dustfall limits (residential and non-residential) being the thresholds.
Key performance indicators against which progress may be assessed form the basis for all effective environmental
management practices. In the definition of key performance indicators careful attention is usually paid to ensure that progress
towards their achievement is measurable, and that the targets set are achievable given available technology and experience.
Performance indicators are usually selected to reflect both the source of the emission directly and the impact on the receiving
environment. Ensuring that no visible evidence of wind erosion exists represents an example of a source-based indicator,

Henning Crusher Ondangwa, Namibia: Dust Management Plan
Report Number: 18SLR21 28
whereas maintaining off-site dustfall rates to below 600 mg/m2/day represents an impact- or receptor-based performance
indicator.
6.3.1 Performance thresholds
It is recommended that the criteria as listed in Section 2.4 be adopted as indicators for the Henning Crusher operations. In the
places of constant human occupation such as the kindergarten and the informal housing, pollutant concentrations should not
exceed the residential dustfall limit of 600 mg/m²/day – this would apply to dust buckets No. 1 and No.4. Dust bucket locations
No. 2 and No.3 are regarded representative of on-site dust fallout and should be screened against the dustfall limit for non-
residential areas (1 200 mg/m²/day). PM10 concentration limits apply to areas outside the Henning Crusher site, where the
public has access. Here the 24-hour limit of 75 µg/m³ is recommended not to be exceeded more than 4 days per year, with
an annual limit of 40 µg/m³.
6.3.2 Source based Performance Indicators
The absence of visible dust plume when trucks and the FEL are driving on-site would be the best indicator of effective control
equipment in place. Similarly, no dust plumes should be visible at the screen and at the material transfer points.
In addition, dustfall rates in the immediate vicinity of these sources (materials handling points, unpaved roads and screens)
should be less than 1 200 mg/m2/day. This applies to buckets No. 2 next to the access road, and No. 3 amongst the FEL
operations and materials transfer points.
6.3.3 Receptor based Performance Indicators
Dustfall collection provides a useful and cost-effective tool to track the success of mitigation measures and overall dust
generation from the Henning Crusher operations. It is recommended that the dustfall network remains in place and that dustfall
collection continues.
Dustfall rates at dustflall units No. 1 (between the site and the kindergarten) and No. 4 (between the site and the temporary
housing) should not exceed 600 mg/m²/day. Should dustfall remain high at No.1 after mitigation measures as set out in Section
6.2 have been implemented, it is recommended that PM10 sampling be conducted at the kindergarten to determine the
inhalable dust concentrations.

Henning Crusher Ondangwa, Namibia: Dust Management Plan
Report Number: 18SLR21 29
7 REFERENCES
APCD, 1995. Colorado State Implementation Plan for Particulate Matter (PM10) - Denver Metropolitan Non-attainment Area
Element, jointly prepared by Regional Air Quality Council and Colorado Department of Health, Air Pollution Control
Division, signed into law on May.
ASTM International, 1998. Standard Test Method for Collection and Measurement of Dustfall (Settleable Particulate Matter),
Philadelphia, PA: ASTM Data Series.
Beychok, M. R., 2005. Fundamentals of stack gas dispersion. 4th ed. s.l.:Published by the author.
Cowherd, C., Muleski, G. E. & Kinsey, J. S., 1988. Control of Open Fugitive Dust Sources, s.l.: United States Environmental
Protection Agency.
Giannadaki, D., Pozzer , A. & Lelieveld , J., 2014. Modeled global effects of airborne desert dust on air quality and premature
mortality. Atmospheric Chemistry and Physics, 14, 957-968.
IFC, 2007. General Environmental, Health and Safety Guidelines. s.l.:World Bank Group.
Kornelius, G., Loans, C., Lotter, J. L. & Ramsuchit, D., 2015. Comparison of different dust fallout measurement techniques
with specific reference to the standard ASTM D1739:1970 technique for the measurement of dust deposition in
South Africa. Bloemfontein, s.n.
Liebenberg-Enslin, H. et al., 2019. Advanced Air Quality Management for the Strategic Environmental Management Plan for
the Uranium and Other Industries in the Erongo Region: Air Quality Management Plan Report, s.l.: Ministry of Mines
and Energy.
NPI, 2012. Emission Estimation Technique Manual for Mining. Version 3.1. s.l.:Australian Government Department of
Sustainability, Environment, Water, Population and Communities.
Shao, Y., 2008. Physics and Modelling of Wind Erosion. 2nd revised and expanded edition. Berlin: Springer.
US EPA, 2006. Compilation of Air Pollution Emission Factors: AP 42, Fifth Edition, Volume I, Chapter 13.
http://www.epa.gov/ttn/chief/ap42/ch13/index.html (Accessed 18 April 2012).
WHO, 2005. WHO air quality guidelines global update 2005: Report on a Working Group meeting, Bonn, Germany: World
Health Organization.

11
APPENDIX C: HENNING CRUSHER BRICK MAKING FACTORY IN ONDANGWA, BASELINE ENVIRONMENTAL NOISE ASSESSMENT

11
Report Compiled By:
Jeffrey Moletsane
Fieldwork Completed By:
Jeffrey Moletsane
Report No: | Date: July 2019
Address: 480 Smuts Drive, Halfway Gardens | Postal: P O Box 5260, Halfway House, 1685 Tel: +27 (0)11 805 1940 | Fax: +27 (0)11 805 7010
www.airshed.co.za
Henning Crushers Ondangwa, Namibia: Baseline Environmental Noise Assessment
Project done for SLR Environmental Consulting (Namibia) (Pty) Ltd
Henning Crushers Ondangwa, Namibia: Baseline Environmental Noise Assessment
Report Number:18SLR21-NIA i
REPORT DETAILS
Report Title Henning Crushers Ondangwa, Namibia: Baseline Environmental Noise Assessment
Applicant Henning Crushers (Pty) Ltd
Client SLR Environmental Consulting (Namibia) (Pty) Ltd
Report Number 18SLR21
Report Version Final Rev0
Date July 2019
Prepared by Jeffrey Moletsane (MSc (China, Beijing)
Fieldwork Conducted By Jeffrey Moletsane (MSc (China, Beijing)
Reviewed By Hanlie Liebenberg-Enslin (PhD, University of Johannesburg)
Notice
Airshed Planning Professionals (Pty) Ltd is a consulting company located in Midrand, South Africa, specialising in all aspects of air quality, ranging from nearby neighbourhood concerns to regional air pollution impacts as well as noise impact assessments. The company originated in 1990 as Environmental Management Services, which amalgamated with its sister company, Matrix Environmental Consultants, in 2003.
Declaration Airshed is an independent consulting firm with no interest in the project other than to fulfil the contract between the client and the consultant for delivery of specialised services as stipulated in the terms of reference.
Copyright Warning
Unless otherwise noted, the copyright in all text and other matter (including the manner of presentation) is the exclusive property of Airshed Planning Professionals (Pty) Ltd. It is a criminal offence to reproduce and/or use, without written consent, any matter, technical procedure and/or technique contained in this document.
REVISION RECORD
Version Date Comments
Final Rev0 July 2019 Submitted to client for review

Henning Crushers Ondangwa, Namibia: Baseline Environmental Noise Assessment
Report Number:18SLR21-NIA ii
SPECIALIST DECLARATION
I, Jeffrey Moletsane, as the appointed independent noise specialist for the proposed Gecko Cobalt Project, hereby declare
that I:
• acted as the independent specialist in this Environmental Clearance Certificate application;
• performed the work relating to the application in an objective manner;
• regard the information contained in this report as it relates to my specialist input/study to be true and correct,
• do not have and will not have any financial interest in the undertaking of the activity, other than remuneration for
work performed in terms of the Environmental Impact Assessment;
• declare that there are no circumstances that may compromise my objectivity in performing such work;
• have expertise in conducting the specialist report relevant to this application;
• have no, and will not engage in, conflicting interests in the undertaking of the activity;
• have no vested interest in the proposed activity proceeding;
• undertake to disclose to the applicant and the competent authority all material information in my possession that
reasonably has or may have the potential of influencing the decision of the competent authority; and
• all the particulars furnished by us in this specialist input/study are true and correct.
Signature of the specialist:
Name of Specialists: Jeffrey Moletsane
Date:
Henning Crushers Ondangwa, Namibia: Baseline Environmental Noise Assessment
Report Number:18SLR21-NIA iii
GLOSSARY AND ABBREVIATIONS
Airshed Airshed Planning Professionals (Pty) Ltd
dB Descriptor that is used to indicate 10 times a logarithmic ratio of quantities that have the same units, in this case sound pressure.
dBA Descriptor that is used to indicate 10 times a logarithmic ratio of quantities that have the same units, in this case sound pressure that has been A-weighted to simulate human hearing.
EHS Environmental, Health, and Safety (IFC)
Hz Frequency in Hertz
IEC International Electro Technical Commission
IFC International Finance Corporation
LAeq (T) The A-weighted equivalent sound pressure level, where T indicates the time over which the noise is averaged (calculated or measured) (in dBA)
LAIeq (T) The impulse corrected A-weighted equivalent sound pressure level, where T indicates the time over which the noise is averaged (calculated or measured) (in dBA)
LReq,d The LAeq rated for impulsive sound and tonality in accordance with SANS 10103 for the day-time period, i.e. from 06:00 to 22:00.
LReq,n The LAeq rated for impulsive sound and tonality in accordance with SANS 10103 for the night-time period, i.e. from 22:00 to 06:00.
LR,dn The LAeq rated for impulsive sound and tonality in accordance with SANS 10103 for the period of a day and night, i.e. 24 hours, and wherein the LReq,n has been weighted with 10dB in order to account for the additional disturbance caused by noise during the night.
LA90 The A-weighted 90% statistical noise level, i.e. the noise level that is exceeded during 90% of the measurement period. It is a very useful descriptor which provides an indication of what the LAeq could have been in the absence of noisy single events and is considered representative of background noise levels (LA90) (in dBA)
LAFmax The A-weighted maximum sound pressure level recorded during the measurement period
LAFmin The A-weighted minimum sound pressure level recorded during the measurement period
LP Sound pressure level (in dB)
LPA A-weighted sound pressure level (in dBA)
LW
Mamsl
Sound Power Level (in dB)
Metres above mean sea level
NLG Noise level guideline
NSR Noise sensitive receptor
p Pressure in Pa
pref Reference pressure, 20 μPa
SABS South African Bureau of Standards
SANS South African National Standards
SLM Sound Level Meter
SoW Scope of Work
WHO World Health Organisation
Henning Crushers Ondangwa, Namibia: Baseline Environmental Noise Assessment
Report Number:18SLR21-NIA iv
EXECUTIVE SUMMARY
Airshed Planning Professionals (Pty) Ltd (Airshed) was appointed by SLR Environmental Consulting (Namibia)
(Pty) Ltd (SLR) to undertake an environmental noise specialist study for Henning Crusher. This report outlines the
findings of the baseline component of the noise specialist study.
The main objective of the noise specialist study was to determine the significance of impacts on the acoustic
environment and noise receptors given noise generated by activities at Henning Crusher during operational and
non-operational hours, and to provide mitigation measures if required. The baseline component of the study
identified noise receptors in the study area, assessed the noise propagation and attenuation potential of the study
area and surveyed the existing environmental noise levels in the study area. The findings of the baseline
assessment are presented below:
• Noise receptors (these include places of residence and areas where members of the public may be
affected by noise generated by proposed activities) include the town of Odangwa located to the southeast
of Henning Crusher, the residential area directly to the southwest, and small informal settlements within
± 1km radius of the operation.
• The acoustic climate at noise receptors is currently affected by traffic from the main road, community
activities, Henning Crushers’ customer vehicles and trucks movements, domesticated animals as well as
natural noises such as birds, insects and noise created by wind blowing through trees (rustling leaves).
• All sampled levels are comparable to what is typically expected within industrial areas (SANS 10103). All
recorded LAeq’s were in compliance with International Finance Corporation (IFC) guidelines for Industrial
receptors (70 dBA) day and (70dBA) night.
• Even though the noise levels are regarded acceptable, it is recommended that a complaints register be
kept and that the community around the facility be made aware of the register. Should there be persistent
complaints, further investigation of noise mitigation options at the site is recommended.

Henning Crushers Ondangwa, Namibia: Baseline Environmental Noise Assessment
Report Number:18SLR21-NIA v
TABLE OF CONTENTS
1 INTRODUCTION ................................................................................................................................................. 1
1.1 Objective ................................................................................................................................................ 1
1.2 Henning Crusher Operations ................................................................................................................. 1
1.3 Scope of Work ....................................................................................................................................... 2
1.4 Background to Environmental Noise and the Assessment Thereof ....................................................... 2
1.5 Approach and Methodology ................................................................................................................... 5
2 LEGISLATIVE CONTEXT .................................................................................................................................... 8
2.1 IFC Guidelines on Environmental Noise ................................................................................................ 8
2.2 SANS 10103 (2008) .............................................................................................................................. 8
2.3 Criteria applied in this Assessment ........................................................................................................ 9
3 SURVEY OF THE RECEIVING ENVIRONMENT ..................................................................................................... 10
3.1 Noise Sensitive Receptors .................................................................................................................. 10
3.2 Baseline Noise Survey and Results..................................................................................................... 12
4 CONCLUSION ................................................................................................................................................. 17
4.1 Recommendations ............................................................................................................................... 17
5 REFERENCES ................................................................................................................................................. 18
6 APPENDIX A| CALIBRATION CERTIFICATES ..................................................................................................... 19
7 APPENDIX B | SITE PHOTOGRAPHS ................................................................................................................. 23
8 APPENDIX C | TIME-SERIES, STATISTICAL, AND FREQUENCY SPECTRUM RESULTS ........................................... 25
9 APPENDIX D | FIELD LOG SHEETS .................................................................................................................. 32
LIST OF TABLES
Table 1: SLM details ............................................................................................................................................... 6
Table 2: Level differences for the presence of a tonal component .......................................................................... 7
Table 3: IFC noise level guidelines ......................................................................................................................... 8
Table 4: Typical rating levels for outdoor noise, SANS 10103 (2008) ..................................................................... 9
Table 5: Survey coordinates ................................................................................................................................. 10
Table 6: The project baseline environmental noise survey results summary ........................................................ 12
LIST OF FIGURES
Figure 1: The decibel scale, typical noise levels (Brüel & Kjær Sound & Vibration Measurement A/S, 2000) ........ 3
Figure 2: A-weighting curve (Beech & Zacharov, 2006) .......................................................................................... 4
Figure 3: Noise sensitive receptors within the study area and survey locations .................................................. 11
Figure 4: Day-time broadband survey results of Henning crusher operational at bucket No.2 ............................. 14
Figure 5: Day-time broadband survey results of Henning crusher at bucket No.4 ................................................ 15
Figure 6: Night-time broadband survey results of Henning Crusher ..................................................................... 16
Figure 7: Detailed survey results of Henning crusher operational at dust bucket 2 .............................................. 26
Figure 8: Detailed survey results of Henning crusher not operational at dust bucket 2 ........................................ 27

Henning Crushers Ondangwa, Namibia: Baseline Environmental Noise Assessment
Report Number:18SLR21-NIA vi
Figure 9: Detailed survey results of Henning crusher operational at dust bucket 4 .............................................. 28
Figure 10: Detailed survey results of Henning crusher not operational at dust bucket 4 ...................................... 29
Figure 11: Detailed survey results at night of Henning crusher at dust bucket 2 .................................................. 30
Figure 12: Detailed survey results at night of Henning crusher at dust bucket 4 .................................................. 31

Henning Crushers Ondangwa, Namibia: Baseline Environmental Noise Assessment
Report Number:18SLR21-NIA 1
1 Introduction
Airshed Planning Professionals (Pty) Ltd (Airshed) was commissioned by SLR Environmental Consulting (Namibia)
to undertake an environmental noise specialist study as part of the Environmental Management Plan for Henning
crusher. Henning Crusher is located north-west of Ondangwa town, in Oshana region northern Namibia.
In the absence of Namibian environmental noise and impact guidelines, reference is made to guidelines published
by the IFC (IFC, 2007) and the South African Bureau of Standards (SABS) (SANS 10103, 2008). Both these
guidelines are in line with the World Health Organisation (WHO) Guidelines for Community Noise (WHO, 1999).
The survey’s purpose and tasks included in the Scope of Work (SoW) are set out below.
1.1 Objective
The main objective of the noise survey was to determine through measurement, ambient baseline noise levels
during the day (during operational and non-operational hours) and during the night in comparison with noise level
guidelines.
1.2 Henning Crusher Operations
Henning Crusher produces bricks (sand and gravel) and operates between the hours of 07:00 and 17:00. Activities
at Henning Crusher that generate noise include the following:
• Brickmaking plant operations;
• Handling of materials i.e. stockpiling by loading of product to trucks;
• Loading and hauling of raw material(sand/gravel) to the brick maker plant;
• Customer vehicles and truck movements; and
• Other heavy vehicle movements on site (e.g. front loader).
Henning crusher equipment can be described or divided into distinct categories. These include materials handling
equipment, stationary equipment, impact equipment, and other types of equipment. The first two categories include
machines that are powered by internal combustion engines. Machines in the latter categories are powered
pneumatically, hydraulically, or electrically. Additionally, exhaust noise tends to account for most of the noise
emitted by machines in the first two categories (those that use internal combustion engines) whereas engine-
related noise is usually secondary to the noise produced by the impact between impact equipment (such as
brickmaker) and the material on which it acts.
Henning Crusher equipment generally produces noise in the lower end of the frequency spectrum. Reverse, or
moving beeper, alarms emit at higher frequency ranges and are often heard over long distances.
Noise generated by Henning Crusher operations is highly variably since it is characterised by variations in the
power expended by equipment. Besides having daily variations in activities, the plant activities are accomplished
Henning Crushers Ondangwa, Namibia: Baseline Environmental Noise Assessment
Report Number:18SLR21-NIA 2
in several different phases where each phase has a specific equipment mix depending on the work to accomplished
during that phase i.e. loading to trucks, brick making and subsequent sand/gravel removal and loading.
1.3 Scope of Work
The following tasks are included in the noise impact assessment:
1. A baseline study; including;
a. A short-term noise sampling campaign at two (2) different locations during the day (30 minutes
per sample) and night (30 min minutes per sample) and in accordance with the South African
National Standards (SANS) 10103 (2008) and the International Finance Corporation’s (IFC)
General Environmental, Health and Safety Guidelines (EHS) of 2007.
b. A desktop study of the receiving (baseline) acoustic environment, includes:
i. The identification of noise sensitive receptors from available maps.
ii. Results processing and analysis of sampled baseline noise levels.
c. A baseline environmental noise report, including recommendations.
1.4 Background to Environmental Noise and the Assessment Thereof
Before more details regarding the approach and methodology adopted in the assessment is given, the reader is
provided with some background, definitions and conventions used in the measurement, calculation and
assessment of environmental noise.
Noise is generally defined as unwanted sound transmitted through a compressible medium such as air. Sound in
turn, is defined as any pressure variation that the ear can detect. Human response to noise is complex and highly
variable as it is subjective rather than objective.
A direct application of linear scales (in Pa) to the measurement and calculation of sound pressure leads to large
and unwieldy numbers. As the ear responds logarithmically rather than linearly to stimuli, it is more practical to
express acoustic parameters as a logarithmic ratio of the measured value to a reference value. This logarithmic
ratio is called a decibel or dB. The advantage of using dB can be clearly seen in Figure 1. Here, the linear scale
with its large numbers is converted into a manageable scale from 0 dB at the threshold of hearing (20 μPa) to 130
dB at the threshold of pain (~100 Pa) (Brüel & Kjær Sound & Vibration Measurement A/S, 2000).
As explained, noise is reported in dB. “dB” is the descriptor that is used to indicate 10 times a logarithmic ratio of
quantities that have the same units, in this case sound pressure. The relationship between sound pressure and
sound pressure level is illustrated in this equation.
𝐿𝑝 = 20 ∙ log10 (𝑝
𝑝𝑟𝑒𝑓)
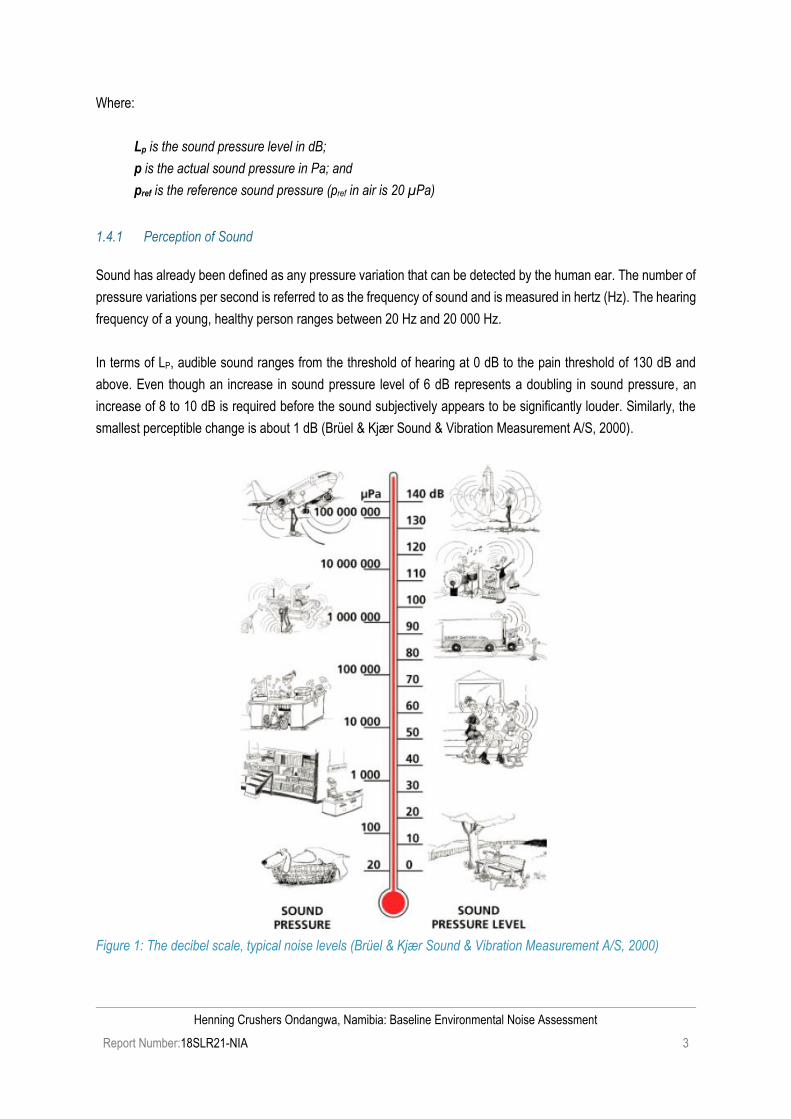
Henning Crushers Ondangwa, Namibia: Baseline Environmental Noise Assessment
Report Number:18SLR21-NIA 3
Where:
Lp is the sound pressure level in dB;
p is the actual sound pressure in Pa; and
pref is the reference sound pressure (pref in air is 20 µPa)
1.4.1 Perception of Sound
Sound has already been defined as any pressure variation that can be detected by the human ear. The number of
pressure variations per second is referred to as the frequency of sound and is measured in hertz (Hz). The hearing
frequency of a young, healthy person ranges between 20 Hz and 20 000 Hz.
In terms of LP, audible sound ranges from the threshold of hearing at 0 dB to the pain threshold of 130 dB and
above. Even though an increase in sound pressure level of 6 dB represents a doubling in sound pressure, an
increase of 8 to 10 dB is required before the sound subjectively appears to be significantly louder. Similarly, the
smallest perceptible change is about 1 dB (Brüel & Kjær Sound & Vibration Measurement A/S, 2000).
Figure 1: The decibel scale, typical noise levels (Brüel & Kjær Sound & Vibration Measurement A/S, 2000)

Henning Crushers Ondangwa, Namibia: Baseline Environmental Noise Assessment
Report Number:18SLR21-NIA 4
1.4.2 Frequency Weighting
Since human hearing is not equally sensitive to all frequencies, a ‘filter’ has been developed to simulate human
hearing. The ‘A-weighting’ filter simulates the human hearing characteristic, which is less sensitive to sounds at
low frequencies than at high frequencies (Figure 2:). “dBA” is the descriptor that is used to indicate 10 times a
logarithmic ratio of quantities, that have the same units (in this case sound pressure) that has been A-weighted.
Figure 2: A-weighting curve (Beech & Zacharov, 2006)
1.4.3 Environmental Noise Indices
In assessing environmental noise either by measurement or calculation, reference is generally made to the
following indices:
• LAeq (T) – The A-weighted equivalent sound pressure level, where T indicates the time over which the
noise is averaged (calculated or measured). The International Finance Corporation (IFC) provides
guidance with respect to LAeq (1 hour), the A-weighted equivalent sound pressure level, averaged over 1
hour.
• LAIeq (T) – The impulse corrected A-weighted equivalent sound pressure level, where T indicates the time
over which the noise is averaged (calculated or measured). In the South African Bureau of Standards’
(SABS) South African National Standard (SANS) 10103 of 2008 for ‘The measurement and rating of
environmental noise with respect to annoyance and to speech communication’ prescribes the sampling
of LAIeq (T).
• LReq,d – The LAeq rated for impulsive sound (LAIeq) and tonality in accordance with SANS 10103 for the
day-time period, i.e. from 06:00 to 22:00.
-80
-70
-60
-50
-40
-30
-20
-10
0
10
12 120 1200 12000
dB
Ad
just
me
nt
Frequency (Hz)
A-weighting Curve

Henning Crushers Ondangwa, Namibia: Baseline Environmental Noise Assessment
Report Number:18SLR21-NIA 5
• LReq,n – The LAeq rated for impulsive sound (LAIeq) and tonality in accordance with SANS 10103 for the
night-time period, i.e. from 22:00 to 06:00.
• LR,dn – The LAeq rated for impulsive sound (LAIeq) and tonality in accordance with SANS 10103 for the
period of a day and night, i.e. 24 hours, and wherein the LReq,n has been weighted with 10 dB to account
for the additional disturbance caused by noise during the night
• LA90 – The A-weighted 90% statistical noise level, i.e. the noise level that is exceeded during 90% of the
measurement period. It is a very useful descriptor which provides an indication of what the LAeq could
have been in the absence of noisy single events and is considered representative of background noise
levels.
• LAFmax – The maximum A-weighted noise level measured with the fast time weighting. It’s the highest level
of noise that occurred during a sampling period.
• LAFmin – The minimum A-weighted noise level measured with the fast time weighting. It’s the lowest level
of noise that occurred during a sampling period.
1.5 Approach and Methodology
The baseline assessment included a study of the legal requirements pertaining to environmental noise impacts, a
study of the physical environment of the area surrounding the project and the analyses of existing noise levels in
the area.
1.5.1 Survey Methodology
The survey methodology, which closely follows guidance provided by the IFC General Environmental, Health and
Safety (EHS) Guidelines (IFC, 2007) and SANS 10103 (2008), is summarised below:
• The survey was designed by a trained Airshed specialist.
• Sampling was carried out using a Type 1 sound level meter (SLM) that meets all appropriate International
Electrotechnical Commission (IEC) standards and is subject to annual calibration by an accredited
laboratory. Equipment details are included in Table 1. Calibration certificates are included in Appendix A.
• The acoustic sensitivity of the SLM was tested with a portable acoustic calibrator before and after each
sampling session.
• Samples, 30 minutes (day) and 30 minutes (night) in duration, representative and sufficient for statistical
analysis were taken with the use of the portable SLM capable of logging data continuously over the time.
As per the SoW, samples representative of the day and night-time acoustic environment were taken.
SANS 10103 defines day-time as between 06:00 and 22:00 and night-time between 22:00 and 06:00
(SANS 10103, 2008).
• The following acoustic indices were recoded: LAeq; LAIeq; LAFmax; LAFmin; LA90 and 3rd octave frequency
spectra, which closely follows guidance provided by the IFC General Environmental, Health and Safety
(EHS) Guidelines (IFC, 2007) and SANS 10103 (2008)
• The SLM was located approximately 1.5 m above the ground and 10 m from reflecting surfaces.
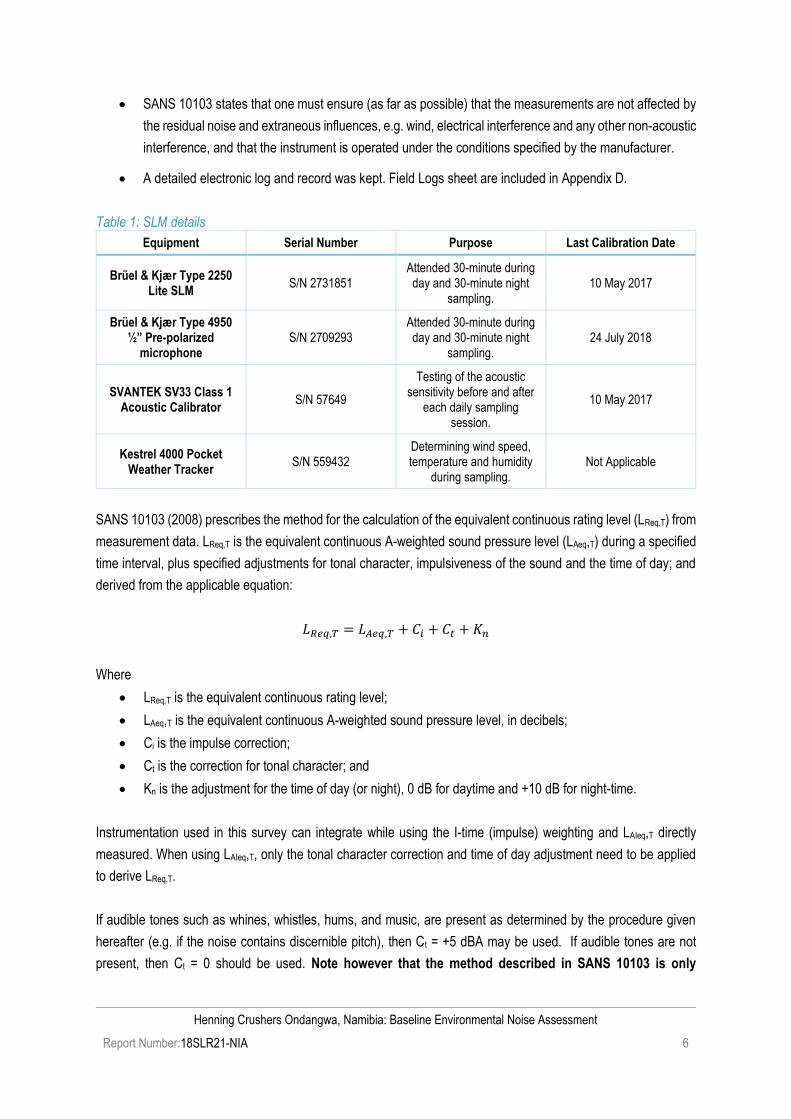
Henning Crushers Ondangwa, Namibia: Baseline Environmental Noise Assessment
Report Number:18SLR21-NIA 6
• SANS 10103 states that one must ensure (as far as possible) that the measurements are not affected by
the residual noise and extraneous influences, e.g. wind, electrical interference and any other non-acoustic
interference, and that the instrument is operated under the conditions specified by the manufacturer.
• A detailed electronic log and record was kept. Field Logs sheet are included in Appendix D.
Table 1: SLM details
Equipment Serial Number Purpose Last Calibration Date
Brüel & Kjær Type 2250 Lite SLM
S/N 2731851 Attended 30-minute during day and 30-minute night
sampling. 10 May 2017
Brüel & Kjær Type 4950 ½” Pre-polarized
microphone S/N 2709293
Attended 30-minute during day and 30-minute night
sampling. 24 July 2018
SVANTEK SV33 Class 1 Acoustic Calibrator
S/N 57649
Testing of the acoustic sensitivity before and after
each daily sampling session.
10 May 2017
Kestrel 4000 Pocket Weather Tracker
S/N 559432 Determining wind speed, temperature and humidity
during sampling. Not Applicable
SANS 10103 (2008) prescribes the method for the calculation of the equivalent continuous rating level (LReq,T) from
measurement data. LReq,T is the equivalent continuous A-weighted sound pressure level (LAeq,T) during a specified
time interval, plus specified adjustments for tonal character, impulsiveness of the sound and the time of day; and
derived from the applicable equation:
𝐿𝑅𝑒𝑞,𝑇 = 𝐿𝐴𝑒𝑞,𝑇 + 𝐶𝑖 + 𝐶𝑡 + 𝐾𝑛
Where
• LReq,T is the equivalent continuous rating level;
• LAeq,T is the equivalent continuous A-weighted sound pressure level, in decibels;
• Ci is the impulse correction;
• Ct is the correction for tonal character; and
• Kn is the adjustment for the time of day (or night), 0 dB for daytime and +10 dB for night-time.
Instrumentation used in this survey can integrate while using the I-time (impulse) weighting and LAIeq,T directly
measured. When using LAIeq,T, only the tonal character correction and time of day adjustment need to be applied
to derive LReq,T.
If audible tones such as whines, whistles, hums, and music, are present as determined by the procedure given
hereafter (e.g. if the noise contains discernible pitch), then Ct = +5 dBA may be used. If audible tones are not
present, then Ct = 0 should be used. Note however that the method described in SANS 10103 is only

Henning Crushers Ondangwa, Namibia: Baseline Environmental Noise Assessment
Report Number:18SLR21-NIA 7
recommended if there is uncertainty as to the presence of pitch and is considered a recommendation, not
a requirement. The correction is predominantly the result of the subjective opinion of the specialist.
The presence of tones can be determined as follows (SANS 10103, 2008): Using a one-third octave band filter,
which complies with the requirements of IEC 61260, the time average sound pressure level in the one-third octave
band that contains the tone to be investigated as well as the time average one-third octave band sound pressure
level in the adjacent bands to the one that contains the tone frequency should be measured. The difference
between the time average sound pressure levels in the two adjacent one-third octave bands should be determined
with the time average sound pressure level of the one-third octave band that contains the tone frequency. A level
difference between the one-third octave band that contains the tone frequency and the two adjacent one-third
octave bands should exceed the limits given in Table 2 to indicate the presence of a tonal component.
NOTE: the adjustment for tonality will only applied if the tone was clearly identifiable as being generated by human
activities and not birds or insects. For this study tonality was not applied.
Table 2: Level differences for the presence of a tonal component
Centre frequencies of 3rd octave bands (Hz) Minimum 3rd octave band LP difference (dB)
25 to 125 15
160 to 400 8
500 to 10 000 5
The equivalent continuous day/night rating level can be calculated using the following equation:
𝐿𝑅,𝑑𝑛 = ⌊(𝑑
24)10𝐿𝑅𝑒𝑞,𝑑 10⁄ + (
24 − 𝑑
24) 10(𝐿𝑅𝑒𝑞,𝑛+𝑘𝑛) 10⁄ ⌋
Where
• LR,dn is the equivalent continuous day/night rating level;
• D is the duration of the day-time reference time period (06:00 to 22:00);
• LReq,d is the equivalent continuous rating level determined for the day-time reference time period (06:00
to 22:00);
• LReq,n is the equivalent continuous rating level determined for the night-time reference time period (22:00
to 06:00); and
• Kn is the adjustment 10 dB that should be added to the night-time equivalent continuous rating level.

Henning Crushers Ondangwa, Namibia: Baseline Environmental Noise Assessment
Report Number:18SLR21-NIA 8
2 Legislative Context
In the absence of Namibian environmental noise and impact guidelines reference is made to guidelines published
by the IFC (IFC, 2007) and the South African Bureau of Standards (SABS) (SANS 10103, 2008). Both these
guidelines are in line with the World Health Organisation (WHO) Guidelines for Community Noise (WHO, 1999).
2.1 IFC Guidelines on Environmental Noise
The IFC General EHS Guidelines on noise address impacts of noise beyond the property boundary of the facility
under consideration and provides noise level guidelines.
The IFC states that noise impacts should not exceed the levels presented in Table 3, or result in a maximum
increase above background levels of 3 dBA at the nearest receptor location off-site (IFC, 2007). For a person
with average hearing acuity an increase of less than 3 dBA in the general ambient noise level is not detectable.
= 3 dBA is, therefore, a useful significance indicator for a noise impact.
Table 3: IFC noise level guidelines
Noise Level Guidelines (IFC, 2007)
Area One Hour LAeq (dBA)
07:00 to 22:00
One Hour LAeq (dBA)
22:00 to 07:00
Industrial receptors 70 70
Residential, institutional and educational receptors 55 45
2.2 SANS 10103 (2008)
SANS 10103 (2008) successfully addresses the way environmental noise measurements are to be taken and
assessed in South Africa and is fully aligned with the WHO guidelines for Community Noise (WHO, 1999). It should
be noted that the values given in Table 4 are typical rating levels that it is recommended should not be exceeded
outdoors in the different districts specified. Outdoor ambient noise exceeding these levels may be annoying to the
community.
SANS 10103 also provides a useful guideline for estimating community response to an increase in the general
ambient noise level caused by intruding noise. If Δ is the increase in noise level, the following criteria are of
relevance:
• “ 0 dB: There will be no community reaction;
• 0 dB < 10 dB: There will be ‘little’ reaction with ‘sporadic complaints’;
• 5 dB < 15 dB: There will be a ‘medium’ reaction with ‘widespread complaints’. = 10 dB is subjectively
perceived as a doubling in the loudness of the noise;
• 10 dB < 20 dB: There will be a ‘strong’ reaction with ‘threats of community action’; and
• >15 dB: There will be a ‘very strong’ reaction with ‘vigorous community action’.

Henning Crushers Ondangwa, Namibia: Baseline Environmental Noise Assessment
Report Number:18SLR21-NIA 9
Table 4: Typical rating levels for outdoor noise, SANS 10103 (2008)
Type of district
Equivalent Continuous Rating Level (LReq,T) for Outdoor Noise
Day/night
LR,dn(c) (dBA)
Day-time
LReq,d(a) (dBA)
Night-time
LReq,n(b) (dBA)
Rural districts 45 45 35
Suburban districts with little road traffic 50 50 40
Urban districts 55 55 45
Urban districts with one or more of the following; business premises; and main roads.
60 60 50
Central business districts 65 65 55
Industrial districts 70 70 60
Notes
(a) LReq,d =The LAeq1 rated for impulsive sound and tonality in accordance with SANS 10103 for the day-time period, i.e. from 06:00
to 22:00.
(b) LReq,n =The LAeq rated for impulsive sound and tonality in accordance with SANS 10103 for the night-time period, i.e. from 22:00
to 06:00.
(c) LR,dn =The LAeq rated for impulsive sound and tonality in accordance with SANS 10103 for the period of a day and night, i.e. 24
hours, and wherein the LReq,n has been weighted with 10dB to account for the additional disturbance caused by noise during the
night.
The categories of community response overlap because the response of a community does not occur as a stepwise
function, but rather as a gradual change.
It is further important to note that the SANS 10103 guidelines for urban districts correspond with the IFC noise level
guidelines for residential, institutional and educational receptors.
2.3 Criteria applied in this Assessment
Reference is made to the IFC noise guideline level for residential, institutional and educational receptors and the
increase in noise levels of 3 dBA above background levels.

Henning Crushers Ondangwa, Namibia: Baseline Environmental Noise Assessment
Report Number:18SLR21-NIA 10
3 Survey of the Receiving Environment
This chapter provides details of the receiving acoustic environment which is described in terms of:
• Local noise sensitive receptors;
• The local environmental noise propagation and attenuation potential; and
• Current noise levels and the existing acoustic climate.
3.1 Noise Sensitive Receptors
Noise sensitive receptors generally include places of residence and areas where members of the public may be
affected by noise generated by Henning Crusher, processing and transport activities.
The impacts of an intruding industrial noise on the environment rarely extends over more than 5 km from the
source. Noise sensitive receptors within 5 km of the project include individual homesteads in the town of Ondangwa
to the southeast of the plant and directly to the southwest, and small informal settlements to the north.
Sites for the noise survey were selected after careful consideration of Henning Crusher activities, accessibility and
safety restrictions. A total of two survey points was included in this assessment. The survey locations are shown
in Figure 3, with coordinates provided in Table 5. Photographs of the sites are included in Appendix B
Table 5: Survey coordinates
Area Site Coordinates Comment
Industrial At dust bucket 2 17°53'52.34"S; 15°57'52.36"E Location is between the plant operations and the residential area to the southwest, next to the public road
Industrial At dust bucket 4 17°53'43.43"S; 15°58'1.20"E Location is to the north-northeast and between the plant operations and the informal housing t
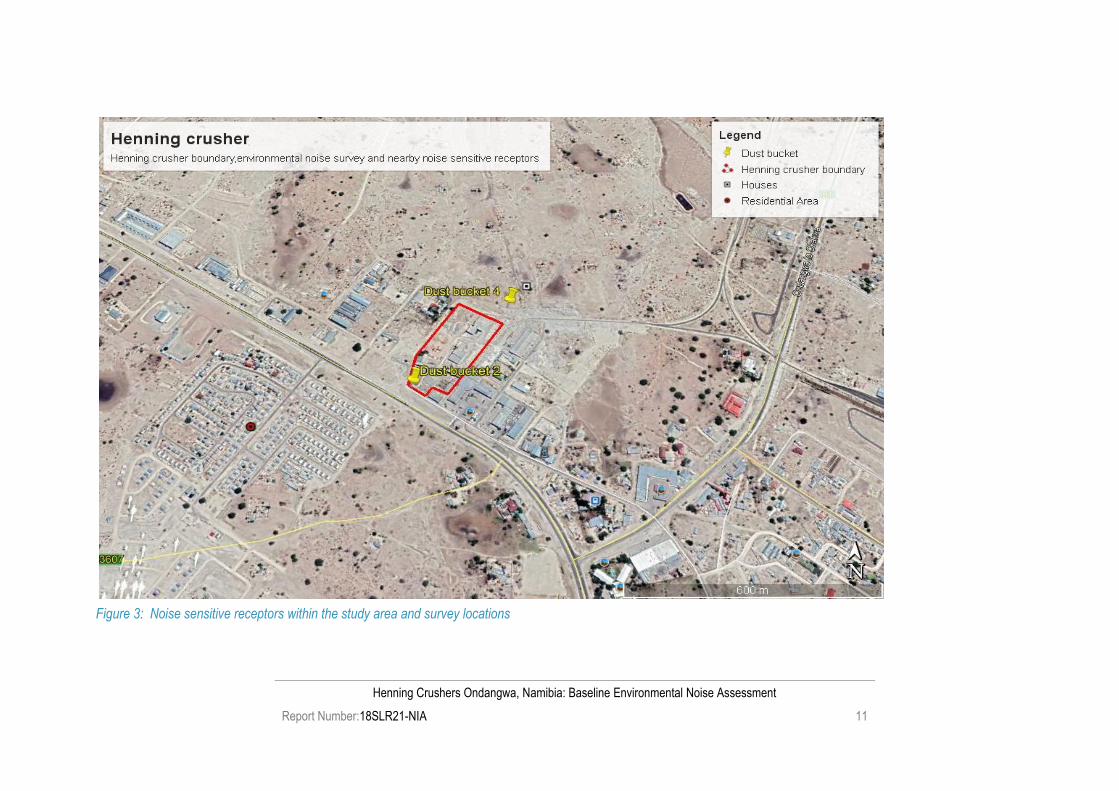
Henning Crushers Ondangwa, Namibia: Baseline Environmental Noise Assessment
Report Number:18SLR21-NIA 11
Figure 3: Noise sensitive receptors within the study area and survey locations
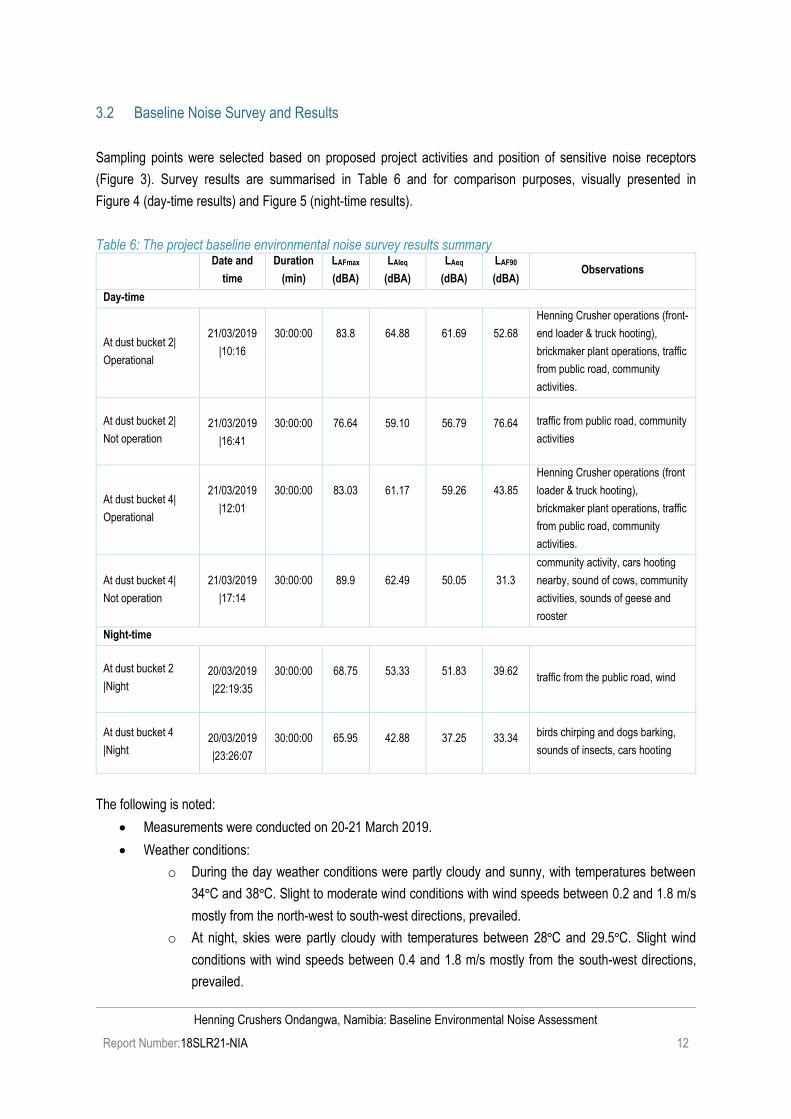
Henning Crushers Ondangwa, Namibia: Baseline Environmental Noise Assessment
Report Number:18SLR21-NIA 12
3.2 Baseline Noise Survey and Results
Sampling points were selected based on proposed project activities and position of sensitive noise receptors
(Figure 3). Survey results are summarised in Table 6 and for comparison purposes, visually presented in
Figure 4 (day-time results) and Figure 5 (night-time results).
Table 6: The project baseline environmental noise survey results summary
Date and
time
Duration
(min)
LAFmax
(dBA)
LAIeq
(dBA)
LAeq
(dBA)
LAF90
(dBA) Observations
Day-time
At dust bucket 2|
Operational
21/03/2019
|10:16
30:00:00
83.8
64.88
61.69
52.68
Henning Crusher operations (front-
end loader & truck hooting),
brickmaker plant operations, traffic
from public road, community
activities.
At dust bucket 2|
Not operation
21/03/2019
|16:41
30:00:00
76.64
59.10
56.79
76.64 traffic from public road, community
activities
At dust bucket 4|
Operational
21/03/2019
|12:01
30:00:00
83.03
61.17
59.26
43.85
Henning Crusher operations (front
loader & truck hooting),
brickmaker plant operations, traffic
from public road, community
activities.
At dust bucket 4|
Not operation
21/03/2019
|17:14
30:00:00
89.9
62.49
50.05
31.3
community activity, cars hooting
nearby, sound of cows, community
activities, sounds of geese and
rooster
Night-time
At dust bucket 2
|Night
20/03/2019
|22:19:35
30:00:00
68.75
53.33
51.83
39.62 traffic from the public road, wind
At dust bucket 4
|Night
20/03/2019
|23:26:07
30:00:00
65.95
42.88
37.25
33.34 birds chirping and dogs barking,
sounds of insects, cars hooting
The following is noted:
• Measurements were conducted on 20-21 March 2019.
• Weather conditions:
o During the day weather conditions were partly cloudy and sunny, with temperatures between
34ºC and 38ºC. Slight to moderate wind conditions with wind speeds between 0.2 and 1.8 m/s
mostly from the north-west to south-west directions, prevailed.
o At night, skies were partly cloudy with temperatures between 28ºC and 29.5ºC. Slight wind
conditions with wind speeds between 0.4 and 1.8 m/s mostly from the south-west directions,
prevailed.
Henning Crushers Ondangwa, Namibia: Baseline Environmental Noise Assessment
Report Number:18SLR21-NIA 13
• Day-time broadband survey results of Henning Crusher operational:
o Noise levels at both buckets No.2 and No.4 while Henning Crusher was operational were mostly
affected by activities such as front-end loaders, brickmaking plant operations, loading of bricks
to trucks, loading and hauling of raw materials (sand and crusher dust) to the brick maker plant,
customer vehicles and truck movements.
o LAeq’s ranged between 59.26 dBA and 61.69 dBA which are below noise level guidelines
according to IFC and SANS 10103.
o All sampled levels are comparable to what is typically expected within industrial areas (SANS 10103).
o All recorded LAeq’s were in compliance with IFC guidelines for industrial receptors. (70 dBA).
• Day-time broadband survey results of Henning Crusher not operational:
o Measurement levels at both buckets No.2 and No.4 while Henning Crusher was not operational
were mostly affected by activities such traffic from main public road (bucket No.2), community,
and sounds of geese and chickens (bucket No.4).
o LAeq’s ranged between 50.05 dBA and 56.79 dBA which are below noise level guidelines
according to IFC and SANS 10103.
o All sampled levels are comparable to what is typically expected within industrial areas (SANS
10103).
• Night-time baseline noise levels:
o Measurements indicated night-time ambient noise levels that are quiet and below IFC guidelines
for industrial areas.
o Recorded LAeq’s during the night ranged between 37.25 dBA and 51.83 dBA and were within IFC
guidelines for industrial receptors (70 dBA).
o All levels were below noise level guidelines according to IFC and SANS 10103.
For detailed time-series, frequency spectra and statistical results, the reader is referred to Appendix C. Field log
sheets containing weather records are included in Appendix D.

Henning Crushers Ondangwa, Namibia: Baseline Environmental Noise Assessment
Report Number:18SLR21-NIA 14
Figure 4: Day-time broadband survey results of Henning crusher operational at bucket No.2
52,68
43,71
61,69
56,79
64,88
59,1
0
10
20
30
40
50
60
70
80
At dust bucket 2 |21/03/2019 10:16:17|OPERATIONAL At dust bucket 2 |21/03/2019 16:41:33| NOT OPERATIONAL
DB
A
DAY-TIME BROADBAND SURVEY RESULTS AT DUST BUCKET 2
LAF90 LAeq LAIeq NLG Industrial area .
70
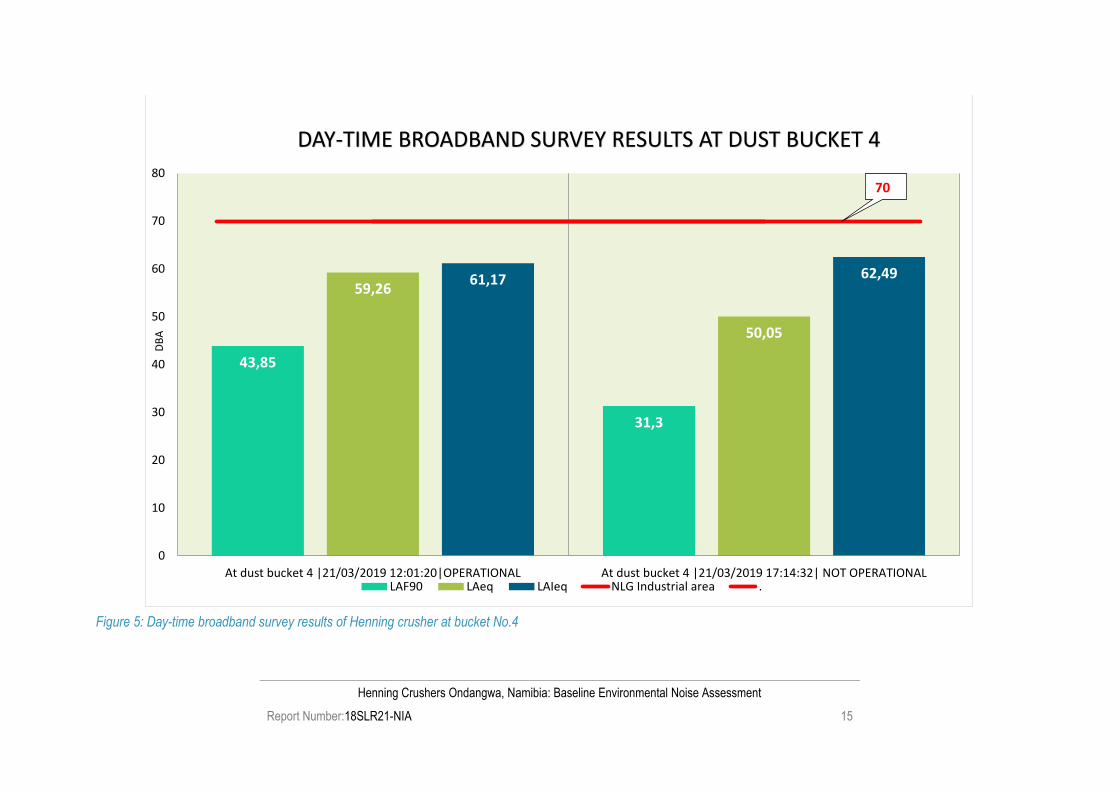
Henning Crushers Ondangwa, Namibia: Baseline Environmental Noise Assessment
Report Number:18SLR21-NIA 15
Figure 5: Day-time broadband survey results of Henning crusher at bucket No.4
43,85
31,3
59,26
50,05
61,17 62,49
0
10
20
30
40
50
60
70
80
At dust bucket 4 |21/03/2019 12:01:20|OPERATIONAL At dust bucket 4 |21/03/2019 17:14:32| NOT OPERATIONAL
DB
A
DAY-TIME BROADBAND SURVEY RESULTS AT DUST BUCKET 4
LAF90 LAeq LAIeq NLG Industrial area .
70

Henning Crushers Ondangwa, Namibia: Baseline Environmental Noise Assessment
Report Number:18SLR21-NIA 16
Figure 6: Night-time broadband survey results of Henning Crusher
39,62
33,34
51,83
37,25
53,33
42,88
0
10
20
30
40
50
60
70
80
At dust bucket 2 Night| 20/03/2019| 22:19:35 At dust bucket 4 Night |20/03/2019 |23:26:07
DB
ANIGHT-TIME BROADBAND SURVEY RESULTS
LAF90 LAeq LAIeq NLG Industrial area .
70

Henning Crushers Ondangwa, Namibia: Baseline Environmental Noise Assessment
Report Number:18SLR21-NIA 17
4 Conclusion
For the purpose of this assessment, given the description of the baseline acoustic environment and survey results,
we can conclude that:
• All sampled levels are comparable to what is typically expected within industrial areas (SANS 10103).
• All recorded LAeq’s were in compliance with IFC guidelines for industrial receptors (70 dBA) day and (70
dBA) night.
4.1 Recommendations
Even though the noise levels are regarded acceptable, it is recommended that a complaints register be kept and
that the community around the facility be made aware of the register. Should there be persistent complaints, further
investigation of noise mitigation options at the site is recommended.

Henning Crushers Ondangwa, Namibia: Baseline Environmental Noise Assessment
Report Number:18SLR21-NIA 18
5 References
Beech, S. & Zacharov, N., 2006. Perceptual Audio Evaluation-Theory, Method and Application. [Online]
Availableat:http://onlinelibrary.wiley.com/doi/10.1002/9780470869253.app4/pdf
[Accessed 15 January 2017].
Brüel & Kjær Sound & Vibration Measurement A/S, 2000. www.bksv.com. [Online]
Availableat:http://www.bksv.com
[Accessed 14 October 2011].
Bugliarello, G., Alexandre, A., Barnes, J. & Wakstein, C., 1976. The impact of noise pollution | A socio-technological
introduction. s.l.:Pergamon Press.
IFC, 2007. General Environmental, Health and Safety Guidelines, s.l.: s.n.
SANS 10103, 2008. The measurement and rating of environmental noise with respect to annoyance and to speech
communication, Pretoria: Standards South Africa.
The Republic of South Africa, 1992. Noise Control Regulations in terms of Section 25 of the Environment
Conservation Act, Notice R154, Government Gazette 13717, 10 January 1992. s.l.:Government Printing Works.
WHO, 1999. Guidelines to Community Noise. s.l.:s.n.

Henning Crushers Ondangwa, Namibia: Baseline Environmental Noise Assessment
Report Number:18SLR21-NIA 19
6 Appendix A| Calibration Certificates

Henning Crushers Ondangwa, Namibia: Baseline Environmental Noise Assessment
Report Number:18SLR21-NIA 20

Henning Crushers Ondangwa, Namibia: Baseline Environmental Noise Assessment
Report Number:18SLR21-NIA 21
Henning Crushers Ondangwa, Namibia: Baseline Environmental Noise Assessment
Report Number:18SLR21-NIA 22
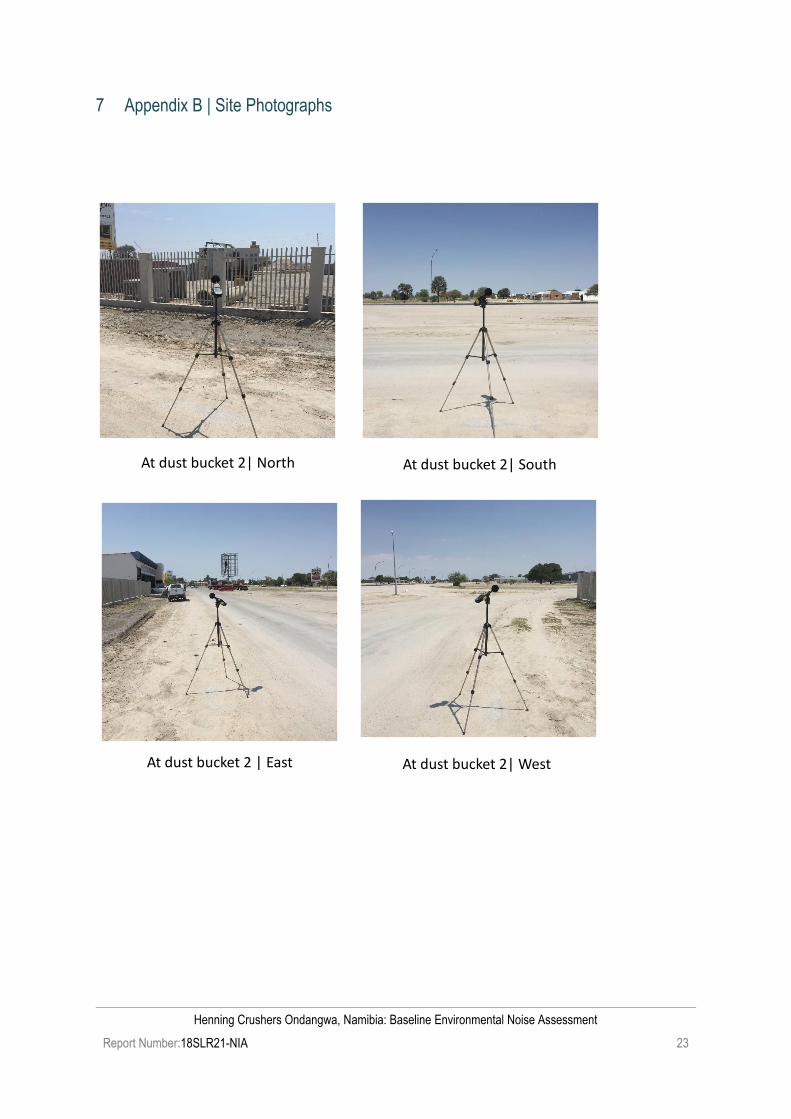
Henning Crushers Ondangwa, Namibia: Baseline Environmental Noise Assessment
Report Number:18SLR21-NIA 23
7 Appendix B | Site Photographs
At dust bucket 2| North At dust bucket 2| South
At dust bucket 2 | East At dust bucket 2| West

Henning Crushers Ondangwa, Namibia: Baseline Environmental Noise Assessment
Report Number:18SLR21-NIA 24
At dust bucket 4| West
At dust bucket 4| North At dust bucket 4| South
At dust bucket 4| East

Henning Crushers Ondangwa, Namibia: Baseline Environmental Noise Assessment
Report Number:18SLR21-NIA 25
8 Appendix C | Time-series, Statistical, and Frequency Spectrum Results
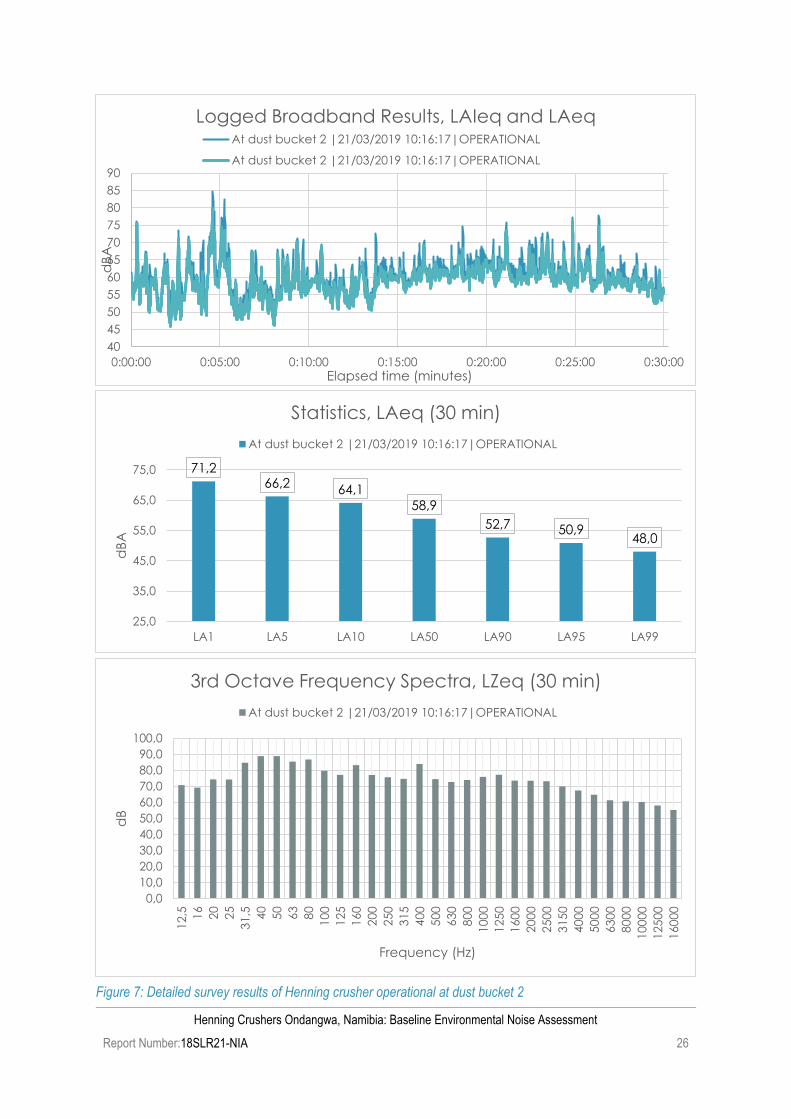
Henning Crushers Ondangwa, Namibia: Baseline Environmental Noise Assessment
Report Number:18SLR21-NIA 26
Figure 7: Detailed survey results of Henning crusher operational at dust bucket 2
40
45
50
55
60
65
70
75
80
85
90
0:00:00 0:05:00 0:10:00 0:15:00 0:20:00 0:25:00 0:30:00
dB
A
Elapsed time (minutes)
Logged Broadband Results, LAIeq and LAeqAt dust bucket 2 |21/03/2019 10:16:17|OPERATIONAL
At dust bucket 2 |21/03/2019 10:16:17|OPERATIONAL
71,266,2
64,1
58,9
52,7 50,948,0
25,0
35,0
45,0
55,0
65,0
75,0
LA1 LA5 LA10 LA50 LA90 LA95 LA99
dB
A
Statistics, LAeq (30 min)
At dust bucket 2 |21/03/2019 10:16:17|OPERATIONAL
0,0
10,0
20,0
30,0
40,0
50,0
60,0
70,0
80,0
90,0
100,0
12,5 16
20
25
31,5 40
50
63
80
100
125
160
200
250
315
400
500
630
800
100
0
125
0
160
0
200
0
250
0
315
0
400
0
500
0
630
0
800
0
100
00
125
00
160
00
dB
Frequency (Hz)
3rd Octave Frequency Spectra, LZeq (30 min)
At dust bucket 2 |21/03/2019 10:16:17|OPERATIONAL

Henning Crushers Ondangwa, Namibia: Baseline Environmental Noise Assessment
Report Number:18SLR21-NIA 27
Figure 8: Detailed survey results of Henning crusher not operational at dust bucket 2
30
35
40
45
50
55
60
65
70
75
80
0:00:00 0:05:00 0:10:00 0:15:00 0:20:00 0:25:00 0:30:00
dB
A
Elapsed time (minutes)
Logged Broadband Results, LAIeq and LAeq
At dust bucket 2 |21/03/2019 16:41:33| NOT OPERATIONAL
At dust bucket 2 |21/03/2019 16:41:33|NOT OPERATIONAL
68,3
61,359,4
51,9
43,7 42,340,5
25,0
30,0
35,0
40,0
45,0
50,0
55,0
60,0
65,0
70,0
75,0
LA1 LA5 LA10 LA50 LA90 LA95 LA99
dB
A
Statistics, LAeq (30 min)
At dust bucket 2 |21/03/2019 16:41:33| NOT OPERATIONAL
0,0
20,0
40,0
60,0
80,0
100,0
12,5 16
20
25
31,5 40
50
63
80
100
125
160
200
250
315
400
500
630
800
100
0
125
0
160
0
200
0
250
0
315
0
400
0
500
0
630
0
800
0
100
00
125
00
160
00
dB
Frequency (Hz)
3rd Octave Frequency Spectra, LZeq (30 min)
At dust bucket 2 |21/03/2019 16:41:33| NOT OPERATIONAL
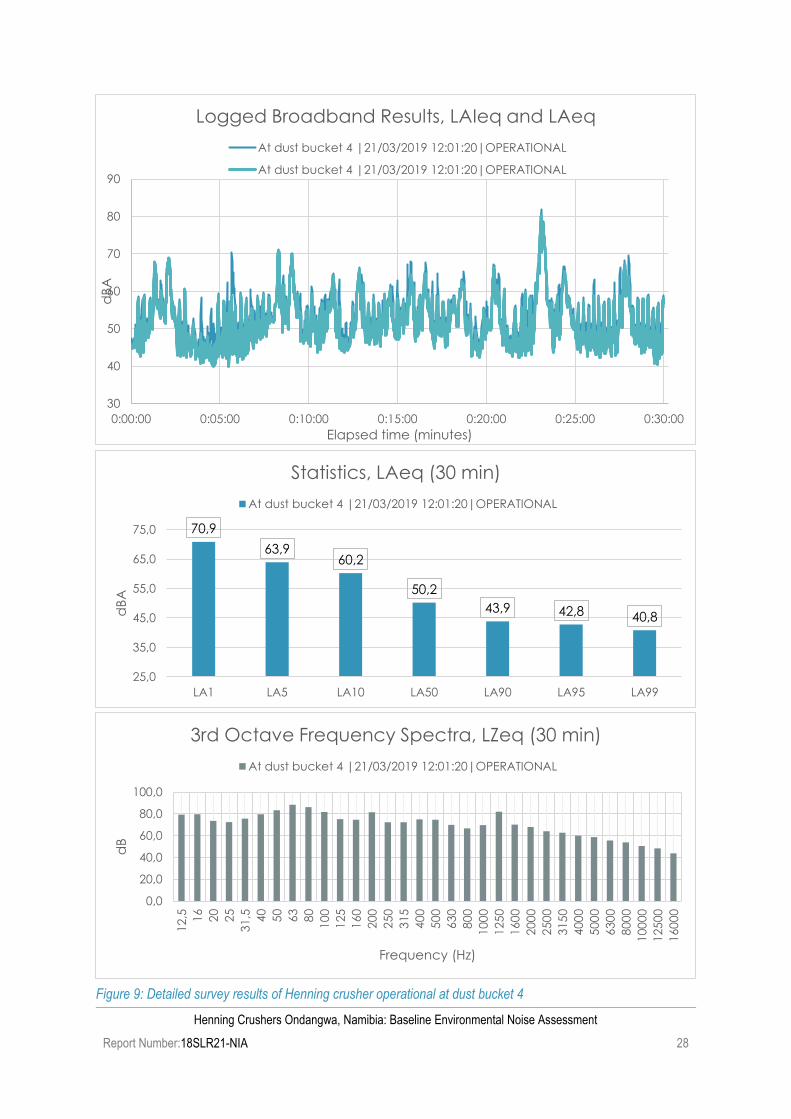
Henning Crushers Ondangwa, Namibia: Baseline Environmental Noise Assessment
Report Number:18SLR21-NIA 28
Figure 9: Detailed survey results of Henning crusher operational at dust bucket 4
30
40
50
60
70
80
90
0:00:00 0:05:00 0:10:00 0:15:00 0:20:00 0:25:00 0:30:00
dB
A
Elapsed time (minutes)
Logged Broadband Results, LAIeq and LAeq
At dust bucket 4 |21/03/2019 12:01:20|OPERATIONAL
At dust bucket 4 |21/03/2019 12:01:20|OPERATIONAL
70,9
63,960,2
50,2
43,9 42,8 40,8
25,0
35,0
45,0
55,0
65,0
75,0
LA1 LA5 LA10 LA50 LA90 LA95 LA99
dB
A
Statistics, LAeq (30 min)
At dust bucket 4 |21/03/2019 12:01:20|OPERATIONAL
0,0
20,0
40,0
60,0
80,0
100,0
12,5 16
20
25
31,5 40
50
63
80
100
125
160
200
250
315
400
500
630
800
100
0
125
0
160
0
200
0
250
0
315
0
400
0
500
0
630
0
800
0
100
00
125
00
160
00
dB
Frequency (Hz)
3rd Octave Frequency Spectra, LZeq (30 min)
At dust bucket 4 |21/03/2019 12:01:20|OPERATIONAL

Henning Crushers Ondangwa, Namibia: Baseline Environmental Noise Assessment
Report Number:18SLR21-NIA 29
Figure 10: Detailed survey results of Henning crusher not operational at dust bucket 4
10
20
30
40
50
60
70
80
90
100
0:00:00 0:05:00 0:10:00 0:15:00 0:20:00 0:25:00 0:30:00
dB
A
Elapsed time (minutes)
Logged Broadband Results, LAIeq and LAeq
At dust bucket 4 |21/03/2019 17:14:32| NOT OPERATIONAL
At dust bucket 4 |21/03/2019 17:14:32|NOT OPERATIONAL
51,0
44,0
40,5
34,0
31,3 30,7 29,7
25,0
30,0
35,0
40,0
45,0
50,0
55,0
LA1 LA5 LA10 LA50 LA90 LA95 LA99
dB
A
Statistics, LAeq (30 min)
At dust bucket 4 |21/03/2019 17:14:32| NOT OPERATIONAL
0,0
20,0
40,0
60,0
80,0
100,0
12,5 16
20
25
31,5 40
50
63
80
100
125
160
200
250
315
400
500
630
800
100
0
125
0
160
0
200
0
250
0
315
0
400
0
500
0
630
0
800
0
100
00
125
00
160
00
dB
Frequency (Hz)
3rd Octave Frequency Spectra, LZeq (30 min)
At dust bucket 4 |21/03/2019 17:14:32| NOT OPERATIONAL

Henning Crushers Ondangwa, Namibia: Baseline Environmental Noise Assessment
Report Number:18SLR21-NIA 30
Figure 11: Detailed survey results at night of Henning crusher at dust bucket 2
10
20
30
40
50
60
70
80
0:00:00 0:05:00 0:10:00 0:15:00 0:20:00 0:25:00 0:30:00
dB
A
Elapsed time (minutes)
Logged Broadband Results, LAIeq and LAeq
At dust bucket 2 Night| 20/03/2019| 22:19:35
At dust bucket 2 Night| 20/03/2019| 22:19:35
62,057,6
55,5
47,0
39,6 38,235,7
25,0
30,0
35,0
40,0
45,0
50,0
55,0
60,0
65,0
LA1 LA5 LA10 LA50 LA90 LA95 LA99
dB
A
Statistics, LAeq (30 min)
At dust bucket 2 Night| 20/03/2019| 22:19:35
0,0
10,0
20,0
30,0
40,0
50,0
60,0
70,0
80,0
90,0
12,5 16
20
25
31,5 40
50
63
80
100
125
160
200
250
315
400
500
630
800
100
0
125
0
160
0
200
0
250
0
315
0
400
0
500
0
630
0
800
0
100
00
125
00
160
00
dB
Frequency (Hz)
3rd Octave Frequency Spectra, LZeq (30 min)
At dust bucket 2 Night| 20/03/2019| 22:19:35

Henning Crushers Ondangwa, Namibia: Baseline Environmental Noise Assessment
Report Number:18SLR21-NIA 31
Figure 12: Detailed survey results at night of Henning crusher at dust bucket 4
30
35
40
45
50
55
60
65
70
0:00:00 0:05:00 0:10:00 0:15:00 0:20:00 0:25:00 0:30:00
dB
A
Elapsed time (minutes)
Logged Broadband Results, LAIeq and LAeq
At dust bucket 4 Night |20/03/2019 |23:26:07
At dust bucket 4 Night |20/03/2019 |23:26:07
44,7
39,136,9
34,633,3 33,0 32,6
25,0
30,0
35,0
40,0
45,0
50,0
LA1 LA5 LA10 LA50 LA90 LA95 LA99
dB
A
Statistics, LAeq (30 min)
At dust bucket 4 Night |20/03/2019 |23:26:07
0,010,020,030,040,050,060,070,080,0
12,5 16
20
25
31,5 40
50
63
80
100
125
160
200
250
315
400
500
630
800
100
0
125
0
160
0
200
0
250
0
315
0
400
0
500
0
630
0
800
0
100
00
125
00
160
00
dB
Frequency (Hz)
3rd Octave Frequency Spectra, LZeq (30 min)
At dust bucket 4 Night |20/03/2019 |23:26:07

Henning Crushers Ondangwa, Namibia: Baseline Environmental Noise Assessment
Report Number:18SLR21-NIA 32
9 Appendix D | Field Log Sheets

Henning Crushers Ondangwa, Namibia: Baseline Environmental Noise Assessment
Report Number:18SLR21-NIA 33

Henning Crushers Ondangwa, Namibia: Baseline Environmental Noise Assessment
Report Number:18SLR21-NIA 34

Henning Crushers Ondangwa, Namibia: Baseline Environmental Noise Assessment
Report Number:18SLR21-NIA 35

Henning Crushers Ondangwa, Namibia: Baseline Environmental Noise Assessment
Report Number:18SLR21-NIA 36

Henning Crushers Ondangwa, Namibia: Baseline Environmental Noise Assessment
Report Number:18SLR21-NIA 37
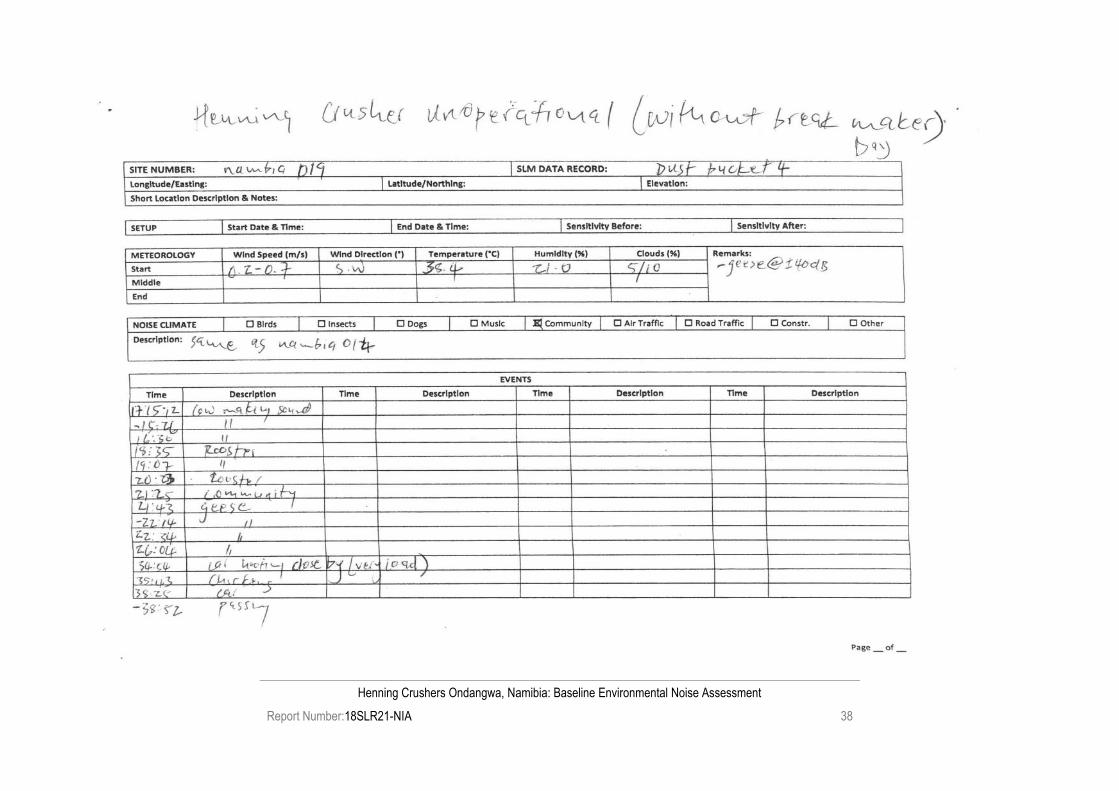
Henning Crushers Ondangwa, Namibia: Baseline Environmental Noise Assessment
Report Number:18SLR21-NIA 38