subject :vehicle structures design ﺕﺍﺭﺎﻴﺴ لﻜﺎﻴﻫ …
TRANSCRIPT

9
week Contents الأسبوع المحتويات1. Vehicle structure 1 هيكل المرآبات. 2. General characteristics of wheel suspensions 2. الخواص العامة للتعليق 3. Steering geometry and wheel alignment 3. هندسة الاستدارة ورصف العجلات 4. Independent wheel suspensions 4. التعليق الغير مرتبط 5. Rigid and semi-rigid crank axles 5. المحور الصلد والشبه صلد 6. Engine and drive axel mounting 6. رصف المحرك ومحور القيادة 7. Four-wheel drive 7. الدفع الرباعي 8. Tyre designs 8. أنواع الإطارات 9. Wheels 9 الدواليب. 10. Wheel travel and elastokinematics 10 سير العجلات. 11. Roll centre and roll axis 11. مرآز الدوران ومحور الدوران 12. Camber 12. الحدوب 13. Caster trail and angle 13. زوايا العجلات
14. Steering system 14 نظام الاستدارة. 15. Steering kinematics 15 آيناميكية الاستدارة. 16. Steering types 16 أنواع أنظمة الاستدارة. 17. Steering types 17 أنواع أنظمة الاستدارة. 18. Suspension system 18 أنظمة التعليق. 19. Weights and axle loads 19 الأوزان وأحمال المحاور. 20. Springing curves 20. منحنيات النوابض 21. Spring types 21 أنواع النوابض. 22. Shock absorbers 22 مخمدات الصدمة. 23. Chassis and body centre of gravity 23 الهيكل ومرآز الثقل. 24. Chassis and body centre of gravity 24 الهيكل ومرآز الثقل. 25. Braking & Traction behavior 25 تصرف التخميد والسحب. 26. Platform, unit assembly and common part
systems .26 تجميع الوحدات
27. Transmission system 27 نظام النقل. 28. Braking system 28 نظام الإيقاف. 29. Six-wheel vehicles 29 العجلات ذات الستة دواليب. 30. Vehicle body aerodynamics 30 ديناميكية الهواء للمرآبات.
Subject :vehicle structures design تصميم هياكل سيارات:موضوع
Weekly Hours: Theoretical: 2 2:ري نظ:الأسبوعيةالساعات
Tutorial: مناقشة:
Experimental : عملي: Units: 2 2 : الوحدات
Design of Automobile’s Parts and Structures 1
Lecture title: Vehicle Structure
VEHICLE STRUCTURE
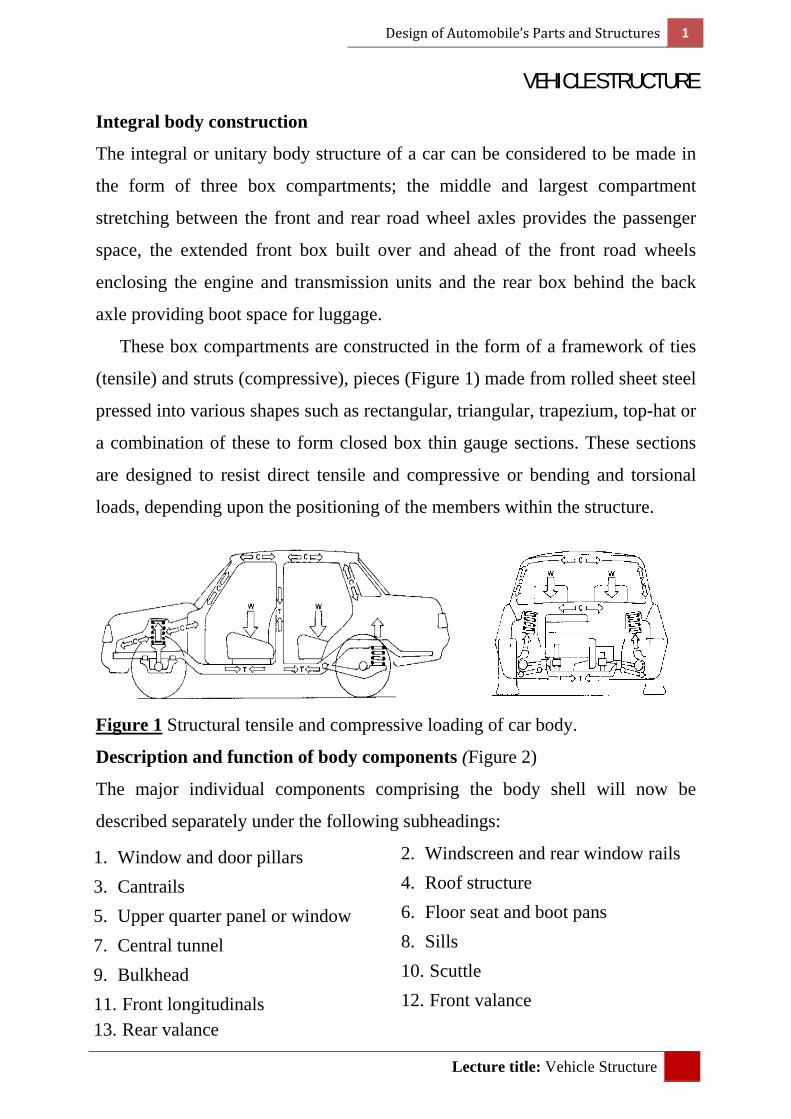
Integral body construction
The integral or unitary body structure of a car can be considered to be made in
the form of three box compartments; the middle and largest compartment
stretching between the front and rear road wheel axles provides the passenger
space, the extended front box built over and ahead of the front road wheels
enclosing the engine and transmission units and the rear box behind the back
axle providing boot space for luggage.
These box compartments are constructed in the form of a framework of ties
(tensile) and struts (compressive), pieces (Figure 1) made from rolled sheet steel
pressed into various shapes such as rectangular, triangular, trapezium, top-hat or
a combination of these to form closed box thin gauge sections. These sections
are designed to resist direct tensile and compressive or bending and torsional
loads, depending upon the positioning of the members within the structure.
Figure 1 Structural tensile and compressive loading of car body.
Description and function of body components (Figure 2)
The major individual components comprising the body shell will now be
described separately under the following subheadings:
1. Window and door pillars 2. Windscreen and rear window rails
3. Cantrails 4. Roof structure
5. Upper quarter panel or window 6. Floor seat and boot pans
7. Central tunnel 8. Sills
9. Bulkhead 10. Scuttle
11. Front longitudinals 12. Front valance 13. Rear valance

Design of Automobile’s Parts and Structures 2
Lecture title: Vehicle Structure
Window and door pillars (Figure 2 (3, 5, 6, and 8)) Window screen and door
pillars are identified by a letter coding; the front windscreen to door pillars are
referred to as A post, the centre side door pillars as Be post and the rear door to
quarter panel as D post. These are illustrated in Figure 2.
Figure 2 Load bearing body
Windscreen and rear window rails (Figure 2(2)) These box-section rails span
the front window pillars and rear pillars or quarter panels depending upon
design, so that they contribute to the resistance opposing transverse sag between
the wheel track by acting as compressive members. The other function is to
support the front and rear ends of the roof panel. The undersides of the rails also
include the glazing channels.
Cantrails (Figure 2(4)) Cantrails are the horizontal members which
interconnect the top ends of the vertical A and BC or BC and D door pillars
(posts). These rails form the side members which make up the rectangular roof
framework and as such are subjected to compressive loads. Therefore, they are
formed in various box-sections which offer the greatest compressive resistance
with the minimum of weight and blend in with the roofing. A drip rail (Figure
2(4)) is positioned in between the overlapping roof panel and the cantrails, the
joins being secured by spot welds.

Design of Automobile’s Parts and Structures 3
Lecture title: Vehicle Structure
Roof structure (Figure 2) The roof is constructed basically from four channel
sections which form the outer rim of the slightly dished roof panel. The
rectangular outer roof frame acts as the compressive load bearing members.
Torsional rigidity to resist twist is maximized by welding the four corners of the
channel-sections together. The slight curvature of the roof panel stiffens it, thus
preventing wrinkling and the collapse of the unsupported centre region of the
roof panel. With large cars, additional cross-rail members may be used to
provide more roof support and to prevent the roof crushing in should the car roll
over.
Upper quarter panel or window (Figure 2(6)) This is the vertical side panel or
window which occupies the space between the rear side door and the rear
window. Originally the quarter panel formed an important part of the roof
support, but improved pillar design and the desire to maximize visibility has
either replaced them with quarter windows or reduced their width, and in some
car models they have been completely eliminated.
Floor seat and boot pans (Figure 1.3) These constitute the pressed rolled steel
sheeting shape to enclose the bottom of both the passenger and luggage
compartments. The horizontal spread-out pressing between the bulkhead and the
heel board is called the floor pan, whilst the raised platform over the rear
suspension and wheel arches is known as the seat or arch pan. Thus joins onto
a lower steel pressing which supports luggage and is referred to as the boot pan.
Central tunnel (Figure 3(a and b)) This is the curved or rectangular hump
positioned longitudinally along the middle of the floor pan. Originally it was a
necessary evil to provide transmission space for the gearbox and propeller shaft
for rear wheel drive, front-mounted engine cars, but since the chassis has been
replaced by the integral box section shell, it has been retained with front wheel
drive, front-mounted engines as it contributes considerably to the bending
rigidity of the floor structure. Its secondary function is now to house the exhaust
pipe system and the hand brake cable assembly.

Design of Automobile’s Parts and Structures 4
Lecture title: Vehicle Structure
Figure 3 Platform chassis

Design of Automobile’s Parts and Structures 5
Lecture title: Vehicle Structure
Central tunnel (Figure 3(a and b)) This is the curved or rectangular hump
positioned longitudinally along the middle of the floor pan. Originally it was a
necessary evil to provide transmission space for the gearbox and propeller shaft
for rear wheel drive, front-mounted engine cars, but since the chassis has been
replaced by the integral boxsection shell, it has been retained with front wheel
drive, front-mounted engines as it contributes considerably to the bending
rigidity of the floor structure. Its secondary function is now to house the exhaust
pipe system and the hand brake cable assembly.
Sills (Figures 2(9) and 3(a, b and c)) These members form the lower horizontal
sides of the car body which spans between the front and rear road-wheel wings
or arches. To prevent body sag between the wheelbase of the car and lateral
bending of the structure, the outer edges of the floor pan are given support by
the side sills. These sills are made in the form of either single or double box-
sections (Fig. 1.2(9)). To resist the heavier vertical bending loads they are of
relatively deep section. Open-top cars, such as convertibles, which do not
receive structural support from the roof members, usually have extra deep sills
to compensate for the increased burden imposed on the underframe.
Bulkhead (Figures 2(1) and 3(a and b)) This is the upright partition separating
the passenger and engine compartments. Its upper half may form part of the
dash panel which was originally used to display the driver's instruments. Some
body manufacturers refer to the whole partition between engine and passenger
compartments as the dash panel.
Scuttle (Figure 3(a and b)) This can be considered as the panel formed under
the front wings which spans between the rear end of the valance, where it meets
the bulkhead, and the door pillar and wing. The lower edge of the scuttle will
merge with the floor pan so that in some cases it may form part of the toe board
on the passenger compartment side.
Front longitudinals (Figures 2(10) and 3(a and b)) These members are usually
upswept box-section members, extending parallel and forward from the

Design of Automobile’s Parts and Structures 6
Lecture title: Vehicle Structure
bulkhead at floor level. Their purpose is to withstand the engine mount reaction
and to support the front suspension or subframe. A common feature of these
members is their ability to support vertical loads in conjunction with the
valances. However, in the event of a head-on collision, they are designed to
collapse and crumble within the engine compartment so that the passenger shell
is safeguarded and is not pushed rearwards by any great extent.
Front valance (Figures 2 and 3(a and b)) These panels project upwards from
the front longitudinal members and at the rear join onto the wall of the
bulkhead. The purpose of these panels is to transfer the upward reaction of the
longitudinal members which support the front suspension to the bulkhead.
Simultaneously, the longitudinals are prevented from bending sideways because
the valance panels are shaped to slope up and outwards towards the top.
Rear valance (Figure 2(7)) This is generally considered as part of the box-
section, forming the front half of the rear wheel arch frame and the panel
immediately behind which merges with the heel board and seatpan panels.
These side inner-side panels position the edges of the seat pan to its designed
side profile and thus stiffen the underfloor structure above the rear axle and
suspension.

Design of Automobile’s Parts and Structures 1
Lecture title: Transmission System Design
Transmission System Design
MANUAL GEARBOXES
Power from a petrol or diesel reciprocating engine transfers its power in the
form of torque and angular speed to the deriving wheels of the vehicle to
produce motion. The object of the gearbox is to enable the engine's turning
effect and its rotational speed output to be adjusted by choosing a range of
under- and overdrive gear ratios so that the vehicle responds to the driver's
requirements within the limits of the various road conditions. An insight of the
forces opposing vehicle motion and engine performance characteristics which
provide the background to the need for a wide range of gearbox designs used for
different vehicle applications will now be considered.
Resistance to vehicle motion
To keep a vehicle moving, the engine has to develop sufficient power to
overcome the opposing road resistance power, and to pull away from a standstill
or to accelerate a reserve of power in addition to that absorbed by the road
resistance must be available when required.
Road resistance is expressed as tractive resistance (kN). The propelling
thrust at the tyre to road interface needed to overcome this resistance is known
as tractive effect (kN) (Fig. 3.1). For matching engine power output capacity to
the opposing road resistance it is sometimes more convenient to express the
opposing resistance to motion in terms of road resistance power.
The road resistance opposing the motion of the vehicle is made up of three
components as follows:
1. Rolling resistance
2. Air resistance
3. Gradient resistance

Design of Automobile’s Parts and Structures 2
Lecture title: Transmission System Design
Rolling resistance (Figure 1) Power has to be expended to overcome the
restraining forces caused by the deformation of tyres and road surfaces.
Secondary causes of rolling resistance are wheel bearing, oil seal friction and
the churning of the oil in the transmission system. It has been found that the
flattening distortion of the tyre casing at the road surface interface consumes
more energy as the wheel speed increases and therefore the rolling resistance
will also rise slightly as shown in Figure 1. Factors which influence the
magnitude of the rolling resistance are the laden weight of the vehicle, type of
road surface, and the design, construction and materials used in the manufacture
of the tyre.
Figure 1 Vehicle tractive resistance and effort performance chart.
Air resistance (Figure 1) Power is needed to counteract the tractive resistance
created by the vehicle moving through the air. This is caused by air being

Design of Automobile’s Parts and Structures 3
Lecture title: Transmission System Design
pushed aside and the formation of turbulence over the contour of the vehicle's
body. It has been found that the air resistance opposing force and air resistance
power increase with the square and cube of the vehicle's speed respectively.
Thus at very low vehicle speeds air resistance is insignificant, but it becomes
predominant in the upper speed range. Influencing factors which determine the
amount of air resistance are frontal area of vehicle, vehicle speed, shape and
streamlining of body and the wind speed and direction.
Gradient resistance (Figure 1) Power is required to derive a vehicle and its
load not only along a level road but also up any gradient likely to be
encountered. Therefore, a reserve of power must be available when climbing to
overcome the potential energy produced by the weight of the vehicle as it is
progressively lifted. The gradient resistance opposing motion, and therefore the
tractive effect or power needed to drive the vehicle forward, is directly
proportional to the laden weight of the vehicle and the magnitude of gradient.
Thus driving up a slope of 1 in 5 would require twice the reserve of power to
that needed to propel the same vehicle up a gradient of 1 in 10 at the same
speed, as shown in Figure.
Power to weight ratio
When choosing the lowest and highest gearbox gear ratios, the most important
factor to consider is not just the available engine power but also the weight of
the vehicle and any load it is expected to derive. Consequently, the power
developed per unit weight of laden vehicle has to be known. This is usually
expressed as the power to weight ratio.
There is a vast difference between the power to weight ratio for cars and
commercial vehicles which is shown in the following examples.

Exa
Ratio
Anoth
steepe
20%, t
reach i
The
lowest
gear to
quantit
(both r
Engin
Comm
have a
with r
amoun
torque
ample: De
tra
1. A ankW
2. A en
o span
er major
st gradien
that is 1 in
in top gear
e two ext
t gear rati
o road spe
ty is referr
road speed
ne torque
mercial veh
a positive
reducing
nt of engin
from max
etermine t
ansport:
car fully nd the maxW.
fully ladngine is us
considera
nt the vehic
n 5) and th
r with a sm
treme ope
ios. To fix
ed in lowe
red to as t
ds being a
rise and
hicle engi
torque ris
engine sp
ne torque
ximum sp
the power
laden witximum po
en articuled to prop
ation when
cle is expe
he maximu
mall surpl
erating co
x these co
est gear at
the ratio sp
RR
achieved at
speed ope
ines used
se curve,
peed the
rise is nor
eed (rated
Design
Lecture
r to weigh
th passengower produ
lated truckpel this loa
n selectin
ected to cl
um level r
lus of abou
onditions j
onditions,
t a given e
pan.
Road speeRoad spee
t similar e
erating ra
to pull la
that is fro
available
rmally exp
d power) b
of Automob
e title: Tran
ht ratio fo
gers and luced by th
k weighs ad.
ng gear ra
limb (this
road speed
ut 0.2% gr
just descr
the ratio
engine spe
d in higheed in lowe
engine spe
ange (Figu
arge loads
om maxim
torque in
pressed as
back to pea
bile’s Parts a
nsmission Sy
or the foll
luggage whe engine
38 tonne
atios is de
may norm
d the vehic
radeability
ribed set
of road s
eed should
est gearest gear
eed).
ure 2)
are norm
mum speed
ncreases
s a percen
ak torque.
and Structur
ystem Desig
owing mo
weighs 1.2 amounts
e and a 29
eciding up
mally be ta
cle is expe
y.
the highe
speed in h
d be know
mally desig
d to peak
(Figure 2
ntage of th
res 4
gn
odes of
2 tonne to 120
90 kW
pon the
aken as
ected to
est and
highest
wn. This
gned to
torque
2). The
he peak

Design of Automobile’s Parts and Structures 5
Lecture title: Transmission System Design
% Maximum speed torque
Peak torque100
Fig.3.2 Engine performance and gear split chart for an eight speed gearbox
The torque rise can be shaped depending upon engine design and taking into
account such features as naturally aspirated, resonant induction tuned,
turbocharged, turbocharged with intercooling and so forth. Torque rises can
vary from as little as 5 to as high as 50%, but the most common values for
torque rise range from 15 to 30%.

Design of Automobile’s Parts and Structures 6
Lecture title: Transmission System Design
A large torque rise characteristic raises the engine's operating ability to
overcome increased loads if the engine's speed is pulled down caused by
changes in the road conditions, such as climbing steeper gradients, and so tends
to restore the original running conditions. If the torque rise is small it cannot
help as a buffer to supplement the high torque demands and the engine speed
will rapidly fade. Frequent gear changes therefore become necessary compared
to engines operating with high torque rise characteristics. Once the engine speed
falls below peak torque, the torque rise becomes negative and the pulling ability
of the engine drops off very quickly.
Vehicle driving technique should be such that engines are continuously
driven between the speed range of peak torque and governed speed. The driver
can either choose to operate the engine's speed in a range varying just below the
maximum rated power to achieve maximum performance and journey speed or,
to improve fuel economy, wear and noise, within a speed range of between 200
to 400 rev/min on the positive torque rise side of the engine torque curve that is
in a narrow speed band just beyond peak torque. Figure 2 shows that the
economy speed range operates with the specific fuel consumption at its
minimum and that the engine speed band is in the most effective pulling zone.
Five speed and reverse doable stage synchromesh gearbox (Figure 3)
With this arrangement of a five speed double stage gearbox, the power input to
the first motion shaft passes to the layshaft and gear cluster via the first stage
pair of meshing gears. Rotary motion is therefore conveyed to all the second
stage layshaft and mainshaft gears (Figure 3). Because each pair of second stage
gears has a different size combination, a whole range of gear ratios are
provided. Each mainshaft gear (whilst in neutral) revolves on the mainshaft but
at some relative speed to it. Therefore, to obtain output powerflow, the selected
mainshaft gear has to be locked to the mainshaft. This then completes the flow

Design of Automobile’s Parts and Structures 7
Lecture title: Transmission System Design
path from the first motion shaft, first stage gears, second stage gears and finally
to the mainshaft.
Figure 3 Five speed and reverse double stage synchromesh gearbox

Design of Automobile’s Parts and Structures 8
Lecture title: Transmission System Design
In this example the fifth gear is an overdrive gear so that to speed up the
mainshaft output relative to the input to the first motion shaft, a large layshaft
fifth gear wheel is chosen to mesh with a much smaller mainshaft gear.
For heavy duty operations, a forced feed lubrication system is provided by
an internal gear crescent type oil pump driven from the rear end of the layshaft
(Figure 3). This pump draws oil from the base of the gearbox casing, pressurizes
it and then forces it through a passage to the mainshaft. The oil is then
transferred to the axial hole along the centre of the mainshaft by way of an
annular passage formed between two nylon oil seals. Lubrication to the
mainshaft gears is obtained by radial branch holes which feed the rubbing
surfaces of both mainshaft and gears.
OVERDRIVE CONSIDERATIONS
Power is essential to propel a vehicle because it is a measure of the rate of doing
work, that is, the amount of work being developed by the engine in unit time.
With increased vehicle speed, more work has to be done by the engine in a
shorter time. The characteristic power curve over a speed range for a petrol
engine initially increases linearly and fairly rapidly. Towards mid-speed the
steepness of the power rise decreases until the curve reaches a peak. It then
bends over and declines with further speed increase due to the difficulties
experienced in breathing at very high engine speeds (Figure 4).
A petrol engined car is usually geared so that in its normal direct top gear on
a level road the engine speed exceeds the peak power speed by about 10 to 20%
of this speed. Consequently, the falling power curve will intersect the road
resistance power curve. The point where both the engine and road resistance
power curves coincide fixes the road speed at which all the surplus power has
been absorbed. Therefore it sets the maximum possible vehicle speed.

Design of Automobile’s Parts and Structures 9
Lecture title: Transmission System Design
By selecting a 20% overdrive top gear, say, the transmission gear ratios can
be so chosen that the engine and road resistance power curves coincide at peak
engine power (Fig. 3.26). The undergearing has thus permitted the whole of the
engine power curve to be shifted nearer the opposing road resistance power
curve so that slightly more engine power is being utilized when the two curves
intersect. As a result, a marginally higher maximum vehicle speed is achieved.
In other words, the engine will be worked at a lower speed but at a higher load
factor whilst in this overdrive top gear.
Figure 4 Effect of over and undergearing on vehicle performance
If the amount of overdrive for top gear is increased to 40%, the engine power
curve will be shifted so far over that it intersects the road resistance power curve
before peak engine power has been obtained (Figure 4) and therefore the
maximum possible vehicle speed cannot be reached.

Design of Automobile’s Parts and Structures 10
Lecture title: Transmission System Design
Contrasting the direct drive 20% and 40% overdrive with direct drive top
gear power curves with respect to the road resistance power curve at 70 km/h, as
an example, it can be seen (Figure 4) that the reserve of power is 59%, 47% and
38% respectively. This surplus of engine power over the power absorbed by
road resistance is a measure of the relative acceleration ability for a particular
transmission overall gear ratio setting.
A comparison of the three engine power curves shows that with direct drive
top gear the area in the loop made between the developed and opposing power
curves is the largest and therefore the engine would respond to the changing
driving conditions with the greatest flexibility.
If top gear is overdriven by 20%, as shown in Figure 4, the maximum engine
power would be developed at maximum vehicle speed. This then provides the
highest possible theoretical speed, but the amount of reserve power over the
road resistance power is less, so that acceleration response will not be as rapid
as if a direct drive top gear is used. Operating under these conditions, the engine
speed would never exceed the peak power speed and so the engine could not
'over-rev', and as a result engine wear and noise would be reduced. Benefits are
also gained in fuel consumption as shown in Figure 4. The lowest specific fuel
consumption is shifted to a higher cruising speed which is desirable on
motorway journeys.
Indulging in an excessive 40% overdrive top gear prevents the engine ever
reaching peak power so that not only would maximum vehicle speed be reduced
compared to the 20% overdrive gearing, but the much smaller difference in
power developed to power dissipated shown on the power curves would
severely reduce the flexibility of driving in this gear. It therefore becomes
essential for more frequent down changes with the slightest fall-off in road
speed. A further disadvantage with excessive overdrive is that the minimum
specific fuel consumption would be shifted theoretically to the engine's upper
speed range which in practice could not be reached.

Design of Automobile’s Parts and Structures 11
Lecture title: Transmission System Design
An analysis of matching an engine's performance to suit the driving
requirements of a vehicle shows that with a good choice of undergearing in top
gear for motorway cruising conditions, benefits of prolonged engine life,
reduced noise, better fuel economy and less driver fatigue will be achieved.
Another major consideration is the unladen and laden operation of the vehicle,
particularly if it is to haul heavy loads. Therefore most top gear overdrive ratios
are arrived at as a compromise.
SETTING GEAR RATIOS
Matching the engine's performance characteristics to suit a vehicle's operating
requirements is provided by choosing a final drive gear reduction and then
selecting a range of gear ratios for maximum performance in terms of the ability
to climb gradients, achievement of good acceleration through the gears and
ability to reach some predetermined maximum speed on a level road.
Setting top gear
To determine the maximum vehicle speed, the engine brake power curve is
superimposed onto the power requirement curve which can be plotted from the
sum of both the rolling (Rr) and air (Ra) resistance covering the entire vehicle's
speed range.
The total resistance opposing motion at any speed is given by:
where = coefficient of rolling resistance
= coefficient of aerodynamic resistance (drag)
W = gross vehicle weight (N)
A= projected frontal area of vehicle (m2)
v= speed of vehicle (km/h)

Design of Automobile’s Parts and Structures 12
Lecture title: Transmission System Design
The top gear ratio is chosen so that the maximum road speed corresponds to
the engine speed at which maximum brake power is obtained (or just beyond)
(Figure 5).
Figure 5 Relationship of power developed and road power required over the
vehicle’s speed range
Gearing is necessary to ensure that the vehicle speed is at a maximum when
the engine is developing approximately peak power.
Thus Linear wheel speed = Linear road speed
1 260 2
10003600
∴ Final drive gear ratio 0.06
where GF = final drive gear ratio, N = engine speed (rev/min), d = effective
wheel diameter (m) and v = road speed at which peak power is developed
(km/h).

Design of Automobile’s Parts and Structures 13
Lecture title: Transmission System Design
Example A vehicle is to have a maximum road speed of 150 km/h. If the engine
develops its peak power at 6000 rev/min and the effective road wheel
diameter is 0.54m, determine the final drive gear ratio.
Solution
0.06
0.060.54 6000150
4.07: 1
Setting bottom gear
The maximum payload and gradient the vehicle is expected to haul and climb
determines the necessary tractive effort, and hence the required overall gear
ratio. The greatest gradient that is likely to be encountered is decided by the
terrain the vehicle is to operate over. This normally means a maximum gradient
of 5 to 1 and in the extreme 4 to 1. The minimum tractive effort necessary to
propel a vehicle up the steepest slope may be assumed to be approximately
equivalent to the sum of both the rolling and gradient resistances opposing
motion.
The rolling resistance opposing motion may be determined by the formula:
Average values for the coefficient of rolling resistance for different types of
vehicles travelling at very slow speed over various surfaces have been
determined and are shown in the following table.
Table 1 Average values of coefficient of rolling resistance

Design of Automobile’s Parts and Structures 14
Lecture title: Transmission System Design
Vehicle type Coefficient of rolling resistance (Cr)
Concrete Medium hard soil Sand
Passenger Car 0.015 0.08 0.30
Trucks 0.012 0.06 0.25
Tractors 0.02 0.04 0.20
Likewise, the gradient resistance (Figure 6) opposing motion may be
determined by the formula:
sin
Figure 6 Gradient resistances to motion
Tractive effort = Resisting forces opposing motion
Where E is the tractive effort (N)
Once the minimum tractive effort has been calculated, the bottom gear ratio
can be derived in the following way:
Driving torque = Available torque

Design of Automobile’s Parts and Structures 15
Lecture title: Transmission System Design
where GF = final drive gear ratio
GB = bottom gear ratio
ηm = mechanical efficiency
E = tractive effort (N)
T = maximum engine torque (Nm)
r = effective road wheel radius (m)
Example A vehicle weighing 1500kg has a coefficient of rolling resistance of
0.015. The transmission has a final drive ratio 4.07:1 and an overall
mechanical efficiency of 85%.
If the engine develops a maximum
torque of 100Nm, as shown in figure
7, and the effective road wheel radius
is 0.27m, determine the gearbox
bottom gear ratio.
Assume the steepest gradient to be
encountered is a one in four.
Solution Figure 7 Engine torque to speed characteristics
0.015 1500 10 225
=3750 N
3750 225 3975
3975 0.27100 4.07 0.85
3.1: 1

Design of Automobile’s Parts and Structures 16
Lecture title: Transmission System Design
Setting intermediate gear ratios
Ratios between top and bottom gears should be spaced in such a way that they
will provide the tractive effort-speed characteristics as close to the ideal as
possible. Intermediate ratios can be best selected as a first approximation by
using a geometric progression. This method of obtaining the gear ratios requires
the engine to operate within the same speed range in each gear, which is
normally selected to provide the best fuel economy.
Consider the engine to vehicle speed characteristics for each gear ratio as
shown (Figure 8). When changing gear the engine speed will drop from the
highest NH to the lowest NL without any change in road speed, i.e. v1, v2, v3 etc.
Let G1 = 1st overall gear ratio
G2 = 2nd overall gear ratio
G3 = 3rd overall gear ratio
G4 = 4th overall gear ratio
G5 = 5th overall gear ratio
Where Overall gear ratio / /
Figure 8 Gear ratios selected on geometric progression
University of Technology, Mechanical Engineering Department 1
Lecture title: Body design: Aerodynamics
Body design: Aerodynamics
INTRODUCTION
Throughout the history of the motor car there have been individual vehicles that
have demonstrated strong aerodynamic influence upon their design. Until
recently their flowing lines were primarily a statement of style and fashion with
little regard for the economic benefits. It was only rising fuel prices, triggered
by the fuel crisis of the early 1970s, that provided a serious drive towards fuel-
efficient aerodynamic design. The three primary influences upon fuel efficiency
are the mass of the vehicle, the efficiency of the engine and the aerodynamic
drag. Only the aerodynamic design will be considered in this section but it is
important to recognize the interactions between all three since it is their
combined actions and interactions that influence the dynamic stability and
hence the safety of the vehicle.
AERODYNAMIC FORCES
Aerodynamic research initially focused upon drag reduction, but it soon became
apparent that the lift and side forces were also of great significance in terms of
vehicle stability. An unfortunate side effect of some of the low drag shapes
developed during the early 1980s was reduced stability especially when driven
in cross-wind conditions. Cross-wind effects are now routinely considered by
designers but our understanding of the highly complex and often unsteady flows
that are associated with the airflow over passenger cars remains sketchy.
Experimental techniques and computational flow prediction methods still
require substantial development if a sufficient understanding of the flow physics
is to be achieved.
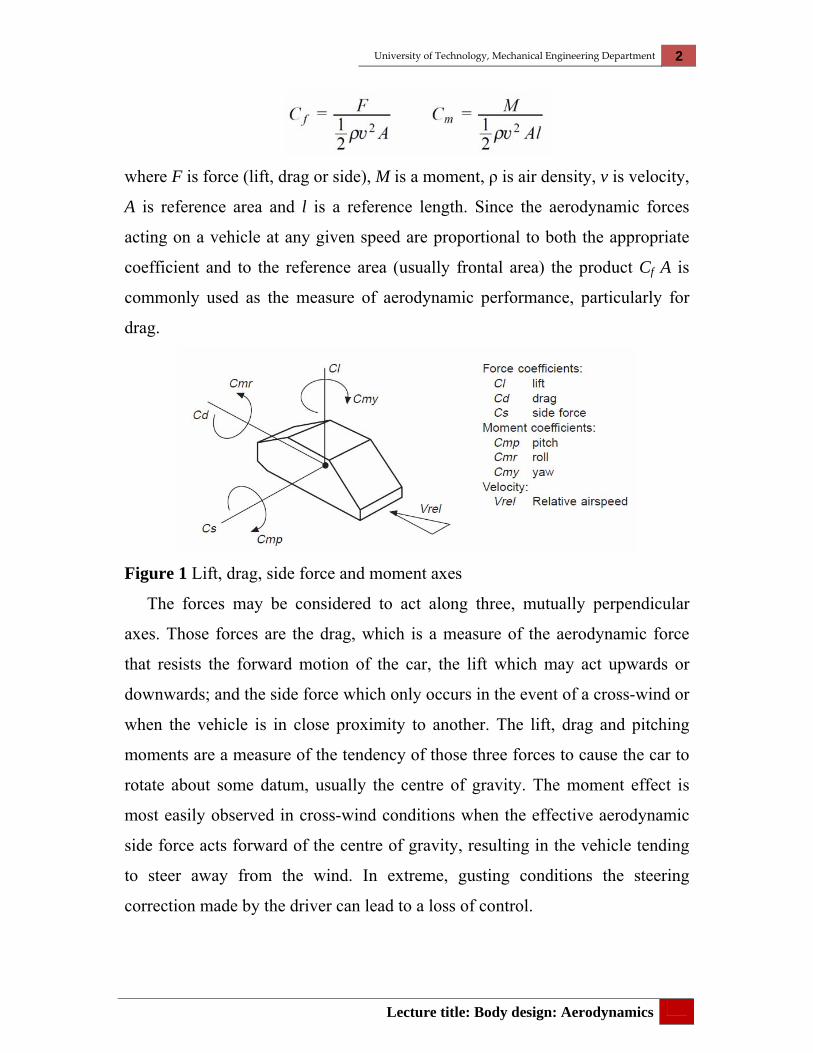
The aerodynamic forces and moments that act upon a vehicle are shown in
coefficient form in Figure 1. The force and moment coefficients are defined
respectively as:
University of Technology, Mechanical Engineering Department 2
Lecture title: Body design: Aerodynamics
where F is force (lift, drag or side), M is a moment, ρ is air density, v is velocity,
A is reference area and l is a reference length. Since the aerodynamic forces
acting on a vehicle at any given speed are proportional to both the appropriate
coefficient and to the reference area (usually frontal area) the product Cf A is
commonly used as the measure of aerodynamic performance, particularly for
drag.
Figure 1 Lift, drag, side force and moment axes
The forces may be considered to act along three, mutually perpendicular
axes. Those forces are the drag, which is a measure of the aerodynamic force
that resists the forward motion of the car, the lift which may act upwards or
downwards; and the side force which only occurs in the event of a cross-wind or
when the vehicle is in close proximity to another. The lift, drag and pitching
moments are a measure of the tendency of those three forces to cause the car to
rotate about some datum, usually the centre of gravity. The moment effect is
most easily observed in cross-wind conditions when the effective aerodynamic
side force acts forward of the centre of gravity, resulting in the vehicle tending
to steer away from the wind. In extreme, gusting conditions the steering
correction made by the driver can lead to a loss of control.

University of Technology, Mechanical Engineering Department 3
Lecture title: Body design: Aerodynamics
DRAG
The drag force is most easily understood if it is broken down into five
constituent elements. The most significant of the five in relation to road vehicles
is the form drag or pressure drag which is the component that is most closely
identified with the external shape of the vehicle. As a vehicle moves forward the
motion of the air around it gives rise to pressures that vary over the entire body
surface as shown in Figure 2a. If a small element of the surface area is
considered then the force component acting along the axis of the car, the drag
force, depends upon the magnitude of the pressure, the area of the element upon
which it acts and the inclination of that surface element Figure 2b. Thus it is
possible for two different designs, each having a similar frontal area, to have
very different values of form drag.
Figure 2 (a) Typical static pressure coefficient distribution; (b) The force
acting on a surface element
As air flows across the surface of the car frictional forces are generated
giving rise to the second drag component which is usually referred to as surface
drag or skin friction drag. If the viscosity of air is considered to be almost
constant the frictional forces at any point on the body surface depend upon the
shear stresses generated in the boundary layer. The boundary layer is that layer
of fluid close to the surface in which the air velocity changes from zero at the
University of Technology, Mechanical Engineering Department 4
Lecture title: Body design: Aerodynamics
surface (relative to the vehicle) to its local maximum some distance from the
surface. That maximum itself changes over the vehicle surface and it is directly
related to the local pressure. Both the local velocity and the thickness and
character of the boundary layer depend largely upon the size, shape and velocity
of the vehicle.
A consequence of the constraints imposed by realistic passenger space and
mechanical design requirements is the creation of a profile which in most
situations is found to generate a force with a vertical component. That lift,
whether positive (upwards) or negative induces changes in the character of the
flow which themselves create an induced drag force.
Practical requirements are also largely responsible for the creation of another
drag source which is commonly referred to as excrescence drag. This is a
consequence of all those components that disturb the otherwise smooth surface
of the vehicle and which generate energy absorbing eddies and turbulence.
Obvious contributors include the wheels and wheel arches, wing mirrors, door
handles, rain gutters and windscreen wiper blades but hidden features such as
the exhaust system are also major drag sources.
Although some of these features individually create only small drag forces
their summative effect can be to increase the overall drag by as much as 50%.
Interactions between the main flow and the flows about external devices such as
door mirrors can further add to the drag. This source is usually called
interference drag.
The last of the major influences upon vehicle drag is that arising from the
cooling of the engine, the cooling of other mechanical components such as the
brakes and from cabin ventilation flows. Together these internal drag sources
may typically contribute in excess of 10% of the overall drag.

University of Technology, Mechanical Engineering Department 5
Lecture title: Body design: Aerodynamics
DRAG REDUCTION
Under the heading of drag reduction the designer is concerned not only with the
magnitude of the force itself but also with a number of important and directly
related topics. Firstly there are the effects of wind noise. Aerodynamic noise is
closely associated with drag creation mechanisms which often exhibit discrete
frequencies and which tend to arise where the air flow separates from the
vehicle surface. Flow separation is most likely to occur around sharp corners
such as those at the rear face of each wing mirror and around the ‘A’ pillar of a
typical passenger car. Because of the close relationship between drag and noise
generation it is not surprising that drag reduction programmes have a direct and
generally beneficial effect upon wind noise. Such mutual benefits are not true of
the second related concern, that of dynamic stability. The rounded shapes that
have come to characterize modern, low drag designs are particularly sensitive to
cross-winds both in terms of the side forces that are generated and the yawing
moments. Stability concerns also relate to the lift forces and the changes in
those forces that may arise under typical atmospheric wind conditions.
The broad requirements for low drag design have been long understood.
Recent trends in vehicle design reflect the gradual and detailed refinements that
have become possible both as a result of increased technical understanding and
of the improved manufacturing methods that have enabled more complex
shapes to be produced at an acceptable cost. The centre-line pressure
distribution arising from the airflow over a typical three-box (saloon) vehicle
has been shown in Figure 2a. A major drag source occurs at the very front of the
car where the maximum pressure is recorded (Figure 2a, point ‘a’) and this
provides the largest single contribution to the form drag. This high pressure, low
velocity flow rapidly accelerates around the front, upper corner (b) before
slowing again with equal rapidity. The slowing air may not have sufficient
momentum to carry it along the body surface against the combined resistance of

University of Technology, Mechanical Engineering Department 6
Lecture title: Body design: Aerodynamics
the pressure gradient and the viscous frictional forces resulting in separation
from the body surface and the creation of a zone of re-circulating flow which is
itself associated with energy loss and hence drag. The lowering and rounding of
the sharp, front corner together with the reduction or elimination of the flat,
forward facing surface at the very front of the car addresses both of these drag
sources. A second separation zone is observed at the base of the windscreen and
here a practical solution to the problem is more difficult to achieve. The crucial
influence upon this drag source is the screen rake. Research has clearly
demonstrated the benefits of shallow screens but the raked angles desired for
aerodynamic efficiency lead to problems not only of reduced cabin space and
driver headroom but also to problems of internal, optical reflections from the
screen and poor light transmission. Figure 3 demonstrates the benefits that may
be achieved by changing the bonnet slope and the screen rake.
Figure 3 Drag reductions by changes to front body shape
There is further potential for flow separation at the screen/roof junction
which similarly benefits from screen rake and increased corner radius to reduce
the magnitude of the suction peak and the pressure gradients.
The airflow over the rear surfaces of the vehicle is more complex and the
solutions required to minimize drag for practical shapes are less intuitive. In

University of Technology, Mechanical Engineering Department 7
Lecture title: Body design: Aerodynamics
particular the essentially two-dimensional considerations that have been used to
describe the air flow characteristics over the front of the vehicle are inadequate
to describe the rear flows. Figure 4 demonstrates two alternative flow structures
that may occur at the rear of the vehicle. The first (Figure 4a) occurs for
‘squareback’ shapes and is characterized by a large, low pressure wake. Here
the airflow is unable to follow the body surface around the sharp, rear corners.
The drag that is associated with such flows depends upon the cross-sectional
area at the tail, the pressure acting upon the body surface and, to a lesser extent,
upon energy that is absorbed by the creation of eddies. Both the magnitude of
the pressure and the energy and frequency associated with the eddy creation are
governed largely by the speed of the vehicle and the height and width of the tail.
A very different flow structure arises if the rear surface slopes more gently as is
the case for hatchback, fastback and most notchback shapes (Figure 4b). The
centerline pressure distribution shown in Figure 2a shows that the surface air
pressure over the rear of the car is significantly lower than that of the
surroundings. Along the sides of the car the body curvature is much less and the
pressures recorded here differ little from the ambient conditions. The low
pressure over the upper surface draws the relatively higher pressure air along
the sides of the car upwards and leads to the creation of intense, conical vortices
at the ‘C’ pillars. These vortices increase the likelihood of the upper surface
flow remaining attached to the surface even at backlight angles of over 30
degrees. Air is thus drawn down over the rear of the car resulting in a reacting
force that has components in both the lift and the drag directions. The backlight
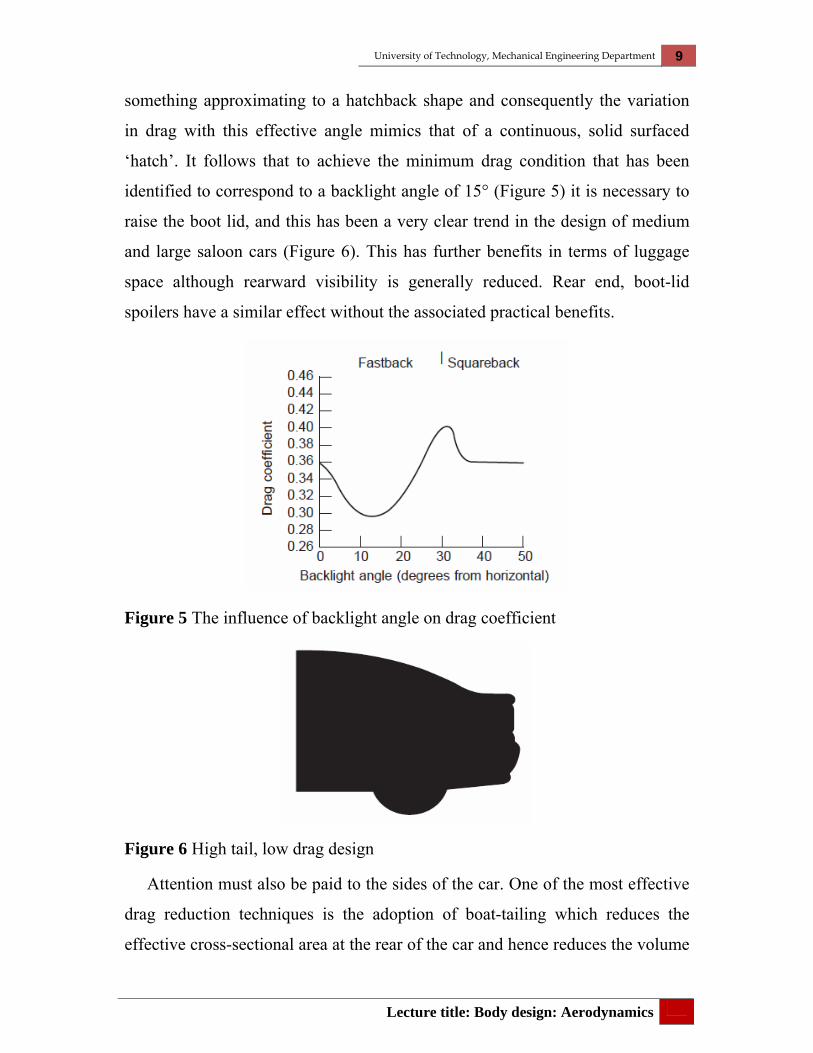
angle has been shown to be absolutely critical for vehicles of this type. Figure 5
demonstrates the change in the drag coefficient of a typical vehicle with
changing backlight angle. As the angle increases from zero (typical squareback)
towards 15 degrees there is initially a slight drag reduction as the effective base
area is reduced. Further increase in backlight angle reverses this trend as the
drag inducing influence of the upper surface pressures and trailing vortex

University of Technology, Mechanical Engineering Department 8
Lecture title: Body design: Aerodynamics
creation increase. As 30° is approached the drag is observed to increase
particularly rapidly as these effects become stronger until at approximately 30°
the drag dramatically drops to a much lower value. This sudden drop
corresponds to the backlight angle at which the upper surface flow is no longer
able to remain attached around the increasingly sharp top, rear corner and the
flow reverts to a structure more akin to that of the initial squareback. In the light
of the reasonably good aerodynamic performance of the squareback shape it is
not surprising that many recent, small hatchback designs have adopted the
square profiles that maximize interior space with little aerodynamic penalty.
Figure 4(a) ‘Squareback’ large scale flow separation. (b) ‘Hatchback/Fastback’
vortex generation
The more traditional notchback or saloon form, not surprisingly, is
influenced by all of the flow phenomena that have been discussed for the forms
discussed above. As the overcar flow passes down the rear screen the conditions
are similar to those of the hatchback and trailing; conical vortices may be
created at or near the ‘C’ pillar. The inclination of the screen may be sufficient
to cause the flow to separate from the rear window although in many cases the
separation is followed by flow re-attachment along the boot lid. Research has
shown that in this situation the critical angle is not that of the screen alone but
the angle made between the rear corner of the roof and the tip of the boot. This
suggests that the effect of the separation is to re-profile the rear surface to
University of Technology, Mechanical Engineering Department 9
Lecture title: Body design: Aerodynamics
something approximating to a hatchback shape and consequently the variation
in drag with this effective angle mimics that of a continuous, solid surfaced
‘hatch’. It follows that to achieve the minimum drag condition that has been
identified to correspond to a backlight angle of 15° (Figure 5) it is necessary to
raise the boot lid, and this has been a very clear trend in the design of medium
and large saloon cars (Figure 6). This has further benefits in terms of luggage
space although rearward visibility is generally reduced. Rear end, boot-lid
spoilers have a similar effect without the associated practical benefits.
Figure 5 The influence of backlight angle on drag coefficient
Figure 6 High tail, low drag design
Attention must also be paid to the sides of the car. One of the most effective
drag reduction techniques is the adoption of boat-tailing which reduces the
effective cross-sectional area at the rear of the car and hence reduces the volume

University of Technology, Mechanical Engineering Department 10
Lecture title: Body design: Aerodynamics
enclosed within the wake (Figure 7). In its most extreme configuration this
results in the tail extending to a fine point, thus eliminating any wake flow,
although the surface friction drag increases and the pressures over the extended
surfaces may also contribute to the overall drag. Practical considerations prevent
the adoption of such designs but it has long been known that the truncation of
these tail forms results in little loss of aerodynamic efficiency.
Figure 7 Boat tailing: reduced wake
Despite the efforts that have been made to smooth visible surfaces it is only
recently that serious attempts have been made to smooth the underbody. The
problems associated with underbody smoothing are considerable and numerous
factors such as access for maintenance, clearance for suspension and wheel
movement and the provision of air supplies for the cooling of the engine, brakes
and exhaust must be given considerable weight in the design process. Just as the
airflow at the extreme front and rear of the car were seen to be critical in
relation to the overcar flow, so it is necessary to give comparable consideration
to the air flow as it passes under the nose of the vehicle and as it leaves at the
rear. It comes as a surprise to many to learn that the sometimes large air dams
that are fitted to most production vehicles can actually reduce the overall drag
forces acting on the car despite the apparent bluntness that they create. The air
dam performs two useful functions. The first is to reduce the lift force acting on

University of Technology, Mechanical Engineering Department 11
Lecture title: Body design: Aerodynamics
the front axle by reducing the pressure beneath the front of the car. This is
achieved by restricting the flow beneath the nose which accelerates with a
corresponding drop in pressure. For passenger cars a neutral or very slight
negative lift is desirable to maintain stability without an excessive increase in
the steering forces required at high speed. For high performance road cars it
may be preferred to create significant aerodynamic down-force to increase the
adhesion of the tyres. The side effects of aerodynamic down-force generation
such as increased drag and extreme steering sensitivity are generally undesirable
in a family car. Lowering the stagnation point by the use of air dams has also
been shown in many cases to reduce the overall drag despite the generation of
an additional pressure drag component.
The shaping of the floorpan at the rear of the car also offers the potential for
reduced drag (Figure 8). As the flow diffuses (slows) along the length of the
angled rear underbody the pressure rises, resulting in reduced form drag and
also a reduced base area, although interactions between the overcar and
undercar air flows can result in unexpected and sometimes detrimental effects.
Such effects are hard to generalize and detailed experimental studies are
currently required to determine the optimum geometry for individual vehicle
designs, but typically it has been found that diffuser angles of approximately
15° seem to provide the greatest benefits.
Figure 8 Rear, underbody diffusion

University of Technology, Mechanical Engineering Department 12
Lecture title: Body design: Aerodynamics
STABILITY AND CROSS-WINDS
The aerodynamic stability of passenger cars has been broadly addressed as two
independent concerns. The first relates to the ‘feel’ of a car as it travels in a
straight line at high speed and in calm conditions and to lane change
maneuverability. The second concerns the effects of steady cross-winds and
transient gusts that are associated with atmospheric conditions and which may
be exaggerated by local topographical influences such as embankments and
bridges.
The sources of straight line instability in calm conditions has proved to be
one of the most difficult aerodynamic influences to identify. This is largely
because of the complex interactions between the chassis dynamics and
relatively small changes in the magnitude of lift forces and centre of pressure.
Qualitative observations such as driver ‘feel’ and confidence have proved hard
to quantify. New evidence suggests that stability and particularly lane change
stability degrade with increases in the overall lift and with differences in lift
between the front and rear axles.
The influence of cross-winds is more easily quantifiable. Steady state cross-
winds rarely present a safety hazard but their effect upon vehicle drag and wind
noise is considerable. Most new vehicles will have been model-tested under
yawed conditions in the wind tunnel at an early stage of their development but
optimization for drag and wind noise is almost always based upon zero cross-
wind assumptions. Some estimates suggest that the mean yaw angle experienced
in the U.K. is approximately 5º and if that is correct then there is a strong case
for optimizing the aerodynamic design for that condition.
The influence of transient cross-wind gusts such as those often experienced
when passing bridge abutments, or when overtaking heavy vehicles in the
presence of cross-winds is a phenomenon known to all drivers. To reduce the
problems that are encountered by the driver under these conditions it is

University of Technology, Mechanical Engineering Department 13
Lecture title: Body design: Aerodynamics
desirable to design the vehicle to minimize the side forces, yawing moments and
yaw rates that occur as the vehicle is progressively and rapidly exposed to the
cross wind. The low drag, rounded body shapes that have evolved in recent
years can be particularly susceptible to cross-winds. Such designs are often
associated with increased yaw sensitivity and commonly related changes of lift
distribution under the influence of cross-winds can be particularly influential in
terms of reduced vehicle stability. The influence of aerodynamics is likely to be
further exaggerated by anticipated trends towards weight reduction in the search
for improved fuel efficiency. Although methods for testing models under
transient cross-wind conditions are under development, reliable data can, as yet,
only be obtained by full scale testing of production and pre-production vehicles.
At this late stage in the vehicle development programme the primary vehicle
shape and tooling will have been defined so any remedial aerodynamic changes
can only be achieved at very high cost or by the addition of secondary devices
such as spoilers and mouldings; also an undesirable and costly solution. To
evaluate the transient behaviour of a vehicle at a much earlier stage of its design
it is necessary not only to develop model wind tunnel techniques to provide
accurate and reliable data but most importantly to fully understand the flow
mechanisms that give rise to the transient aerodynamic forces and moments.
Initial results from recent developments in wind tunnel testing suggest that the
side forces and yawing moments experienced in the true transient case exceed
those that have been measured in steady state yaw tests.
NOISE
Although some aerodynamic noise is created by ventilation flows through the
cabin the most obtrusive noise is generally that created by the external flow
around the vehicle. Considerable reductions have been made to cabin noise
levels which may be attributed in part to improved air flows with reduced noise
creation and also to improved sealing which has the effect both of reducing

University of Technology, Mechanical Engineering Department 14
Lecture title: Body design: Aerodynamics
noise creation and insulating the occupants from the sound sources. Figure 9
provides an approximate comparison between the different noise sources
(engine, tyres and aerodynamics) that have been recorded in a small car moving
at 150 km/h. The creation of aerodynamic noise is mostly associated with
turbulence at or near the body surface and moves to reduce drag have inevitably
provided the additional benefit of noise reduction. Although there is a noise
associated with the essentially random turbulence that occurs within a turbulent
boundary layer it is the sound associated with eddy creation at surface
discontinuities that has both the greatest magnitude and also the most clearly
defined (and annoying) frequencies. Improvements in rain gutter design and the
positioning of windscreen wipers reflect some of the moves that have been
made to reduce noise creation and improved manufacturing techniques and
quality control have also resulted in major noise reduction as a consequence of
improved panel fit. Protrusions such as wing mirrors and small surface radii
such as at the ‘A’ pillar remain areas of particular concern because of their
proximity to the driver and because of the relatively poor sound insulation
provided by windows. It has been demonstrated that it is the noise associated
with vortex (eddy) creation that is the dominant aerodynamic noise source over
almost the entire audible frequency range. One of the largest, single noise
generators is the sun roof. Its large size results in low frequencies and large
magnitudes and poorly designed units may even lead to discernible low
frequency pressure pulsing in the cabin. Despite customer demand for low cabin
noise there has been a parallel increase in the number of sun roofs that have
been fitted to new cars. Open windows can create similar problems. Increased
use of air conditioning is the best practical solution to this particular problem.

University of Technology, Mechanical Engineering Department 15
Lecture title: Body design: Aerodynamics
Figure 9 Noise sources
UNDERHOOD VENTILATION
The evidence from numerous researchers suggests that the engine cooling
system is responsible for between 10% and 15% of the overall vehicle drag, so
it is not surprising to note that considerable effort has been focused upon the
optimization of these flows. Traditionally the cooling drag has been determined
from wind tunnel drag measurements with and without the cooling intakes
blanked-off. The results from those wind tunnel tests must be treated with
caution since the closure of the intakes may alter the entire flow-field around a
car. Underhood flow restrictions arising from the ever-increasing volume of
ancillary equipment under the bonnet has further focused attention on cooling
air flows, and this is now one of the primary applications for the developing use
of computational flow simulation codes. Many of the sources of cooling drag
are readily apparent such as the resistance created by the relatively dense
radiator matrix and the drag associated with the tortuous flow through the
engine bay. In general any smoothing of the flow path will reduce the drag, as
will velocity reductions by diffusion upstream from the cooling system,
although the implications of the latter upon the heat transfer must be considered.
Less obvious but also significant is the interaction between the undercar flow
and the cooling flow at its exit where high turbulence levels and flow

University of Technology, Mechanical Engineering Department 16
Lecture title: Body design: Aerodynamics
separations may to occur. Careful design to control the cooling exit flow in
terms of its speed and direction can reduce the drag associated with the merging
flows but in general the aerodynamics are compromised to achieve the required
cooling.
The potential for underhood drag reduction is greatest if the air flow can be
controlled by the use of ducting to guide the air into and out from the radiator
core. Approximate relationships between the slowing of the cooling airflow and
the pressure loss coefficient, are widely described in the published texts (e.g.
Barnard, 1996). The high blockage caused by the radiator core has the effect of
dramatically reducing the air velocity through the radiator and thus much of the
air that approaches the radiator spills around it. The relatively small mass flow
that passes through the core can exhibit substantial non-uniformity which
reduces the effectiveness of the cooling system. These problems can be much
reduced if the flow is ducted into the radiator in such a way as to slow the flow
in a controlled and efficient manner, and careful design of the degree of
diffusion can greatly improve the efficiency of the cooling flow. Increasing the
diffusion slows the air flowing through the radiator which reduces both the drag
force and the heat transfer. Although the reduced heat transfer rate results in a
requirement for a larger radiator core surface area, the drag reduction is
proportionately greater than is the corresponding reduction in heat transfer. A
low speed, large core area therefore creates less drag for a given heat transfer
rate. Inevitably, compromises are necessary. The larger core adds weight and
cost and the generally close proximity of the radiator to the intake leaves little
scope for the use of long, idealized ducting. Too much diffusion will lead to
flow separation within the intake which may result in severe flow non-
uniformities across the face of the radiator. Gains are also available if the air is
ducted away from the radiator in a similarly efficient manner, but in most cases

University of Technology, Mechanical Engineering Department 17
Lecture title: Body design: Aerodynamics
the practical complexity of such a system and the requirement for a source of
cooling air to the ancillaries has prevented such measures.
CABIN VENTILATION
Sealing between the body panels and particularly around the doors has achieved
benefits in terms of noise reduction and aerodynamic drag, but the almost
complete elimination of leakage flows has also led to changes in the design of
passenger compartment ventilation. To achieve the required ventilation flow
rates greater attention must be paid not only to the intake and exit locations but
also to the velocity and path of the fresh air through the passenger compartment.
The intake should be located in a zone of relatively high pressure and it should
not be too close to the road surface where particulate and pollutant levels tend to
be highest. The region immediately ahead of the windscreen adequately meets
all of these requirements and is also conveniently located for air entry to the
passenger compartment or air conditioning system. This location has been
almost universally adopted. For the effective extraction of the ventilation air a
zone of lower pressure should be sought. A location at the rear of the vehicle is
usually selected and in many cases the air is directed through the parcel shelf
and boot to exit through a controlled bleed in the boot seal. Increasing the
pressure difference between the intake and exit provides the potential for high
ventilation air flow rates but only at the expense of a flow rate that is sensitive
to the velocity of the vehicle. This is particularly noticeable when the ventilation
flow is heated and the temperature of the air changes with speed. A recent trend
has been to use relatively low pressure differences coupled with a greater degree
of fan assistance to provide a more controllable and consistent internal flow
whether for simple ventilation systems or for increasingly popular air
conditioning systems.
WIND TUNNEL TESTING
University of Technology, Mechanical Engineering Department 18
Lecture title: Body design: Aerodynamics
Very few new cars are now developed without a significant programme of wind
tunnel testing. There are almost as many different wind tunnel configurations as
there are wind tunnels and comparative tests have consistently shown that the
forces and moments obtained from different facilities can differ quite
considerably. However, most manufacturers use only one or two different wind
tunnels and the most important requirement is for repeatability and correct
comparative measurements when aerodynamic changes are made. During the
early stages in the design and development process most testing is performed
using small scale models where 1/4 scale is the most popular. The use of small
models allows numerous design features to be tested in a cost effective manner
with adequate accuracy.
For truly accurate simulation of the full scale flow it is necessary to achieve
geometric and dynamic similarity. The latter requires the relative magnitudes of
the inertia and viscous forces associated with the moving fluid to be modelled
correctly and the ratio of those forces is given by a dimensionless parameter
known as Reynolds number (Re):
where ρ is the fluid (air) density, u is the relative wind speed, d is a
characteristic dimension and µ is the dynamic viscosity of the fluid. For testing
in air this expression tells us that the required wind speed is inversely
proportional to the scale of the model but in practice the velocities required to
achieve accuracy (using the correct Reynolds number) for small scale models
are not practical, and Reynolds number similarity is rarely achieved.
Fortunately, the Reynolds numbers achieved even for these small models are
sufficiently high to create representative, largely turbulent vehicle surface
boundary layers, and the failure to achieve Reynolds number matching rarely
results in major errors in the character of the flow. The highest wind speeds at

University of Technology, Mechanical Engineering Department 19
Lecture title: Body design: Aerodynamics
which models can be tested in any particular wind tunnel are more likely to be
limited by the ground speed than by the air speed. The forward motion of a
vehicle results not only in relative motion between the vehicle and the
surrounding air but also between the vehicle and the ground. In the wind tunnel
it is therefore necessary to move the ground plane at the same speed as the bulk
air flow, and this is usually achieved by the use of a moving belt beneath the
model. At high speeds problems such as belt tracking and heating may limit the
maximum running speed, although moving ground plane technology has
improved rapidly in recent years with the developments driven largely by the
motor racing industry for whom ‘ground effect’ is particularly important. A
considerable volume of literature is available relating to the influence of fixed
and moving ground planes upon the accuracy of automotive wind tunnel
measurements.
The use of larger models has benefits in terms of Reynolds number
modelling and also facilitates the modelling of detailed features with greater
accuracy, but their use also requires larger wind tunnels with correspondingly
higher operating and model construction costs.
The forces acting upon a wind tunnel model are usually measured directly
using a force balance which may be a mechanical device or one of the
increasingly common strain gauge types. The latter has clear benefits in terms of
electronic data collection and their accuracy is now comparable to mechanical
devices. Electronic systems are also essential if unsteady forces are to be
investigated. Lift, drag and pitching moment measurements are routinely
measured and most modern force balances also measure side force, yawing
moment and rolling moment. These latter three components relate to the forces
that are experienced in cross-wind conditions.