sub-saharan africa: introducing low-cost methods in
TRANSCRIPT
Energy Sector Management Assistance Program (ESMAP)1818 H Street, NWWashington, DC 20433 USATel: 1.202.458.2321Fax: 1.202.522.3018Internet: www.worldbank.org/esmapE-mail: [email protected]
Energy Sector Management Assistance Program
Sub-Saharan Africa:Introducing Low-cost Methods inElectricity Distribution Networks
ESMAP Technical Paper 104/06October 2006
Sub-S
ahara
n A
frica: In
troducin
g Lo
w-co
st Meth
ods in
Ele
ctricity D
istributio
n N
etw
ork
sTe
chnica
l Paper 1
04/0
6

Energy Sector Management Assistance Program (ESMAP)
Purpose
The Energy Sector Management Assistance Program (ESMAP) is a global technical assistance partnership
administered by the World Bank and sponsored by bi-lateral official donors, since 1983. ESMAP’s mission
is to promote the role of energy in poverty reduction and economic growth in an environmentally responsible
manner. Its work applies to low-income, emerging, and transition economies and contributes to the
achievement of internationally agreed development goals. ESMAP interventions are knowledge products
including free technical assistance, specific studies, advisory services, pilot projects, knowledge generation
and dissemination, trainings, workshops and seminars, conferences and round-tables, and publications.
ESMAP work is focused on four key thematic programs: energy security, renewable energy, energy-poverty
and market efficiency and governance.
Governance and Operations
ESMAP is governed by a Consultative Group (the ESMAP CG) composed of representatives of the World
Bank, other donors, and development experts from regions which benefit from ESMAP’s assistance. The
ESMAP CG is chaired by a World Bank Vice-President, and advised by a Technical Advisory Group (TAG) of
independent energy experts that reviews the Program’s strategic agenda, its work plan, and its achievements.
ESMAP relies on a cadre of engineers, energy planners, and economists from the World Bank, and from
the energy and development community at large, to conduct its activities.
Funding
ESMAP is a knowledge partnership supported by the World Bank and official donors from Belgium, Canada,
Denmark, Finland, France, Germany, the Netherlands, Norway, Sweden, Switzerland, and the United
Kingdom. ESMAP has also enjoyed the support of private donors as well as in-kind support from a number
of partners in the energy and development community.
Further Information
For further information on a copy of the ESMAP Annual Report or copies of project reports, please visit the
ESMAP Website: www.esmap.org. ESMAP can also be reached by E-mail at [email protected] or
by mail at:
ESMAP
c/o Energy and Water Department
The World Bank Group
1818 H Street, NW
Washington, D.C. 20433, U.S.A.
Tel.: 202.458.2321
Fax: 202.522.3018
Sub-Saharan Africa:Introducing Low-cost Methods inElectricity Distribution Networks
ESMAP Technical Paper 104/06
Ralph Karhammar, Arun Sanghvi,Eric Fernstrom, Moncef Aissa,Jabesh Arthur, John Tulloch,Ian Davies, Sten Bergman andSubodh Mathur
Energy Sector Management Assistance Program (ESMAP)

ii
Copyright © 2006The International Bank for Reconstructionand Development/THE WORLD BANK1818 H Street, N.W.Washington, D.C. 20433, U.S.A.
All rights reservedProduced in IndiaFirst printing October 2006
ESMAP Reports are published to communicate the results of ESMAP's work to the development communitywith the least possible delay. The typescript of the paper therefore has not been prepared in accordancewith the procedures appropriate to formal documents. Some sources cited in this paper may be informaldocuments that are not readily available.
The findings, interpretations, and conclusions expressed in this paper are entirely those of the author andshould not be attributed in any manner to the World Bank or its affiliated organizations, or to members of itsBoard of Executive Directors or the countries they represent. The World Bank does not guarantee theaccuracy of the data included in this publication and accepts no responsibility whatsoever for any consequenceof their use. The Boundaries, colors, denominations, other information shown on any map in this volume donot imply on the part of the World Bank Group any judgment on the legal status of any territory or theendorsement or acceptance of such boundaries.
The material in this publication is copyrighted. Requests for permission to reproduce portions of it should besent to the ESMAP Manager at the address shown in the copyright notice above. ESMAP encouragesdissemination of its work and will normally give permission promptly and, when the reproduction is fornoncommercial purposes, without asking a fee.
(Papers in the ESMAP Technical Series are discussion documents, not final project reports.They are subject to the same copyright as other ESMAP publications.)

Table of Contents
iii
List of Abbreviations xi
Executive Summary xiii
1. Introduction 1
Uganda 1
Tanzania 2
Mozambique 4
Zambia 6
Common Features 7
2. Suggested Low-cost Methods 9
“Appropriate Design” Engineering 9
Cost-cutting Culture 13
Single Wire Earth Return 16
Shield Wire System 21
3. Conclusion 27
Annex 1: Mainstreaming Low-cost Innovations in Electricity Distribution 29
Annex 2: Mainstreaming Low-cost Installations and Electricity Distribution Networks 93
Annex 3: Review of Electrification for Low-income Areas – Examples from Southern Africa 107
Annex 4: Review of Electrification for Low-income Areas – Viable Networks 125
Annex 5: Typical Program for Workshops held in Tanzania, Mozambique,
Uganda and Zambia 161
Annex 6: Low-cost Electricity and Multisector Development in Rural Tunisia –
Important Lessons from the Tunisian Success Story 183
Annex 7: STEG Technical Approach to Cost-cutting in Rural Electrification in Tunisia 223

SUB-SAHARAN AFRICA: INTRODUCING LOW-COST METHODS IN ELECTRICITY DISTRIBUTION NETWORKS
iv
Annex 8: National Electrification Experiences Ghana: 1985-2004 271
Annex 9: Ghana’s Experience with the Shield Wire Scheme 297
Annex 10: Single Wire Earth Return as an Option for Low-cost Rural Electrification –
Low-cost Techniques 325
Annex 11: Single Wire Earth Return as an Option for Low-cost Rural Electrification –
New Zealand and Australia Experience 371

v
List of Tables
Table 2.1: Typical Construction Cost of 34.5 kV line in US$ per km 24
Table A 1.1: Minimum Clearance Heights in Southern Africa 48
Table A 1.2: Suitable Conductors for Rural Distribution Networks including Expected
Savings Relative to Current Standards in Mozambique (Tulloch, 2000) 51
Table A 1.3: Comparison between Costs for Lines in El Salvador
using Different Voltage Levels and Designs 53
Table A 1.4: Cost per Connection and Total Budget for the NEP
during the Years 1994-2002 72
Table A 1.5: Lessons from the Prepayment Meter Scheme 74
Table A 1.6: Load Limitations 75
Table A 1.7: Development of the Tunisian Electrification Program in
Five-year Plans from 1972 to 2001 78
Table A 1.8: STEG’s Achievements Compared to Old Design 81
Table A 6.1: Evolution of Tunisia’s Rural Electrification Program, 1972-2001 187
Table A 6.2: PRD Rural Development Investments, by Sector, 1997-2000 190
Table A 6.3: Comparison of STEG’s Unpaid Bills, 1990 and 1997-1998 201
Table A 6.4: Average Price of Electricity (Excluding Taxes), by Consumer Group,
1994-1999 (millimes* per kWh) 205
Table A 6.5: Electricity Tariffs (Excluding Taxes), 2001 206
Table A 6.6: Trends in Low-voltage Household Tariff (millimes/kWh) 207
Table A 6.7: Targets and Achievements of ADB Rural Electrification
Loans to Tunisia, 1979-1989 208
Table A 6.8: Estimated Savings of MALT System, Compared to Three-phase
Distribution System, 1975 210
TABLE OF CONTENTS

SUB-SAHARAN AFRICA: INTRODUCING LOW-COST METHODS IN ELECTRICITY DISTRIBUTION NETWORKS
vi
Table A7.1: Estimated Savings from Implementation of Three-phase/Single-phase
MALT Compared to the Conventional Three-phase Distribution System Serving
300 Randomly Selected Villages (1975) 228
Table A 7.2: Some Difficulties Encountered in the Changeover to MALT and
how these were Overcome by STEG 236
Table A 7.3: Length of Three-phase and Single-phase Medium-voltage
Overhead Lines at the End of Each Five-year Plan 237
Table A 7.4: Number of Three-phase and Single-phase Medium-voltage/Low-voltage
Substations at the End of Each Five-year Plan 238
Table A 7.5: Recent Reduction Estimate (US$2000) of Single-phase Overhead
MV Lines/Conventional Three-phase Lines 240
Table A 7.6: Distribution of Reductions in Both Types of Single-phase Lines 240
Table A 7.7: Types of Poles used in MV and LV Networks (m/daN) 248
Table A 8.1: Ghana Particulars 278
Table A 8.2 : Progress of Electrification 1985-2005 281
Table A 9.1: Typical Construction Cost of 34.5 kV line in US$ per km 314
Table A 10.1: Comparative Costs and Load Capacities 355
Table A 10.2: Relative Merits of Three-phase Three-wire, Single-phase Two-wire and
SWER Systems 357
vii
List of Figures
Figure 2.1: Typical SWER Configuration 16
Figure 2.2: Diagrammatic Representation of SWS 22
Figure 2.3: Insulator+Arcing Horn 23
Figure A 1.1: (i) Central Distribution Transformer, (ii) System Using Smaller Transformer
Located near the Consumers Clusters 55
Figure A 1.2: Single-phase Tap-off from Distribution Line (Larsson, 2002) 63
Figure A 1.3: The Use of Earth as Return Conductor, Using the SWER Design (Bergman, 2003) 65
Figure A 1.4: The Design of Consumer Contributions, Grants and Subsidies in
the Tunisian Electrification Program 79
Figure A 3.1: What NEP 1 Aimed for (Indicative Only) 111
Figure A 3.2: What NEP 1 Achieved (Indicative Only) 112
Figure A 3.3: NEP 1 Adjusted for Marginal Costs (Indicative Only) 112
Figure A 6.1: Responsibilities for Rural Electrification 193
Figure A 7.1: Typical MALT System 229
Figure A 7.2: Total Line Cost (Materials and Labor) and % Cost Savings for
Three-phase and Single-phase Configuration in Different Countries
(cost/km in US$) 239
Figure A 8.1: Ghana Grid – 1985 277
Figure A 8.2: Ghana Grid – 2000 287
Figure A 8.3: Ghana’s National Electrification Program: Status 288
Figure A 8.4: Ghana’s National Electrification Program: Projection to 2020 290
Figure A 8.5: Profile of Residential Usage 292
Figure A 8.6: Comparison of Residential Prices and Cost 293
Figure A 9.1: Diagrammatic Representation of SWS 303
Figure A 9.2: Single and Double Towers 307
TABLE OF CONTENTS

SUB-SAHARAN AFRICA: INTRODUCING LOW-COST METHODS IN ELECTRICITY DISTRIBUTION NETWORKS
viii
Figure A 9.3: Insulator+Arcing Horn 314
Figure A 9.4: Comparison of Construction Costs in US$/km 315
Figure A 9.5: Comparison of MV vs SWS – Total Outage Frequency 316
Figure A 9.6: Comparison of Medium Voltage (MV) and SWS – Total Outage Time 316
Figure A 10.1: Single Wire Isolated System 329
Figure A 10.2: Single Wire Unisolated System 330
Figure A 10.3: Multiwire System 331
Figure A 11.1: A Typical SWER Configuration 375

ix
List of Pictures
Picture A 1.1: Example of South African-manufactured Ready Board 57
Picture A 1.2: The “Power Provider” 62
Picture A 1.3: A Roto-phase Converter used to Recreate Three-phase Loads for
a Dairy Production Unit in Tunisia (Cecelski, 2004) 64
Picture A 1.4: Pole-top Insulator Configuration for SWER Application used in Australia 65
Picture A 1.5: Low-voltage Tap-off from SWER Network 66
Picture A 1.6: Housing in a South African Township 73
Picture A 1.7: Ready Board Paired with Prepayment Meter in a South African Household 76
Picture A 1.8: Two Parallel Single-phase Motors Providing Additional Power for this
Tunisian Industrial Client (Olive Oil Plant) (Cecelski, 2004) 80
Picture 2.1: 22 kV Rural Line. (Traditional Design on the left, New Design on the right) 11
Picture 2.2: The transformer on the left is 50 kVA and the one on the right 100 kVA 12
Picture A 2.1: 22 kV Rural Line. (Traditional Design on the left, New Design on the right) 99
Picture A 2.2: The transformer on the left is 50 kVA and the one on the right 100 kVA 99
Picture A 7.1: Range of Fuses used by STEG 231
Picture A 9.1: Distribution Panel: Tanoso Waterworks 308
Picture A 9.2: Pumps at Tanoso Waterworks 308
Picture A 9.3: Equipment at the SKOD Sawmill 308
Picture A 9.4: Interposing Transformer at Techiman Substation 319
List of Boxes
Box A 6.1: Adopting the MALT System: Key Technical Decisions 209
Box A 6.2: STEG’s Switch to the MALT System: Typical Obstacles and Solutions for
Changing from the 30 kV Network 212
TABLE OF CONTENTS


List of Abbreviations
ACSR Aluminum Conductors Steel Reinforced
ADMD After Diversity Maximum Demand
AFTEG Africa Energy Unit
BOT Build Own Transfer
BOO Build Own Operate
DBSA Development Bank of Southern Africa
DIT Dar es Salaam Institute of Technology
ECC Electronic Current Cut-out
ERB Energy Regulation Board
ERAP Energy Reform and Access Program
ERT Energizing Rural Transformation
ESKOM South African Energy Supply Company
ESMAP Energy Sector Management Assistance Program
GIS Geographic Information System
GWh Gigawatt hour
hp Horsepower
HV High Voltage
kW Kilowatts
kWh Kilowatt hours
LF Load Factor
LV Low Voltage
MALT Mise a la Terre (four wire, grounded neutral network)
MCB Miniature Circuit Breaker
MEM Ministry of Energy and Minerals
xi

SUB-SAHARAN AFRICA: INTRODUCING LOW-COST METHODS IN ELECTRICITY DISTRIBUTION NETWORKS
xii
MV Medium Voltage
MWh Megawatt hours
MW Megawatt
NEP National Electrification Program
NPV Net Present Value
O&M Operation and Maintenance
PAC Prestressed Armored Concrete
PTC Positive Temperature Co-efficient
PV Photovoltaic
RDP Rural Development Program
RE Rural Electrification
REA Rural Electrification Agency
SABS South African Bureau of Standards
Sida Swedish International Development Cooperation Agency
SLT Single Line Technology
STEG Tunisian Company of Electricity and Gas
SWER Single Wire Earth Return
SWS Shield Wire System
SWT Shield Wire Technology
TANESCO Tanzania Electric Supply Company Limited
TED Transitional Electricity Distributor
UEDCL Uganda Electricity Distribution Company Limited
VRA Volta River Authority
ZESCO Zambia Electricity Supply Company Ltd

xiii
Executive Summary
Objective
The level of electrification in sub-Saharan Africa is low, with less than 10 percent of the rural households
having access to electricity. One of the key barriers to accelerating access is the high cost of connections,
arising, inter alia, from the use of outdated, unsuitable, high-cost methods in electricity networks. A second
key barrier is the small and dispersed nature of electricity demand, arising from low density of population
and low income levels, which lead to high average costs of providing electricity service. The objective of this
report is to help in reducing the high costs of electrification by documenting proven, low-cost methods and
techniques in electricity networks that have not yet become widely used in sub-Saharan Africa.
Need for Changes in Technical Standards
The report is based on studies related to innovations in Tunisia, Ghana, South Africa, Australia and New
Zealand, and field visits by an expert group of technical specialists to Zambia, Mozambique, Tanzania and
Uganda. The group found that these countries had very similar norms and standards for electricity networks,
based on concepts imported during colonial times, with very little adaptation to local conditions having taken
place. For example, existing technical standards allow for snow and ice loading in places that have never
experienced such weather conditions.
Technical Approach
There are many low-cost methods that are worthy of consideration; this report focuses on four low-cost
methods that are likely to have a significant cost-reducing impact and are also likely to be widely applicable
in sub-Saharan Africa. These low-cost methods should be seen as one element of an overall plan to keep
costs down. For example, there are several “good business practices”, such as better procurement methods,
inventory control and quality control, that could go a long way in reducing network costs

SUB-SAHARAN AFRICA: INTRODUCING LOW-COST METHODS IN ELECTRICITY DISTRIBUTION NETWORKS
xiv
These methods have been identified on the basis of international experience and discussions with experienced,
local technical experts in Zambia, Mozambique, Tanzania and Uganda. The four concepts are:
• “Appropriate design” engineering;
• Developing an institutional cost-cutting culture;
• Single Wire Earth Return; and
• Shield wire systems.
“Appropriate Design” Engineering
The term “Appropriate Engineering” describes an approach to reducing costs rather than a specific technique
or system. “Appropriate Engineering” looks at existing networks, the design, the materials used, the methods of
construction, benefits of marketing and a whole range of issues that enable lower cost networks to be constructed.
Many electrical utilities use standard designs that incorporate solutions to all problems encountered in the
past, no matter where the network was installed. This leads to a “one-size-fits-all” design, which is substantially
overdesigned.
Costs are further exacerbated by high demand assumptions instead of local estimates of the likely load flows
and consumption, even though there is enough experience from sub-Saharan African electrification for
local estimates to be readily developed. This high demand assumptions lead to excessive line sizes, voltage
drop calculations, transformers and switchgear capacity.
The overdesigned systems are sometimes sought to be justified by the notion that the network must allow for
growth, and it is not practical to keep going back and adding to the network. One solution to this “design,
construct and forget” approach is to size the network for the current load flows, with a flexible design that
can be upgraded easily as and when the load increases.
Nevertheless, it is recognized that distribution systems need some standardization to address concerns about
adequate maintenance and inventory of spares, as well as to consider the availability of materials and
equipment. Thus, a balance has to be found between the need for standardization and the benefits of
flexibility in design.
The “Appropriate Engineering” concept applies to capital costs as well as operating costs. Some major
capital cost items to be appropriately designed are:
• Network phase: Single-phase, instead of three-phase networks, are likely to be adequate in many
situations, with the design permitting upgrading to three-phase in the future. Consumers who want to
run high-powered three-phase motors could be served by using phase converters.
xv
• Transformers: In many cases, they operate at a fraction of their design output and do so for their entire
life. Transformers should be closely sized to the actual load flows, with flexibility and, in few instances,
it may be beneficial to consider single-phase transformers to be later upgraded to three-phase
transformers.
• Poles: The traditional pole design has cross arms on the top of the poles. Modern designs use post-top
insulators fixed directly to the side of the pole and there are no cross arms. Pole-mounted transformers
should be mounted on a single pole instead of using the conventional three pole design.
• Conductors: Instead of following the common practice of using 50 mm² and 100 mm² conductors,
they should be sized for the actual load conditions and smaller conductors should be used wherever
possible, except where there is a high incidence of lightning strikes.
• House connections and ready boards: Traditional methods provide a circuit breaker with a protective
housing mounted on the pole and a cable leading to the house. The expensive circuit breaker and its
housing may be replaced by a fuse or even a piece of fuse wire and the cable to the house should be
an aerial conductor of flat twin and earth construction (dumb-bell) cable.
Institutional Cost-cutting Culture
A good example of instituting a cost-cutting culture is Tunisian Company of Electricity and Gas (STEG), the
Tunisian power utility. In the mid-1970s, when only 6 percent of the rural households had access to electricity,
STEG initiated a successful rural electrification program that went on to cover more than 88 percent of the
households by 2000, and aims to cover 97 percent rural households by 2010, while the balance households
are to be served by the solar photovoltaic (PV) systems.
Vigorous efforts to cut the capital and operational costs of rural electrification was emphasized right from
the start, and were followed up by continuous technical innovations to develop and adapt technologies
suitable to Tunisian conditions. The linchpin of these cost reductions was the adoption in the mid-1970s of a
low-cost system named Mise a la Terre (four-wire, grounded neutral network) “MALT”. Instead of continuing
to follow the existing three-phase European distribution system, which was found to be overdesigned for
scattered settlements and low levels of demand in Tunisia, STEG chose to adapt the lower-cost three-phase/
single-phase distribution systems used in North America and Australia to its own needs and environment.
This decision was perhaps the single most important factor in enabling the later success of the Tunisian rural
electrification program. Not only did the broader use of single-phase distribution reduce costs, but also the
effect of taking a courageous, much-criticized, technical decision, fostered confidence and motivation in
STEG to continually develop and implement, over the years, a number of vigorous cost-cutting efforts and
innovative technical approaches to rural electrification. While MALT itself may not be directly transferable,
STEG’s focus on cost-cutting is readily applicable in other sub-Saharan countries.
EXECUTIVE SUMMARY

SUB-SAHARAN AFRICA: INTRODUCING LOW-COST METHODS IN ELECTRICITY DISTRIBUTION NETWORKS
xvi
Single Wire Earth Return (SWER)
SWER is a single wire system that cuts costs by using the earth as a return conductor. SWER originated in
New Zealand in the 1920s, and has been extensively used there and in Australia; today, there are more
than 200,000 km of SWER power lines in the rural areas of these two countries.
SWER is an economical solution for extending power supply into more sparsely populated, low load density
areas of sub-Saharan Africa. Its advantages are its low initial capital cost, design simplicity, ease of construction,
excellent level of reliability and low maintenance costs. Limitations include restricted load capacity, the
requirement for reliable low-resistance earthing, possible interference to metallic communication systems
and higher losses due to charging currents.
Many of the design considerations for SWER are similar to those of other power distribution systems, particularly
with regard to pole strengths, and sags and tensions, although the stringing of only one conductor means
that much longer spans can be achieved for the same strength poles and size and type of conductor. Special
requirements for SWER are the need for isolating transformers and for low-resistance earth banks at
isolating and distribution transformer stations.
Shield Wire System (SWS)
This system has been used in Ghana, Brazil, Ethiopia and Laos. In the mid-1980s, Ghana built a
high-voltage grid that conveyed power to all but a few remote towns. However, these high-voltage transmission
lines could not serve many of the communities they passed over without the additional cost of substations,
transformers, etc., and these costs were unaffordable when compared to the levels of demand from rural
communities.
SWS was developed and implemented to address this problem. It costs about 15 percent of a conventional
power line. Ghana has successfully implemented 526 km of SWS, and connected over 3,000 rural
communities since the mid-1980s.
SWS uses the existing shield wires on the top of the transmission lines as power conductors as well as shield
wires. The shield wires are insulated using standard insulators and optical ground wires may also be used so
that there is no restriction on using the shield wires for communication. SWER is used to convey power up to
100 km from the source along the line and for 20 km on each side of the line for use by rural communities.
xvii
Conclusion
This study has confirmed that power utilities and technical experts in Uganda, Tanzania, Mozambique and
Zambia are interested in low-cost methods which would reduce the costs of networks. It has also confirmed
that proven low-cost methods are available which would significantly reduce both capital and variable costs.
However, so far there have been no systematic efforts to introduce and mainstream low-cost methods in
electricity networks in most sub-Saharan countries. One of the barriers to these low-cost innovations is the
lack of knowledge. This can be readily rectified by reports such as this, and other forums for disseminating
the relevant information. However, this would still leave in place two key barriers: lack of capacity to
undertake the required engineering analysis and work, and lack of a systematic framework for planning
and designing cost-effective networks. The mitigation of these barriers requires capacity-building as well as
a significant change in the managerial and operational culture of the utilities.
EXECUTIVE SUMMARY


1
The level of electrification in sub-Saharan Africa is low, with less than 10 percent of the rural households
having access to electricity. One of the key barriers to accelerating access is the high cost of connections
arising, inter alia, from the use of outdated, unsuitable, high-cost methods in electricity networks. A second
key barrier is the small and dispersed nature of electricity demand, arising from the low density of population
and low income levels, which lead to high average costs of providing electricity service. The objective of this
report is to help in reducing the high costs of electrification by documenting proven, low-cost methods and
techniques in electricity networks that have not yet become widely used in sub-Saharan Africa.
Many African countries have inherited European standards for their distribution networks, standards that
were developed for high density, high demand centers in continental Europe. This has often resulted in
oversized networks with unnecessarily high costs for connecting rural loads. In spite of these problems,
some countries in Africa, especially Tunisia and South Africa, have been addressing these issues through an
active pursuit of measures to decrease the costs per connection and, in the process, developing their own
locally adapted low-cost standards.
This section of the report focuses on the past and current situation in Uganda, Zambia, Tanzania and
Mozambique, and describes country barriers and makes suggestions for mainstreaming low-cost
methodologies or strategies. The information is based on discussions with utility experts, consultants, researchers
and available reports.
Uganda
Only an estimated 5 percent of the total population and less than 1 percent of the rural population has
access to grid-supplied electricity; about 72 percent of the total grid-supplied electricity is consumed by 12
percent of the domestic population concentrated in the Kampala metropolitan area and in the nearby towns
of Entebbe and Jinja. Uganda currently has one of the lowest electricity consumption per capita. At present,
Uganda Electricity Distribution Company Limited (UEDCL), the distribution company, connects about 20,000
consumers per year, while there is a population growth of 90,000 or more new households per year.
1. Introduction

SUB-SAHARAN AFRICA: INTRODUCING LOW-COST METHODS IN ELECTRICITY DISTRIBUTION NETWORKS
2
The cost of rural connections in Uganda often exceeds US$8,000-US$10,000 per connection. UEDCL,
like many other African utilities, uses a common standard of a typical European three-wire design for 33
kilowatt (kV) Medium Voltage (MV) distribution networks. This implies a high cost per km of line (US$25,000)
and, in many cases, unnecessary high power transfer capacity (over 15 MW).
Further, rural loads are mostly calculated using simple formulae. As a direct result, both peak power, and
the monthly consumption figures are overestimated. For example, a load study (undertaken in 2000 as a
cooperative project between Makerere University, Kampala, Uganda Electricity Board and Lund Institute of
Technology, Sweden) found that in Najjeera village outside Kampala, all four transformers had a peak
power demand of less than 6 kVA, whereas the rated capacity of the transformers were 100 kVA.
In Uganda, the main barriers to low-cost methods were identified as:
• UEDCL’s Rural Electrification (RE) engineering capacity is too small;
• RE planning methodology, design guidelines and planning tools are lacking; and
• Lack of appropriate information and ability to compare technical options.
The following cost-reducing ideas emerged from a well-attended two-day workshop organized for this study
in 2005:
• The Shield Wire Technology (SWT) on 132 kV transmission lines should be applied to both existing
lines as well as to forthcoming ones. While upgrading, a special case should be taken to change
existing steel wires to ACSR conductors, which are likely also to include optical fiber links.
• Special attention shall also be given to 22 kV lines for rural electric distribution.
• SWER systems should be widely accepted and used wherever possible. However, special attention
should be paid to protect earth wires/conductors from being stolen or vandalized perhaps by concealing
the earth wire in hollow concrete poles. It was further recommended that ongoing pilot projects should
be designed to demonstrate the applicability of SWER technology in Uganda.
• Ready boards and simpler house wiring techniques should be implemented in Uganda in forthcoming
projects. Ready boards should be more actively promoted by the electricity regulator and should be
locally produced in Uganda, with due attention being paid to quality control and safety standards.
• Design codes should be adjusted to allow for simpler construction methods and allow low-cost techniques.
• There is a strong need to introduce a “culture of maintenance”, now almost non-existent in Uganda.
Tanzania
Electricity access rates in Tanzania are low.
The Tanzania Electric Supply Company Limited (TANESCO), a vertically integrated utility, typically uses
British Standard three-wire designs for its 33 kV and 11 kV MV distribution networks. This implies rather

3
INTRODUCTION
high cost per km of line extension and, in many cases, in rural and remote areas unnecessary high power
transfer capability (e.g., over 15 MVA). The cost of rural connection, most often exceeds US$10,000 per
connection, especially in low population density areas. TANESCO has a limited capacity for increasing the
access rate.
TANESCO added 38,000 connections – less than the number of additional households created that year –
in 2003 – but the onset of drought and the need to convert from hydropower to diesel and gas power has
delayed plans to increase access. As a result, TANESCO is presently meeting less than 50 percent of the
known demand for new connections.
A number of rural electrification projects are being carried out by the Ministry of Energy and Minerals
(MEM) and TANESCO to demonstrate more cost-effective solutions. RE projects in Urambo and Serengeti
have used new functional procurement methods for the first time. Simple specification on the functional
level means more design work for the designer but also requires more careful analysis of suggested
solutions, typically valuing quality over price. Functional procurements have resulted in more innovative
solutions which, when mainstreamed, could demonstrate clear cost-cutting measures. Both projects will
make use of insulated ABC conductors for Low Voltage (LV) distribution, concentric drop wires for houses
and use-ready-boards. Both measures are intended to minimize non-technical losses like electricity theft.
A study was performed in 2002 to design low-cost MV transmission and especially introduce distribution
systems based on SWER techniques. The study, initiated by the World Bank and financed by Swedish
International Development Cooperation Agency (Sida), was performed by a SWER specialist from Eskom
South Africa. The study found that outdated, high-level costing models (urban standards) have been configured
and used for almost all applications even in low demand rural areas. In a typical project, it was found that
construction of a TANESCO standard three-phase, 62 km line at 33 kV would cost $1.4 million; when
“appropriate design engineering” was applied to the project, the costs would be US$368,000, while a
SWER line for the same project would cost only US$166,000.
In Tanzania, internal house wiring, using a 63 ampere (A) main switch/breaker, for a two-room house with
a separate toilet costs about TSh 152,000 (US$160). In a special R&D project, the Dar es Salaam Institute
of Technology (DIT) looked at the possibility of reducing the house wiring cost]. The study found that by
adopting a better methodology, using fewer materials and wiring differently, the house wiring cost could be
reduced to less than TSh 90,000 (US$94). Further, with the use of ready boards, the “house wiring” costs
reduced to TSh 50,000 (US$52).
A typical service line in Tanzania costs TSh 250,000 (US$263) for a single-phase 25-mm2 connection. For
a three-phase connection, 50-mm2 cable is used, and the corresponding service line cost is estimated to be
TSh 583,000 (US$613). The service line is restricted to maximum 30 m from the LV backbone. For route
lengths beyond 30 m, TANESCO charges are based on actual cost incurred.
SUB-SAHARAN AFRICA: INTRODUCING LOW-COST METHODS IN ELECTRICITY DISTRIBUTION NETWORKS
4
In Tanzania, the main barriers to low-cost methods were identified as:
• The perception that “low-cost” is equivalent to “low quality”;
• TANESCO’s small RE engineering capacity;
• Costly and outdated planning methods and designs that are not applicable to rural loads;
• Inappropriate RE planning methodology, design guidelines and planning tools;
• Lack of appropriate information and ability to compare technical options;
• Inefficiency of TANESCO’s internal standardization committee; and
• High cost for foreign contractors to be registered in Tanzania (US$30,000 initial and US$10,000 per
year, which is about 1,000 times higher than for local Tanzanian firms).
The following cost-reducing ideas emerged from a well-attended two-day workshop organized for this study
in 2005:
• Introduction of single-phase motors (3-75 kW) in the Tanzanian commercial market;
• Introduction of SWER technology for energizing small remote rural load centers;
• Introduction of shield wires in new transmission line corridors for cost-effective distribution; and
• Introduction of ready boards and current limiting devices and simpler house wiring methods to address
poorer households.
Mozambique
Mozambique is richly endowed with cheap hydropower and produces 7,193 Gigawatt hour (GWh) per
year. However, Mozambique’s own consumption is restricted to about 200 Megawatt (MW) and 1,390
GWh per year. In Maputo, the capital, about 20 percent of households now have access to grid electricity
while outside the Maputo province, only 2.6 percent have access to the national grid. This indicates that only
5-6 percent of Mozambican households have access to electricity at present. There has been practically no
increase in access over the last 25 years. Of the 120 or so “district capitals”, some 55 are still without any
form of public electricity supply, or have sporadic supplies from small generator sets to a handful of consumers
via old and poorly maintained small grids.
The Government has recognized the high costs and heavily implicit cross-subsidies in expanding electricity
access via EdM, the power utility, to distant areas with low levels of demand. Under the Energy Reform and
Access Program (ERAP), the Government began rehabilitating isolated grids in relatively distant towns and
introduced management contracts for these systems. The Government has also recognized the potential
economic and environmental promise of decentralized renewable electricity to serve very small, dispersed
loads.
With the assistance of a consultant funded by the African Development Bank in 2004, the EdM finalized a
master plan for electrification. The master plan describes generic design costs (unit costs) for both transmission

5
and distribution systems and includes overhead lines, underground XLPE cables, wooden/concrete/steel
poles, substation/ transformer costs for both three-phase and single-phase systems including SWER. The
plan also proposes the use of SWT as a method for cost-effective rural electricity distribution.
In 2002, Mozambique agreed to a 10-year ERAP co-financed by a World Bank credit of US$60 million.
This program includes some cost-reducing provisions:
For the main grid
• Distribution investments, on a supply and install basis, in peri-urban and rural areas, aimed at introducing,
proven lower cost distribution network designs, standards and construction and management procedures,
in order to substantially reduce the cost per new consumer connection and per unit load (kW) served.
• Prove the effectiveness under Mozambican conditions of other options for further cost reductions with
a view to mainstreaming them at a later stage.
For independent grids
• Independent grid suppliers will be offered capital subsidy on a competitive basis, subject to
pre-specified criteria for service quality and household access.
• Even if it appears necessary that some of these small-scale investments have to be made by the public
sector, construction (on a turnkey basis) and operation/management would be done by the private
sector.
In Mozambique, the main barriers to low-cost methods were identified as:
• Unrealistically estimated rural and peri-urban loads. It is understood from past experiences and also
from current design planning that electricity demand is highly overestimated for both rural and peri-
urban energy consumption and peak power.
• Limited knowledge of innovative and cost-effective solutions, even though such solutions are of interest.
• Unsystematic framework for planning and design of cost-effective networks.
The following cost-reducing ideas emerged from a well-attended two-day workshop organized for this study
in 2005:
• Need for wider distribution of knowledge regarding low-cost options. It was recommended that there
should be more, specifically oriented, workshops involving more categories of technicians in the
design and planning process. More time should be spent analyzing input data before constructing RE
projects.
INTRODUCTION

SUB-SAHARAN AFRICA: INTRODUCING LOW-COST METHODS IN ELECTRICITY DISTRIBUTION NETWORKS
6
• Involvement of communities in early stages of planning. It was recommended that EdM make contact
with local community leaders at early planning stages to optimize designs and get priorities right.
Projects should be developed keeping in mind the sustainability factor rather than purely social
considerations.
• Revise the present standards and develop more appropriate rural standards. A more flexible design
approach was recommended in which innovative and appropriate ideas would be adopted to find the
most appropriate solutions. It was proposed that better and cheaper house wiring schemes and ready
boards should be permitted to reduce the cost of connection for poor households.
Zambia
In Southern Africa, Zambia enjoys the unique position of having surplus electric power available. Much of
the power generation capacity was constructed 30 years ago and little debt is still attached to this investment.
Zambia has a population of 10.5 million on an area of 750 thousand km2 , so that the average density is
only 14 persons/km2. The population is mostly urban and many people live in Lusaka and the Copperbelt
region. This means that large areas of the country have a very low population density and dwellings in these
regions are widely dispersed. One of the critical developmental challenges facing Zambia is the access to
modern forms of energy by the rural population. Only about 2 percent (about 124,000) of the people out
of the 6.2 million rural population have access to electricity.
Zambia Electricity Supply Company Ltd (ZESCO), the power utility, uses 100mm² overhead conductor as a
standard. Three-phase MV (33 and 11 kV) and LV (400 V) lines only, and nothing smaller than 25 kVA,
three-phase transformers. These high “standards” are justified on the basis that it is too costly to go back if
the network needs to be upgraded at any point of time in the future. ZESCO points out that the very low tariff
encourages a high consumption.
ZESCO charges K256,000 (US$51) for a domestic urban connection K380,000 (US$76) for a rural
connection, and full cost recovery for any connection away from the grid. Due to the expensive and
standardized nature of the connection, it is estimated that each connection costs ZESCO about US$700.
At present, there are no “low-cost” initiatives in Zambia. The main barriers to low-cost methods were
identified as the lack of:
• Interest and motivation in low-cost methods; and
• Knowledge regarding low-cost methods.

7
The following cost-reducing ideas emerged from a well-attended two-day workshop organized for this study
in 2005:
• Grid extension should not be the only solution for the provision of electricity to rural areas. It was
crucial to consider the economics of grid extension and consider other systems such as mini/micro
hydro, biomass, solar PV, etc., where these could offer least-cost and effective options.
• Different techniques may be used in Zambia but they have to be cost-reflective. In view of the special
peculiarities, the techniques proposed (SWER, SWS, etc.) will require pilot studies and testing to ascertain
suitability.
• Socio-economic studies should be undertaken to consider non-technical issues of theft.
Common Features
There are a number of ongoing parallel activities to implement electrification master plans, rural electrification
agencies, demonstration projects, education and training programs. However, many ongoing initiatives are
financed by different donor organizations, and there is weak coordination (if any) amongst them.
The common barriers to low-cost innovations are:
• Limited local engineering and design capacity;
• Costly and outdated planning methods and designs that are not applicable to rural loads;
• Inappropriate planning methodology, design guidelines and planning tools;
• Lack of appropriate information and ability to compare technical options; and
• No systematic framework or motivation for planning and designing cost-effective networks.
INTRODUCTION

There are many low-cost methods and techniques that are worthy of consideration, and should be considered
in specific situations as the opportunities arise. In comparing the costs of different methods, it is important to
avoid focusing only on initial capital costs. Instead, the cost comparison should be based on lifetime costs
which take future capital costs into account, whether from depreciation or from system expansion to take
account of load growth and operational costs.
This report focuses on four low-cost methods that are likely to have a significant cost-reducing impact and
are also likely to be widely applicable in sub-Saharan Africa. They are:
• “Appropriate design” engineering;
• Developing an institutional cost-cutting culture;
• SWER; and
• SWS.
These low-cost methods should be seen as one element of an overall plan to keep costs down. For example,
there are several “good business practices” that could go a long way in reducing the cost of electrification.
One is the adoption of procurement practices that increase competition and avoid wastage; functional
procurement may itself reduce costs because it gives some flexibility to vendors. Better inventory management
would also help; it is common in the utilities to find a lot of slow-moving items in their stock, yet the utility
suffers from shortages of critical equipment. Finally, overall quality control, with improved operational
maintenance, would reduce lifetime costs.
“Appropriate Design” Engineering
The term “appropriate design” engineering describes an approach to “low-cost” technologies rather than a
specific technique or system, such as SWER or MALT. Appropriate design engineering looks at existing
networks, the design, the materials used, the methods of construction, benefits of marketing and a whole
range of issues – and these enable lower cost networks to be constructed without changing the basic
concept. This is a value engineering exercise in which each component is critically assessed to ensure that
it is the most economical and appropriate device for the job.
2. Suggested Low-cost Methods
9

SUB-SAHARAN AFRICA: INTRODUCING LOW-COST METHODS IN ELECTRICITY DISTRIBUTION NETWORKS
10
Design
Electrical utilities, especially vertically integrated national utilities, frequently use standard designs that have
evolved over many years, and tend to incorporate solutions to all the problems that have been experienced
no matter where the network was installed. This is “one-size-fits-all” policy leads to network designs that are
suitable for a variety of conditions – desert, grassland, forests, coastal and polluted regions – irrespective of
the actual site conditions. As a result, almost all networks are substantially overdesigned and can carry
several times the actual power required.
Costs are further exacerbated by failure to understand and apply loading factors applicable to the demand
likely to be experienced by the networks.
Network cost reduction starts with a good design based on an accurate knowledge of the actual load flows
and consumption. There are enough experience and examples of developing country electrification for
these values to be known for all situations. Typically, a network with single-phase, 60 Amp connection to
each consumer, can be expected to have an After Diversity Maximum Demand (ADMD) of 0.4 to 0.7 kVA.
This can be compared with the “standard” design level of 2.5 to 3.5 kVA and, it is obvious that applying load
levels four to five times above reality will cause overdesign all the way back up the network. This will affect
line sizes, voltage drop calculations, transformers and switchgear capacity.
How can future growth load be taken into account in the network design? One justification advanced for the
“standard design” approach is that the network must allow for growth and nobody wants to keep going back
and adding to the network. This is the “design, construct and forget” policy, the direct result of which is that
network costs remain high.
The low-cost alternative is to design the network for the correct, actual load flows, with flexibility to upgrade
it easily, as and when the load increases. The method for doing this is to consider each transformer zone
and design the network to allow for additional transformers to be inserted as the need arises. Careful design
ensures that the LV line lengths are reduced when this technique is applied, leading to reduced losses and
better voltage regulation. Another method is to provide MV single-phase to low load areas but to design the
network so it may easily be changed to three-phase MV by the addition of a single wire. This wire can be
added to correctly sized and pre-drilled poles. The same may be done with the LV network.
Nevertheless, it is recognized that distribution systems cannot always be engineered and designed to the
size needed because some standardization is needed to address concerns about adequate maintenance
and inventory of spares, as well as to consider the availability of materials and equipment. Thus, a balance
has to be found between the need for standardization and the benefits of flexibility in design.
Taking each component that comprises a network in turn, the following ideas can be helpful in reducing
costs.

11
Transformers
Transformers are one of the big cost items in any network and in many developing networks they are
operating at a fraction of their design output and do so for their entire life. (It is also not unusual to find
overloaded transformers.) Transformers should be closely sized to the actual load flows and, in some
instances, it may be beneficial to consider single-phase transformers. These transformers can be replaced
later with three-phase transformers and the lines upgraded from single-phase to three-phase as needed.
Transformers may be overloaded for considerable periods of time without any harmful effect, provided the
temperature rise is controlled. Utilities tend to put LV circuit breakers on the output of transformers and this
limits the ability of the transformer to operate under overload conditions. An alternative method is to put oil
temperature probes in the transformer and trip the output of the transformer before the oil temperature
exceeds the design level. In this way, the short-term overload capacity of the transformer is utilized to
provide the network with the required power at minimal cost during peak consumption.
Poles
The traditional pole design has cross arms on the top of the poles. This creates unnecessary wind loading at
the top of the pole and a large number of components that increases cost. Modern designs use post-top
insulators fixed directly to the side of the pole and there are no cross arms (see Picture 2.1). This type of
construction, using porcelain or cyclo-aliphatic resin isolators, improves the impulse withstand voltage of the
line. Typically, an 11 kV line impulse voltage rises from 75 kV to 95 kV.
SUGGESTED LOW-COST METHODS
Picture 2.1: 22 kV Rural Line. (Traditional Design on the left, New Design on the right)

SUB-SAHARAN AFRICA: INTRODUCING LOW-COST METHODS IN ELECTRICITY DISTRIBUTION NETWORKS
12
Pole-mounted transformers should be mounted on a single pole and the typical, traditional design using
three poles dispensed with (see Picture 2.2).
Conductors
Utilities frequently use 50 mm² and 100 mm² conductors. The low-cost alternative is that the conductors
should be sized for the actual load conditions and smaller conductors used wherever possible. The only
exception to this should be where there is a high incidence of lightning strikes and there is a danger of
smaller conductors being burned off during such strikes.
House connections
Traditional methods provide a circuit breaker with a protective housing mounted on the pole and a cable
leading to the house. The expensive circuit breaker and its housing may be replaced by a fuse or even a
piece of fuse wire and the cable to the house should be an aerial conductor of flat twin and earth construction
(dumb-bell) cable.
Ready boards
A ready board is a distribution board that acts as a termination for the incoming supply from the utility. The
ready board comes complete with circuit breakers, socket outlets and a light; this effectively forms a starter
pack for new household wiring system. Provision of a ready board means a huge cost-saving for the
householder, as he does not have to install fixed wiring in his house or seek inspection from the utility for his
Picture 2.2: The transformer on the left is 50 kVA and the one on the right 100 kVA

13
installation. This means that some structures that would not normally be approved for electrical installations
can now become part of the network, thereby increasing the consumer base and reducing the average cost
per connection.
Construction costs
One of the major causes of high construction costs is the use of centralized labor, centralized depots and the
need to transport both personnel and material over long distances to new construction sites. A more cost-
effective strategy is to provide training to local personnel. Initially, they can be trained to carry out final
connections to the consumers and installation of the meter. Next time around, successful entrepreneurs can
be trained to do LV construction and eventually they can graduate to MV construction. These trained personnel
can bid for contracts for construction on a competitive basis and will employ local labor in their construction
teams.
SUGGESTED LOW-COST METHODS
Benefits of Ready Boards: Swaziland
In 2003, Swaziland Electricity Board was trying to find ways of reducing the cost of extending electricity torural communities. Swaziland was already applying many of the techniques described under “AppropriateEngineering” but the cost per connection was still very high due to lengthy lines and a few consumers perkm. A major problem was that Swaziland Electricity Board did not wish to provide electricity to any housesthat were not constructed out of approved materials such as brick or stone with tiled or corrugated ironroofs. This meant that more than 50 percent of their potential consumers could not be provided withelectricity. By introducing ready boards, the Swaziland Electricity Board was able to reduce the average costper connection by more than 50 percent.
Cost-cutting Culture
It is clear that each country and utility would have to find its own way of instituting a cost-cutting culture within
the utility. In this section, the report describes the experience of STEG, the Tunisian utility. While Tunisia is not
a sub-Saharan country, its experience is relevant for power utilities in this region.
Tunisia’s rural electrification program was launched in the mid-1970s, a time when only 6 percent or
30,000 of the country’s rural households had electricity. At that time, about one-half of Tunisia’s population
lived in rural areas. Over the ensuing years, the country has made impressive gains in providing electricity
to its rural population. By the end of 2000, 88 percent of all rural households had electricity service. Today,
the country has begun a program to serve even the most remote areas with PV systems. The current goal is
to achieve total rural coverage by the year 2010, with 97 percent household having a grid connection and
3 percent of households served by PV systems. The accomplishment is even more remarkable because of
the very conservative definition of rural areas, which involves households outside of incorporated areas.
Many populations that in other countries would be defined as “rural” villages and towns are defined as
“urban” in Tunisia. Thus, Tunisia’s rural population is highly dispersed and isolated, with long distances
between small groups of sometimes scattered houses.

SUB-SAHARAN AFRICA: INTRODUCING LOW-COST METHODS IN ELECTRICITY DISTRIBUTION NETWORKS
14
In the early 1970s, the entire electricity system in Tunisia was based on the European model of extension of
three-phase lines throughout the service zone. The majority of African countries that launched rural
electrification programs in the 1970s did so with the assistance of European utilities, and used the European
model. This model is suitable for the dense population and heavy loads of Europe, but unnecessary for
scattered settlements and low levels of demand in developing countries.
Tunisia chose to discard the European model, despite having inherited it. Instead, Tunisia chose, at an early
stage of development of its rural electrification system, to make use of the experience with lower-cost three-
phase/single-phase distribution systems used in North America and Australia, and to adapt this technology
uniquely to its own needs and environment.
When the need to accelerate rural electrification became evident in Tunisia, STEG undertook a Technical
Audit of Distribution in 1973 to assess both of these distribution methods. The study indicated that the
existing European system was not best adapted to an ambitious program of low-cost rural electrification,
under Tunisian conditions. Given low rural incomes, dispersed households and the limited consumption of
the targeted population – generally lighting and less frequently refrigeration or television – it was clear that
the cost of rural electrification had to be kept as low as possible.
The Audit recommended the study of a new means of distribution that combined three-phase and single-
phase lines. Based on the North American model, this system was known in Tunisia as MALT. Although
controversial at the time, the recommendation was confirmed by technical and economic studies conducted
for the Master Plan for Distribution in 1974-1975. The studies estimated 18-24 percent savings using the
MALT system.
After several complementary studies, STEG engineers felt confident both of the technical feasibility of the
transformation and of the superiority in quality of service of the MALT system. At that point, the decision to
change the system became an economic question, and economic studies were conducted in several stages
in 1974-1975.
According to one of the Tunisian engineers who participated in the program, “Never had a technical
recommendation raised as many debates and exchanges of points of view in STEG.” The environment at
the time was hostile to the changeover, given the predominant European three-phase system, with opposition
both from the system operators and from European partners.
Some technical advice on the three-phase/single-phase system was provided by Hydro-Quebec engineers,
and short-term technical visits to Canada were organized, beginning in 1976, for system operators and
engineers. But the planning of the new system and solving of problems encountered in the course of
changing the system were entirely the work of the STEG staff.

15
According to many in Tunisia and elsewhere, this decision was perhaps the single most important factor in
enabling the later success of the Tunisian rural electrification program. Not only did the broader use of
single-phase distribution reduce costs dramatically, it also enabled far more households to be electrified
within the same budget. But the effect of taking a courageous, much-criticized, and later-proven-correct
technical decision, which was supported by the political establishment – together with the experience of
solving the numerous technical and other problems involved with setting up the new system – went further
than this. It appears to have fostered in STEG the confidence and motivation to continually develop and
implement, over the years, a number of vigorous cost-cutting efforts and innovative technical approaches
for rural electrification.
As the three-phase/single-phase system has advanced and proven its reliability and safety, criticisms of the
MALT have diminished1 but some negative points are still raised. The main disadvantage of MALT is the
need to make adaptations and conversions in order to serve large motor (> 7.5 horsepower (hp) in Tunisia,
greater than 100 hp in USA) agro-industrial and deep borehole irrigation loads requiring generally three-
phase electrical motors. This problem does not arise with any household uses such as refrigerators or color
TV, or with small motors e.g., electric pumps, manual tools, which present no difficulties with single-phase
lines. But it does potentially present an extra obstacle to large-scale industrial development in remote rural
areas, since the additional costs are borne by the consumer.
The successful adoption of the MALT system fostered an aggressive approach in STEG as regards cost-
cutting technical innovation. Throughout the 1980s and 1990s, technical and economic studies and pilot
projects were undertaken with a view to further reducing costs in the distribution system. These resulted in
a number of changes and cost-savings, of which examples are given below, roughly in order of importance
of cost-savings. Though the savings of any one innovation may be relatively modest, the cumulative effect is
considerable and testifies to the importance of a culture of “continuous improvement” within STEG.
• Aluminum alloy cheaper than copper wiring. From 1991, MV lines were constructed using
aluminum alloy (ASTER) wires rather than copper, after a study pointed out that international copper
prices continued to rise, and estimated the potential savings at DT500,000 per year.
• Pin insulators cheaper than suspension chains. The introduction of pin insulators on MV lines
beginning in the 1990s reduced costs because with this design, the conductor is held higher on the
pole, so shorter supports can be used to achieve the same ground clearance. In the district of Kasserine,
for instance, savings of 20 percent for both single- and three-phase lines were achieved compared to
lines with suspension chains.
• Cheaper, lighter poles. Prestressed Armored Concrete (PAC) poles have been gradually replaced
with a new type of “round iron poles”. The round iron pole is cheaper, much lighter and much less
fragile than the equivalent in PAC. Transportation of iron poles is much easier especially for rural
electrification. The range of PAC poles has been reduced to three classes of 9 m poles, while 18 class
and length combinations of round iron poles are in the inventory.
1 Nevertheless, many utilities in sub-Saharan Africa do not adequately consider the possibility of using MALT or its parent system NAS.
SUGGESTED LOW-COST METHODS
SUB-SAHARAN AFRICA: INTRODUCING LOW-COST METHODS IN ELECTRICITY DISTRIBUTION NETWORKS
16
• Cheaper protections. Expensive LV circuit breakers at MV/LV substations were replaced by very
cheap yet adequate fuses.
• Less expensive meters. Limiting three-phase meters to large consumers and increasing the power
range of less expensive single-phase meters.
• Pole fastenings. Backfilling around the pole with stone was adopted, rather than using cement
foundations for weak poles (8/150, 9/150 and 9/180 m/daN), to reduce line construction cost.
• Mixed medium- and low-voltage network. Use of MV network poles to carry part of the LV
network as under built lines was done wherever possible, so that fewer LV poles are needed.
Single Wire Earth Return
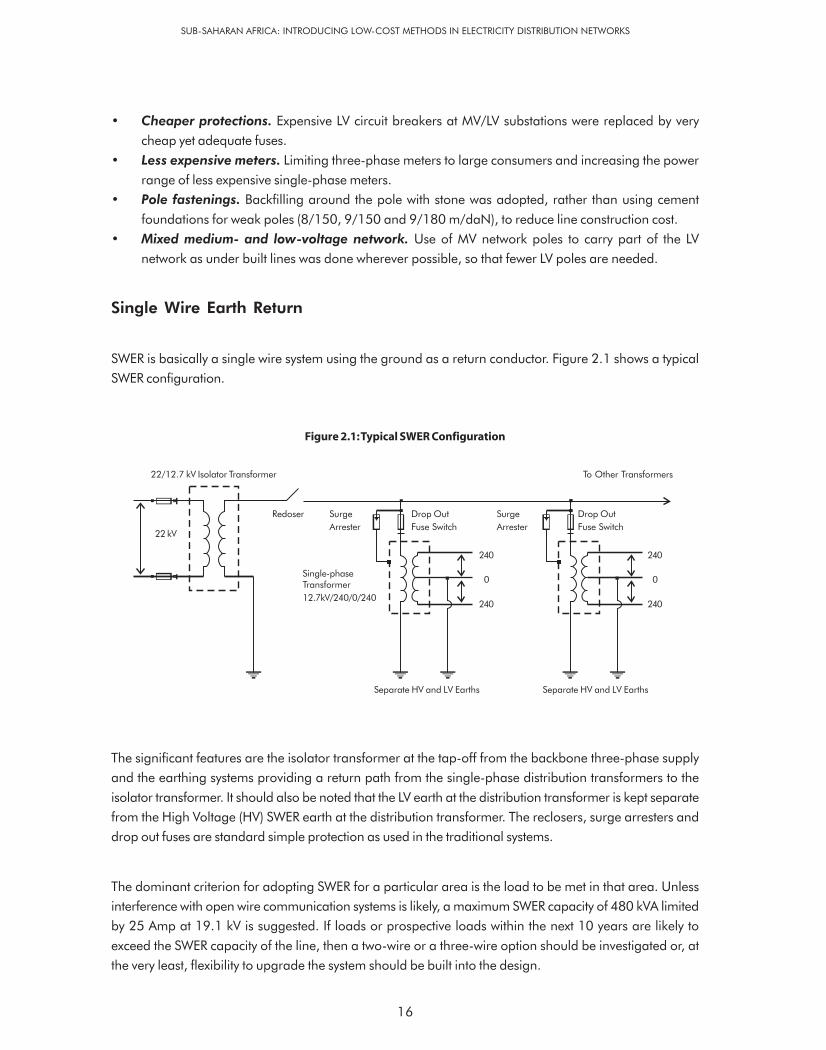
SWER is basically a single wire system using the ground as a return conductor. Figure 2.1 shows a typical
SWER configuration.
Figure 2.1: Typical SWER Configuration
The significant features are the isolator transformer at the tap-off from the backbone three-phase supply
and the earthing systems providing a return path from the single-phase distribution transformers to the
isolator transformer. It should also be noted that the LV earth at the distribution transformer is kept separate
from the High Voltage (HV) SWER earth at the distribution transformer. The reclosers, surge arresters and
drop out fuses are standard simple protection as used in the traditional systems.
The dominant criterion for adopting SWER for a particular area is the load to be met in that area. Unless
interference with open wire communication systems is likely, a maximum SWER capacity of 480 kVA limited
by 25 Amp at 19.1 kV is suggested. If loads or prospective loads within the next 10 years are likely to
exceed the SWER capacity of the line, then a two-wire or a three-wire option should be investigated or, at
the very least, flexibility to upgrade the system should be built into the design.
Single-phaseTransformer
12.7kV/240/0/240
Redoser Surge
Arrester
Drop Out
Fuse Switch
Surge
Arrester
Drop Out
Fuse Switch
22/12.7 kV Isolator Transformer
22 kV
240
0
240
To Other Transformers
240
0
240
Separate HV and LV Earths Separate HV and LV Earths

17
The advantages of SWER are its low initial capital cost, design simplicity, ease of construction, excellent level
of reliability and low maintenance costs. Long spans can be achieved reducing the quantities of poles,
insulators and other materials required. As a consequence, both labor and material costs are considerably
lower than for traditional systems. It is an economical solution for extending power supply into more sparsely
populated, low load density areas.
• Reduced capital cost. The reduced capital cost stems from the fact that there is only one conductor.
As a consequence, there is less pole-top equipment (no cross arm and only one insulator). Very long
spans can be achieved thus requiring fewer poles, insulators and other materials resulting in lower
labor and material costs. In New Zealand, it is not uncommon to have spans well in excess of 1 km in
length spanning from hilltop to hilltop.
• Design simplicity. It is a simple single-wire system supported on basic poles and with basic electrical
protection. The only issue of any major concern in the design is ensuring that low-resistance earths are
achieved both at the isolating transformer and the distribution transformers.
• Ease of construction. With only one wire and simple basic pole supports, construction could not be
easier. Sagging and separation of conductors is not an issue. Many of the SWER lines in New Zealand
and Australia have been erected by farmers with no previous experience in erecting power lines.
• Reduced maintenance costs. SWER has fewer components than traditional systems and, hence, less
things to go wrong. In addition, because there is only one wire, there are no problems with line
clashing, and tree and vegetation management problems are minimal. The only significant maintenance
issue is the testing of earths. Isolation transformer earths should be checked annually and distribution
transformer earths on a three-year cycle basis. Experience, especially in benign earthing conditions
as found in New Zealand and in the non-desert areas of Australia, shows that earth test results are
seldom a concern.
• Reduced bush fire hazard. Most bush fires are caused by sparking as a result of conductor clashing.
With only one conductor, this does not occur. As described below, however, poor earthing conditions
in semi-desert areas of Australia have caused some pole fires at isolator transformers but this is much
less likely to be a cause for bush fires than conductor clashing and, in fact, in bush fire-prone places
in Australia, SWER is a safer option than two- or three-wire options.
New Zealand and Australia experience
The SWER power distribution system was first invented in New Zealand in 1925, and by the 1940s it was
finally seen as the preferred solution for the economic extension of power distribution networks in the
remote rural areas of both New Zealand and Australia.
Today, there are more than 200,000 km of SWER power lines spread throughout the rural areas of both
countries. Electrification of remote, sparsely populated regions was virtually completed throughout Australia
and New Zealand in the 1980s and there has been very little new SWER construction since then other than
additional spurs to new consumer premises.
SUGGESTED LOW-COST METHODS

SUB-SAHARAN AFRICA: INTRODUCING LOW-COST METHODS IN ELECTRICITY DISTRIBUTION NETWORKS
18
In New Zealand, most of the SWER-supplied electricity is used for shearing machines, pumping water, saw
milling, welding, heating, lighting and household and farming appliances. It also serves other small supporting
industries and workshops in settlements surrounded by the farms.
The terrain is generally hilly and rugged, and so the SWER lines tend to traverse from hilltop to hilltop with
very long spans, many of them in excess of 1 km in length. Although some SWER systems are strictly radial,
most are radially inter-connectable, i.e., they are able to be fed from both ends, and have strategically
located break points enabling sections to be kept live while other sections are made dead for repairs.
Australia’s SWER systems generally supply dry farming areas where grazing and crop-growing predominate
but also includes other energy-intensive agricultural activities such as dairying, fruit-growing, poultry and
pig production. The maximum demand on SWER systems supplying predominantly dry farming areas has
grown at an average of 4.3 percent per annum. This rate of growth has not necessitated an upgrade from
SWER to two- or three-wire systems.
However, in areas where the land use has altered significantly from traditional grazing and crop-growing to
vineyards, fruit-growing or the intensive farming of poultry and pigs, load growth has necessitated such
conversion; some of this has occurred as early as 10 years after the SWER was commissioned. When
voltage control or overloading difficulties arise on SWER systems, the usual practice is to erect a new three-
phase distribution backbone through the affected area and divide the SWER system up into a number of
smaller SWER systems.
Ensuring good earthing conditions is a major consideration in Australia. In most places where SWER has
been installed, typically the rainfall occurs over a relatively short part of the year with mostly dry conditions
prevailing for the remainder. These conditions are not ideal for good, consistent earthing and have created
some problem particularly with regard to pole fires at isolator transformers. The solution, required only at
isolator transformer locations where other methods of earthing could not obtain the low resistance of 1 ohm
required, was to:
• Drill a vertical hole with a diameter of approximately 100 mm into the ground until a substantial band
of moist soil is encountered;
• Drill into this moist band for 6 m;
• Lower a copper electrode (32 mm x 3 mm flat copper strap) into the hole; and
• Fill with a mixture of betonite and gypsum.
The dry ground conditions can result in high impedance earth faults which are difficult to detect on SWER
systems as they are often seen by protective devices as an increase in load current. For this reason,
extensive use is made of fuses on the SWER distribution systems. Each distribution transformer and each
SWER tee off or SWER spur line is fused using a sparkless fuse link in an Expulsion Drop Out style fuse
mount fitted with an anti-fire device.

19
High incidence of lightning can also be a problem in Australia so silicon carbide-type surge diverters with
pressure relief and earth lead disconnect device are mounted as near as possible to the distribution transformer
HV bushing.
Interference with the communication systems has not proven to be a significant problem in New Zealand or
Australia, probably because regulations require SWER currents to be restricted to 8 Amps or less in the
vicinity of open wire communication circuits. Today, many power utility engineers believe that this regulation
can be relaxed because the advent of fiber optics cabling and radio communication means that interference
with communication is no longer a major consideration.
Technical issues
The key technical issues related to SWER are earthing and protection.
The reliability and design of earthing systems is critical to the safety and success of SWER distribution
systems. Not only must the SWER earthing system conduct the occasional fault currents but it must conduct
the continuous load current as well. Particular care must be taken to maintain the continuity of the earth
system and to ensure that the resistance of the earthing remains within specification.
Although it is desirable to use standard earth banks as far as practicable, it is nevertheless essential to check
soil resistivity and ground conditions in the area throughout the year before finally determining the earth
bank design.
The mechanical reliability of the earthing system is also important. Open circuits or poor earth connections
significantly affect the operation of a SWER system. They can also produce dangerous touch voltages
resulting in risk to safety of people and animals. Adequate protection of the earthing system is required
where: (i) people pass by or have access to the general area; (ii) cultivation may disturb buried conductors;
(ii) passing vehicles may hit the structure; or (iv) vandalism or theft of copper earth conductors connecting
the transformer to the earth system might occur.
Prospective fault currents and the issues regarding fuse element/energizing current constraints are key to
successful use of SWER. With good earthing, adequate protection is viable even with low fault currents. A
major issue is ground contact in the case of fallen lines. To enhance or increase fault level discrimination,
techniques such as operating at higher voltages (19.1 or 20 kV) and using low impedance or larger source/
isolator transformers are options. Increased fault levels enable reliable and safe operation of protection if
ground contact is a problem.
SUGGESTED LOW-COST METHODS

SUB-SAHARAN AFRICA: INTRODUCING LOW-COST METHODS IN ELECTRICITY DISTRIBUTION NETWORKS
20
The protection solutions for most site situations include:
• Standard drop out fuse protection;
• Standard HRC fuse protection;
• Circuit breaker with over current protection relay; and
• Circuit breaker with special ground current sensing relay.
The first three options meet most protection requirements. A typical circuit breaker equipped with auto-close
functions provides excellent circuit protection for longer circuits and would be used on 200 kVA and 400
kVA isolator transformers. The last option is more expensive, as the relay cost is approximately US$2,500.
The relay monitors for arcing patterns rather than fault current and thus can detect very low current faults
of a few Amps against the primary current. It is usually only considered in desert or very dry areas where
ground contact resistances are very high.
With a SWER voltage of 19.1 kV, protection will not be a major technical constraint. Usually a drop out fuse
or a circuit breaker equipped with auto-reclose, over current and fault protection at the isolator transformers
and standard drop out fuse protection elsewhere will meet the requirements.
Standard surge arrestors should be installed at isolator and distribution transformer locations in lightning-
prone areas.
Upgradability
Smart selection of pole heights and strengths, conductor-types and configuration arrangements enable
SWER lines to be built in a manner that will facilitate simple upgrade to a two-wire single-phase or three-
wire three-phase system. Given that the initial capital cost of a well-designed SWER line, including isolator
transformer, is usually 30 percent of the initial capital of a three-phase line, substantial project cost reductions
are achieved. The upgrade would be at a capital cost which would only be marginally higher (<15 percent)
overall than building a three-phase system initially. In practice, the need to upgrade to three phase is not
likely to occur for a long time (10 to 30 years) after the initial installation. Discounted cash flow calculations
would, therefore, support the case for the lower initial installation cost.
The distribution transformers would also require changing to the standard supply voltage. For a three-phase
upgrade, some additional three-phase LV distribution could be required and rebalancing of phases for all
single-phase loads. Any 400 V single-phase motors would need reconfiguring to 230 V or replacement
with three-phase units.
Technologies are available that enable the production of a three-phase supply from a single-phase system
if motor loads exceed 22 kW. The cost and serviceability of such systems requires balancing against the cost
of the upgrade.

21
In practice, only a small percentage of rural supplies will require future upgrade within the life expectancy
of the line. Even if the unexpected happened and some lines require to be upgraded within a short duration
(less than five years), then the overall savings are still significant. These events will happen due to the
enterprise of those communities who will fully grasp the opportunities of electrification. In such cases,
growth will justify and fund the additional capital.
Shield Wire System
The deployment of SWS is best suited for sparsely populated territories which are traversed by HV transmission
lines and is best implemented with the construction of new transmission lines.
Origin and experience
In the early 1980s, Ghana’s Volta River Authority (VRA) invited Professor Francesco Iliceto of Rome University
to join it in considering and proposing a low-cost scheme for the supply of power to communities living near
VRA’s high-voltage transmission lines. The Professor and his team proposed a SWS which was to use the
sky/shield wire, which is at the top of every HV transmission line, in an additional role. The sky/shield wire
is normally grounded for the sole purpose of providing lightning protection to the main power line below it.
The additional role foreseen under the SWS was the transportation of power. The shield wire with power
imposed would still perform its purpose of protecting the power line against lightning strikes thus making it
a dual use resource.
By 1985, SWS proposals had been proved to be technically viable and the scheme was proposed for
incorporation and commercial deployment as part of VRA’s major transmission project for the extension of
power to northern Ghana. The rationale was to be able to provide electricity services to small communities
scattered along the 500+ km transmission line route, which, because of technical and cost considerations,
could not have been served using the normal transmission system design.
Presently, in Ghana, SWS has been implemented on about 526 km of 161 kV lines. A total of about 30
communities and 10,000 premises/households are being served by the scheme. The scheme has been in
commercial operation for almost 15 years now. The largest town served is Kintampo with a population of
about 30,000 and located 58 km north of its sending substation, Techiman. The largest single loads include
sawmills and the Tanoso water works, drawing up to 250 kVA.
The SWS has been able to deliver good quality MV supply to communities up to 100 km away from the
sending substation. It has been used to serve communities up to 20 km from the center line of the transmission
line. The town of Buipe, which is located 104 km south of the sending substation at Tamale, is served by
SWS. Currently, the maximum distance of any community from the take-off point at the transmission line is
21.5 km.
SUGGESTED LOW-COST METHODS

SUB-SAHARAN AFRICA: INTRODUCING LOW-COST METHODS IN ELECTRICITY DISTRIBUTION NETWORKS
22
The operational records from Ghana’s SWS experience show clearly that the outage rates for shield wire
supply are substantially lower than for conventional supply. The data also show that the performance of the
SWS is either better or at least the same as that of the conventional MV supply. The total outage time being
shorter implies that lost sales are minimized for the distribution utility.
It is known that similar SWS have been deployed in Brazil, Ethiopia and Laos. In Brazil, the SWS has been
implemented on about 370 km of 230 kV lines. In Ethiopia, the SWS has been installed on 200 km of 132
kV lines. In Laos, 190 km of 115 kV lines have been equipped with SWS to provide supply. It is, therefore,
evident that the scheme can be deployed over a wide range of transmission lines voltages.
Technical details
In SWS, the sky wire which normally would have been firmly connected to the grounded steel tower body,
would now be insulated from the tower body for MV operation. The insulated shield wire would then be
energized at between 20 kV or 34 kV from the sending high voltage substation. Take-off towers would then
be erected at points close to human settlements for the power to be taken off at 20 to 34 kV and fed into
regular distribution networks within the settlements.
The SWS thus replaces the MV sub-transmission line. Otherwise, the arrangements at the sending substation
as well as the distribution network within the beneficiary community do no change. See Figure 2.2 for a
diagrammatic representation of SWS. The SWS uses earth return so that when one shield wire is installed on
the HV transmission system, a single-phase supply is possible. Where there are two shield wires on the
transmission tower, a three-phase supply can be provided.
Figure 2.2: Diagrammatic Representation of SWS
415/240V
SWL
HV Circuit
Disconnecting Switchwith Fuses
GroundConductor
Pole-mounted MY/LVTransformer Station
Fuses Cut-outLine to Village
SAs
MultipleGrounding Rodsof MV SWS usedfor Earth Returnof Current
Take-off Tower
Buried BareConductor 4m 3m Multiple
Grounding Rodscf LV Network

23
The SWS in operation in Ghana uses the regular 76 sq mm to 125 sq mm shield wire, but the same scheme
can be employed where an optical ground wire is installed since the SWS does not interfere with the optical
fiber transmission. The design criteria and constraints for the SWS are similar to conventional MV supply
except that there are limitations on negative sequence voltage of < 1 percent.
The most significant deviation of SWS from the conventional MV system is the installation of an interposing
transformer which can be produced by many transformer manufacturers. Most of the interposing transformers
used for SWS in Ghana have been procured from Turkey.
Other minor equipment with special specification/requirements includes lightning arrestors, capacitors and
the insulators with arcing horns. None of these present any significant challenge to manufacturers and are
widely available.
SWS has a higher phase to ground voltage than the normal MV system. This requires a nominal increase in
equipment insulation of about 20 percent. Accordingly, the BIL of shield wire equipment typically increases
from 170 kV to 200 kV. This is a relatively minor increase that has not been difficult for suppliers to meet.
Costs and benefits
The implementation of SWS uses essentially the same LV distribution network within the communities. There
is, therefore, no cost difference in the construction of the LV network.
By the dual use of the shield wire, the cost of sub-transmission towers, conductors, grounding mats and
other materials can be completely avoided. The only exception to the elimination or reduction of material
needs is for insulators.
The only element of incremental cost in the bill of materials above that of a conventional HV transmission
line is from the replacement of insulators with those having appropriate arcing horns. On construction costs,
SUGGESTED LOW-COST METHODS
Figure 2.3: Insulator+Arcing Horn

SUB-SAHARAN AFRICA: INTRODUCING LOW-COST METHODS IN ELECTRICITY DISTRIBUTION NETWORKS
24
one can expect that there is a small nominal increase in erection cost for a transmission line with insulated
shield wires over the erection of a line without SWS.
At the sending substation, the equipment for energizing the shield wire are not very dissimilar from that required
for energizing the conventional MV line. The primary difference is the requirement of an interposing transformer
the cost of which does not exceed US$20,000 and does not make a significant change to the cost of the
substation arrangements. The cost at the sending substation, therefore, remains essentially the same. There
are, however, substantial savings from using SWS instead of a conventional MV line to supply towns.
The SWS has cost advantages in the operational phase as well. The first amongst these is the saving in
maintenance cost. The maintenance responsibility for the shield wire does not increase perceptibly as the
transmission company would have had to undertake virtually the same maintenance activities in the absence
of the SWS service. In the Ghana set-up the feeder arrangement for energizing the MV line or shield wire
is, in any case, the responsibility of the transmission utility not the distribution entity. So, there is no impact on
either of them.
Secondly, there is no requirement for the maintenance of a second right-of-way since SWS is implemented
using the same transmission towers. As regards maintenance, therefore, the SWS essentially eliminates all
sub-transmission maintenance costs for the distribution utility. In addition to all the above, the larger than
normal size of conductor used for the SWS tends to lower sub-transmission losses. This is another source of
savings.
Table 2.1: Typical Construction Cost of 34.5 kV line in US$ per km
MV Line SWS Comment
Acquisition of Right-of-way Variable - Depends on local conditions
Survey and Civil Works 4,500 -
Steel Lattice Towers 7,500 750 Increase in erection only
Conductors 10,000 -
Insulators 2,500 3,000
Accessories 500 -
Total cost per km 25,000 3,750 Saving = 85 percent

25
The net result of all these changes is a saving that amounts to approximately 85 percent of the conventional
sub-transmission line.
Limitations and challenges
The design of each SWS application is, however, complicated by the earth-return of current, the voltage
balancing needs and the interaction with the HV power circuit below. While the operation of SWS is simple
and can be performed by regular distribution utility personnel, it is recommended that the design of each
SWS application is undertaken or at least supervised by professionals with the required experience and
expertise.
The load-carrying capacity of the SWS using the smaller 76 sq mm ACSR shield wire is in excess of 9 MW.
The load-carrying capacity at a distance of 100 km is about 4 MW. It has been computed that at the extreme
distance of about 150 km from the sending substation, the capacity of the SWS is limited to about 3 MW.
These capacities have turned out to be more than adequate for its implementation in Ghana.
The main concern of potential consumers in the initial period was about the single-phase supply. As noted
earlier, single-phase supply is possible where there is one solitary shield wire on the transmission tower. The
complaint against single-phase supply has been found to be only valid in the exceptional cases where
consumers desire or require using motors of capacity greater than 50 kW. For the majority of users in the
rural setting, the single-phase supply presents no limitation.
The dual use of the shield wire for power transfer at the same time as it performs the lightning protection
role requires the insulators that are used for SWS to have arcing horns. The accurate setting of the arcing
horn gap has been found to be critical for the satisfactory performance of the lightning protection function.
During the installation phase, therefore, particular attention has to be paid by the contractor to ensure that
the arcing horn gap is set accurately.
SUGGESTED LOW-COST METHODS


This study has confirmed that power utilities and technical experts in Uganda, Tanzania, Mozambique and
Zambia are interested in low-cost methods that would reduce the costs of networks. It has also confirmed
that proven low-cost methods are available which would significantly reduce both capital and variable costs.
In particular, the use of such methods has, inter alia, enabled Ghana and Tunisia to successfully increase
electricity access in rural areas.
However, it is also clear that in the four countries covered in this study, so far there have been no systematic
efforts to introduce and mainstream low-cost methods in electricity networks. This situation prevails in these
countries even though there are well-proven techniques and approaches readily available for this purpose,
and these countries have received substantial donor assistance in their electrification efforts. Further, it is
likely that a similar situation prevails in many other sub-Saharan African countries.
One of the barriers to these low-cost innovations is the lack of knowledge. This can be readily rectified by
studies such as this, and other forums for disseminating the relevant information. However, this would still
leave in place two key barriers: lack of capacity to undertake the required engineering analysis and work,
and lack of a systematic framework for planning and designing cost-effective networks. The mitigation of
these barriers requires capacity-building as well as a significant change in the managerial and operational
culture of the utilities.
27
3. Conclusion


Annex 1
Mainstreaming Low-costInnovations in Electricity Distribution
Erik Fernstrom
Submitted to:Arun P SanghviAfrica Energy UnitWorld Bank, Washington, DC


Many African countries have inherited European standards for their distribution networks; standards that
were adapted for high-density, high-demand centers in continental Europe. When applied in the rural areas
of Africa, this has often resulted in poorly adapted oversized networks carrying unnecessary high costs for
connecting rural loads. This report compiles some of the proven methods and technologies employed in
successful schemes, such as the Tunisian and South African rural electrification programs. Comparing these
outcomes with existing body of research on the topic, we have found three major pillars that seem to be the
key to the success in drastically reducing electrification program costs. These are:
• Network forecasting and optimization;
• “Appropriate Engineering”; and
• Low-cost network technologies.
Network Forecasting and Optimization
Many examples show that load forecasts are often too optimistic about load growth in rural areas, leading
to oversized and expensive systems that stand largely unused. When sizing the network there is, therefore,
a need to arrive at a credible maximum load for the community for the short-, mid- and long-term views.
Indicators should be carefully developed based on statistics regarding simultaneous peak usage and the
purchasing power of the clients i.e., what percentage are likely to use appliances such as cooking plates,
fans and refrigerators.
One suitable indicator to establish is the ADMD a measure of forecasted peak network load per consumer.
With a well-calculated ADMD and a flexible network design, the utility can minimize the initial capital
expenditure and still have possibilities for easy upgrade if and when load increases beyond the designed
network capacity. ADMD for rural load clusters in Africa are often below 0.4 kVA per consumer compared
to current practices at many utilities with double up to five times the amount steering design dimensions and
the subsequent investment costs. Designing networks according to these more realistic targets lets utilities
drastically reduce size of conductors, transformers, etc, leading to instant savings.
1. Executive Summary
31

SUB-SAHARAN AFRICA: INTRODUCING LOW-COST METHODS IN ELECTRICITY DISTRIBUTION NETWORKS
32
“Appropriate Engineering”
When choosing individual components for a low-cost network, the most important thing to embrace is a
holistic approach to savings. The cost savings does not come from a single quantum leap but from looking
at the entire network investments from the MV lines taking power into the region through the transformer
tap-offs and LV house connections continuing all the way through the house perimeter including metering,
fuses, switches, house wiring and even, in some cases, the choice of appliances. The attitude must be to
present in each detail an “appropriate” choice stemming from the earlier mentioned load forecast and
move away from “business-as-usual” type decisions leading to overspecified components for the use intended.
A summary of the chapter conclusions from the report with key technical choices to be considered in the
network design stage is given below:
• Conductor and Line Voltage: Use of thinner high strength conductors-type Aluminum Conductors
Steel Reinforced (ACSR) can increase span lengths and cut cost for conductors considerably. Higher
voltage MV lines, e.g., 22 kV should be considered in order to reduce technical losses.
• Poles: Use of wood as pole material is preferable, especially if national and/or regional sustainable
wood resources are available.
• Transformers: Transformers should be carefully selected taking into account the density of load and
the cyclic load pattern. Smaller single-phase transformers, preferably locally manufactured, should
be used where loads are scattered or small. This increases the number of viable consumer connections
at the same time as it allows for the LV connection to be minimized resulting in lower losses and less
chance for illegal tapping of the line.
• Meters: Unmetered load limited supplies are the lowest cost option for rural clients with low power
usage (below 100 kWh per month) but have drawbacks when it comes to some objectives of
electrification like development of productive uses for increased rural income. In cases where meter
reading and bill collection are costly and difficult as well as when the clients are not used to electricity
consumption and operate on a tight budget, prepaid metering is an attractive alternative.
• Ready Board: Costs and safety issues associated with house wiring can be drastically reduced by the
use of “ready boards”, a low-cost distribution board encapsulating in one boxed unit all functions that
are normally included in a wired house as light sockets, outlets and possibly a prepayment meter.
Low-cost Network Technologies
Besides optimizing the choice of components in the network, there are fundamental technological choices to
be made which, in themselves, can reduce electrification costs by considerable amounts. Single and bi-
phase techniques are now well-tested and applied in many different countries and environments. These
techniques reduce the number of conductors used for the line, resulting in savings in virtually all components
associated with power transfer. The major single-phase alternatives are Single Phase with Conductor Neutral,
SWER and SWS.

33
SWER is deemed the lowest cost option to service smaller rural loads in areas with suitable earthing
characteristics and should be the technological starting point for most rural extensions where loads are likely
to be small. It distributes single-phase MV power on one single line with current returning through earth,
enabling long single line spans with minimal pole-top hardware.
Single Phase with Conductor Neutral is the costliest of the three single-phase designs but can still offer
savings of 30-50 percent compared to many three-phase standards. It can carry higher loads than the
SWER-based systems and can easily be upgraded to a bi-phase system and further into a three-phase
system with an added conductor. This makes it ideal for many African communities where initial demand
are considerably lower than the long-term forecasts.
SWS is suitable for distribution of power to villages close to a planned transmission line. The design uses
single-phase technique for power delivery over the one or two shield wires found on top of each transmission
tower originally put there as protection against lightning strikes.
Indicators and Benchmarks for Low-cost Networks
Finally, what can be expected as a target for a low-cost reticulation program?
An often-used measure of low-cost design implementation is the percentage of realized savings compared
to the old three-phase standards earlier implemented in the country. The following forecasts based on a
technology portfolio of largely similar content to many sub-Saharan African countries:
• MV Grid Extensions: The recommendation of a cost reduction of 25 percent to 40 percent includes
utilization of SWER where possible, two-wire single-phase metallic return and low-cost three-wire
three-phase systems.
• Shield Wire Systems: Further reduction of 30 percent to 50 percent in locations along transmission
routes where suitable shield wire schemes are available.
• Low-voltage Network Construction: Cost reduction of 15 percent to 25 percent
• Consumer Connections: Cost reduction of 15 percent to 25 percent by utilizing suitable meter
systems and ready boards
• Operations and Maintenance: Cost reduction of 10 percent to 20 percent
Both the Tunisian and South African rural electrification programs have documented overall cost savings
of 20-30 percent compared to similar network investments and consumer connection costs under old
standards, well in line with the above estimations. There is no reason why these figures should not be valid
for replication in other African countries if the programs are correctly adapted to local needs and demands.
It will, however, take a strong commitment from all parties involved and a continuous cost-cutting effort
during several years in order to achieve lasting success.
ANNEX 1: EXECUTIVE SUMMARY


One of the contributing factors to the slow growth rates in Africa is the lacking infrastructure in the rural
areas. Surveys show that less than 10 percent of all households have access to electricity services and that
many electrification programs struggle to keep pace even with the growth in households demanding connection
to the grid in already electrified areas.
One key obstacle to increasing rural access to electrified services are the high investment costs associated
with rural electrification. A combination of high costs and non-cost-reflective electricity tariffs leads to the
inability of utilities and other service providers to increase access to consumers who often have both the
need and the ability to pay for services. This report looks at the cost side of this equation and existing
research available to solve some of the investment-related constraints on rural electrification.
Many African countries have inherited European standards for their distribution networks, standards which
were adapted for high-density, high-demand centers in continental Europe. This has, often, resulted in
oversized networks with unnecessary high costs for connecting rural loads. In spite of these problems, some
countries in Africa, especially Tunisia and South Africa, have been addressing these issues through an active
pursuit of measures to decrease costs per rural connection and, in the process, developing their own locally
adapted low-cost standards.
ESMAP has granted funds to the Africa Energy Unit (AFTEG) to help mainstream these and other innovative,
low-cost methods developed around the world in five African countries – Uganda, Tanzania, Swaziland,
Mozambique and Zambia. These countries are already on the verge of implementing large-scale electrification
programs supported by the World Bank, in which cost reductions are a key feature. This program will
support this effort by disseminating knowledge about the technical breakthroughs around the world regarding
cost reduction as well as the measures needed in network management, maintenance and legislation to
make it happen. Initially, the effort will focus on just a few innovative concepts, with concrete steps taken to
facilitate their implementation in actual projects.
This initial report will explore the existing techniques and best practice examples from studies and projects
around the world. Later, the project team, in cooperation with stakeholders in the five countries, will discuss,
adapt and implement these techniques and practices fitting them to local needs.
2. Background and Objective
35


This study of existing knowledge in low-cost reticulation and design has been made using the sources listed
in the literature section. The aim of the study has been to determine the type of low-cost design technologies
and experiences available and directly applicable to the five countries included in the main study. This task
will be followed by field-based research determining actual status of the national electrification programs
and the relevance of the techniques and methods described in the report.
Projects and Best Practices are examined in two main chapters of the report:
Low-cost Design – Part 1
Summaries of Bank and non-Bank reports on (i) general cost savings possible on material and management
of the existing network, (ii) cost savings through new designs for power distribution including single-phase,
SWER and SWS techniques.
Case Studies – Part 2
Best practice examples from the Africa region referring to the topics discussed in Part 1.
• Tunisia: Single-phase, SWER and network management examples
• South Africa: The National Electrification Program (NEP) encompassing innovations in consumer
connections, load forecasting and network management.
• Ghana: A study of the successful use of SWS techniques in rural distribution systems.
3. Approach
37


During the course of the assignment more than 30 reports and papers on low-cost designs and experiences
have been studied. The emphasis has been to find suitable designs applicable both for rural and peri-urban
electrification. Some of the solutions presented are, however, more suitable for rural low-cost design when
carrying smaller loads over longer distances.
A full list of the literature applied can be found in the last chapter: below are the key documents recommended
for further reading.
Key Literature
Grid electrification
Inversin, Allen R.: Reducing the Cost of Grid Extension for Rural Electrification. ESMAP Report 227/00,
2000.
Report concerning factors that affect cost of distribution networks prepared by NRECA Int’l., experiences
and advice based on low-cost initiatives from mainly North and South America and Bangladesh.
Tulloch, J.: Low-cost Systems for Distribution, Paper prepared for EDM Mozambique, 2000.
Includes general least-cost examples and information as well as a thorough analysis of implementation
possibilities of shield wire techniques and SWER in Mozambique.
Consumer connections
Smith, Nigel: Low-cost Electrification – Affordable Electricity Installation for Low-income Households in
Developing Countries. Working Paper, Intermediate Technology Publications, 1998.
An in-depth look at how costs of consumer connections could be minimized through community involvement,
new technology and reduced installation costs.
4. Literature and Studies
39

SUB-SAHARAN AFRICA: INTRODUCING LOW-COST METHODS IN ELECTRICITY DISTRIBUTION NETWORKS
40
Management of low-cost initiatives
Barnes, Douglas and Foley, Gerald: Meeting the Challenge of Rural Electrification in Developing Nations –
The Experience of Successful Programs, ESMAP, 2003.
Management of rural electrification efforts. A thorough description of nine countries with an impressive
rural electrification record. Details, background and the institutional models that provided the basis for
successful implementation.

41
Successful, viable and sustainable electrification is urgently required throughout all of Africa. Most countries
in the continent provide access to electricity for less than 10 percent of their population. It truly is the “dark”
continent. The techniques indicated below have been tried and implemented by many different utilities and
it is clear that there is no “one-size-fits all” plan that can be applied in every situation. Rather, the optimal
route lies in understanding the options that are available and applying them in the best possible way to
achieve a sustainable and viable result. The techniques are not prescriptive. Innovation, adaptation and
willingness to try new ideas are the key to success.
Management of Low-cost Initiatives
Looking at the documented experiences of rural electrification schemes in many developing countries, it is
clear that there is not one single institutional set-up that can be said to be especially conducive to low-cost
initiatives. Common factors in all successful cases seem to be: (i) a strong political commitment; (ii) economic
resources available; (iii) a dedicated executing agency; and (iv) defined targets to be met by the executing
agency and involved ministries and authorities. Douglas Barnes and Gerald Foley distill the common factors
of successful programs into the following points (Barnes, 2003)
• Setting up Effective Dedicated Institutional Structures
There is a need for a high degree of operating autonomy for the implementing agency paired with
some clear targets and responsibilities. The importance of the agency’s management team and
commitment of its staff also seem to be a deciding factor in creating a sense of positive spirit and
commitment to taking part in the development effort.
• Dealing with the Political Dimension
Experience shows that political interference in electrification programs can be highly damaging if this
leads the implementation agency away from transparent rules for the electrification decisions. It also
has an adverse effect on staff morale since logical and professional decisions have to take a back-seat
to politically motivated ones.
• Selecting Suitable Areas
To reap the benefits of the electrification effort, there needs to be basic, transparent criteria for areas
which are deemed to be suitable for electrification. Areas that have neither the household income nor
the commercial activities to pay for the operational costs of the service will end up hampering the utility
5. Low-cost Design

SUB-SAHARAN AFRICA: INTRODUCING LOW-COST METHODS IN ELECTRICITY DISTRIBUTION NETWORKS
42
and reduce sustainability. Experience shows that successful programs have clear criteria for ranking
and order of villages and communities to be electrified that are simple to understand for consumers,
municipalities and regional authorities. This creates a pipeline of future connections where the more
viable regions are connected first, creating a consumer and capital base for further extensions to less
viable segments of the market.
• Importance of Cost Recovery
The importance of cost recovery of operational costs cannot be overstated. In cases where subsidies
enable regions to be electrified which cannot carry the operational costs long-term, the rate of future
electrification suffers since, for each additional connection, the losses will increase for the service
provider. This is the situation in many African countries where the national tariffs are so low that rural
electrification becomes a losing business even when all the investment costs are covered, resulting in
low motivation within the utility management to drive an ambitious electrification scheme.
• Charging the Right Price for Electricity
There is a perception that electricity is unaffordable for rural consumers and, consequently, tariffs
have to be kept extremely low. However, in many cases, the costs for alternative energy sources are
on par or above the real costs of an electricity supply.
• Low Barriers to Connections
The main barrier to connection in rural communities is, thus, not the recurring costs but the high
connection costs charged by the service provider. There are examples where utilities that offered
repayment schemes for the connection costs over five years managed to double their client base
immediately while maintaining cost-reflective tariffs.
• Community Involvement
Rural electrification planning and selection needs to be an integral part of the community planning and
prioritization process. Communities in successful programs are instrumental in helping to access demands,
educating and encouraging new users and improving payment recovery levels.
• Reducing Construction and Operating Costs
In order to enable more rural clients to connect and pay for full operating costs of their service, the
costs for connections and operation need to be kept at an absolute minimum. In many cases, potential
savings in construction costs compared to outdated national standards amount to over 30 percent (in
some cases over 50 percent).
Network Forecasting and Optimization
“Appropriate Engineering” refers to an overall view of the distribution network plan and the best and most
efficient ways of bringing the clients a service that they can use without oversizing the network and suffering
higher costs than needed.
When deciding on network design and technological options for supply to a specific village, there are
several factors to consider. Eskom, the South African electricity supply company, outlines a number of these
in a recent report (Crowdy, 2001):

43
Choosing Suitable Communities
• The position of each dwelling or cluster of clients;
• The position of schools and clinics;
• Estimated income, mean range and source;
• Lifestyle;
• Availability of water;
• Proximity of towns, industries and commercial centers; and
• Initial estimated percentage of connections and future estimated number of connections.
Choosing Suitable Technology
• Potential of development of load and usage;
• Voltage level, initial, final and upgrade path;
• Operation and Maintenance (O&M) requirements;
• Spares requirements;
• Earthing and protection requirements; and
• Loss profile.
In choosing suitable technologies, a more commercial aspect needs to be taken into consideration. Does the
utility plan to connect all consumers on a blanket electrification approach or connect only the ones paying
connection fees/or requesting the service in other ways – what we might call a market-driven approach.
Two key factors to be developed based on data from the above categories are estimates of affordability of
the proposed households and the forecasted load that these new consumers can be expected to draw from
the network. Some recent findings in reports and studies regarding these important considerations are
discussed below.
Affordability
Regarding affordability, there are two pervasive misconceptions. The first is that urban and rural poor
cannot afford an electricity supply; they will not pay for it. The second is that it is obviously wasteful and a
poor investment for any utility to indulge in such social engineering.
Facts contradict these perceptions. Poor people still spend money on energy. In fact, their energy budget is
a significant portion of their disposable income. Most common forms of energy purchases are candles and
kerosene for lighting, wood, charcoal or coal for cooking (and space heating in cold climes) with kerosene
as a starter fuel, dry cell batteries for radios and sometimes car batteries for TV. A survey of salaried
ANNEX 1: LOW-COST DESIGN
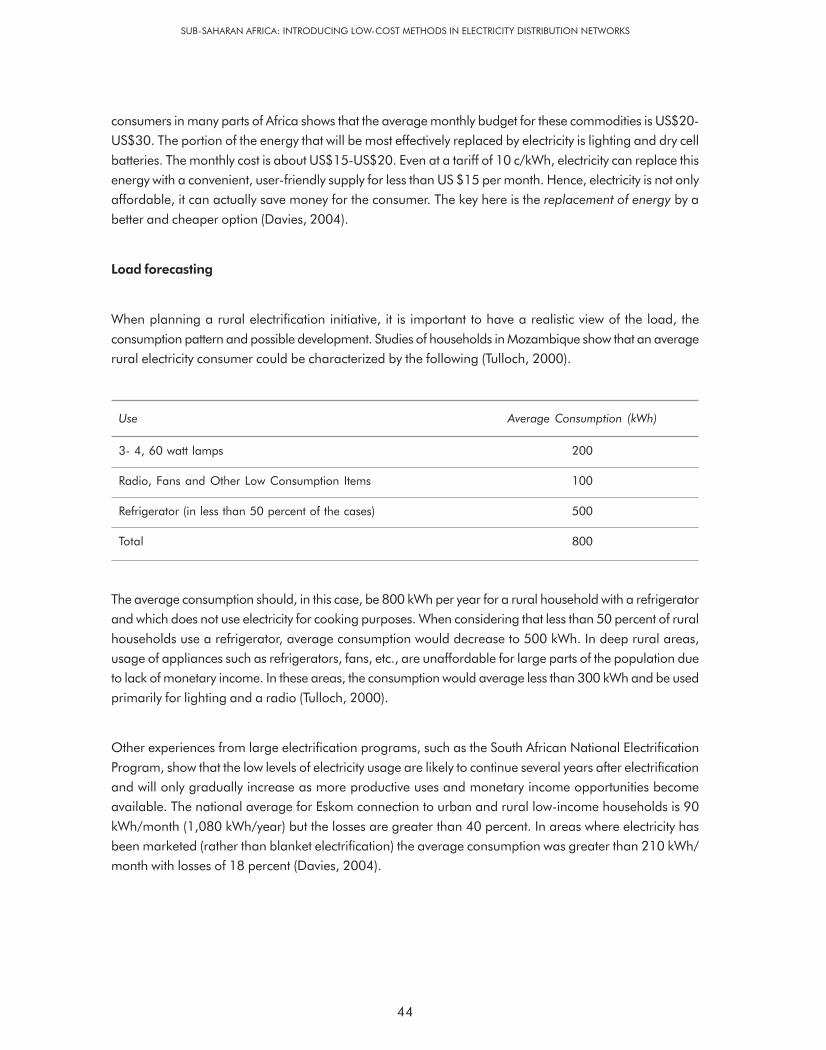
SUB-SAHARAN AFRICA: INTRODUCING LOW-COST METHODS IN ELECTRICITY DISTRIBUTION NETWORKS
44
consumers in many parts of Africa shows that the average monthly budget for these commodities is US$20-
US$30. The portion of the energy that will be most effectively replaced by electricity is lighting and dry cell
batteries. The monthly cost is about US$15-US$20. Even at a tariff of 10 c/kWh, electricity can replace this
energy with a convenient, user-friendly supply for less than US $15 per month. Hence, electricity is not only
affordable, it can actually save money for the consumer. The key here is the replacement of energy by a
better and cheaper option (Davies, 2004).
Load forecasting
When planning a rural electrification initiative, it is important to have a realistic view of the load, the
consumption pattern and possible development. Studies of households in Mozambique show that an average
rural electricity consumer could be characterized by the following (Tulloch, 2000).
Use Average Consumption (kWh)
3- 4, 60 watt lamps 200
Radio, Fans and Other Low Consumption Items 100
Refrigerator (in less than 50 percent of the cases) 500
Total 800
The average consumption should, in this case, be 800 kWh per year for a rural household with a refrigerator
and which does not use electricity for cooking purposes. When considering that less than 50 percent of rural
households use a refrigerator, average consumption would decrease to 500 kWh. In deep rural areas,
usage of appliances such as refrigerators, fans, etc., are unaffordable for large parts of the population due
to lack of monetary income. In these areas, the consumption would average less than 300 kWh and be used
primarily for lighting and a radio (Tulloch, 2000).
Other experiences from large electrification programs, such as the South African National Electrification
Program, show that the low levels of electricity usage are likely to continue several years after electrification
and will only gradually increase as more productive uses and monetary income opportunities become
available. The national average for Eskom connection to urban and rural low-income households is 90
kWh/month (1,080 kWh/year) but the losses are greater than 40 percent. In areas where electricity has
been marketed (rather than blanket electrification) the average consumption was greater than 210 kWh/
month with losses of 18 percent (Davies, 2004).

45
Rural power demand varies significantly over the day and between income groups. In a detailed study of
few rural Ugandan villages a distinction was made among four categories: the “low” case having an
average of 200 W, the “middle” 280 W, the “middle-high” 400 W, and the “high” about 620 W. Their
energy consumption shows large similarities in load pattern over the day, with the peak demand around
8:00 pm being normally 3.5 times higher than the estimated daily average. The distinction between the
different clusters is more evident during off-peak hours when the “low” consumption cluster almost reaches
zero consumption compared to the “high” cluster that uses refrigerators and other appliances that spread
the load evenly over the day (Sprei, 2002).
Country Electric Power Consumption (kWh/capita/month)
Kenya 106
Mozambique 57
Nigeria 81
Tanzania 57
Low-income Country World Average 307
Source: World Bank Development Indicators, 2000.
So how can these findings be implemented in the utility planning of the electrification effort? One governing
factor for system design is the ADMD, defined as the highest demand experienced when measured over a
large number of consumers (Crowdy et al, 2001). For an average rural village of 100 consumers, there
are both diversity factors affecting the likely output in each house (number of lights on at the same time,
refrigerator compressor running 25 percent of the time) as well as diversity between the timing of these
incidents of load between households. A calculation made for Mozambique shows that an average
700 W individual peak load could be estimated to as low as an ADMD of 200 W. Using a carefully
calculated ADMD, the network can therefore be designed for a lower load than a simple aggregation of
peak loads (Tulloch, 2000).
To ensure that the ADMD will not be significantly exceeded and the network damaged by unplanned events,
there is a need for load limited supplies or similar measures to a segment of the population. In South Africa,
the lower-end consumers are offered a limited 2.5 Amp supply which ensures the ADMD forecasted there
can be kept at 400 VA. Loads that do not add in a significant way to the ADMD are institutions operating
mostly during off-peak hours like schools and clinics, which use energy for classrooms and check-ups in the
daytime, and for emergencies during off-peak night-time.
When a suitable ADMD has been calculated there is a need to look at the forecast for the lifetime of the
network. ADMD figures should be estimated both for the short-term, say five years into operation, as well as
for the long-term, with sustainable short-to-medium term ADMD valid for at least 20 years. In many cases,
a detailed load forecast for remote rural areas can be difficult to make. In a recent Uganda study by Eskom,
ANNEX 1: LOW-COST DESIGN

SUB-SAHARAN AFRICA: INTRODUCING LOW-COST METHODS IN ELECTRICITY DISTRIBUTION NETWORKS
46
a steady load increase of either two percentage points or a constant kVA value (suggested 2 kVA per 100
kVA) is recommended.
In the absence of even elementary data to base the forecast on, default ADMD figures for rural communities
with limited productive activities that need electricity supply could be estimated to (Crowdy, 2001):
• Initial (five-year design); and 0.4 kVA
• Final (15-year design). 1.0 kVA
Summary and conclusions
• Affordability of electricity supplies is often underestimated and must be compared with whathouseholds use for alternative energy sources.
• When sizing the network, there is a need to look at a credible maximum load, based on thelikeliness of simultaneous peak usage and the purchasing power of the clients in using appliances,such as cooking plates, fans and refrigerators.
• ADMD should be used as a measure of design criteria and load forecasts. An estimated initialADMD for rural load clusters is often below 0.4 kVA.
The difference between the long-term ADMD and the initial figure enables the utility to design for full
development but scale down initial investments to fit the lower initial demand, thus optimizing the value of its
resources.
“Appropriate Engineering”
Poles
Looking at the total cost of the distribution line, poles can often account for 25 percent to 40 percent of the
total cost (Inversin, 1999). Reducing this item is therefore key to the overall success of the low-cost design.
Since poles are a part of the long-term investments in the network, it’s important not to reduce investment
costs on poles at the expense of quality and expected service time. Over-ambitious savings in pole design
can have the following effects (NRECA, 1999):
• A greater safety hazard for the population, as weaker poles are more likely to fall under stress or in
severe weather conditions.
• A shorter life, which implies a higher life cycle cost when poles need to be replaced earlier than they
would need with correct dimensioning.
Poles are mainly constructed out of three different materials – wood, concrete and steel. There is no
material that is a clear winner in all circumstances but generally wood poles have a cost advantage in rural
applications when suitable wood resources are ready available (Inversin, 2000).

47
Considering the location of the five countries included in the study, steel or concrete poles will not be further
explored in this report. These and other materials can be a viable solution for rural distribution when treated
wood poles are not available.
Wood poles
Where an indigenous supply of low-cost environmentally sustainable timber is available, the use of wood
poles in rural construction is favored. When domestically produced poles are not available, the choice can
become interesting; especially in an African context, where low-cost poles can be supplied from regional
manufacturers. If a suitable and sustainable wood resource is not available in the region, other locally
available materials like concrete poles should be carefully weighed against the high costs of long distance
transport.
Wood poles have several key advantages (Tulloch, 2000):
• The foremost of these is that transport and construction are much easier where access to mechanical
pole handling equipment is limited;
• The poles are also more tolerant to mishandling and easier to work with;
• Structurally, the poles are more tolerant to extreme conditions and have advantages in increasing
lighting impulse levels in lightning-prone areas;
• Supports local employment. Local plantations permit self-sufficiency in the production of one of the
costliest components of an RE program, thus creating employment, reducing the need for foreign
exchange and lowering the cost of RE;
• Not adversely affected by corrosive environments such as coastal zones; and
• Possibility for local communities to grow and supply poles to the electrification scheme and, thereby,
reduce the cost of connection (Inversin, 1999).
Increasing forest cover for pole production in marginal areas can produce numerous environmental benefits,
including reduced erosion of land and sedimentation that leads to the destruction of riverine habitats,
improved groundwater quality and quantity, more abundant and diverse wildlife, and, opportunities for
increased employment from processing a range of forest products (Inversin, 1999).
The major disadvantages are:
• Deterioration due to rot or termite attack requiring higher level of ongoing maintenance. (Possible to
reduce in termite-infested areas through better impregnation and application of a polyethylene sleeve
to the base.)
• Consistency in preservation techniques.
• Quality control to ensure the poles are capable of design loads.
ANNEX 1: LOW-COST DESIGN

SUB-SAHARAN AFRICA: INTRODUCING LOW-COST METHODS IN ELECTRICITY DISTRIBUTION NETWORKS
48
Pole height
In many countries, pole heights are considerably longer than necessary. For example, Bangladesh uses
12 m poles for applications where India under the same circumstances and voltage levels makes do with 8
meter poles (Inversin, 1999). Reducing the height of the poles also enables a smaller girth which reduces
the overall volume and cost of the pole even further. Often, the national norms of pole height are outdated
legacies to allow provision for telephone or telegraph lines etc. With the rapid development of mobile
phone networks in African countries the need for fixed telephone lines and sharing of distribution networks
is now, in many places, a thing of the past. Instead, the following criteria should be considered for an
optimal pole length (Inversin, 1999).
Clearance requirements to protect line, vehicles and people
Standards in the US suggest that a suitable clearance for areas affected by vehicular traffic should be in the
range of 5 m for bare conductor and 4.7 m for neutral conductor. In areas, where only pedestrians have
access, a mere 3.8 m and 2.9 m is needed for bare and neutral conductors respectively. In Africa, where
most networks are running on 230 V instead of the US 230 V and many roadside lines can be crossed by
trucks and lorries almost anywhere, the clearances need to be more generous. Minimum heights in Southern
Africa are shown in the Table A 1.1 (Davies, 2004):
Table A 1.1: Minimum Clearance Heights in Southern Africa
Poles ProposedPermitted Clearances (mm) Pole
11 kV From Top of Pole 150
Between Phases 450
Over a Road 6,300
In a Town 5,500
In Country 5,100
415 volts From 11 kV 800
Between Phases 250
Over a Road 6,100
In a Town 5,500
In Country 4,900
Sag (Allow) 300

49
Poles ProposedPermitted Clearances (mm) Pole
Pole Planting Depth (max) 1,200
Examples
Country 3 Phase 11 kV 7,650 8
Town 3 Phase 11 kV 8,050
Over Road 3 Phase 11 kV 8,850 9
Country 3 Phase 11 kV +3p LV 9,000 9.5
Town 3 Phase 11 kV +3p LV 9,600
Over Road 3 Phase 11 kV +3p LV 10,200 10.5
Country 1 Phase LV 6,800 7
Country 3 Phase LV 7,300 7.5
• Foundation Depth Required to Ensure a Stable Structure
For US rural electrification systems, a rule of thumb is 0.6 m plus 10 percent of the total length of the pole
• Sag Required to keep Conductor Tension Within Limits
In many western standards, the maximum tension allowed is kept as low as 35 percent of the maximum
tension of the line. In the African context, where snow and ice are not likely to occur, the design factor
could be increased to about 60 percent of the calculated ultimate strength. This allows for shorter
poles or longer spans than the equivalent developed world standards.
• Top-to-bottom Insulator/Conductor Spacing
Standards for spacing can often be outdated when new, stronger lines are introduced that allow higher
tensions.
Span lengths
In addition to using the right pole height and material, the line span has an immediate effect on the number
of poles used per km. Factors in this equation are the height of each pole, the desired line-to-ground and
line-line clearance as well as the voltage transmitted (Inversin 1999).
ANNEX 1: LOW-COST DESIGN

SUB-SAHARAN AFRICA: INTRODUCING LOW-COST METHODS IN ELECTRICITY DISTRIBUTION NETWORKS
50
Often these optimal characteristics have, in reality, given way to other considerations, such as ease of
implementation in terrain, or the need to follow winding roads, etc. Comparisons show that in many countries
these considerations have affected the overall standard which means that in cases where a much longer
span length of 130-150 m is possible, the utility is still adhering to the shorter, more convenient 60-90 m
span lengths that are more generally applicable, thus increasing the price per km by up to 30 percent.
Changes in network philosophy to further increase span lengths by the use of single-phase and SWER will be
described in later chapters.
Summary and conclusions
• Use of wood as pole material is preferable, especially if national and/or regional wood resourcesare available.
• There needs to be a careful optimization of the pole length/span ratio for rural electrificationtaking into account the different clearance needed for roads and areas with only pedestrianaccess.
• Remaining old or outdated standards need to be revised to fully reflect new technology andmaterials as well as changed use of distribution lines for other purposes.
Line material
Conductor
Besides the poles, the conductor normally represents the second costliest component in the distribution
system (Inversin, 1999). The main material for overhead conductors is copper or aluminum alloy, but in
some cases steel has been used. Often utilities are experiencing higher costs than necessary because of
oversizing of the conductors compared to the demand of the particular distribution line. There are a number
of points to be taken into consideration when determining the correct type and size of conductors. These
are:
• Load Forecast for Region Served
How much power can realistically be supplied to the community in the lifetime of the line? Indicators
like ADMD, used to forecast loads in communities, should be used to select a conductor suitable to the
load. Can load management even out peaks in the demand cycle?
• Distribution Voltage
By increasing the distribution voltage to higher levels, thinner lines as well as longer distances can be
served with maintained losses. For MV, an increase of up to 22 kV is often possible without larger
increases in the price of equipment. For higher voltages, a careful weighing of the pros and cons of
savings against the drastically increased equipment costs has to be made.
• Mechanical Constraints
For lightly loaded lines, such as those found in many rural distribution networks, the choice of conductor-
type is governed by the need for adequate mechanical strength, i.e., strength in tension. This, paired
with point one, may also shift the decision regarding design philosophy since an electrically less-than-
optimal solution could end up the least-cost, based on mechanical characteristics (Inversin 1999).
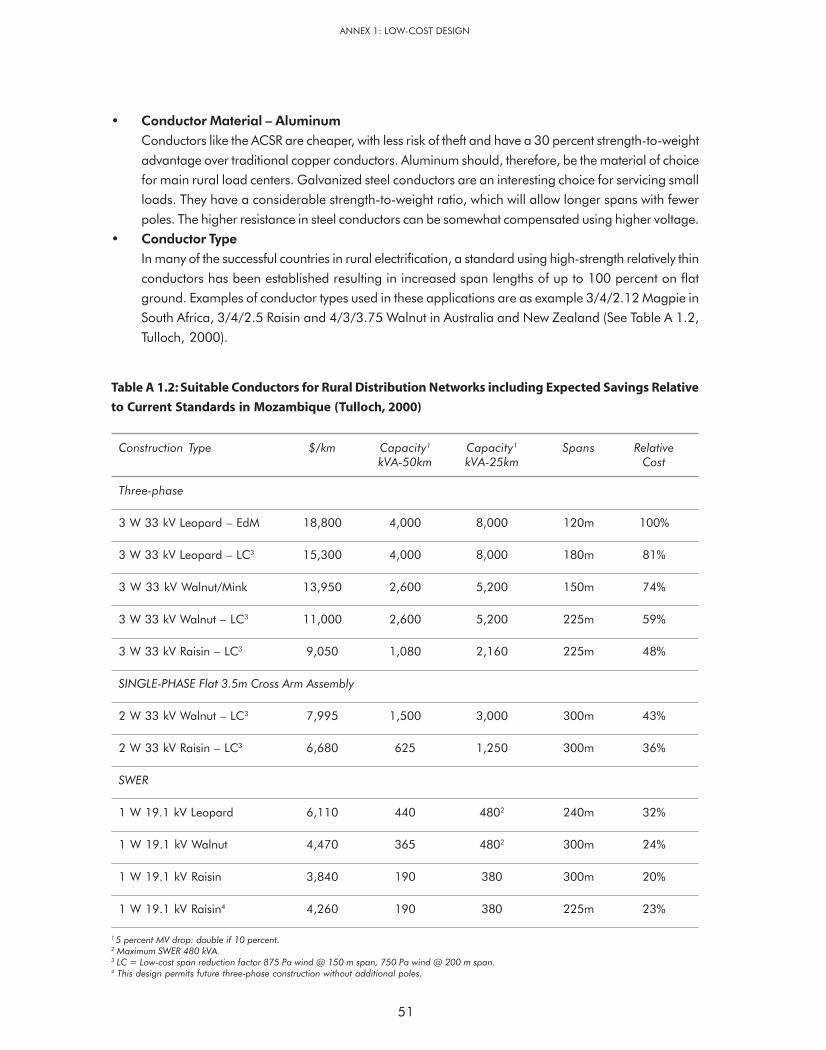
51
• Conductor Material – Aluminum
Conductors like the ACSR are cheaper, with less risk of theft and have a 30 percent strength-to-weight
advantage over traditional copper conductors. Aluminum should, therefore, be the material of choice
for main rural load centers. Galvanized steel conductors are an interesting choice for servicing small
loads. They have a considerable strength-to-weight ratio, which will allow longer spans with fewer
poles. The higher resistance in steel conductors can be somewhat compensated using higher voltage.
• Conductor Type
In many of the successful countries in rural electrification, a standard using high-strength relatively thin
conductors has been established resulting in increased span lengths of up to 100 percent on flat
ground. Examples of conductor types used in these applications are as example 3/4/2.12 Magpie in
South Africa, 3/4/2.5 Raisin and 4/3/3.75 Walnut in Australia and New Zealand (See Table A 1.2,
Tulloch, 2000).
Table A 1.2: Suitable Conductors for Rural Distribution Networks including Expected Savings Relative
to Current Standards in Mozambique (Tulloch, 2000)
Construction Type $/km Capacity1 Capacity1 Spans RelativekVA-50km kVA-25km Cost
Three-phase
3 W 33 kV Leopard – EdM 18,800 4,000 8,000 120m 100%
3 W 33 kV Leopard – LC3 15,300 4,000 8,000 180m 81%
3 W 33 kV Walnut/Mink 13,950 2,600 5,200 150m 74%
3 W 33 kV Walnut – LC3 11,000 2,600 5,200 225m 59%
3 W 33 kV Raisin – LC3 9,050 1,080 2,160 225m 48%
SINGLE-PHASE Flat 3.5m Cross Arm Assembly
2 W 33 kV Walnut – LC3 7,995 1,500 3,000 300m 43%
2 W 33 kV Raisin – LC3 6,680 625 1,250 300m 36%
SWER
1 W 19.1 kV Leopard 6,110 440 4802 240m 32%
1 W 19.1 kV Walnut 4,470 365 4802 300m 24%
1 W 19.1 kV Raisin 3,840 190 380 300m 20%
1 W 19.1 kV Raisin4 4,260 190 380 225m 23%
1 5 percent MV drop: double if 10 percent.2 Maximum SWER 480 kVA.3 LC = Low-cost span reduction factor 875 Pa wind @ 150 m span, 750 Pa wind @ 200 m span.4 This design permits future three-phase construction without additional poles.
ANNEX 1: LOW-COST DESIGN

SUB-SAHARAN AFRICA: INTRODUCING LOW-COST METHODS IN ELECTRICITY DISTRIBUTION NETWORKS
52
An important consideration when choosing conductors is the likelihood of corrosion. In industrial areas or
regions close to the sea, the ACSR-type conductor quickly deteriorates due to the chemical reaction between
the galvanized steel reinforcement and the aluminum. An alloy-reinforced conductor AAAC is a better
choice in these areas (the all-aluminum conductor AAC does not have the strength necessary in smaller
dimensions to be used in most rural applications).
Cables
In the base case, cables are a more expensive solution than overhead lines; however, according to some
studies, in special situations, they can end up being the least-cost solution. The cable alternative is especially
interesting under the following circumstances:
• Difficult Environment
In cases with a difficult environment, such as coastal or sandy areas or regions susceptible to severe
storms.
• Free Labor Available
Significant savings in labor costs are possible when local villagers are able to dig the cable trenching
themselves (Larsson et al., 2002).
• Right-of-Way
Overhead lines involve the removal of trees along the right-of-way for the line and the continued
maintenance of the way leave. Underground cables eliminate this (Inversin, 1999).
• Decreased Tampering, Theft
Cable systems are more difficult to use for illegal connections and electricity theft. In addition, if
aluminum-based cables are used, there is no real value in the materials, which eliminates cases
where copper cables are stolen because of the material content.
• Intermediate Voltage
LV cables constructed using PVC insulation are generally used and rated up to 600 V. In fact, PVC is
quite safe for use up to 1100 V and ring feeds operating at this voltage have been used for low power,
rural supplies in some instances.
There are also some disadvantages with cable distribution systems. These are the following:
• Fault-finding and Repair
When faults do occur, they are often difficult to locate and require specialized equipment and training
to repair.
• Upgradability
If the demand in the village served by the cable network increases beyond the capacity of the existing
cable, its costly to increase the capacity, often demanding a new cable in parallel with the old one.
• New Tap-offs
It is very complicated and costly to connect new consumers living along the cable line, if a new joint is
required.
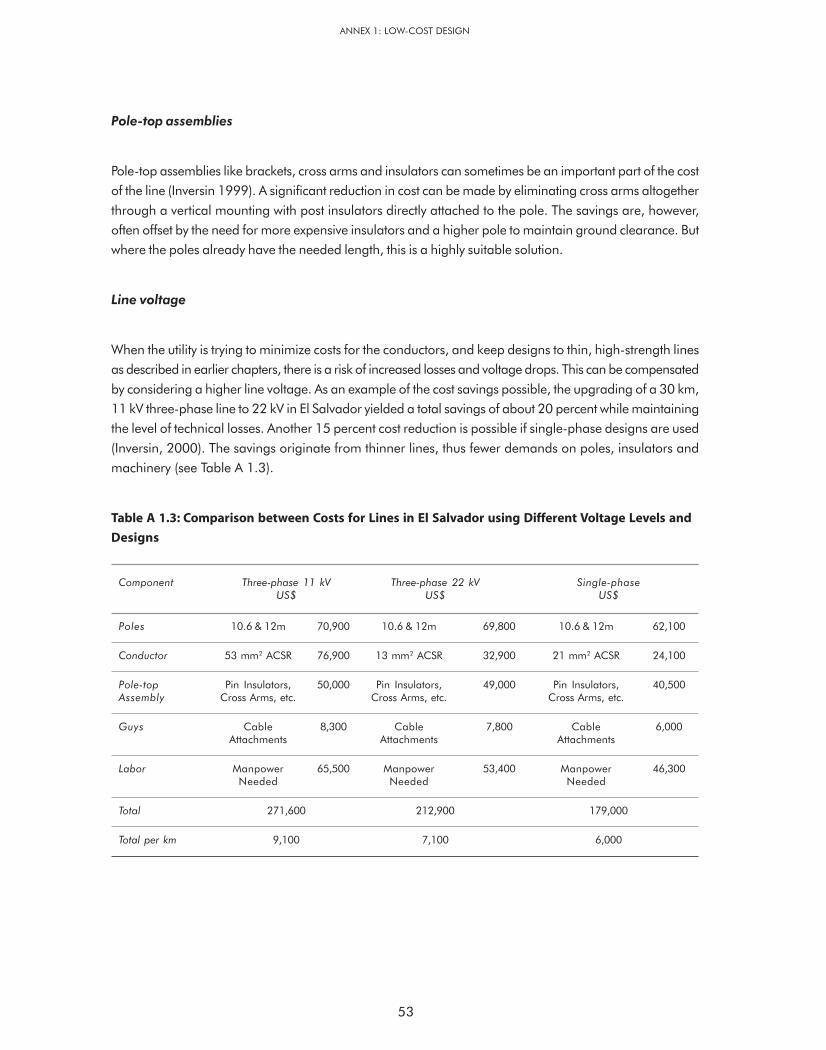
53
Pole-top assemblies
Pole-top assemblies like brackets, cross arms and insulators can sometimes be an important part of the cost
of the line (Inversin 1999). A significant reduction in cost can be made by eliminating cross arms altogether
through a vertical mounting with post insulators directly attached to the pole. The savings are, however,
often offset by the need for more expensive insulators and a higher pole to maintain ground clearance. But
where the poles already have the needed length, this is a highly suitable solution.
Line voltage
When the utility is trying to minimize costs for the conductors, and keep designs to thin, high-strength lines
as described in earlier chapters, there is a risk of increased losses and voltage drops. This can be compensated
by considering a higher line voltage. As an example of the cost savings possible, the upgrading of a 30 km,
11 kV three-phase line to 22 kV in El Salvador yielded a total savings of about 20 percent while maintaining
the level of technical losses. Another 15 percent cost reduction is possible if single-phase designs are used
(Inversin, 2000). The savings originate from thinner lines, thus fewer demands on poles, insulators and
machinery (see Table A 1.3).
Table A 1.3: Comparison between Costs for Lines in El Salvador using Different Voltage Levels and
Designs
Component Three-phase 11 kV Three-phase 22 kV Single-phaseUS$ US$ US$
Poles 10.6 & 12m 70,900 10.6 & 12m 69,800 10.6 & 12m 62,100
Conductor 53 mm2 ACSR 76,900 13 mm2 ACSR 32,900 21 mm2 ACSR 24,100
Pole-top Pin Insulators, 50,000 Pin Insulators, 49,000 Pin Insulators, 40,500Assembly Cross Arms, etc. Cross Arms, etc. Cross Arms, etc.
Guys Cable 8,300 Cable 7,800 Cable 6,000Attachments Attachments Attachments
Labor Manpower 65,500 Manpower 53,400 Manpower 46,300Needed Needed Needed
Total 271,600 212,900 179,000
Total per km 9,100 7,100 6,000
ANNEX 1: LOW-COST DESIGN
SUB-SAHARAN AFRICA: INTRODUCING LOW-COST METHODS IN ELECTRICITY DISTRIBUTION NETWORKS
54
For MV line material and transformers, there are small differences in price between lower MV levels of 6
or 11 kV and the higher 22 kV equipment. On levels above the 24 kV design limit, the equipment tends to
be more advanced and expensive as suppliers generally have to shift to a new product family and the
competition and number of products offered is reduced. A decision to move into MV voltages of 33 kV and
above to save on line material and losses, therefore, has to be carefully weighed against the increased
investments in hardware.
Transformers
From a network point of view, the cost of the distribution transformers is often small in comparison with the
cost of the distribution line. But in cases where the loads are scattered, as in many rural areas of Africa,
each tap-off is shared by few consumers and can, if not designed properly, become a significant barrier to
connection.
There are two key issues in selection of transformer capacity. These are densities of load and the cyclic load
pattern. Density determines the voltage drop limits for the LV distributors, the size of the conductor and the
location of the transformer. The cyclic load pattern looks at the duration of high demand versus the duration
of low demand periods and determines the capacity of the transformer for overload conditions.
In many RE programs, the clusters of consumers and loads are small and rarely suit the characteristics of the
smallest conventional three-phase 25 kVA transformers available in the market. Therefore, it is interesting
to start looking at solutions using single-phase transformers of considerably smaller size. Some RE initiatives
like the Nepal Rural Electrification Program have promoted local manufacturing of small 1 or 2 kVA
distribution transformers that offer the utility and users lower cost both in terms of initial investment as well
as cost of losses. If the load increases, changing to a more conventional transformer is simple to do and
does not incur any significant costs compared to installing the larger transformer initially. Using smaller,
more adapted transformers, also has the following additional advantages (Inversin, 1999).
Summary and conclusions
• Use of thinner, high-strength conductors such as the “Raisin” or “Walnut” type ACSR can increasespan lengths and cut costs for conductors considerably.
• Line material suitability for corrosive environments must be taken into account to achieve thelowest lifetime cost of the line.
• Cables can be an alternative under special circumstances where soil and environmental conditionsare favorable, and the villages electrified are willing to provide labor as equity.
• MV lines of at least 22 kV should be considered if not already implemented.

55
• Transport in Rural Environments:
Enables the relatively small transformers (around 20-40 kg) to be transported into areas without road
access.
• Load Increase:
Using small transformers enables the utility to connect more users along the MV lines that were
deemed non-viable when considering the costs of the larger transformers. Thus, the load and number
of clients served can increase significantly.
• System Optimization:
The transformer position has significant importance since it determines the amount of LV line employed
in the system. Since LV lines generally incur larger losses than the MV equivalent, choosing smaller
size transformers, more adapted to nearby loads, and placing them close to the load centers can save
considerable losses compared to the usual one transformer case where the distribution to village
clients is made solely with LV lines (see Figure A 1.1).
• Flexibility:
In the Nepal example, the smaller transformer serves in some cases in conjunction with a conventional
large-type transformer to accommodate both the high loads experienced during the dry season when
irrigation pumps are used (need of a 100 kVA) and the other times of the year when only household
energy is needed. The additional cost of the small transformer has a pay-back time of only two years
in the described case and will drastically reduce the losses when in service (Inversin, 2000).
Figure A 1.1: (i) Central Distribution Transformer,(ii) System Using Smaller Transformer Located near the Consumers Clusters
Summary and conclusions
• Transformers should be carefully selected, taking into account the density of load and the cyclicload pattern.
• Smaller size transformers, preferably locally manufactured, should be used where loads are scatteredor small. This enables more consumers to be connected and the LV high-loss connection to beminimized.
• Single-phase transformers are often less expensive and suffer lower losses for equal power delivered.
ANNEX 1: LOW-COST DESIGN

SUB-SAHARAN AFRICA: INTRODUCING LOW-COST METHODS IN ELECTRICITY DISTRIBUTION NETWORKS
56
Consumer Connections
The last stage of the electricity network is often overlooked by many utilities. It is no longer enough to bring
power to a tap-off point in the community. Also, the connections need to be provided in a low-cost design to
enable more than the wealthy few to take advantage of the new resource. Given below are some general
points to keep in mind, covering the most important components in consumer low-cost connections including
chapters on consumer metering and house wiring.
Techniques to reduce the cost per connection (Davies, 2003)
• Include All Structures
Outdated engineering standards often prohibit connections to buildings not constructed with approved
materials such as brick or stone and fitted with a sheet steel, tiled or concrete roof. This reduces the
market for the utility company and increases costs. For example, a linear village with 50 houses may
have only been half constructed from approved materials. The cost of the network is virtually the same
whether all or half of the houses are connected. If there is no restriction as to which houses may be
connected, then the network contribution to the cost per connection is halved. One easy way to make
all structures acceptable is to allow the use of “ready boards”. Another is to provide pre-fabricated
wiring in the form of wiring harnesses (see below).
• Affordable Connection Fee
The utility requires the highest possible density of connections in order to keep line lengths to the
minimum. A high connection fee will discourage new consumers and the marginal increase in revenue
from the high fee will not compensate for the increased costs. Charge a reasonable and affordable
fee, bearing in mind that the consumer incurs other (appliance) costs in changing his energy source
and recover most of the capital expenditure out of the tariff.
• Apply “Appropriate Engineering” Standards
Design and construct the house connections using suitable standards for the environment. Design for
the desert or for the coast or for the rainforest but do not have one design that fits all. Examine each
and every component and ask if it contributes to conveying power safely and efficiently to the consumer;
if it does not contribute, discard it. Consider every remaining component to see if a cheaper alternative
such as fuse wire in place of circuit breakers might work. Be adventurous and think laterally. Make
every asset “sweat”.
House wiring
The costs of wiring and inspections in remote rural areas and the high percentage of consumers living in
thatched roof houses or other types of non-permanent roof buildings have resulted in a large number of
consumers in rural African villages who are unable to connect, even in cases where they can afford the
service charges. In studies in Tanzania, the cost of changing from thatched to permanent roof, and paying

57
for the minimum connection fee and approved house wiring was estimated to be US$250, while in Bangladesh,
which allows informal housing connections, the cost of a simple connection is only US$4 (Smith, 1998).
In some cases, the standards for housing and wiring connections are very similar to the IEC standards
governing electrical connections in the western world. Experience shows that through reforms in regulations
and technical solutions such as pre-fabricated wiring, the majority of consumers not conforming to the more
rigid regulations can be connected. For a household that is only able to afford a couple of lights, classic
wiring can prove inflexible as they often want to move the lights or appliances to serve different purposes
(Smith, 1998).
Given below are some of the steps taken in different countries to address these issues.
Ready boards
A “ready board” is a low-cost distribution board encapsulating in one unit all functions that are normally
included in a wired house, complete with built-in light sockets and outlets for appliances. In some cases it
includes an integral earth leakage unit and possibly a pre-payment meter.
The principal components of a ready board or distribution board are (NRECA, 1999):
• Light Switches: Provides control over lights in the house.
• Power Outlets: Depending on the connection capacity, a number of outlets are often provided for
radio, cooking plate, etc.
• MCB/Fuse/Current Limiter: There are several ways of limiting supply to the client and to the various
power outlets with the Miniature Circuit Breaker (MCB) as the most versatile but costliest option.
Picture A 1.1: Example of a South African-manufactured Ready Board
ANNEX 1: LOW-COST DESIGN

SUB-SAHARAN AFRICA: INTRODUCING LOW-COST METHODS IN ELECTRICITY DISTRIBUTION NETWORKS
58
In many units supplied in South Africa, a light is mounted on top of the ready board and can, for the poorest
households, be their first electrical appliance. Ready boards are nowadays used extensively in South Africa,
and are reported to be working well for low-income households. They have been used in various types of
houses, from mud-plastered to concrete block houses. Savings in consumer installation costs on the order of
50-75 percent can be realized if a ready board is used instead of conventional house wiring methods
(Davidson et al., 2000). The device has the advantage of reducing both the utility’s and the consumer’s
house wiring costs, as well as removing some of the cost associated with house wiring inspections. The
household usually makes any extensions beyond the board using surface-mounted flexible connections.
Nowadays, there are several industrial manufacturers of ready boards, especially in South Africa. Costs are
estimated to be around US$40 but are dependent on the level of function, usage of MCB, earth leakage
unit, number of sockets, etc. (Smith, 1998).
The drawbacks experienced with ready boards are mostly related to safety issues. In the cases where ready
boards have been offered without earth leakage protection, there is a risk that the sometimes due to the
poor wiring done by rural consumers, branching out of wires from one or two sockets can cause fires or
accidents. A solution to some of these concerns is an integrated protection device and the supply of wiring
harnesses for lighting as described in the section below (Smith, 1998).
Wiring harnesses
In Nepal, low-tech ready boards are combined with wiring harnesses to offer consumers locally manufactured
packages consisting of a basic wooden connection box with fuse, power outlets and lights with included
wires. The wires radiate out of the connection box in an octopus fashion. Installation is accomplished easily
by fixing the wires to beams or building supports using plastic cable ties or other temporary solutions. The
basic wire harness package includes two lights and one socket and comes at a cost of around US$5 (Smith,
1998).
The advantages of making a wire harness package available to consumers versus the consumer buying his
own lights and wires are mainly two-fold: economies of scale in purchases and assurance of a correct
power circuit and protection function to inexperienced users in temporary thatched roof houses. The basic
harness is used in conjunction with a load limiter. If the consumer pays for a higher current or metered
supply, the wiring harness is upgraded to carry additional load (Smith, 1998).
The wire harness solution has proven popular because of its ease of use, flexibility when it comes to
reallocation of the lights inside the house, the local technical support available and the low price. Studies
have shown that a conventionally wired house is about six times more expensive than the wire harness
option (NRECA, 1999).

59
Meters
There are three different solutions to metering and receiving payment from the electricity consumer – credit
metering, pre-paid metering and load limited metering. Whatever option is selected, the utility needs to take
account of the full monthly cost of the meters. If the meter life is less than the depreciation period of the line
then the replacement cost must also be factored in. This chapter will aim to explain the advantages and
disadvantages experienced in developing countries using these technologies.
Credit Metering
The most common technique used in developed economies, credit metering is to meter the electricity
consumed and later bill the consumer for the used resource. Usual problems in developing countries with
this method are metering accuracy, illegal tampering, bill delivery and cash collection.
As credit meters are robust, show a true reflection of usage (compared to a fixed rate), and are about half
the cost of a prepayment meter, it is worth looking at ways in which the apparent disadvantages of these
meters can be addressed. Normally, there will be meter readers, a posted or delivered bill and a collection
point at which payments can be made. Savings can be achieved if the meter readers are local residents
paid on a commission basis. The same person can issue bills either through a central billing system or using
point-of-sale equipment. The utility involvement and cost is then limited to an audit function. The same
person should be the eyes and ears of the utility and should be able to provide specific information about
first-line maintenance and consumer complaints. All this reduces monthly costs and improves viability (Davies,
2004).
Prepaid Meters
In order to come to terms with problems such as electricity theft and poor metering ability, many utilities
have called for alternative solutions to eliminate costly payment collection and metering reading functions.
One of the more established solutions to these issues is prepaid metering. Prepaid meters work on advance
payment basis using swipe cards, tokens or a printed code from a receipt received at the vendor outlet to
record the amount of units purchased for future use. The prepaid meters were first introduced in the African
context on a large scale during the National Electrification Program in South Africa. Since then, prepaid
meters have proven to be successful in many developing countries, especially for consumer consuming
electricity above an average of 100 kWh per month.
Prepayment meters provide the following general advantages to clients (Inversin, 2000):
• No meter reading required;
• No billing required;
ANNEX 1: LOW-COST DESIGN

SUB-SAHARAN AFRICA: INTRODUCING LOW-COST METHODS IN ELECTRICITY DISTRIBUTION NETWORKS
60
• No overdue accounts and bad debts;
• Easy budgeting energy conservation;
• No consumer complaints regarding bills;
• No problem with bill delivery due to the lack of a postal system;
• Automatically disconnects in a transparent and equal way; and
• Job creation in electricity vending outlets.
The introduction of prepaid meters in many RE programs has also resulted in various problems. During the
first year of the South African program, the prepayment meters had a 20 percent failure rate (Smith,
1998). The problem was mainly due to two causes, the first was that the new technology was poorly
adapted to the environment in which the meters were installed. The second was that inexperienced users
were unable to operate the meters correctly (one of the main problems was that Eskom specified an impulse
withstand of 6 kV, whereas the conventional meters have a withstand of more than 15 kV. In networks with
overhead lines, 6 kV is not a reasonable withstand level). Since then, the design of the devices has improved
both in quality and user-friendliness, resulting in the disappearance of many of the initial problems. One of
the changes which was introduced is easier displays for the meters that enable illiterate users to assess their
energy consumption and the number of units left of their current prepaid electricity amount. Symbols
include a “smiling face” when there is plenty of electricity left from the purchased amount and a “sad face”
when the prepaid amount is about to run out. Other functions are a scale of LED lamp symbols that indicate
current usage. This enables users who might not realize the importance of twining off unused equipment to
actively search for power saving measures (Stevens, 2000).
However, some drawbacks of prepaid meters still remain. They are (Davies, 2000):
• Shorter lifespan (10 years) compared to lifespan of credit meters (20 years);
• Easy by-passing by the consumers – no reduction in meter tampering;
• High initial cost of meter and installation;
• Costs of vending machines and placing enough of them (especially in rural areas) to be within a
reasonable distance for each consumer (5 km is the NER-recommended maximum); and
• Unrecorded token sales by other nearby utilities that work on your system.
These drawbacks do not mean that prepaid meters should not be used but it is essential that the true, total
cost of the metering system is fully understood by the purchaser. If the intention is to address the social
problem of non-payment using prepayment meters, then expect to be disappointed. Social problems are
rarely resolved by technical solutions (Davies, 2004).
Some of the experiences of using prepayment meters relating to the South African National Electrification
Program can be found in the Case Study chapter.

61
Unmetered Supply
The third option is to provide a load limited supply with a fixed monthly charge based on the maximum
capacity provided to the consumer. From a technical perspective, the load limiters work by limiting the
current supplied to a maximum value. If the current exceeds this value, a device cuts the power and has to
be either reset manually or automatically reconnected after a few seconds if the load has decreased. There
are three basic types of load limiters (Smith, 1998):
• Miniature Circuit Breaker (MCB):
MCBs are well known to electrical engineers and are manufactured in large series. They are reasonably
accurate and offer good service quality. A 250 W MCB-based load limiter costs US$8 when applied
in an electrification project in Nepal.
• Positive Temperature Co-efficient Thermistor (PTC):
PTCs were originally produced for overload protection in telecommunication and consumer electronics.
The PTC offers very low costs and high accuracy for low current applications less than 500 mA. The
cost for a 25 W or 50 W load limiter in Nepal is on an average US$4.
• Electronic Current Cut-out (ECC):
The ECC is a new development especially for load limitation purposes. The ECC offers higher accuracy
than the MCB and higher current capacity than the PCT. It was developed in conjunction with the Nepal
“Andhi Khola” rural electrification program and offers load limiters from 0.5 to 3 A. An ECC-based
load limiter for 250 W costs US$12.5.
The prices above should be compared with the cheapest Chinese or Indian credit meter which was at the
time of the study sold at US$15, a prepayment meter of similar quality was sold at US$90.
One of the most important drawbacks of unmetered supply is that the unchecked supply encourages illegal
tampering. This can pose larger problems than the mere loss of revenue since a network adapted for an
optimal ADMD and strained generating facilities such as mini hydro grids can be overloaded and damaged.
Later versions of load limitation products address this concern. The “Power Provider” shown in Picture A
1.2: can be installed in connection to the HV line tap-off, making bypassing impossible when current is live.
It also replaces the need for additional line fuse, making additional savings possible (Larsson et al, 2002).
These new types of devices provide a technological solution for load limitation purposes in the range
between 0.5-5 A (Sustainable Systems Limited, 2000).
ANNEX 1: LOW-COST DESIGN

SUB-SAHARAN AFRICA: INTRODUCING LOW-COST METHODS IN ELECTRICITY DISTRIBUTION NETWORKS
62
The advantages of unmetered supply are the ease of budgeting for utility and consumer as well as the
comparatively low costs per connection. Drawbacks are repressed demand with, in many cases, feelings of
inequality because more wealthy consumers are able to use electricity for productive activities without being
hampered by inflexible load limits. Another drawback is that energy economization by consumers is not
encouraged as long as the load limit has not been reached (Inversin, 2000). Since many African enterprises
start in the backyard of the owner’s house, load limited supplies can also have a development implication
when it comes to productive uses of electricity, increased disposable income and private enterprise.
Summary and conclusions
• Costs associated with house wiring can be drastically reduced by the use of “ready boards” and“wiring harnesses”.
• A “ready board” is a low-cost distribution board encapsulating in one boxed unit all functions thatare normally included in a wired house, complete with built-in light sockets, outlets and possiblya prepayment meter, making house connections fast and cost-effective.
• Ready-made wiring solutions like “wiring harnesses” enable utilities to increase the number ofusers since clients in thatched roof or other types of unregulated housing can also be connected.
• There are three metering options, credit metering, prepaid metering and unmetered or load-limited supply.
• Unmetered supplies are the cheapest option for rural clients with low power usage (below 100kWh per month).
• For higher power users, the selection between prepaid or the credit metered supply have to becarefully considered. If an economical way of reading meters and collecting payments is available,the credit metering scheme is the least-cost option for users with a consumption of 100 kWh permonths or above.
• In cases where clients are unused to electricity consumption and operate on a tight budget,prepaid metering paired with simple instructions and easy-to-read displays can facilitate electricityusage.
A new type of load limiter that can be placed outside at the pole, making illegal tampering more
difficult.
Picture A 1.2: The “Power Provider”
InputCables
Weatherproof EpoxyEncapsulation
ConstructionStandard
Connection
AluminumChassis with Slot
for Fixing Strap
OutputCables

63
Single-phase Techniques
The single-phase configuration is by now a well-established and proven technique used in many countries
ranging from highly industrialized countries like the USA and Australia to developing countries like Tunisia,
Ghana and Bolivia. In spite of the clear advantages and wide range of references, there seems to be a
reluctance in many countries to use the technique to its full potential. This section will try to clarify, based on
available reports and studies, when these techniques should be used and what limitations they carry with
them.
Single-phase
Background
The single-phase technique was first used on a large scale in the 1930s by the Rural Electrification
Administration (REA). Due to its flexible design and low cost for connecting rural loads from American
farms, it was soon adopted by the state utilities and developed into a National Standard. The North American
standard builds on the four-wire Wye configured design, the fourth wire being Earth Return. The single-
phase is then branched out using one of the phase lines and the neutral earthing wire (see Figure A 1.2).
Figure A 1.2: Single-phase Tap-off from Distribution Line (Larsson, 2002)
Advantages
The system has some obvious cost savings when reducing the number of lines from three or four to one
conducting and one earthing wire. The primary factors for savings are:
ANNEX 1: LOW-COST DESIGN

SUB-SAHARAN AFRICA: INTRODUCING LOW-COST METHODS IN ELECTRICITY DISTRIBUTION NETWORKS
64
• Reduction of conductor costs
(See earlier section “line voltage” for example from El Salvador)
• Shorter poles and/or longer spans
Since there is only one primary conductor, the distance to ground can be kept lower for the neutral
wire, thus minimizing the needed ground clearance.
• Less costly single-phase distribution transformer
• More adaptable to smaller rural loads
What is less evident is that the technical losses are often lower than the equivalent three-phase system
(Inversin, 1999). This is with the exception of SWER where losses due to the Earth Return system are
considerably higher (see below).
Drawbacks
Single-phase systems have distinctive drawbacks. From a security point of view, there is a risk of accidents
if the neutral line is cut or is not earthed regularly. Single-phase faults cause strong currents that should be
returned through the neutral wire in order to prevent the risk of electrocution due to high phase-ground
differences. The technique should therefore be used wisely and in areas with low population density (Bernard,
1999).
Picture A 1.3: A Roto-phase Converter used to Recreate Three-phase Loadsfor a Dairy Production Unit in Tunisia (Cecelski, 2004)
From a user point of view, single-phase systems limit the use of three-phase motors and machines. Single-
phase motors are, under normal market conditions, about 25-40 percent more expensive than the equivalent
three-phase product. In many developing countries, single-phase motors are not available, but this is due to
the low demand stemming from a largely three-phase national grid system. There are also ways of recreating
the three-phase current, using variable speed drives, for specialized machines or motors exceeding the
normal single-phase motor range (see Tunisia case study). These ways of compensating the drawbacks of

65
the single-phase distribution system seem to have worked well. Experience shows that in the countries which
have implemented single-phase on a large scale there has been virtually no need of an upgrade to three-
phase service (Tulloch, 2000).
Single Wire Earth Return (SWER)
SWER was invented for largely the same applications as its predecessor the single phase technique, an
economic way of electrifying outlying farms and rural houses, this time in New Zealand. The SWER technique
is now established as one of the cheapest rural reticulation techniques available for smaller loads. By letting
the return path go through earth, the design enables one single wire to supply distant rural loads with no
neutral wire (see Picture A 1.4).
Picture A 1.4: Pole-top Insulator Configuration for SWER Application used in Australia
The single-wire design enables radically reduced material costs as well as increased span length since no
phase-phase or phase-neutral distance is needed. It simplifies the line design to the extreme, enabling one
single pole top insulator (see Picture A 1.4) and long spans from hilltop to hilltop. Since there are no phase-
to-phase distances, there are also no risk of line clashes and sparks to cause bush fires and other accidents
associated with multiphase supply. The principal drawbacks with the SWER technique are limitations in load
supply capacity (less than 500 kVA), higher losses and a potentially higher risk for earthing faults and
accidents. Limitations to industrial uses remain the same as with regular single-phase supply.
Figure A 1.3: The Use of Earth as Return Conductor, Using the SWER Design (Bergman, 2003)
Load
Outgoing Current
Power Supply
Returning Current
Grounding Electrode
ANNEX 1: LOW-COST DESIGN

SUB-SAHARAN AFRICA: INTRODUCING LOW-COST METHODS IN ELECTRICITY DISTRIBUTION NETWORKS
66
The key issues to address in the SWER systems are (Tulloch, 2000):
• Earthing Requirements (see below)
• Protection:
Considering the systems design, protection against fault currents is very important. Protection-types
can be fuse cut-out, overcurrent protection or special earth sensing relays.
• Load Densities:
Choosing SWER should be an option only if the projected load for the next 10 years is likely to stay
within the capacity of the technology. A strategic design with an upgradable system, i.e., place on pole
for a metallic return wire can be a suitable compromise.
• Voltage Selection:
To achieve reasonable capacity and range of the SWER technique, many countries have chosen 19.1
kV voltage level stemming from a 33 kV, three-phase backbone system.
• Isolating Transformers:
Use of isolating transformers enables users of 11 or 22 kV MV systems to operate their SWER at
higher levels as the widely used 19.1 kV voltage rate and, at the same time, increase protection
levels.
The earthing requirements are especially important to ensure reliability and safety for the SWER system. A
SWER earthing system has to not only transmit occasional fault currents, but also continuous load when the
system is in service. This poses higher demands on quality and reliability of the system that have to be taken
into account during the design phase. Another important factor is the conductivity of the earth itself. If the
earth resistivity is too high (SWER can only be implemented where earth resistivity is below 1000 ohms per
meter [Da Silva, 2000]), safety issues and cost of proper earthing will make the SWER design unviable.
Factors to consider in order to determine earth resistivity and the suitability of using the SWER design are
(Tulloch, 2000):
Picture A 1.5: Low-voltage Tap-off from SWER Network

67
• Type of soil;
• Chemical composition of salts dissolved in the contained water;
• Concentration of the salts dissolved in the contained water;
• Moisture content;
• Temperature;
• Grain size of the material and distribution of grain size; and
• Closeness of packing and pressure.
These factors should be taken seriously and thorough testing of soil conditions during different times of the
year needs to be done in order to fully determine the suitability of the technique. There are, however,
several cases where SWER is used in extremely dry areas (see Tunisia case study), making a case that
earthing requirements and techniques can be adapted even for conditions where one would expect the
techniques to face difficulties.
Upgradability
Through a well-planned design of the line, making provisions in pole heights and strengths, a SWER line is
easily upgradeable to a two-wire single-phase, V-phase or a full three-wire three-phase system. The upgrade
would be at a capital cost that would overall only be marginally higher than building a three-phase system
initially (Tulloch, 2000). In practice, only a percentage of rural supplies will require future upgrade within
the life expectancy of the line. Even if the unexpected happened and some lines required upgrade within a
short duration (< five years), then the overall savings and, hence, economics are still favorable, provided
there is space available in the poles. These events will happen only if the initiative is taken by those communities
who will fully grasp the opportunities of electrification. In such cases, growth will justify and fund the additional
capital needed.
Shield Wire
Shield Wire Systems (SWS) use the single-phase or SWER technique (described above) and the already
existing transmission shield wires that are mounted on top of most transmission lines to protect against
lightning strikes etc. It is an elegant way of providing electricity distribution to villages adjacent to large HV
lines without having to build additional distribution networks except for the tap-offs. The technique uses
distribution equipment which most utilities are very familiar with. Savings of up to 50 percent are possible
compared to the traditional distribution systems, 30 percent if the shield wire needs to be upgraded to ACSR
(Tulloch, 2000).
The system taps current at the closest distribution substation and transmits the power over the transmission
shield wire to a suitable tap-off on one of the transmission towers. To transmit power, the shield wire lines
need to be insulated from the rest of the tower. In some cases, this is already done due to other usages of
ANNEX 1: LOW-COST DESIGN

SUB-SAHARAN AFRICA: INTRODUCING LOW-COST METHODS IN ELECTRICITY DISTRIBUTION NETWORKS
68
the shield wire, such as power line carrier communication, etc. Retrofitting an uninsulated shield wire will be
costly if live-wire techniques are not available since there will be a need to cut off power also on the
principal transmission lines.
The first trials of this application were commissioned in Ghana in 1985 (See chapter Ghana Case Study)
and have since then spread to a number of countries in Africa, South America and Asia.
Designs of SWS systems are dependent on the transmission shield wire available. In the ideal case, where
two ACSR shield wires are available, quite substantial loads can be transmitted over distances up to 30 km
from the transmission line (Tulloch, 2000). If only one wire is available, the capacity decreases but is often
well-suited for scattered villages close to the transmission line. According to Professor Iliceto (1989), there
are four basic configurations available. The suitability of the different schemes is dependent on the configuration
of shield wire and loads distributed. These are:
Single shield wire techniques
• Single Wire Earth Return (SWER)
Using the earlier mentioned SWER technique, smaller rural loads can be supplied with only one shield
wire available. This scheme is especially suitable on the lower-end transmission lines that use only one
shield wire line and for unelectrified communities suitable for a low-capacity single-phase supply.
Double shield wire techniques
• Single Phase Metallic Return:
This technique builds on the “classic” single-phase technique (see above). It can distribute more load
over larger distances than the SWER technique. It uses the second shield wire as a return path. It is
suitable for larger loads or in cases where earthing characteristics are not suitable for SWER designs.
• V-Scheme:
The V-Scheme is mainly an one-phase design with artificially created “three-phase” option, using the
two shield wires and a SWER-type earth return path. It can only be used for systems with grounded
neutral and provides single-phase loads as well as small amounts of three-phase load through the
transformers open-delta or V-connection. This could be used for areas where there is need for three-
phase load for smaller productive applications, but the main loads could be provided through single-
phase.
• “Three-phase” System:
By creating a symmetrical supply, using the two shield wires and the earth return path, there is a
possibility to supply a full three-phase distribution service. There is, however, a need to use series
resistors/reactors for the earth path and capacitors between the two shield wires to enable the design,
resulting in a higher cost relative to the load delivered. A three-phase transformer with one terminal
grounded can be used for the consumer LV tap-offs.

69
Summary and conclusions
• Single-phase: There are three main types of single-phase systems, single-phase with conductorneutral, SWER and shield wire systems.
• Capacity: The technologies are suitable for different client needs depending on the power thatneeds to be distributed.
• SWER: Generally deemed the lowest cost option to service smaller rural loads in areas withsuitable earthing characteristics, it distributes single-phase MV power on one single line withcurrent returning through earth.
• SWT: An excellent way of distributing power to villages close to an existing or planned transmissionline, the distribution is done through the insulated shield wires mounted on top of the transmissiontowers.
In cases where mostly rural areas and domestic loads are to be served, the single-phase options are the
most suitable. In areas where there are industrial uses, unsuitable to single-phase supply or the shield wire
scheme is replacing a genset operation or another three-phase source running an already existing network,
the two three-phase options could be considered at a higher cost (Iliceto, 1989).
An important factor to consider with all SWT is to preserve the lightning protection function that the shield
wire performs for the transmission lines in the first place. The easiest way of dealing with these issues is to
use simple arcing horns with small gaps, which will directly transfer any lightning impact on the shield wire
or tower down to earth at the same time as it allows for the much smaller distribution currents to pass under
normal operation.
ANNEX 1: LOW-COST DESIGN


South Africa
“The program had to be tackled on a number of fronts – the process had to be formulated and the technology
had to be perfected. The project management aspect was the key component in the construction process.
In order to meet the target, it meant that a connection had to be made every 30 seconds for five years. A
pole had to be placed in the correct position every 10 seconds. Two hundred meters of cable had to be
strung and attached every minute. In addition, invoices and payments had to be made to the value of
R6,000 per minute or approximately R300,000 per day. In the course of one year, over 200 individual
electrification projects had to be planned, designed and executed with the precision of an expensive Swiss
watch” (R. Stephen and I. Sokopo, 2000).
In 1988, Eskom South Africa had only 120,000 connected consumers consisting of mostly industry and
high-use private clients on billed accounts (Shah, 2002). After the democratic reform in 1994, the new
Government in South Africa, under the slogan “Electricity for All” targeted electricity access as part of the
ambitious “Reconstruction and Development Program”, one of the key actions of the new regime. Today,
Eskom, together with district municipalities, serve more than seven million households, a remarkable
achievement by any standard (NER, 2003). It is one of the most ambitious electrification initiatives undertaken
anywhere in the world in the last decade and has, during the program’s first five years (1995-1999),
contributed to increasing the national electrification in South Africa from 36 percent to 66 percent (Borchers
et al, 2001).
The base for this successful program has been the commitment and willingness of the South African
Government and Eskom to spend large amounts of state and company funds and resources to achieve
ambitious targets, paired with a large unused generation capacity built during the 1970s and 1980s which
enabled large amounts of new users to get connected to the national grid with virtually no new generation
investments needed.
During the course of the NEP, there have been a number of interesting technical innovations implemented
in the program. The most obvious ones are the widespread use of prepayment meters, 2.5 Amp load
limited supplies and ready boards. Less evident, but important to success, is Eskom’s work on load forecasting.
6. Case Studies and Initiatives
71

SUB-SAHARAN AFRICA: INTRODUCING LOW-COST METHODS IN ELECTRICITY DISTRIBUTION NETWORKS
72
These and other incremental innovations in line design have resulted in a continuous reduction in the price
per connection in spite of the fact that the overall budget available for the program has been decreasing
during the last eight years (see Table A 1.4, NER 2002).
Table A 1.4: Cost per Connection and Total Budget for the NEP during the Years 1994-2002
1994 1995 1996 1997 1998 1999 2000 2001 2002
Average Cost 3,400 2,949 3,245 2,356 2,889 2,676 2,586 2,699 2,655per connection (Rand)
Capital Expenditure 1,487 1,411 1,473 1,176 1,234 1,186 1,011 909 899(m Rand)
Technical measures
Eskom had to use its own funds to complete the targets laid down in the NEP. It was of utmost importance to
the survival of the company that connection costs be kept to a minimum both in urban townships as well as
in remote rural areas. Faced with this challenge and the difference in needs of different communities to be
electrified, Eskom decided to use a four-step approach to decide on a suitable strategy in each case while
trying to reduce the cost per connection in as many ways as possible. The approach is as follows (Stephen,
2000):
• Step 1: Determine the load requirements of the rural user.
• Step 2: Decide on suitable supply option choosing between three-phase, single-phase and SWER.
• Step 3: Ensure that equipment selected is utilized to its optimal capacity.
• Step 4: Choose the appropriate revenue and metering system taking into account losses, revenue
collection costs, etc.
Distribution system design
Step 1: Working according to the four-step approach, Eskom realized that the rural users electrified in the
NEP did not consume nearly as much energy as initially forecasted. The designing ADMD was gradually
lowered from the urban residential levels at 3,000 VA that Eskom had been used to, to ADMD factors of
400 VA initial and 800 VA final design factor (Stevens, 2000).
Step 2: As in the majority of developing countries, South Africa had inherited a three-phase European
system poorly adapted for rural reticulation. During the course of the NEP, the strategy evolved to keep this
standard to a minimum. Instead bi-phase, single-phase and SWER technologies were used depending on
the ADMD of the respective community and the total power delivered. The difference between the two
extremes, full three-phase and SWER, proved to be a factor of six-to-one.

73
Step 3: There was also a need to overhaul old design “rules of thumb” for equipment usage. When
focusing on span lengths, Eskom found that they could, on an average, be increased 100 percent for LV
bundle conductor and 60 percent for MV lines thanks to modern materials and the thinner lines resulting
from the lower ADMD figures applied. The distribution transformers were adapted for the near-term load
and not for final design figures that networks rarely lived up to.
Eskom used monitoring indicators and a target-based approach to determine and supervise the
implementation and percentages of respective distribution-type and the equipment used. In retrospect, this
saved an average of 25 percent of the cost per connection (Stevens, 2000).
Revenue management
During the apartheid years, non-payment of electricity bills was often seen by poor township communities as
a legitimate protest against discriminating authorities. When South Africa was democratized in 1994, the
culture of non-payment had become so established that even if the initial reasons no longer existed, the
tampering expertise and attitude to paying for electricity remained. Eskom’s initial calculations showed
yearly revenues of R96 in the poorest areas and an operating and maintenance cost of R104, with a loss of
nearly 10 percent in long-term operating costs for each new connection. Something had to be done.
Another problem in rural townships was the often temporary housing that people lived in, non-conforming
to the South African Bureau of Standards (SABS) used for electricity connections. By using ready boards,
Eskom could also achieve technically safe connections in temporary houses, enabling most households in
areas covered by the program to get a connection (Cunningham, 1996).
ANNEX 1: CASE STUDIES AND INITIATIVES
Picture A 1.6: Housing in a South African Township
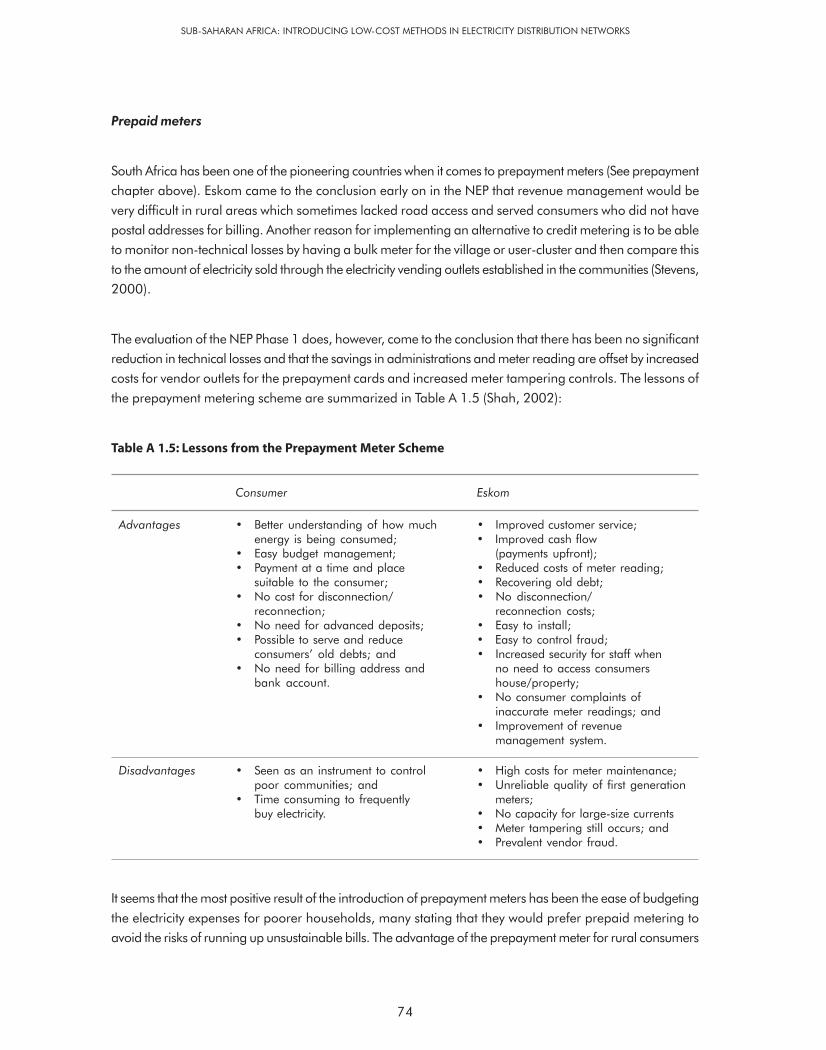
SUB-SAHARAN AFRICA: INTRODUCING LOW-COST METHODS IN ELECTRICITY DISTRIBUTION NETWORKS
74
Prepaid meters
South Africa has been one of the pioneering countries when it comes to prepayment meters (See prepayment
chapter above). Eskom came to the conclusion early on in the NEP that revenue management would be
very difficult in rural areas which sometimes lacked road access and served consumers who did not have
postal addresses for billing. Another reason for implementing an alternative to credit metering is to be able
to monitor non-technical losses by having a bulk meter for the village or user-cluster and then compare this
to the amount of electricity sold through the electricity vending outlets established in the communities (Stevens,
2000).
The evaluation of the NEP Phase 1 does, however, come to the conclusion that there has been no significant
reduction in technical losses and that the savings in administrations and meter reading are offset by increased
costs for vendor outlets for the prepayment cards and increased meter tampering controls. The lessons of
the prepayment metering scheme are summarized in Table A 1.5 (Shah, 2002):
Table A 1.5: Lessons from the Prepayment Meter Scheme
Consumer Eskom
Advantages • Better understanding of how much • Improved customer service;energy is being consumed; • Improved cash flow
• Easy budget management; (payments upfront);• Payment at a time and place • Reduced costs of meter reading;
suitable to the consumer; • Recovering old debt;• No cost for disconnection/ • No disconnection/
reconnection; reconnection costs;• No need for advanced deposits; • Easy to install;• Possible to serve and reduce • Easy to control fraud;
consumers’ old debts; and • Increased security for staff when• No need for billing address and no need to access consumers
bank account. house/property;• No consumer complaints of
inaccurate meter readings; and• Improvement of revenue
management system.
Disadvantages • Seen as an instrument to control • High costs for meter maintenance;poor communities; and • Unreliable quality of first generation
• Time consuming to frequently meters;buy electricity. • No capacity for large-size currents
• Meter tampering still occurs; and• Prevalent vendor fraud.
It seems that the most positive result of the introduction of prepayment meters has been the ease of budgeting
the electricity expenses for poorer households, many stating that they would prefer prepaid metering to
avoid the risks of running up unsustainable bills. The advantage of the prepayment meter for rural consumers

75
has even led households to opt for a more expensive 20 Amp connection with prepayment metering than
the more suitable base connection with load-limited supply because of the ease of budgeting expenses
(Bronwyn, 1997).
The quality and lifespan of the PPMs has not measured up to the initial expectations. While other electrical
equipment has at least a 20 year expected lifetime, it seems like PPMs in South Africa have to be replaced,
on an average, every 10 years (Borchers et al, 2001). The introduction of new digital technologies and
refinement of the existing meters can hopefully improve these records, but for now, credit meters seem to
have at least double the lifespan of the prepayment alternatives.
Load limitations
In order to keep the operating costs to a minimum and reach the high target of connections in the NEP,
ESKOM introduced a range of current limited supplies from 2.5 Amp to 60 Amp (See Table A 1.6, INEP
Planning and Implementation Manual, 2001).
Table A 1.6: Load Limitations
Supply Option Connection Fee Level of Service
2.5 Amp (some cases directly 0 Four lights, monochrome TV, small radioupgradable to 20 Amp) Unmetered supply
20 Amp R150 Lights, color TV, radio and additionalsmall appliances, the most common optionfor rural homes in South AfricaPrepaid meter
40 Amp R500 All normal electricity requirements inaverage middle income householdCredit or prepaid meter
60 Amp R1,000 All normal electricity requirements inhigh income households or smallbusinessesCredit or prepaid meter
The 2.5 Amp connection, while being affordable, poses high constraints to uses other than lighting. Eskom
has, in an effort to offer flexibility to this consumer group, in later models of the installed prepayment meters
made provisions for a direct upgrade of the connection to 20 Amp through a simple installation fee token
that can be purchased at the vendor outlets. Only 4 percent of the 2.5 Amp users have, thus far, taken
advantage of this option, an indication that many users find the 2.5 Amp limit adequate to their use and
purchasing power.
ANNEX 1: CASE STUDIES AND INITIATIVES

SUB-SAHARAN AFRICA: INTRODUCING LOW-COST METHODS IN ELECTRICITY DISTRIBUTION NETWORKS
76
The relatively low power usage and the high level of clients limited to a peak 2.5 Amp have made it possible
to design the network using an ADMD level of 0.4 kVA. This enables ESKOM and the municipalities to
reduce dimensions and network characteristics to the minimum without risking voltage drops (INEP Planning
and Implementation Manual, 2001).
Ready boards
The use of ready boards in South Africa has been a success. It has enabled the poorest households to get
electricity in often temporary homes without demands for wiring and rigorous building standards. The ready
boards are today locally manufactured and contribute in that respect to job creation.
Picture A 1.7: Ready Board Paired with Prepayment Meter in a South African Household
Tunisia
Background
Tunisia has over the last 30 years shown an impressive commitment to RE and access. When the RE
program was launched in the mid-1970s only 6 percent of Tunisian rural households had access to modern
energy services. By 2000, an estimated 88 percent of rural households had electricity connections, with the
goal of providing complete coverage by 2007 through 97 percent grid connections and 3 percent solar PV
(Cecelski et al, 2004). The key to success lies primarily in two areas, a full commitment from all levels of
the State, led by the State utility, STEG, and, secondly, a technological leap through a courageous move
towards low-cost solutions based on their own development of the single-phase North American distribution
design.

77
Technical change
In 1973, STEG, with the assistance of Hydro Quebec, undertook a technical audit of the standards used in
Tunisia for distribution systems, and how these could be adapted to facilitate the Government’s goals of
universal electricity coverage. The main recommendation was to start using low-cost reticulation techniques
based on the North American model, combining a core three-phase network with single-phase tap-offs.
STEG called the system MALT (referring to the grounding of the fourth wire).
The decision to leave the inherited French/European three-phase system was heavily criticized within the
STEG and the Ministry, but the initiative prevailed due to the clear recommendations from the audit report,
stating that this was a highly suitable standard for Tunisia’s conditions with sparsely populated rural clusters
with long distances between load centers.
In 1976, the program to convert the distribution system to the American standard was launched. The
program soon won acclaim for its fast results even from some of its strongest critics. During the first five-
year plan, the savings generated through the new designs resulted in an additional 10,000 households (or
28 percent more than initially calculated) receiving electricity access (see Table, Barnes 2003).
During the following years, STEG continued the hunt for cost savings in designs, introducing savings in line
design, local adaptations to the North American standard, and creating two different voltage levels for the
single-phase MALT distribution, 17.32 and 4.15 kV. The higher voltage level used in Tunisia, compared to
the original US design enabled STEG to distribute energy over larger distances through the single-phase
tap-offs as well as provide room for load growth during the 30-year lifetime of the distribution lines. This
innovation and constant development also had the advantage that local companies, working in cooperation
with STEG, had the opportunity to develop their own designs based on the new technology, creating jobs
and further reducing the cost, as well as reducing the need for imported parts.
In the following years, the connection target was surpassed in all ADB electrification loans peaking in 1982,
with the number of connections being 78 percent greater than budgeted. The success in lowering costs,
over-delivering in the programs and bringing electricity to the rural population has also created a sense of
pride and “esprit de corps” in STEG that enabled them to continue the innovative approach, becoming one
of Tunisia’s most attractive employers for upcoming engineers.
In 1990, another innovative step was taken with the introduction of the SWER design. The Single Line
Technology (SLT) enabled STEG to further reduce the cost of distribution with up to 30 percent in very
remote areas. Due to the potential drawbacks of using SWER systems, especially in terms of capacity and
future upgradeability, district chiefs have the option of choosing whether to use the simpler SWER or the
traditional MALT system in rural electrification projects thus making the trade-off between capacity and
number of connections.
ANNEX 1: CASE STUDIES AND INITIATIVES

SUB-SAHARAN AFRICA: INTRODUCING LOW-COST METHODS IN ELECTRICITY DISTRIBUTION NETWORKS
78
Table A 1.7: Development of the Tunisian Electrification Program in Five-year Plans from 1972 to 2001
Five-year Planning Periods
IV V VI VII VIII IXFactor (1972-76) (1977-81) (1982-86) (1987-91) (1992-96) (1997-01)
Total Investment (MTD) 29 52 105 130 134
No. of New Connectionsa 30,000 70,000 80,000 114,000 180,000 135,000
Cumulative Connections 100,000 180,000 294,000 474,000 609,000
% Rural HH with Electric 6 16 28 48 75.7 88.1
% Total HH with Electric 37 56 69 81 90.0 94.9
No. of New HH withPV Systemsb 3,919c 3,838
a Implemented through the year 2000.b PV program adds about 1 percent to rural electrification coverage.c Cumulative through the end of the Eighth Plan.
State and community commitment
Rural electricity, together with education and health, are the three pillars on which Tunisia chose to launch
the State Rural Development Program (RDP). This shows clearly the level of commitment and priority that
are put on increasing rural access to energy. Because of the high priority put on electricity access by the
Tunisian Government, the rural electrification program was able to start purely on Tunisian state funds.
Donors like ADB, the Kuwait fund and the French development agency first arrived on a larger scale several
years after the program was launched, but have since contributed greatly to the growth in number of
connections.
The regions or “Gouvernorates”, together with the rural councils known as Oumdas, exercise a major
influence on the priorities made in the RDP. The overall funding from the RDP to each region is negotiated
between the Ministry of Economic Development and the Gouvernorate on an annual basis. STEG’s five-
year plan of electrification costs works as a base for these discussions, determining suitable villages and
rural clusters to electrify based on eligibility under the current cost limit. When the budget has been decided,
the choice of specific households and projects from the “menu” available is made directly by the local
governments with the assistance of regional STEG entities, thus making it possible for local priorities to be
implemented in the program. These requests are then channeled to the Ministry and STEG for overall
stratification and planning.
Electrification is highly prioritized by the local Gouvernorates. In the 1997-2000 period, rural electrification
amounted to 21 percent of the total funds in the RDP only to be surpassed by one sector, drinking water, with

79
46 percent (Cecelski, 2001). These two priority needs of electricity and water are highly related since there
are many dry areas in Tunisia where electric pumps are needed to extract water from boreholes.
Project planning and selection process
The planning and selection of areas suitable for electrification under each five-year plan is made highly
transparent to each district and community through an official prioritization process. For each project, STEG
is willing to contribute 200 TD which is the equivalent of the beneficiary’s connection fee (made repayable
over 36 months). For connections costing more than 400 TD, the state RDP grants come in. During each
five-year plan, a maximum level of cost per connection is determined with the intention of increasing the
amount gradually, thus the bar goes higher for each plan making more and more households eligible. For
the Ninth plan, the maximum amount was set at a total cost of 2,200 TD, i.e. 1,800 TD of state subsidy.
Through this design of the subsidies, the utility is encouraged to maximize the number of connections in the
early years by electrifying the households with low connection costs, creating a larger future base when
reaching further out in the more costly and remote areas.
On top of the allocated maximum state contribution, there are additional funds available to especially
impoverished areas or areas targeted by the President as high priority zones. This approach enables the
decision-making to be largely perceived by the consumers as transparent and fair, while it leaves some
wiggle room for political considerations in the “topping up” funds available (see Figure A 1.4).
Figure A 1.4: The Design of Consumer Contributions, Grants and Subsidies in the Tunisian Electrification Program
Special presidential funds for impoverished areas
State and regional budget contribution (theincreasing level is set every Five-year Plan)
STEG Contribution
Beneficiary Contribution (Connection Fee)
Max
imu
m C
on
nec
tio
n C
ost
Co
nsi
der
ed
ANNEX 1: CASE STUDIES AND INITIATIVES

SUB-SAHARAN AFRICA: INTRODUCING LOW-COST METHODS IN ELECTRICITY DISTRIBUTION NETWORKS
80
Focus on productivity
The Tunisian electrification program is an integral part of the overall rural development program and,
therefore, it also shares the main goals of the program – to increase income, reduce unemployment,
improve living conditions taking into account the environment, gender status and expected rate of return.
This has led STEG to include efforts to support productive and job-creating activities in the electrified
villages. Tunisia performs regular national housing and employment surveys that form a statistical base for
the decisions on actions in the regions selected for electrification. Examples of activities supported within the
electrification program are commercial dairy farming through provision of reliable power for milking machines
and milk conservation as well as animal husbandry (Cecelski et al, 2004).
Picture A 1.8: Two Parallel Single-phase Motors Providing Additional Power for thisTunisian Industrial Client (Olive Oil Plant) (Cecelski, 2004)
If larger productive loads or specialized three-phase machinery are to be expected in the villages, STEG
compares the costs for a three-phase connection with the costs of using a phase converter with the standard
MALT or SWER configurations for consumers with special needs. STEG has found that on an average, the
price of one converter station from one- to three-phase equals 0.5 km of upgraded line. Therefore, in most
cases where three-phase specialized machinery is needed, the converter option is used.
A bigger problem for Tunisian single-phase users is the lack of knowledge about limitations of motor operation
on single-phase networks. Small entrepreneurs and farmers can often buy small three-phase motors without
realizing that their supply is single-phase and the limitations this implies.
Outcome
Although the decision was hard fought 30 years back, Tunisia’s key technical choices, paired with the strong
commitment of the state and its utility, have created one of Africa’s leading examples of how the gap in
electricity access between the urban and rural populations can be bridged. If the 97 percent electrification

81
rate is achieved as planned by 2007, Tunisia will stand out as one of the most highly electrified countries in
the developing world.
The strategy of MALT and SWER distribution methods has been consistent and today 51 percent of Tunisia’s
electricity network consists of single-phase lines and 78 percent of the substations are single-phase substations
(Cecelski, 2004). There have been significant savings compared to the designs discarded 30 years ago.
For STEG’s summary of its achievements and savings compared to its old design, see Table A 1.8:
Table A 1.8: STEG’s Achievements Compared to Old Design
Network Level Reduction
MV Network 30-40 %
MV/LV Substations 15-20 %
LV Network 5-10 %
Overall 18-24%
Ghana
The Ghana shield wire experience started with a need to solve a practical problem in the Northern Province
of the country. When extending the 161 kV transmission line in the region, the routing of the line passed
through areas along the main highway which were densely populated. Seeing the new project taking form,
the villages along the line came to expect that they would get connected automatically. The VRA in Ghana
was faced with a dilemma; even if the power was close at hand, how do you tap off small amounts of power
at very high voltage to supply rural villages? A number of alternatives were considered. Given below is the
general reasoning (Iliceto, 1989):
• Parallel MV Line: The cost could not be justified considering the length of the line (the 161 kV stations
being 100-250 km apart) and the limited load to be expected.
• MV Line Using the Same Towers as the HV Transmission Line: Did not work technically since the
thin MV lines could not support the long spans that the transmission towers and HV conductors demanded.
• Capacitor-induced Voltage: This design would supply villages with capacitively-induced voltage
through an insulated conductor or capacitor bank. Problems associated with the limited capacity (for
isolated conductor 500 W/km) and the expensive thyristor-controlled reactors to compensate for
variable load on the HV line led to the proposal’s rejection.
• Use of Inductive-type Potential Transformers: Although operating at their thermal capacity, the
power output is too low compared to the relatively high price.
ANNEX 1: CASE STUDIES AND INITIATIVES

SUB-SAHARAN AFRICA: INTRODUCING LOW-COST METHODS IN ELECTRICITY DISTRIBUTION NETWORKS
82
• Insulating the Existing Shield Wire for Electricity Distribution: Through a tap-off on the MV side
at the closest substation, the villages along the line can be served through either three-phase or single-
phase supply depending on configuration of the shield wires and tower design. The technology also
offers well-known equipment that the utility is used to installing and maintaining, such as conductor
insulators and tap-off distribution transformers.
VRA decided to try the SWT on a pilot case in the Northern district, supplying 250 users, including a TV
station, with a maximum of 150 kW of power. The results were positive. During the first 33 months there
was only one outage of the shield wire line and no interruption of the 161 kV transmission function. In fact,
most consumers never realized that their energy supply was brought to them using new technology. The
lightning protection capability of the shield wire did not seem to be affected when compared with similar
designs elsewhere. There were reported flashovers between the 161 kV and shield wire lines during severe
lightning strikes but it did not lead to any tripping of either lines with the one exception mentioned earlier
(Iliceto et al., 1989).
Building on this successful pilot project, VRA decided to go ahead with fully commercial service to consumers
along the new northern 161 kV transmission line. The commercial operation would serve a population of
150,000 in 20 towns and villages in Northern Ghana, with a forecasted demand growth up to 7,000 kW
during the lifetime of the project. Many of these communities were either unelectrified or running diesel
generators, and would, through this initiative, get a much cheaper and more reliable supply (D’Ajuz,
1993).
Since different sections of the shield wires are able to operate under different schemes, VRA has chosen to
offer a “three-phase” operation to the towns where there is significant productive activity while offering
lower cost V-phase schemes to areas with limited three-phase needs. The three-phase operation will be at
30 kV while the V-phase is operated on single-phase voltage of 20 kV (30 kV wire-to-wire).
This commercial service didn’t experience more problems than the pilot scheme and only suffered three
minor faults during the first year of operation. In fact, during the same time, the outage factor on the
conventional 34.5 kV MV lines in the same area has been 1.5 times greater than the shield wire service.
Much of the difference is due to the fact that the shield wires profit from the greater clearance given to the
high-tension transmission lines compared to the regular 30 kV MV lines, thus there is a much smaller
chance of substantial damage due to falling trees or branches. These faults take a longer time to repair than
a mere current tripping due to lightning strikes, a fault where the shield wire is more exposed to disruptions
in service (D’Ajuz, 1993).
83
Following our review of technical and methodological best practices, the question remains, how can it all be
assembled into a successful program to reach the masses of unconnected rural consumers? First of all,
there need to be some base conditions in place. Looking at the case studies from Tunisia and South Africa
and comparing with known examples from the rural scale-up in the 1930s in the United States and Ireland,
there are some clear general factors on which the success of a national low-cost reticulation program
depends. These factors are:
• Political determination;
• Commitment to the national utility or electrification authority;
• Target-based cost per connection approach; and
• Continuous effort during the program to lower cost even further.
Although this report focuses on the more tangible actions needed for a successful program, there is clear
evidence that the motivation and commitment of the national utility and concerned ministries are probably
the most important factor for a successful scale-up of energy access. As long as the entities responsible for
the electrification programs see new connections as a certain loss-maker, there will be little incentive other
than political short-term pressure to increase access by adding financial burden to companies with often
already strained balance sheets. Low-cost thinking and design is a way of balancing the scales to make loss-
producing consumers economically viable for the utility, and thus, connectable based on sound business
judgment.
When the base conditions are in place, the goals have been set up and the parties are committed, it is time
to move to the main focus of this report. Comparing the successful programs with the research done in the
area, we have found three major pillars that seem to be the key to succeeding in drastically reducing costs
in electrification programs. These are:
• Network forecasting and optimization;
• “Appropriate engineering”; and
• Low-cost network technologies.
7. Conclusions: A DevelopmentApproach for Low-cost Design

SUB-SAHARAN AFRICA: INTRODUCING LOW-COST METHODS IN ELECTRICITY DISTRIBUTION NETWORKS
84
Network Optimization
Many examples show that the load forecasts are often too optimistic about load growth in rural areas,
leading to oversized and expensive systems which stand largely unused. When sizing the network, there is
a need to look at a credible maximum load for the community.
To better forecast initial load and future growth, indicators should be developed and applied, helping the
utility to estimate the likely load for communities based on statistics regarding simultaneous peak usage and
the purchasing power of the clients, i.e., what percentage is likely to use appliances like cooking plates, fans
and refrigerators.
One suitable indicator to establish is the ADMD, a measure of forecasted peak network load per consumer.
With a well-calculated ADMD and a flexible network design, the utility can minimize the initial capital
expenditure and still have possibilities for easy upgrade if and when load increases beyond the designed
network capacity. ADMD for rural load clusters in Africa is often below 0.4 kVA per consumer. This should
be compared with current practices at many utilities of using double or up to five times this amount, to
determine design dimensions and, consequently, the subsequent investment costs. Designing networks
according to these more realistic targets allows utilities to drastically reduce size of conductors, transformers,
etc., leading to instant savings.
“Appropriate Engineering”
We have in earlier chapters of this report tried to summarize the key technical choices and considerations
needed for a low-cost grid. The most important lesson that the distribution network planner needs to embrace
is a holistic approach to savings. The cost savings entails looking at the complete picture from the MV lines
taking power into the regions, through the tap-offs and LV house connections continuing all the way through
the house perimeter including metering , fuses, switches, house wiring and even, in some cases, taking the
appliances into the calculation. It’s important to challenge all traditional thinking and standards while carefully
scrutinizing all additional costs incurred per connection. This line of thinking needs to continue during the
whole implementation of the program, as described in the case studies, making continuous reduction in
costs as the program progresses.
Below follows a summary of the chapter conclusions with key technical choices to be considered in the
network design stage (see Figure A 1.5).
1
2
3
4 5
1
Figure A 1.5: Key Technical Choices to be Considered in Network Design
85
Poles and span length
• Use of wood as pole material is preferable, especially if national and/or regional sustainable wood
resources are available.
• There is a need to make a careful optimization of the pole length/span ratio for rural electrification
taking into account the difference in clearance needs for roads and areas with only pedestrian access.
Conductor and line voltage
• Use of thinner high strength conductors such as the “Raisin” or “Walnut”-type ACSR can increase span
lengths and cut cost for conductors considerably. Lightning withstand levels must, however, be carefully
studied for each region.
• Line material suitability for corrosive environments must be taken into account to achieve the lowest
lifetime cost of the line.
• Cables can be an alternative under special circumstances where soil and environmental conditions
are favorable and the villages electrified are willing to provide labor as equity.
• MV lines of at least 22 kV should be considered if not already implemented.
Transformer
• Transformers should be carefully selected taking into account the density of load and the cyclic load
pattern.
• Single-phase transformers are often less expensive and suffer lower losses for equal power delivered.
• Smaller size transformers, preferably locally manufactured, should be used where loads are scattered
or small. This enables more consumers to be connected and the LV high loss connection to be minimized.
Meter
• There are three metering options, credit metering, prepaid metering and unmetered or load-limited
supply.
• Unmetered supplies are the lowest-cost option for rural clients with low power usage (below 100 kWh
per month).
• For higher power users, the selection between prepaid or the credit metered supply has to be carefully
considered. If an economical way of reading meters and collecting payments is available, the credit
metering scheme is the least-cost option for users with a consumption of 100 kWh per month or
above.
• In cases where the clients are not used to electricity consumption and operate on a tight budget,
prepaid metering paired with simple instructions and easy-to-read displays can facilitate electricity
usage.
ANNEX 1: CONCLUSIONS: A DEVELOPMENT APPROACH FOR LOW-COST DESIGN

SUB-SAHARAN AFRICA: INTRODUCING LOW-COST METHODS IN ELECTRICITY DISTRIBUTION NETWORKS
86
Connection/ready board and wire harness
• Costs associated with house wiring can be drastically reduced by the use of ready boards and wiring
harnesses.
• A ready board is a low-cost distribution board encapsulating in one boxed unit all functions that are
normally included in a wired house, complete with built-in light sockets, outlets and possibly a prepayment
meter, making house connections fast and cost-effective.
• Ready-made wiring solutions like wiring harnesses enable utilities to increase the number of users,
since clients in thatched roof or other types of unregulated housing can also be connected.
Low-cost Network Technologies
Besides optimizing the choice of components in the network, there are fundamental technological choices to
be made which in themselves can reduce electrification costs by a considerable amount. Single- and bi-
phase techniques are now well-tested and applied in different countries and environments. These techniques
reduce the number of conductors used for the line, resulting in savings in virtually all components associated
with power transfer. The major single-phase alternatives are single-phase with conductor neutral, SWER
and SWS.
SWER is deemed the lowest-cost option to service smaller rural loads in areas with suitable grounding
characteristics and should be the technological starting point for most rural extensions where loads are likely
to be small. It distributes single-phase MV power on one single line with current returning through earth,
enabling long single line spans with minimal poletop hardware.
Single-phase with Conductor Neutral is the costliest of the three single-phase designs but can still offer
savings of 30 percent-50 percent compared to many three-phase standards. It can carry higher loads than
the SWER-based systems and can easily be upgraded to a bi-phase system and further into a three-phase
system with an added conductor. This makes it ideal for many African communities where initial demand is
considerably lower than the long-term forecasts.
SWT is suitable for distribution of power to villages close to an existing or planned transmission line. The
design uses SWER or conventional single-phase technique in order to maximize power delivery over the
one or two shield wires available. The distribution is done through the insulated ACSR or steel shield wires
mounted on top of the transmission towers. The limited added costs of installing insulated ACSR shield wires
in new lines need to be incorporated into the national transmission line standards and designs so that they
can be directly applied when planning for new transmission projects.

87
Indicators and Benchmarks for Low-cost Networks
What can be expected as a target for a low-cost reticulation program?
In the case studies from Tunisia and South Africa described earlier, the difference in cost per connection is
considerable. South Africa is currently electrifying villages and townships at a costs of R2,655 or the equivalent
of US$390 per connection at the same time as Tunisia gradually has moved up to a current cost ceiling of
2,200 Tunisian Dinar or the equivalent of US$1,610 per connection. Considering the scope and savings
realized in both programs, these costs are probably both suitable targets for the environments under which
they operate. The conclusion is that the cost per connection can never be a valid universal target for other
countries to adopt, since it is heavily dependent on local conditions in the areas to be electrified. Instead,
indicators and connection targets need be developed for each region of the country independently, separating
seaside regions from the inland, rural or peri-urban communities.
A more adequate measure of low-cost design implementation is the percentage of realized savings compared
to old three-phase standards implemented earlier in the country. John Tulloch (2000) gave the following
forecasts for EDM Mozambique based on a technology portfolio of largely similar content:
• Grid extensions: Cost reductions of 25 percent to 40 percent
Recommendation includes utilization of SWER where possible, two-wire single-phase metallic return
and lower cost three-wire three-phase systems.
Reticulation Technology Cost Compared to Current Practice
Current national three-phase practice 100%
Three-phase low-cost with high strength conductors and poles 59%
Two-wire single-phase 36-40%
SWER 20-24%
• SWS: Further reduction of 30 percent to 50 percent in locations along transmission routes where
suitable shield wire schemes are available.
• Low Voltage Network Construction: Cost reduction of 15 percent to 25 percent.
• Consumer Connections: Cost reduction of 15 percent to 25 percent utilizing suitable meter
systems and ready-made connections and wiring products.
• Operations and Maintenance: Cost reduction of 10 percent to 20 percent
ANNEX 1: CONCLUSIONS: A DEVELOPMENT APPROACH FOR LOW-COST DESIGN

SUB-SAHARAN AFRICA: INTRODUCING LOW-COST METHODS IN ELECTRICITY DISTRIBUTION NETWORKS
88
Both the Tunisian and South African programs have documented cost savings of 20 percent – 30 percent
compared to similar network investments and consumer connection costs under old standards. There is no
reason why these figures should not be valid for replication in other African countries if the programs are
correctly adapted to local needs and demands. It will, however, take a strong commitment from all parties
involved and a continuous cost-cutting effort through several years to achieve lasting success.

89
8. Literature
Arvidson, Anders and Ellegard, Anders: Electrification of Low-income Households in Developing Countries
– Experiences from a Pilot Project in Ndola, Zambia, Paper, Swedish International Development Cooperation
Agency (Sida) 1999.
Barnes, Douglas and Foley, Gerald: Meeting the Challenge of Rural Electrification in Developing Nations,
ESMAP, 2003.
Bergman, Sten: Reducing Costs of Rural Distribution Networks using SWER Technology, Presentation Slides,
Stonepower AB, 2003.
Bernard, Cortinas & Marboef: Low-cost Electricity Distribution for Rural Areas, EDF – Management Stories
No 23, 1999.
Borchers, Qase, Gaunt Mavhungu, Winkler and Okese, Thom: National Electrification Program (NEP)
1994-1999 Summary Evaluation Report, Department of Minerals and Energy, November 2001.
Bronwyn, James: Current Limited Supplies of Electricity in the Context of South African Rural Areas, Energy
& Development Research Center, May 1997.
Cecelski, Dunkerley and Aissa, Ounalli: Low-cost Electricity and Multisector Development in Rural Tunisia,
Paper and Presentation Slides – The Energy and Mining Sector Board Lecture Series, February 11, 2004.
Cecelski, Dunkerley and Aissa, Ounalli: National Commitment, Efficient Implementation and Sound Finances,
Draft Report – ESMAP 2001.
Crowdy, Phil and Stephen, Rob: Power Network Technologies For Rural Applications – for Use in Uganda,
January 2001.
SUB-SAHARAN AFRICA: INTRODUCING LOW-COST METHODS IN ELECTRICITY DISTRIBUTION NETWORKS
90
Da Silva, I.P., Mughisha, P., Simonis, P. and Turyahikayo, G.R.: The Use of Single Wire Earth Return (SWER)
as a Potential Solution to Reduce the Cost of Rural Electrification in Uganda, Makere University and Ministry
of Energy and Mineral Development of Uganda, 2000.
D'Ajuz, A., Ferreira da Rocha, Mende E., Iliceto, F. and Gatta, F.M.: Transmission Lines with Energized
Shield Wires – An Economical Solution for the Supply of Isolated Communities, Paper, XII SNPTEE – The
Power System Brazilian Conference, Recife, October 1993.
Davies, Ian: Low-cost Electrification, Report Version 1, February 2004.
Iliceto, F. and Cinieri, E., Casely-Hayford, L. and Dokiya, G.: New Concepts on MV Distribution from
Insulated Shield Wires of HV lines – Operation Results of an Experimental System in Ghana, Paper, IEEE,
1989.
Inversin, Allen R.: Mini-Grid Design Manual, Report under PHRD Grant No TF 025522, NRECA International
1999.
Inversin, Allen R.: Reducing the Cost of Grid Extension for Rural Electrification, ESMAP Report 227/00,
2000. Report concerning factors that affect cost of distribution networks prepared by NRECA Int., experiences
and advice based on low-cost initiatives from mainly North and South America and Bangladesh.
Larsson, Lars and Ronnback, Nils: Cost-effective Electrification: A Study in the Wino area Tanzania, Masters
Thesis, Karlstad University, 2002.
McLaren, B.W.: Study to Develop Lower Cost MV Transmission and Distribution Systems on Single Wire
Earth Return Techniques (SWER) in Tanzania, Paper, Part of SIDA Commissioned Study, Eskom, 2002.
National Electricity Regulator – South Africa, Lighting up South Africa 2002, Annual Electrification Program
Progress Report, NER 2003.
Shah, Tushar and Tewari, D.D.: An Assessment of South African Prepaid Electricity Experiment, Lessons
Learned, and their Policy Implications for the Developing Countries, Elsevier Science Ltd, 2002.
Smith, Nigel: Low-cost Electrification – Affordable Electricity Installation for Low-income Households in
Developing Countries, Working Paper, Intermediate Technology Publications, 1998.

91
Sprei, Frances: Characterization of Power System Loads in Rural Uganda, November 29, 2002.
Stevens, R. and Sokopo, I.: Effective Rural Electrification – The Eskom Distribution (South African) Experience,
Paper, 2000.
Tulloch, J.: Low-cost Systems for Distribution, Paper prepared for EdM Mozambique, 2000.
Internet sources
Sustainable Control Systems Ltd, Technical and Application Overview, www.scs-www.com, 2000.
Cunningham, Brian, Gorman, Michael, Werhane, Patricia: Eskom and the South African Rural Electrification
program, School of Engineering & Applied Science at the University of Virginia
http://repo-nt.tcc.virginia.edu/ethics/cases/eskom/eskom_case_index.htm
ANNEX 1: LITERATURE


I.C. Davies
Annex 2
Mainstreaming Low-costInstallations and ElectricityDistribution NetworksReview of electrification for low-income areas“Appropriate Engineering”


95
The term “Appropriate Engineering” describes an approach to “low-cost” technologies rather than a specific
technique or system. The technologies previously described, namely: MALT, SWS and SWER are very
specific designs that may be applied to any network but there are limitations to each of these technologies.
MALT or four-wire metallic earth can be applied to an entire network but as noted by Tunisia, all the existing
networks have to be changed to the four-wire system and this may be impractical or too expensive to apply
where there is a substantial, existing network.
SWS is limited to transmission lines and, obviously, all new transmission lines should be constructed to
accommodate SWS. However, it may be impractical to construct SWS on existing lines unless there are two
or more parallel lines and one line can be switched off during the construction of SWS. A single transmission
line, and this is most often the case in developing countries, cannot easily be isolated long enough to convert
to SWS.
SWER is an excellent method where there are long lines in rural areas serving loads of limited growth.
Indeed, vast areas of both New Zealand and Australia have been successfully served for over 40 years by
this method. The method is not applicable to mass electrification in peri-urban and urban areas due to the
limited line capacity.
“Appropriate Engineering” looks at existing networks, the design, the materials used, the methods of
construction, benefits of marketing and a whole range of issues and these enable lower cost networks to be
constructed without changing the basic concept.
Much of Africa (especially former colonies) has three-wire MV networks and four-wire LV networks. Where
there was British influence, the standard MV are 11 kV, 22 kV and 33 kV and the most common are 11 kV
and 33 kV. Where continental Europe influenced the power network, the voltages tend to be 10 kV, 20 kV
and 30 kV of which 10 kV and 30 kV are most commonly used. Most LV networks operate in the range of
380-415 V. Almost all networks are 50 hertz. Clearly, it is impractical to change many of these networks
back to a four-wire metallic return, MV system in order to apply the Tunisian solution.
1. Introduction

“Appropriate Engineering”, as described in the subsequent chapters, therefore, refers specifically to three-
wire MV networks and four-wire LV networks as these are the ones most commonly in use. However, the
methods can be applied equally well to any electrical distribution system.
SUB-SAHARAN AFRICA: INTRODUCING LOW-COST METHODS IN ELECTRICITY DISTRIBUTION NETWORKS
96

Design
Electrical utilities, especially vertically integrated national utilities, love standard designs. These standard
designs evolve over many years and tend to incorporate solutions to all the problems that have been
experienced, no matter where the network was installed. This is a “one-size-fits-all” policy that can be rolled
out by junior staff members without reference to, or understanding of, the engineering and reasoning that
went into the design. As a result, almost all networks are substantially overdesigned and can carry several
times the actual power required.
Utilities like to simplify their problems and, consequently, any and every problem, wherever it occurred,
creates a change to the “standard” design so that the problem will not recur. This means the networks are
suitable for the desert, grassland, forests, coastal and polluted regions irrespective of the actual site conditions.
This “standard design” approach results in higher costs than is necessary. Costs are further exacerbated by
failure to understand and apply the loading factors applicable to developing country networks. In one
example of a mass electrification scheme, the load was assumed to be 350 kWh per month and the
construction cost estimated at US$450 per connection. When the cost rose and the real average consumption
came in at 90 kWh per month, the scheme was financially doomed. In this case, it is doubtful that the
operating and maintenance costs can be paid out of the profit on sales, let alone the interest on capital and
repayment of the investment. Such schemes may be good social works, but they come at a very high price
and may be unsustainable as they require ongoing subsidies.
Load Considerations
Network cost reduction starts with good design based on an accurate knowledge of the actual load flows and
consumption. There is enough experience and examples of developing country electrification for these
values to be known to all situations. Typically, a network with single-phase, 60 Amp connection to each
consumer can be expected to have an ADMD of 0.4 to 0.7 kVA. This can be compared with the “standard”
design level of 2.5 to 3.5 kVA and it is obvious that applying load levels four to five times above reality will
cause overdesign all the way back up to the network. This will affect line sizes, voltage drop calculations,
transformers and switchgear capacity.
97
2. Description of “AppropriateEngineering” Methods

SUB-SAHARAN AFRICA: INTRODUCING LOW-COST METHODS IN ELECTRICITY DISTRIBUTION NETWORKS
98
The next argument applied by the “standard design” brigade is that the network must allow for growth and
nobody wants to keep going back and adding to the network. This is the “design construct and forget” policy,
the direct result of which is that networks never ever pay for themselves. Then everyone (quite correctly)
perceives that electrification, as a bottomless pit, continuously calls for additional funding.
One solution is to design the network for the correct, actual load flows and design in such a way that it can
be upgraded easily, as and when the load increases. The method for doing this is to consider each transformer
zone and design the network to allow for additional transformers to be inserted as the need arises. Careful
design ensures that the LV line lengths are reduced when this technique is applied, leading to reduced losses
and better voltage regulation. Another method is to provide MV single-phase to low load areas but to design
the network so that it may easily be changed to three-phase MV by the addition of a single wire. This wire
can be added to correctly sized and pre-drilled poles. The same may be done with the LV network.
This means that the network is designed for minimal cost and when it needs to be upgraded there will be
good revenue flow and much of the upgrade cost can be financed out of cash flow. This is a business-
oriented approach, focusing on minimal investment cost for maximum return. It is not a typical national
industry approach. However, there is no reason why the electrical utility industry should not strive to contain
costs and optimize returns in the same way as every other business venture.
Taking each of the components that comprise a network in turn, the following ideas can be helpful in
reducing costs.
Transformers
Transformers are one of the big cost items in any network and in many developing networks they are
operating at a fraction of their design output and do so for their entire life. This is a total waste of money.
Transformers should be closely sized to the actual load flows and, in some instances, it may be beneficial to
consider single-phase transformers. These transformers can be replaced later with three-phase transformers
and the lines upgraded from single-phase to three-phase as suggested previously. Transformers may be
overloaded for quite considerable periods of time without any harmful effect provided the temperature rise
is controlled. Utilities tend to put LV circuit breakers on the output of transformers and this limits the ability of
the transformer to operate under overload conditions. An alternative method is to put oil temperature
probes in the transformer and trip the output of the transformer before the oil temperature exceeds the
design level. In this way, the short-term overload capacity of the transformer is utilized to provide the
network with the required power at minimal cost during peak consumption.
Poles
The traditional pole design has cross arms on the top of the poles. This creates unnecessary wind loading at
the top of the pole and a large number of components that increases cost. Modern designs use post-top

99
insulators fixed directly to the side of the pole and there are no cross arms (see Picture A 2.1). This type of
construction, using porcelain or cyclo-aliphatic resin isolators, improves the impulse withstand voltage of the
line. Typically, an 11 kV line impulse voltage rises from 75 kV to 965 kV.
Pole-mounted transformers should be mounted on a single pole and the typical, traditional design using
three poles dispensed with (see Picture A 2.2).
ANNEX 2: DESCRIPTION OF “APPROPRIATE ENGINEERING” METHODS
Picture A 2.1: 22 kV Rural Line. (Traditional Design on the left, New Design on the right)
Picture A 2.2: The transformer on the left is 50 kVA and the one on the right 100 kVA

SUB-SAHARAN AFRICA: INTRODUCING LOW-COST METHODS IN ELECTRICITY DISTRIBUTION NETWORKS
100
Conductors
Utilities like to standardize on 50 mm2 and 100 mm2 conductors but, as pointed out previously, the conductors
should be sized for the actual load conditions and smaller conductors used wherever possible. The only
exception to this should be where there is a high incidence of lightning strikes and there is a danger of
smaller conductors being burned off during such strikes.
House Connections
Traditional methods provide a circuit breaker with a protective housing mounted on the pole and a cable
leading to the house. The expensive circuit breaker and its housing may be replaced by a fuse or even a
piece of fuse wire and the cable to the house should be an aerial conductor of flat twin and earth construction
(dumb-bell) cable. House connections should always be of sufficient capacity to allow productive use. Most
consumers will use a small portion of the capacity, but any consumer should be able to draw enough for
productive use. A 60 Amp single-phase supply is the recommended minimum. The low ADMD should be
applied to the network, not to the house connections.
Ready Boards
A ready board is a distribution board that acts as a termination for the incoming supply from the utility. The
ready board comes complete with circuit breakers, socket outlets and a light and this effectively forms a
starter pack for new household wiring system. Provision of a ready board means a huge cost saving for the
householder, as he does not have to install fixed wiring in his house or seek inspection from the utility for his
installation.
There are benefits for the utility company, as the responsibility of the utility company ends at the ready
board.
This means that structures, that would not normally be approved for electrical installations, can now become
part of the network, thereby increasing the consumer base and reducing the average cost per connection.
Example from Swaziland
In 2003, Swaziland Electricity Board was trying to find ways of reducing the cost of extending electricity torural communities. Swaziland was already applying many of the techniques described under “AppropriateEngineering”, but the cost per connection was still very high due to long lines and a few consumers perkilometer. A major problem was that Swaziland Electricity Board did not wish to provide electricity for anyhouses that were not constructed out of approved materials such as brick or stone with tiled or corrugatediron roofs. This meant that more than 50 percent of their potential consumers could not be provided withelectricity. By introducing ready boards, the Swaziland Electricity Board was able to reduce the average costper connection by more than 50 percent as they could now access twice the number of consumers.

101
Meters
Prepayment meters are promoted as the solution to non-payment as well as providing cash upfront to utility.
This is the sales story and the buyer should inform himself/herself about the full picture before committing
to prepayment meters. Problems that have been experienced with prepayment meters are (a) short lifespan,
(b) easy bypassing by the consumers, (c) high initial costs, (d) cost of vending machines and placing enough
of them (especially in rural areas) to be within the five km norm for each consumer, (e) unrecorded token
sales by other nearby utilities that work on both networks. This does not mean that prepayment meters
should not be used, but it is essential that the true, total cost of the meter, is fully understood by the purchaser.
If the intention is to address the social problem of non-payment by using prepayment meters, then expect to
be disappointed. Socials problems are rarely resolved by technical solutions.
Credit meters have other problems such as bill delivery and cash collection. Another option is to provide an
unmetered supply with a fixed monthly charge and limited capacity.
Whichever option is selected, the utility needs to take account of the full monthly costs of the meters. If the
meter life is less than the depreciation period, then the replacement cost must also be factored into the
network viability. As credit meters are robust, show true reflection of usage, (compared to a fixed rate) and
are about half the cost of a prepayment meter, it is worth looking at ways in which the apparent disadvantages
of these meters can be addressed. Normally, there will be a process of meter reading, posted or delivered
invoices and a collection point at which payments can be made. Savings can be achieved if the meter
readers are local residents paid on a commission basis. The same person can issue bills either through a
central billing system or using point-of-sale equipment. The utility involvement is then limited to an audit
function. The same person could also be the eyes and ears of the utility and would be able to provide
specific information about first line maintenance and consumer complaints. All of this reduces monthly costs
and improves viability.
Fixed capacity supplies such as load limiters tend to stifle productive use. Some African networks have been
constructed with 2.5 Amp load limiters (insufficient to boil a kettle) and the result has been zero improvement
in economic activity and unviable networks.
ANNEX 2: DESCRIPTION OF “APPROPRIATE ENGINEERING” METHODS


Utilities are able to draw on a number of modern technologies that can make their life easier and help to
reduce costs.
Global Positioning Systems
Hand-held GPS units can provide every component including poles, transformers, consumer take-off points,
meters and switchgear with a unique GPS address. This information can be captured in the field on a hand-
held unit, brought back to the office and downloaded to a PC and the actual network may then be drawn
using software provided within the PC. Positions of all potential new consumers can be captured in a similar
way.
Network Design Software
Several packages are available which enable the data from GPS positioning to be incorporated directly into
the software program and it makes it very easy to calculate load flows, voltage drops and overall network
design and optimize the design to the actual layout on the ground.
Consumer Database
The consumer database is the most vital piece of information for the utility and must be accurately maintained
at all times. By providing a unique GPS address for each consumer, a great deal of confusion is avoided and
far more accurate records can be kept. This is especially true for rural networks where there may be no
street address, post office, banks and few or no maps.
Asset Register
In a similar way, the information from the GPS mapping can be incorporated into the asset register and
every asset will then have its own unique GPS address.
103
3. Reduce Costs UsingModern Technology

SUB-SAHARAN AFRICA: INTRODUCING LOW-COST METHODS IN ELECTRICITY DISTRIBUTION NETWORKS
104
Billing System
The information from the consumer database can then be incorporated directly into the revenue billing
system and coordinated with meter numbers. In conventional systems, the consumer database and the
billing system are frequently not generated from the same data source and this leads to errors and failure
to invoice electricity that has been distributed. This may cause a significant loss of revenue.
Mapping
Utilities have considerable difficulty expanding into remote regions due to lack of accurate maps and accurate
mapping information. Today, useful maps are available from satellite photography but they tend to be
expensive and show insufficient detail. If the country has been mapped using a Geographic Information
System (GIS) then this will provide excellent maps for the utility company. However, quite often this information
is not available and the utility company has to allow for mapping using aerial photography. This can be
transferred onto PCs and adequate maps for the utility thereby generated. If and when a GIS comes along,
the information can then be fitted into the GIS. Whatever method is used, utilities have to include in their
budgets mapping expenses as a direct cost of increasing access to electricity.
Construction
One of the major causes of high construction costs is the use of centralized labor, centralized depots and the
need to transport both personnel and material over long distances to new construction sites. A more cost-
effective strategy is to provide training to local personnel. Initially, they can be trained to carry out final
connections to the consumers and installation of the meter. Next time around, the successful entrepreneurs
can be trained to do LV construction and, eventually, can graduate to MV construction. These trained
personnel can bid for contracts for construction on a competitive basis and will employ local labor in their
construction teams.
There are four distinct advantages of this approach. First, local people take ownership of the new network
and benefit directly from the construction of the network. Second, labor costs and transport costs for labor
are kept to the minimum. Third, cash is injected into the community and this kick-starts economic activity and
helps the community to afford the electrification network. And fourth, local people receive training in all
aspects of electricity distribution including safe use and handling of electrical equipment.
It has been noted that communities that take ownership of the electrification process are more likely to pay
for the service, especially if it is explained to them that their failure to pay will result in delays in connection
to the rest of their community. Vandalism and theft is also minimized. In a committed community, payment
levels of above 98 percent are normal.

105
The utility should make it a key strategy to care for and respect the community, assist them with the safe use
of electricity and help them to develop and improve all aspects of their environment.
Conclusion
Practical experience from networks constructed in Africa has shown that application of the above strategies
can lead to a 50 percent reduction in construction costs using conventional networks without sacrificing
quality of supply, quantity of supply or safety.
ANNEX 2: REDUCE COSTS USING MODERN TECHNOLOGY


I.C. Davies
Annex 3
Review of Electrification forLow-income AreasExamples from Southern Africa


109
In 2004, South Africa had a population of about 40 million with a density of 33 people per sq km. The mass
electrification program had been in progress since 1994 and, by 1999, access had increased from 36
percent to 68 percent. Approximately, 4.5 million connections were made during the 14-year period
between 1990 and 2004. Eskom, a US$200 million company, generates 95 percent of all electricity in
South Africa. Until 1994, local municipalities (with one or two exceptions) carried out all distribution. During
1994, Eskom launched its vision of “Electricity for All” and mass electrification commenced at a rate of
approximately 450,000 connections per year. About two-thirds of these connections were made by Eskom
and the remaining one-third was shared over 250 local municipalities. By the end of 2004, the total
construction cost exceeded US$1.8 billion. The period from 1994 to 1999 was known as the National
Electrification Program Phase 1. The Development Bank of Southern Africa (DBSA) evaluated this phase
in 2001.
1. Introduction

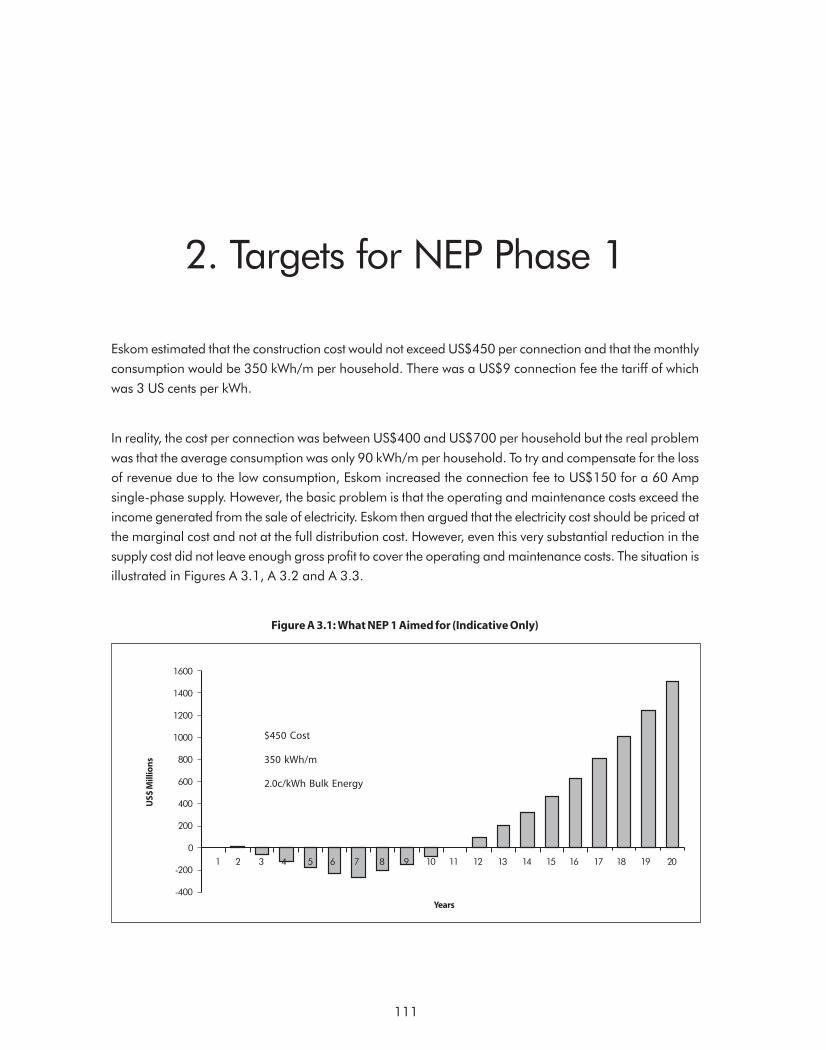
111
Eskom estimated that the construction cost would not exceed US$450 per connection and that the monthly
consumption would be 350 kWh/m per household. There was a US$9 connection fee the tariff of which
was 3 US cents per kWh.
In reality, the cost per connection was between US$400 and US$700 per household but the real problem
was that the average consumption was only 90 kWh/m per household. To try and compensate for the loss
of revenue due to the low consumption, Eskom increased the connection fee to US$150 for a 60 Amp
single-phase supply. However, the basic problem is that the operating and maintenance costs exceed the
income generated from the sale of electricity. Eskom then argued that the electricity cost should be priced at
the marginal cost and not at the full distribution cost. However, even this very substantial reduction in the
supply cost did not leave enough gross profit to cover the operating and maintenance costs. The situation is
illustrated in Figures A 3.1, A 3.2 and A 3.3.
2. Targets for NEP Phase 1
Figure A 3.1: What NEP 1 Aimed for (Indicative Only)
1600
1400
1200
1000
800
600
400
200
0
-200
-400
US$
Mill
ion
s
$450 Cost
350 kWh/m
2.0c/kWh Bulk Energy
1 2 3 4 5 6 7 8 9 10 11 12 13 14 15 16 17 18 19 20
Years

SUB-SAHARAN AFRICA: INTRODUCING LOW-COST METHODS IN ELECTRICITY DISTRIBUTION NETWORKS
112
Figure A 3.2: What NEP 1 Achieved (Indicative Only)
Figure A 3.3: NEP 1 Adjusted for Marginal Costs (Indicative Only)
0
-500
-1000
-1500
-2000
-2500
-3000
-3500
-4000
US$
Mill
ion
s
$400-700 Cost
90 kWh/m
2.0 c/kWh Bulk Energy
1 2 3 4 5 6 7 8 9 10 11 12 13 14 15 16 17 18 19 20
Years
200
0
-200
-400
-600
-800
-1000
-1200
US$
Mill
ion
s
$400-700 Cost
90 kWh/m
0.3 c/kWh Bulk Energy
65% Payment Levels
1 2 3 4 5 6 7 8 9 10 11 12 13 14 15 16 17 18 19 20
Years

113
In 2001, DBSA conducted an evaluation of eight networks that had been constructed during NEP Phase 1.
A total of 17 percent of all the connections made during this period were surveyed.
DBSA reported that there were five lessons emerging from its survey.
Lesson 1
The effectiveness of an institution’s performance with respect to electrification is independent of the institutional
structure, and the NEP achievements indicate strength in diversity.
Lesson 2
Most electrification is only financially viable with significant investment subsidies, and even then some of the
networks need subsidies for subsequent operations.
Lesson 3
A wide range of technical alternatives for the electrification program have an important role in reducing the
cost of electrification. These include the feeder technology materials, capacity of the supply available to
consumers, metering and design standards.
Lesson 4
Successful electrification requires as much focus on meeting community needs as on technical and financial
issues.
Lesson 5
Achieving the desired impacts of electrification requires a broader approach to setting targets in terms of
benefits.
ANNEX 3: TARGETS FOR NEP PHASE 1

SUB-SAHARAN AFRICA: INTRODUCING LOW-COST METHODS IN ELECTRICITY DISTRIBUTION NETWORKS
114
The report also found that:
a) Most networks were not financially viable or sustainable;
b) There was little economic activity generated by electrification (this was largely due to the practice in
some areas of using 2.5 Amp connections);
c) Prepaid metering did not solve the problem of non-payment as it has a short lifespan and is expensive;
and
d) Basic information was not available in many cases. There was no ring fencing of costs in the Eskom
areas.
DBSA recommended the following strategic guidelines for the implementation of NEP Phase 2:
a) Diversity of institutional approach is a strength, which should not be lost in NEP Phase 2;
b) Clear, upfront financial planning of NEP Phase 2 is critical, identifying funding sources and subsidy
levels;
c) The goals and outputs of NEP Phase 2 need to be defined at the outset and log frame or similar
planning framework;
d) Further optimization of costs and maximization of benefits is possible and necessary for NEP Phase 2;
e) Meeting community needs must be an integral focus within the NEP Phase 2 electrification process;
and
f) Improved data collection and reporting is required for NEP Phase 2.
The conclusion that can be drawn from this report is that this is not an affordable model for electrification in
Africa and if the “powerhouse” of Africa has these problems what hope is there for the rest of Africa? Based
on this example, mass electrification is unaffordable for consumers, utilities and governments throughout
Africa.

115
Fortunately, not all the electricity networks constructed in Southern Africa have shown such a poor rate of
return. Middleburg, a small town in Mpumalanga, has achieved 100 percent electrification and has a
payment level of 98 percent. A second town, Kimberly, in the Free State, also makes a profit from its
electrification process. In Northern Namibia, a private company, Northern Electricity turned around a loss-
making utility in a very short span of time. In Mpumalanga in South Africa, a joint venture company called
the Transitional Electricity Distributor (TED) started operation in 1990 with 5,000 connections in peri-urban
and rural areas. In a space of less than 10 years, it made 90,000 connections and was one of the companies
evaluated in the NEP Phase 1 Report (Report Number 8).
All the above examples can be considered to be viable and sustainable electrification networks.
3. Other Experiences ofAfrican Networks


This was a joint venture between the local community, represented by an independent trust (The Lowveld
Electricity Trust), and Eskom, each having a 50 percent shareholding. During the first four years of its
existence, TED expanded the network using Eskom standards at a high average cost per connection and
charging a higher tariff than the national domestic tariff.
When Eskom commenced their mass electrification program, it became apparent that new connections
would be made on the borders of TED and these new connections would receive electricity at a substantially
lower tariff than charged by TED. TED was faced with a choice, either cease expansion or find ways of
reducing costs and compete with Eskom on an equal footing at the same tariff.
The Board of Directors of TED decided on a three-pronged approach:
a) Apply to the DBSA for a reduced interest rate for electrification:
In this they were unsuccessful. Despite the fact that DBSA was lending money at 7 percent for water
projects; they insisted that electrification projects should pay 12.5 percent.
b) Reduce the cost of management of the company:
Eskom was managing the company for TED. It was pointed out that their charges for management
were very high in comparison to the size of the company. Moreover, Eskom was receiving full payment
for electricity consumed by TED at the rate sold to local municipalities, whereas Eskom was applying
the marginal cost to its electrification ventures. Eskom agreed to reduce their management fee to
10 percent of the cost of electricity sold to TED.
c) Reduce the cost of construction:
After discussion with the engineering consultants responsible for the network design and construction,
it was agreed that every effort would be made to reduce costs. The concept of “Appropriate Engineering”
was brought into play and, within six months, the cost per connection had been cut by an average of
50 percent. “Appropriate Engineering” methods are described in the next section.
By the time the DBSA evaluated the performance of TED in 1999, they found a dynamic company that was
meeting its bills, expanding rapidly and had payment levels of 95 percent.
117
4. DBSA Evaluation of TED


As a result of the actions taken to reduce costs and by adopting a market-driven approach (initially targeting
those more able to pay in the community), TED was able to double its target for new connections from
60,000 in 10 years to 120,000. There was good commercial activity. This might have been better had
there been more help from local development agencies. There was US$1.7 million cash in the bank and
there were no overdrafts or outstanding debts. In fact, the company was in serious danger of making a
profit!
Local and international bank assessment of the state of TED at this time indicated that they viewed it as a
future “cash cow” with investment opportunities. Four of these banks indicated, in writing, their willingness
to invest equity in such a venture.
119
5. Results of the Actions Takenby TED (1999)


“Low-cost” viable networks exist and are well known and understood.
They are viable and sustainable even for rural areas.
They need to be “nursed” financially for about eight years and, almost certainly, will require some degree
of subsidy for that period of time. Thereafter, they may well become self-supporting.
This is a strategy that can change lives, create wealth and improve economic activity in a relatively short
span of time.
121
6. Conclusions fromSouthern Africa


1. National Electrification Program (NEP) 1994-1999, Summary Evaluation Report, Department Minerals
and Energy, Republic of South Africa, November 2001.
2. National Electrification Program (NEP) 1994-1999, Report Number 8 DBSA, 1999 Process and
Preliminary Impact Evaluation of Bank investment in the Transitional Electricity Distributor, TED (Pty)
Limited.
3. Departments of Minerals & Energy, 1998, White Paper on Energy for Energy Policy for Republic of
South Africa.
4. Eskom Annual Reports 1994-2004, Johannesburg.
5. National Electricity Regulator Statistical Report on the NEP, National Electricity Regulator, Johannesburg.
6. NER Lighting Up South Africa, 2000 National Electricity Regulator, Johannesburg.
7. Winkler, H., Qusa and Gaunt, T.: NEP Phase 1 Report Number 1 Mavhungu, National Electrification
Program Evaluation Curator Kimberly, 2001.
123
7. References


I.C. Davies
Annex 4
Review of Electrification forLow-income AreasViable Networks


127
1. Energizing Rural TransformationConcept
Energizing Rural Transformation (ERT) is a powerful concept which was developed by the World Bank. The
concept aimed at promoting economic activity using a package of electrical, telecommunications, health
and education. ERT consists of three key elements:
1. A smart subsidy;
2. Affordability;
(a) for consumers
(b) for utilities
(c) for governments
3. Low-cost construction.
Smart Subsidy
The smart subsidy is a one-off contribution to capital cost only. There is no subsidy for running costs. The
capital subsidy contribution should buy down the non-viable portion of the investment. The remaining balance
should be a viable investment in its own right.
Affordability
Consumer affordability survey
The affordability survey is a key ingredient for any rural electrification program. The survey establishes the
present energy expenditure per household and assesses if the conversion to electricity will add or reduce
the monthly energy cost.
The survey should be carried out by trained local people in the mother tongue of the people being surveyed.
There is always suspicion that such surveys may be a clandestine political or tax investigation and the
surveyors have to be trained to deal with this. The survey should cover at least 100 households in the area

SUB-SAHARAN AFRICA: INTRODUCING LOW-COST METHODS IN ELECTRICITY DISTRIBUTION NETWORKS
128
considered for electrification. In Africa, the main forms of household energy purchased prior to electrification
are:
• Charcoal for cooking and sometimes space heating;
• Kerosene for cooking and lighting;
• Candles for lighting;
• Dry cell batteries for radio, music centers, lamps; and
• Car batteries for TV and lighting.
Dry cell batteries are often a high proportion of household energy expenditure and accurate information is
essential. In Africa, south of the Sahara, typical household energy expenditure is US$15 to US$30 per
month. Normally, about one-third is spent on cooking and the balance can be replaced easily by electricity.
In time, some of the households will convert to some form of electric cooking but the initial demand is likely
to be for lighting and small domestic appliances such as radio, TV, VCR/DVD and, eventually, fridge or kettle
or small cooking appliances. Space heating is usually the last item on the list and is rarely a significant load
due to the mild climatic conditions.
The survey should establish the quantum of each energy source used, on an average, per month, by each
household i.e., how many bags of charcoal, how many liters of kerosene, how many candles, how many
dry cell batteries and of what sizes, how often car batteries are charged, etc. The survey should then
establish the cost paid for these items from the sources used by the households.
The survey must cross-check the answers from the households with other sources such as the local shops.
For example, if the surveyor records 30 candles per month per house in a village of 40 houses and, then,
finds that the local shop does not stock candles because there is “no demand”, then the survey is probably
wrong. Surveys of income per capita tend to indicate that energy expenditure is a high proportion of
income. It has to be remembered that, typically, many members of a household may contribute to the
energy expenditure and income per capita figures may be misleading about the amount of cash available.
Rural communities in Africa tend to be cash-strapped and income per capita does not reflect poverty levels
accurately where the lifestyle includes bartering. The point is that low income levels and disproportionately
high expenditure on energy reflects the reality and choice of rural communities.
The expenditure on energy, for all items except cooking, should be compared with the cost of 150 kWh of
electricity. Ideally, it will cost less for electric power than fossil fuels and batteries. If it is more expensive,
then this will indicate that the tariff for electricity is uncompetitive. This is unlikely because of the “lifeline
tariff” applicable in most countries. It may be expected that the survey should show that:
1. 150 kWh/m electricity is about the same cost as the average fossil fuel expenditure.
2. Electricity is easily affordable for 20 percent-30 percent of households and will save them cash.
3. Electricity is welcomed as it is labor-saving and more user-friendly.

129
ANNEX 4: ENERGIZING RURAL TRANSFORMATION (ERT) CONCEPT
Domestic Sales and Tariffs in Zambia
The Zambian tariff for domestic users is probably the cheapest in the world as a result of which the averagedomestic consumption in Zambia is 500 kWh/m at a cost of under US$10. The same consumption inEurope or America would cost between US$35 and US$50. In Zambia, the “lifeline tariff” applies to thefirst 300 kWh and this revenue does not cover the cost of production and O&M. Not surprisingly, theZambian Electricity Supply Company Limited (ZESCO) has been unwilling to increase access to electricity asevery consumer that they add to the network costs them money and requires an ongoing subsidy.
The survey results will indicate to the utility company the target that they should aim at for electrification of
the area, what average consumption is likely, the capital cost constraints and whether the project will be
viable.
Utility and Government Affordability
It is imperative that utilities should be able to carry out electrification in peri-urban and rural areas. Too often
the cost of operating and maintaining the network is greater than the profit received from the sale of
electricity due to low consumption. If the cash flow does not exceed the running costs then increasing access
is simply unaffordable for the utility company. In this event, governments have to step in and subsidize the
utility and, eventually, this drain on the economy becomes unaffordable even for governments. It is, therefore,
essential that the network be designed, constructed and operated in such a way that it is viable and sustainable.


131
2. Network Viability
A project financial model can help to determine, in advance, whether or not the project will be viable. The
model should show all the variables and should be able to illustrate the sensitivity of each variable. It should
also be graphic and easy to understand.
An example of such a project model is provided in Appendix A. This example is taken from an ERT project
in Tanzania and shows the initial conditions proposed by the utility. This clearly shows that the project is not
viable and requires a very high level of subsidy. After discussion with the utility and its acceptance of the
principles of “Appropriate Engineering”, the project became viable and profitable. This is shown in the final
example in Appendix B.
In order to create viable networks, much more is needed than low-cost construction techniques and changing
some standards. What is required is a total low-cost package that will address the initial construction costs
and the ongoing and operating maintenance costs, boost consumption and improve profitability. The package
needs to address each of the following items.
Construction Costs
Every effort has to be made to apply the low-cost techniques described in this report and any other techniques
that may be applicable under the circumstances. In addition, it is vital that local labor be trained and
employed in the construction process as this will boost the local economy, promote entrepreneurship and
improve economic conditions within the community.
Operating and Maintenance Costs
After construction, there will be a pool of trained people residing within the community and these people
can be used for first-line O&M of the network. If there is a problem in the network, a trained local person
can indicate to the maintenance team exactly what components need to be transported to the site in order
to fix the problem. This reduces maintenance costs and improves efficiency.

SUB-SAHARAN AFRICA: INTRODUCING LOW-COST METHODS IN ELECTRICITY DISTRIBUTION NETWORKS
132
An Example of Ready Boards and Load Limiters from Malawi
The Electricity Supply Company of Malawi (ESCOM) embarked on a low-cost experiment in urban areas inwhich consumers were provided with ready boards and a load limiting supply. In a short span of time, anumber of consumers complained that their supply was not adequate and reapplied for a larger supply.This caused additional costs for ESCOM and the experiment was not considered to be a success. ESCOMMalawi will probably continue with ready boards but the supply will be metered, either through prepaidmeters or conventional meters.
Metering
A decision has to be made whether to go for conventional metering, prepaid metering or load-limiting
breakers.
Other kinds of metering such as point-of-sale billing in which conventional meters are read and a bill issued
on the spot from a hand-held computer, could be considered. Whatever system is used, it is most important
that the productive use of electricity is not stifled. Some networks have been constructed using 2.5 Amp
suppliers in the hope that this will limit construction costs. In reality, all that happens is that the community
cannot make productive use of electricity and consumption levels are so low that the network will never pay
for itself. A small percentage of consumers will use electricity for all different sorts of businesses. The utility
should encourage this aggressively as every kWh sold makes a profit for the utility.
Marketing
There are two basics ways of providing increased access to electricity.
One is the “blanket” approach in which electrical supplies are taken to every house in the village or every
house in a region. The advantage of this method is that the average cost per connection is spread over all
the available consumers but the disadvantage is that many of the consumers simply cannot afford the
service. The average revenue per consumer is then too low to pay for the network.
The second method is to market the network to consumers who are willing to pay for it. In this concept, the
utility asks consumers to fill out application forms for electricity and to pay connection fees. Each group of
applicants is then assessed in terms of network cost, number of consumers to be served and viability of the
project. Projects are then prioritized into those most viable for the utility and discussed with the community.
This method targets the most affluent consumers in the region and once the network is constructed, the
average revenue per consumer will be high and the network will pay for itself. Other less affluent consumers
can then be connected to the existing network as time goes by.

133
The Story of Mangwene
Mangwene is a typical rural Southern African village consisting of about 100 houses in a linear developmentalong both sides of an arterial road. The electrical utility company asked residents if they wished to applyfor electricity and 30 applications were received. A combined MV and LV line was run down the center ofthe village and 30 consumers were connected along with the local school, the clinic and two Governmentoffices. One year later, the utility received a further tranche of money from the bank and asked theresidents if any more would like to apply for electricity. To their astonishment, another 30 people appliedfor electricity and this immediately raised the question why had these 30 people not applied the previousyear? The answer was that the first 30 people had been putting electricity to productive use. One personhad started a welding shop and was making doors and window frames, the local shop now had refrigerationand improved sales. The women of the village had got together and started a sewing group selling clothesfor cash. In the local school, two classrooms had electric light and power and adult education classes werebeing held in the evenings. The local clinic now had electricity and had employed an additional nurse. Asa result, the economic activity of the village had improved. This was the reason that another 30 people feltthat they were now able to afford electricity. This process continued over a period of three or four years untilthe entire village was electrified. It became quite obvious that the economic activity of the village hadimproved significantly with the provision of electricity.
The only way that electrical utilities can make a profit is by selling electricity. The gross profit that they make
is the margin between the selling tariff and the cost of production at the point of sale.
For this reason, electrical utility companies should promote sales actively and aggressively and should
encourage the purchase of appliances which will consume electricity. Utility companies should promote
appliance shops where new or second-hand appliances can be repaired and sold to the local community.
A further aspect of marketing is the marketing of the network. In every community, there are various
community services that can benefit from the provision of electricity. For example, water pumping and
water treatment plants, hospitals and clinics, schools and educational facilities, police stations and security
services, telephone, radio and television services, tourist hotels, agricultural processing and mining. The
utility can market its proposed network by going to each of the potential consumers in the region and asking
them for a contribution in proportion to the benefit that they will receive from the provision of electricity. This
process helps to extend the network much more rapidly than would otherwise be possible and the network
cost is fairly shared amongst all the consumers who will benefit.
Losses
There are technical losses and non-technical losses in every network. Technical losses are caused by flow of
current through conductors and are directly related to the load on the network. Non-technical losses consist
of theft of electricity, by-bypassing meters or illegal tapping from the network. In addition, there are revenue
collection losses that arise when people fail to pay their bills or alternatively, from being billed incorrectly by
the utility. All of these losses directly affect profitability of the project and have to be minimized if the network
is to be viable. Technical losses are purely a function of the network design and loading on the network. The
utility company should monitor technical losses continuously and upgrade the network whenever it is cost-
ANNEX 4: NETWORK VIABILITY

SUB-SAHARAN AFRICA: INTRODUCING LOW-COST METHODS IN ELECTRICITY DISTRIBUTION NETWORKS
134
Connection Fees in Tanzania
In Tanzania, the expenditure on existing energy sources for people without electricity was estimated to bebetween US$10 and US$30 per month. The connection fee required by TANESCO for a domestic connectionis US$200. This fee is quite clearly unaffordable even though the Board of TANESCO allowed this fee to bespread over 12 months. Such a high connection fee discourages so many new applicants that it is likelythat there will be very few connections on any new network that is constructed. This will make the cost perconnection unaffordably high for the utility company. It has been suggested to TANESCO that the connectionfee should be reduced to US$60 and that this amount should be spread over 12 months. TANESCO needsto conduct an affordability survey to confirm that this reduced connection fee will attract enough newconsumers to keep the average cost per connection low enough to be viable.
effective to do so. Non-technical losses require the application of strict financial discipline to ensure that theft
is dealt with promptly and severely. Similarly, meter bypassing or illegal tapping should incur severe penalties.
It has been noted that in communities where the utility has encouraged local participation and has been
prepared to listen to the concerns of the community, theft and vandalism tends to be at very low levels.
There also has to be strict financial discipline.
Consumer Contribution and Connection Fees
Mass electrification will not happen if the consumer contribution or connection fees are unaffordable. One
of the great benefits of the affordability survey referred to previously is that it clearly establishes the capital
contribution and connection fee that can be afforded by the community.
Conversion Costs
It must be remembered that, in addition to paying the connection fee, the consumer also has to wire his
premises, pay an inspection fee and convert or purchase new appliances for electricity.
This is where the concept of the ready board, which provides a single entry point from which power can be
drawn, is such a boon to both the utility and the consumers.
Tariffs
Most countries have a “lifeline tariff” that is very close to, or below, the actual cost of production of electricity.
It is often applicable to between 30 kWh and 50 kWh per month of electricity consumed.
There has to be a balance between affordable and cost-reflective tariffs. Once again, the affordability
survey can indicate the present expenditure on fossil fuels and the proportion of this energy expenditure that
will be replaced by electricity.

135
An Example of Automatic Tariff Adjustments from South Africa
One of the more enlightened decisions taken by the new Government in South Africa was that the liquidfuel price would be adjusted monthly and related to the international oil price and the value of the SouthAfrican Rand. For many years now, the fuel price has been adjusted on the first Wednesday of every monthand fuel price increases directly affects every one and especially those who make use of the extensive taxiindustry in South Africa. Because everybody understands the process and knows that it is going to happenand because the process is transparent and depoliticized, substantial increases have been accepted aspart of daily life.
Utilities depend on the net difference between the supply cost plus O&M expenses compared to the gross
sale of electricity to each consumer. In this equation, the monthly consumption figure is the key to profitability
as, once the “lifeline tariff” consumption has been exceeded, there will be profitable sales.
In many African countries, there is strong political opposition to increasing electricity tariffs. A pattern develops
whereby tariffs are held constant for a relatively long time and, eventually, the viability of the utility becomes
so precarious that a tariff increase becomes imperative. At this stage, the tariff increase has to be so large
that it is very unpopular with the population.
Tariffs have to keep pace with costs or the long-term result will be bankruptcy of the utility. This is especially
important at a time when international fuel prices are rising and many of the cost increases are beyond the
control of the utility company.
Some countries, like Malawi, have introduced automatic tariff increases for costs beyond the control of the
utility company.
ANNEX 4: NETWORK VIABILITY

Project Model, Initial Conditions, please refer to Appendix A
In the project model, all the cells highlighted in yellow are variables. The two cells highlighted in green are
the outputs indicating NPV and the financial IRR. Everything else is calculated. Three graphs are provided
showing profit, cash flow and analysis of sales. The last graph is a display of the income and expenditure of
the utility on a “per household” basis. This is particularly useful as it demonstrates the cash flow, or lack of
it, at source.
All information and calculation of outputs is contained in the first sheet labeled “Assumptions”. Data about
the number and cost of the connections is summarized in the last sheet labeled “Data”.
The project model can be used for each individual project of any size and may also be used to model an
entire mass electrification scheme depending solely on the data used at the input stage. Normally, the
electrification plan would be compiled from a number of projects and each one of these should be modeled
and then prioritized on the basis of descending order of viability. As projects are completed, the transmission
network and the main distribution feeds will have been extended. Subsequent projects should be modeled
using these revised starting points. This helps to reduce the costs of projects that are initially remote from the
grid and uneconomic.
In this example, it is quite obvious that the proposal is far from viable. TANESCO requested a subsidy equal
to 85 percent of the construction cost and the Bank was unwilling to consider such a large subsidy as their
target was 45 percent-55 percent. The cash flow graph indicates that TANESCO was, quite correctly, trying
to keep its cash flow positive.
Apart from the large subsidy, the Bank also had concerns about the connection fee of US$200, as this would
discourage connections and, consequently, TANESCO would not meet the target for the number of houses.
They also felt that the “General Tariff T1” consumption was too high at 500 kWh per month as the present
average for this tariff class was 300 kWh/m.
3. Example from Tanzania

SUB-SAHARAN AFRICA: INTRODUCING LOW-COST METHODS IN ELECTRICITY DISTRIBUTION NETWORKS
138
The Bank and TANESCO held lengthy discussions about each of the variables and how each variable could
be best addressed using the techniques described in this report.
Changes that were made during consultation and reasons for the changes
a) Connection fee
It was proposed that the connection fee should be reduced to US$60. An initial payment of at least
US$25 should be made (to show commitment by the consumer) and the balance paid over six to 12
months.
b) Construction cost
TANESCO estimated US$711 as the average construction cost. It was agreed that if “low-cost”
technologies were applied, this could be reduced to US$650 and this rate would apply to all the
projected 250,000 connections starting in one year time and spread out over four years. Normal
escalation was added to this figure with the passage of time.
c) O&M costs per house per month
It was agreed that by using “low-cost” techniques, the O&M costs per connection per month could be
reduced from US$6.00 to US$3.50.
d) Tariff increase
TANESCO had requested a tariff increase of 18 percent to meet rising costs, largely due to the
drought and fuel price escalation. It was agreed that 17 percent would be sufficient.
e) Commercial consumption, general Tariff T1
This tariff applies to shops and offices and the present average is 300 kWh per connection per month.
It was agreed that this figure would be used rather than 500 kWh/m
f) Losses
Losses include technical, non-technical and revenue not collected compared with the amount billed. At
present, the TANESCO figure is 24 percent and TANESCO indicated that it intended to reduce the
figure steadily to 18 percent over some years. By applying the “low-cost” strategy, TANESCO felt that
it could achieve 16 percent from the start on the project networks.
g) House consumption
TANESCO entered a figure of 45 kWh per household per month for this item but inspection of present
trends indicated that present domestic consumption was at an average of greater than 150 kWh/m.
Accepting that new (more rural) consumers would consume less but that a marketing strategy would
boost consumption, the figure was revised to 100 kWh/m.
h) Subsidy
Once the above changes were made, it was noted that a subsidy of 50 percent (US$325, reduced
from US$650) would be sufficient to provide a good rate for return.
139
Project Model, Final Conditions, please refer to Appendix B
After the agreed changes had been made, it was found that the IRR had improved to over 15 percent.
However, TANESCO would need to find over US$3 million to fund the initial cash flow. TANESCO has been
able to borrow dollar funds locally at commercial rates of 7 percent over 10 years. If the shortfall is entered
as a loan, the project can pay for the loan and still be very viable. It may be that the local banks would need
some encouragement to advance such loans (perhaps in the form of a partial mitigation of risk). But it ought
to be the goal that this type of development is supported by the private sector to the greatest possible extent.
ANNEX 4: EXAMPLE FROM TANZANIA

Appendix
4A
ERT A
pp
en
dix
A A
rush
a Y
EA
RS
12
34
56
78
91
01
11
21
31
41
51
61
71
81
92
0
Typ
e..
....
....
....
..M
ete
r2
00
62
00
72
00
82
00
92
01
02
01
12
01
22
01
32
01
42
01
52
01
62
01
72
01
82
01
92
02
02
02
12
02
22
02
32
02
42
02
5
Ele
ctri
city
Ta
riff
s1
8%
Incr
ease
Inco
me p
er
Connect
ion
Dep
reci
ation
Sale
s to
Consu
mers
Ca
pita
l C
ontr
ibutio
n T
ota
l6
04
.55
Ele
ctri
city
Netw
ork
s30 Y
ears
Dom
est
ic
D1
<2
0kW
h4.1
6 c
/kW
hServ
ice C
hg
eC
ap
ital
Contr
ibution b
y C
onsu
mer
Upgra
din
g o
f N
etw
ork
30 Y
ears
Dom
est
ic D
2 >
20
kWh
12.5
9 c
/kW
hC
on
nect
ion
Fee
20
0.0
0
T1
10.4
0 c
/kW
h1
.86
Dep
osi
t
Ele
ctri
city
Pu
rch
ase
Serv
ice C
harg
e T
I1
.86
TAN
Equity
Contr
ibution (
Cash
)0.0
0 $
Bulk
4.9
c/k
Wh
Gra
nt
Sub
sid
y6
04
.55
TAN
Tota
l C
ontr
ibution
-1,1
28
,83
0.3
4 $
MD
Sub
sid
y Perc
ent
of
Connect
ion C
ost
85
%
Loss
es
incl
ud
ing
RC
Initia
l2
4.0
%Peri
od
Loss
es
incl
ud
ing
RC
Fin
al
18
.0%
5 y
ears
Exp
enditure
per
Connect
ion
Const
ruct
ion C
ost
71
1.2
3
Cash
/Inte
rest
Rate
sO
&M
per
Month
6.0
0N
PV
Fin
an
cia
l-7
59,9
34
ove
r 20 y
ears
at
5.0
0 p
erce
nt
Inte
rest
on B
ank
Bala
nce
s2
.0%
Mete
ring C
ost
s or
Vendin
g C
ost
s per
Month
0.0
0IR
R F
inanci
al
#D
IV/0
!
Oth
er
Exp
en
ditu
re
Inflation
In
dic
es
Sa
les
Tari
ff2
.50
10
0.0
01
02
.50
10
5.0
61
07
.69
11
0.3
81
13
.14
11
5.9
71
18
.87
12
1.8
41
24
.89
12
8.0
11
31
.21
13
4.4
91
37
.85
14
1.3
01
44
.83
14
8.4
51
52
.16
15
5.9
71
59
.87
16
3.8
6
Purc
hase
Tari
ff2
.50
10
0.0
01
02
.50
10
5.0
61
07
.69
11
0.3
81
13
.14
11
5.9
71
18
.87
12
1.8
41
24
.89
12
8.0
11
31
.21
13
4.4
91
37
.85
14
1.3
01
44
.83
14
8.4
51
52
.16
15
5.9
71
59
.87
16
3.8
6
Main
t.,
Ove
rhead
s, F
. A
ssets
2.5
01
00
.00
10
2.5
01
05
.06
10
7.6
91
10
.38
11
3.1
41
15
.97
11
8.8
71
21
.84
12
4.8
91
28
.01
13
1.2
11
34
.49
13
7.8
51
41
.30
14
4.8
31
48
.45
15
2.1
61
55
.97
15
9.8
71
63
.86
Curr
ency
Conve
rsio
n R
ate
1,0
78
Tsh
/USD
INFO
RM
ATIO
N
Analy
sis
per
Connect
ion p
er
Month
Pro
fit
on S
ale
s4
.22
4.6
75
.15
5.6
86
.24
6.8
57
.26
7.6
98
.14
8.6
29
.12
9.4
39
.76
10
.09
10
.44
10
.79
11
.15
11
.53
11
.92
12
.32
17
1.0
6
Op
era
ting
Cost
-6.0
0-6
.00
-6.0
0-6
.00
-6.0
0-6
.00
-6.0
0-6
.00
-6.0
0-6
.00
-6.0
0-6
.00
-6.0
0-6
.00
-6.0
0-6
.00
-6.0
0-6
.00
-6.0
0-6
.00
-12
0.0
0
Net
-1.7
8-1
.33
-0.8
5-0
.32
0.2
40
.85
1.2
61
.69
2.1
42
.62
3.1
23
.43
3.7
64
.09
4.4
44
.79
5.1
55
.53
5.9
26
.32
51
.06
ELE
CTRIC
ITY S
ALE
S :
Dom
est
ic T
ari
ff D
1
Exi
stin
g0
11
,02
31
1,0
23
11
,02
31
1,0
23
11
,02
31
1,0
23
11
,02
31
1,0
23
11
,02
31
1,0
23
11
,02
31
1,0
23
11
,02
31
1,0
23
11
,02
31
1,0
23
11
,02
31
1,0
23
11
,02
3
New
Connect
ions
in Y
ear
11
,02
30
00
00
00
00
00
00
00
00
00
Ave
Consu
mption k
Wh
Gro
wth
0.0
%2
02
02
02
02
02
02
02
02
02
02
02
02
02
02
02
02
02
02
02
0
Dom
est
ic T
ari
ff c
/kW
h4
44
44
44
44
44
44
44
44
44
4
Co
nnect
ion F
ee =
Dep
osi
t2
,20
4,6
00
00
00
00
00
00
00
00
00
00
0
Annua
l In
com
e2
,25
9,6
21
11
0,0
42
11
0,0
42
11
0,0
42
11
0,0
42
11
0,0
42
11
0,0
42
11
0,0
42
11
0,0
42
11
0,0
42
11
0,0
42
11
0,0
42
11
0,0
42
11
0,0
42
11
0,0
42
11
0,0
42
11
0,0
42
11
0,0
42
11
0,0
42
11
0,0
42
4,3
50
,41
6
Dom
est
ic T
ari
ff D
2
Exi
stin
g45 k
Wh/m
01
1,0
23
11
,02
31
1,0
23
11
,02
31
1,0
23
11
,02
31
1,0
23
11
,02
31
1,0
23
11
,02
31
1,0
23
11
,02
31
1,0
23
11
,02
31
1,0
23
11
,02
31
1,0
23
11
,02
31
1,0
23
New
Connect
ions
in Y
ear
11
,02
30
00
00
00
00
00
00
00
00
00
Ave
Consu
mptio
n k
Wh
Gro
wth
8.0
% 5
yrs
25
29
32
37
41
46
49
53
57
60
64
67
70
72
75
78
81
84
87
90
Dom
est
ic T
ari
ff c
/kW
h5.0
% 5
yrs
13
13
13
13
13
13
13
13
13
13
13
13
13
13
13
13
13
13
13
13
Co
nnect
ion F
ee +
3.0
% 1
0 y
rs0
00
00
00
00
00
00
00
00
00
0
Deposi
t (Incl
. A
bove
)
Annua
l In
com
e2
08
,13
84
76
,22
15
40
,96
06
10
,87
86
86
,39
07
67
,94
38
22
,99
28
80
,79
29
41
,48
31
,00
5,2
08
1,0
72
,12
01
,11
4,2
74
1,1
57
,69
31
,20
2,4
14
1,2
48
,47
71
,29
5,9
22
1,3
44
,79
11
,39
5,1
25
1,4
46
,96
91
,50
0,3
69
19
,71
9,1
60
Assumptions

ERT A
pp
en
dix
A A
rush
a Y
EA
RS
12
34
56
78
91
01
11
21
31
41
51
61
71
81
92
0
Typ
e..
....
....
....
..M
ete
r2
00
62
00
72
00
82
00
92
01
02
01
12
01
22
01
32
01
42
01
52
01
62
01
72
01
82
01
92
02
02
02
12
02
22
02
32
02
42
02
5
Genera
l Ta
riff
T1
Exi
stin
g0
1,0
74
1,0
74
1,0
74
1,0
74
1,0
74
1,0
74
1,0
74
1,0
74
1,0
74
1,0
74
1,0
74
1,0
74
1,0
74
1,0
74
1,0
74
1,0
74
1,0
74
1,0
74
1,0
74
New
Connect
ions
in Y
ear
1,0
74
00
00
00
00
00
Ave
Consu
mptio
n k
Wh
Gro
wth
8.0
% 5
yrs
50
05
40
58
36
30
68
07
35
77
18
10
85
08
93
93
89
66
99
51
,02
51
,05
51
,08
71
,12
01
,15
31
,18
81
,22
3
Dom
est
ic T
ari
ff c
/kW
h5.0
% y
rs1
01
01
01
01
01
01
01
01
01
01
01
01
01
01
01
01
01
01
01
0
Co
nnect
ion F
ee +
Dep
osi
t3.0
% 1
0 y
rs2
14
,80
00
00
00
00
00
00
00
00
00
00
Annua
l In
com
e5
49
,85
27
23
,71
37
81
,61
08
44
,13
89
11
,66
99
84
,60
31
,03
3,8
33
1,0
85
,52
51
,13
9,8
01
1,1
96
,79
11
,25
6,6
31
1,2
94
,33
01
,33
3,1
59
1,3
73
,15
41
,41
4,3
49
1,4
56
,77
91
,50
0,4
83
1,5
45
,49
71
,59
1,8
62
1,6
39
,61
82
3,6
57
,39
8
Ag
gre
gate
Ele
ctri
city
Sale
s:3
,01
7,6
11
1,3
09
,97
51
,43
2,6
11
1,5
65
,05
91
,70
8,1
02
1,8
62
,58
81
,96
6,8
67
2,0
76
,35
92
,19
1,3
26
2,3
12
,04
12
,43
8,7
92
2,5
18
,64
52
,60
0,8
94
2,6
85
,61
02,7
72
,86
82
,86
2,7
43
2,9
55
,31
53
,05
0,6
64
3,1
48
,87
33
,25
0,0
29
47
,72
6,9
74
Avera
ge T
ota
l C
on
sum
ers
6,0
49
12
,09
71
2,0
97
12
,09
71
2,0
97
12
,09
71
2,0
97
12
,09
71
2,0
97
12
,09
71
2,0
97
12
,09
71
2,0
97
12
,09
71
2,0
97
12
,09
71
2,0
97
12
,09
71
2,0
97
12
,09
7
Oth
er
Inco
me:
Cap
ital
Contr
ibution b
y C
onsu
mers
00
00
00
00
00
00
00
00
00
00
00
Cap
ital
Contr
ibution f
rom
Sub
sid
y7
,31
3,2
28
7,3
13
,22
80
00
00
00
00
00
00
00
00
00
7,3
13
,22
8
Serv
ice C
harg
e T
11
1,9
91
23
,98
32
3,9
83
23
,98
32
3,9
83
23
,98
32
3,9
83
23
,98
32
3,9
83
23
,98
32
3,9
83
23
,98
32
3,9
83
23
,98
32
3,9
83
23
,98
32
3,9
83
23
,98
32
3,9
83
23
,98
34
67
,66
2
Tota
l O
ther
Inco
me:
7,3
25
,21
92
3,9
83
23
,98
32
3,9
83
23
,98
32
3,9
83
23
,98
32
3,9
83
23
,98
32
3,9
83
23
,98
32
3,9
83
23
,98
32
3,9
83
23
,98
32
3,9
83
23
,98
32
3,9
83
23
,98
32
3,9
83
7,7
80
,89
0
ELE
CTRIC
ITY P
URC
HA
SES :
Dom
est
ic T
ari
ff D
1
Exi
stin
g0
11
,02
31
1,0
23
11
,02
31
1,0
23
11
,02
31
1,0
23
11
,02
31
1,0
23
11
,02
31
1,0
23
11
,02
31
1,0
23
11
,02
31
1,0
23
11
,02
31
1,0
23
11
,02
31
1,0
23
11
,02
3
New
Connect
ions
in Y
ear
11
,02
30
00
00
00
00
00
00
00
00
00
Ave
Consu
mption k
Wh
20
20
20
20
20
20
20
20
20
20
20
20
20
20
20
20
20
20
20
20
Dom
est
ic T
ari
ff c
/kW
h4
44
44
44
44
44
44
44
44
44
4
Tota
l kW
hs
1,3
22
,76
02
,64
5,5
20
2,6
45
,52
02
,64
5,5
20
2,6
45
,52
02
,64
5,5
20
2,6
45
,52
02
,64
5,5
20
2,6
45
,52
02
,64
5,5
20
2,6
45
,52
02
,64
5,5
20
2,6
45
,52
02
,64
5,5
20
2,6
45
,52
02
,64
5,5
20
2,6
45
,52
02
,64
5,5
20
2,6
45
,52
02
,64
5,5
20
Dom
est
ic T
ari
ff D
2
Exi
stin
g0
11
,02
31
1,0
23
11
,02
31
1,0
23
11
,02
31
1,0
23
11
,02
31
1,0
23
11
,02
31
1,0
23
11
,02
31
1,0
23
11
,02
31
1,0
23
11
,02
31
1,0
23
11
,02
31
1,0
23
11
,02
3
New
Connect
ions
in Y
ear
11
,02
30
00
00
00
00
00
00
00
00
00
Ave
Consu
mption k
Wh
25
29
32
37
41
46
49
53
57
60
64
67
70
72
75
78
81
84
87
90
Dom
est
ic T
ari
ff c
/kW
h1
31
31
31
31
31
31
31
31
31
31
31
31
31
31
31
31
31
31
31
3
Tota
l kW
hs
1,6
53
,45
03
,78
3,0
94
4,2
97
,38
34
,85
2,8
15
5,4
52
,68
26
,10
0,5
38
6,5
37
,84
16
,99
7,0
09
7,4
79
,13
57
,98
5,3
68
8,5
16
,91
28
,85
1,7
85
9,1
96
,70
49
,55
1,9
71
9,9
17
,89
61
0,2
94
,79
81
0,6
83
,00
81
1,0
82
,86
41
1,4
94
,71
51
1,9
18
,92
2
Genera
l Ta
riff
T1
Exi
stin
g0
1,0
74
1,0
74
1,0
74
1,0
74
1,0
74
1,0
74
1,0
74
1,0
74
1,0
74
1,0
74
1,0
74
1,0
74
1,0
74
1,0
74
1,0
74
1,0
74
1,0
74
1,0
74
1,0
74
New
Connect
ions
in Y
ear
1,0
74
00
00
00
00
00
00
00
00
00
0
Ave
Consu
mption k
Wh
50
05
40
58
36
30
68
07
35
77
18
10
85
08
93
93
89
66
99
51
,02
51
,05
51
,08
71
,12
01
,15
31
,18
81
,22
3
Dom
est
ic T
ari
ff c
/kW
h1
01
01
01
01
01
01
01
01
01
01
01
01
01
01
01
01
01
01
01
0
Tota
l kW
hs
3,2
22
,00
06
,95
9,5
20
7,5
16
,28
28
,11
7,5
84
8,7
66
,99
19
,46
8,3
50
9,9
41
,76
81
0,4
38
,85
61
0,9
60
,79
91
1,5
08
,83
91
2,0
84
,28
11
2,4
46
,80
91
2,8
20
,21
31
3,2
04
,82
01
3,6
00
,96
41
4,0
08
,99
31
4,4
29
,26
31
4,8
62
,14
11
5,3
08
,00
51
5,7
67
,24
5
Tota
l kW
hs
6,1
98
,21
01
3,3
88
,13
41
4,4
59
,18
41
5,6
15
,91
91
6,8
65
,19
31
8,2
14
,40
81
9,1
25
,12
82
0,0
81
,38
52
1,0
85
,45
42
2,1
39
,72
72
3,2
46
,71
32
3,9
44
,11
42
4,6
62
,43
82
5,4
02
,31
12
6,1
64
,38
02
6,9
49
,31
22
7,7
57
,79
12
8,5
90
,52
52
9,4
48
,24
13
0,3
31
,68
84
33
,67
0,2
54
Loss
Fact
or
0.2
40
0.2
20
0.2
00
0.1
80
0.1
80
0.1
80
0.1
80
0.1
80
0.1
80
0.1
80
0.1
80
0.1
80
0.1
80
0.1
80
0.1
80
0.1
80
0.1
80
0.1
80
0.1
80
0.1
80
Ele
ctri
city
Pu
rch
ase
s
kWh I
ncl
udin
g L
oss
es
8,1
55
,53
91
7,1
64
,27
41
8,0
73
,98
01
9,0
43
,80
42
0,5
67
,30
82
2,2
12
,69
32
3,3
23
,32
72
4,4
89
,49
42
5,7
13
,96
82
6,9
99
,66
72
8,3
49
,65
02
9,2
00
,14
03
0,0
76
,14
43
0,9
78
,42
83
1,9
07
,78
13
2,8
65
,01
43
3,8
50
,96
53
4,8
66
,49
43
5,9
12
,48
93
6,9
89
,86
35
30
,74
1,0
21
c/kW
h4
.90
4.9
04
.90
4.9
04
.90
4.9
04
.90
4.9
04
.90
4.9
04
.90
4.9
04
.90
4.9
04
.90
4.9
04
.90
4.9
04
.90
4.9
0
Tota
l Exp
enditure
on k
Wh
39
9,6
21
84
1,0
49
88
5,6
25
93
3,1
46
1,0
07
,79
81
,08
8,4
22
1,1
42
,84
31
,19
9,9
85
1,2
59
,98
41
,32
2,9
84
1,3
89
,13
31
,43
0,8
07
1,4
73
,73
11
,51
7,9
43
1,5
63
,48
11
,61
0,3
86
1,6
58
,69
71
,70
8,4
58
1,7
59
,71
21
,81
2,5
03
26
,00
6,3
10
kVA
Charg
e0
00
00
00
00
00
00
00
00
00
0
kVA
Sold
00
00
00
00
00
00
00
00
00
00
Tota
l Exp
enditure
on k
VA
00
00
00
00
00
00
00
00
00
00
Ag
gre
gate
Ele
ctri
city
Pu
rch
ase
Cost
:3
99
,62
18
41
,04
98
85
,62
59
33
,14
61
,00
7,7
98
1,0
88
,42
21
,14
2,8
43
1,1
99
,98
51
,25
9,9
84
1,3
22
,98
41
,38
9,1
33
1,4
30
,80
71
,47
3,7
31
1,5
17
,94
31
,56
3,4
81
1,6
10
,38
61
,65
8,6
97
1,7
08
,45
81
,75
9,7
12
1,8
12
,50
32
6,0
06
,31
0

ERT A
pp
en
dix
A A
rush
a Y
EA
RS
12
34
56
78
91
01
11
21
31
41
51
61
71
81
92
0
Typ
e..
....
....
....
..M
ete
r2
00
62
00
72
00
82009
20
10
20
11
20
12
20
13
20
14
20
15
20
16
20
17
20
18
20
19
20
20
20
21
20
22
20
23
20
24
20
25
Main
tenance
Cost
s:
Mete
r Rea
din
g,
etc
00
00
00
00
00
00
00
00
00
00
0
O&
M C
ost
43
5,4
92
87
0,9
84
87
0,9
84
87
0,9
84
87
0,9
84
87
0,9
84
87
0,9
84
87
0,9
84
87
0,9
84
87
0,9
84
87
0,9
84
87
0,9
84
87
0,9
84
87
0,9
84
87
0,9
84
87
0,9
84
87
0,9
84
87
0,9
84
87
0,9
84
87
0,9
84
16
,98
4,1
88
Tota
l C
ost
s4
35
,49
28
70
,98
48
70
,98
48
70
,98
48
70
,98
48
70
,98
48
70
,98
48
70
,98
48
70
,98
48
70
,98
48
70
,98
48
70
,98
48
70
,98
48
70
,98
48
70
,98
48
70
,98
48
70
,98
48
70
,98
487
0,9
84
87
0,9
84
16
,98
4,1
88
Loans:
Ente
r one d
raw
dow
n i
n o
nly
one y
ear:
Loan A
LOA
N A
Ca
pit
al
00
00
00
00
00
00
00
00
00
00
0
Term
10 y
rs
Rep
aym
ent
Inst
.0
00
00
00
00
00
00
00
00
00
00
Inte
rest
10.0
% p
.a.
00
00
00
00
00
00
00
00
00
00
Yea
r-end
Ba
lance
00
00
00
00
00
00
00
00
00
00
Tota
l Ye
ar-
end B
ala
nce
All L
oans
00
00
00
00
00
00
00
00
00
00
Const
ruct
ion C
ost
s:
Do
mest
ic
No.
of
Consu
mers
12
,09
70
00
00
00
00
00
00
00
00
00
Unit V
alu
e7
11
71
17
11
71
17
11
71
17
11
71
17
11
71
17
11
71
17
11
71
17
11
71
17
11
71
17
11
71
1
Co
st8
,60
3,7
98
00
00
00
00
00
00
00
00
00
0
Tota
l C
onst
ruct
ion C
ost
– A
nnual
Additio
ns
8,6
03,7
98
00
00
00
00
00
00
00
00
00
08
,60
3,7
98
Ven
din
g S
tation
s In
stalled
Am
oun
t0
00
00
00
00
00
00
00
00
00
0
Upgra
din
g o
f N
etw
ork
No.
11
11
11
11
11
11
11
11
11
11
Unit V
alu
e0
00
00
00
00
00
00
00
00
00
0
Ass
et
Va
lue
00
00
00
00
00
00
00
00
00
00
Tota
l A
nnual C
apex
Incl
. C
on
stru
ctio
n C
ost
s8
,60
3,7
98
00
00
00
00
00
00
00
00
00
0
FIX
ED
ASSET S
UM
MA
RIE
S
Ele
ctri
city
Netw
ork
s
Netw
ork
Cost
– b
/f8
,60
3,7
98
8,6
03
,79
88
,60
3,7
98
8,6
03
,79
88
,60
3,7
98
8,6
03
,79
88
,60
3,7
98
8,6
03
,79
88
,60
3,7
98
8,6
03
,79
88
,60
3,7
98
8,6
03
,79
88
,60
3,7
98
8,6
03
,79
88,6
03
,79
88
,60
3,7
98
8,6
03
,79
88
,60
3,7
98
8,6
03
,79
8
Additio
ns
in Y
ear
8,6
03
,79
88
,60
3,7
98
00
00
00
00
00
00
00
00
00
0
(incl
ud
ing
Const
ruct
ion C
ost
s)
Infl
ati
on
00
00
00
00
00
00
00
00
00
00
Cost
c/f
8,6
03
,79
88
,60
3,7
98
8,6
03
,79
88
,60
3,7
98
8,6
03
,79
88
,60
3,7
98
8,6
03
,79
88
,60
3,7
98
8,6
03
,79
88
,60
3,7
98
8,6
03
,79
88
,60
3,7
98
8,6
03
,79
88
,60
3,7
98
8,6
03
,79
88
,60
3,7
98
8,6
03
,79
88
,60
3,7
98
8,6
03
,79
88
,60
3,7
98
Dep
reci
ation –
b/f
28
6,7
93
57
3,5
87
86
0,3
80
1,1
47
,17
31
,43
3,9
66
1,7
20
,76
02
,00
7,5
53
2,2
94
,34
62
,58
1,1
39
2,8
67
,93
33
,15
4,7
26
3,4
41
,51
93
,72
8,3
12
4,0
15
,10
64
,30
1,8
99
4,5
88
,69
24
,87
5,4
85
5,1
62
,27
95
,44
9,0
72
Charg
ed i
n t
he Y
ear
28
6,7
93
28
6,7
93
28
6,7
93
28
6,7
93
28
6,7
93
28
6,7
93
28
6,7
93
28
6,7
93
28
6,7
93
28
6,7
93
28
6,7
93
28
6,7
93
28
6,7
93
28
6,7
93
28
6,7
93
28
6,7
93
28
6,7
93
28
6,7
93
28
6,7
93
28
6,7
93
Dep
reci
ation c
/f2
86
,79
35
73
,58
78
60
,38
01
,14
7,1
73
1,4
33
,96
61
,72
0,7
60
2,0
07
,55
32
,29
4,3
46
2,5
81
,13
92
,86
7,9
33
3,1
54
,72
63
,44
1,5
19
3,7
28
,31
24
,01
5,1
06
4,3
01
,89
94
,58
8,6
92
4,8
75
,48
55
,16
2,2
79
5,4
49
,07
25
,73
5,8
65
Ele
ctri
city
Netw
ork
s N
et
Book
Valu
e8
,31
7,0
04
8,0
30
,21
17
,74
3,4
18
7,4
56
,62
57
,16
9,8
31
6,8
83
,03
86
,59
6,2
45
6,3
09
,45
26
,02
2,6
58
5,7
35
,86
55
,44
9,0
72
5,1
62
,27
94
,87
5,4
85
4,5
88
,69
24
,30
1,8
99
4,0
15
,10
63
,72
8,3
12
3,4
41
,51
93
,15
4,7
26
2,8
67
,93
3
Assumptions
Appendix
4A

ERT A
pp
en
dix
A A
rush
a Y
EA
RS
12
34
56
78
91
01
11
21
31
41
51
61
71
81
92
0
Typ
e..
....
....
....
..M
ete
r2
00
62
00
72
00
82
00
92
01
02
01
12
01
22
01
32
01
42
01
52
01
62
01
72
01
82
01
92
02
02
02
12
02
22
02
32
02
42
02
5
Upgra
din
g o
f N
etw
ork
Pla
nt
and E
quip
ment
Cost
– b
/f0
00
00
00
00
00
00
00
00
00
Additio
ns
in Y
ear
00
00
00
00
00
00
00
00
00
00
0
Infl
ati
on
00
00
00
00
00
00
00
00
00
00
Cost
c/f
00
00
00
00
00
00
00
00
00
00
Dep
reci
ation –
b/f
00
00
00
00
00
00
00
00
00
0
Charg
ed i
n t
he Y
ear
00
00
00
00
00
00
00
00
00
00
Dep
reci
ation c
/f0
00
00
00
00
00
00
00
00
00
0
Upgra
din
g o
f N
etw
ork
Net
Book V
alu
e0
00
00
00
00
00
00
00
00
00
00
Tota
l C
ost
8,6
03
,79
88
,60
3,7
98
8,6
03
,79
88
,60
3,7
98
8,6
03
,79
88
,60
3,7
98
8,6
03
,79
88
,60
3,7
98
8,6
03
,79
88
,60
3,7
98
8,6
03
,79
88
,60
3,7
98
8,6
03
,79
88
,60
3,7
98
8,6
03
,79
88
,60
3,7
98
8,6
03
,79
88
,60
3,7
98
8,6
03
,79
88
,60
3,7
98
Tota
l D
epre
ciation
28
6,7
93
57
3,5
87
86
0,3
80
1,1
47
,17
31
,43
3,9
66
1,7
20
,76
02
,00
7,5
53
2,2
94
,34
62
,58
1,1
39
2,8
67
,93
33
,15
4,7
26
3,4
41
,51
93
,72
8,3
12
4,0
15
,10
64
,30
1,8
99
4,5
88
,69
24
,87
5,4
85
5,1
62
,27
95
,44
9,0
72
5,7
35
,86
5
Tota
l N
et
Book V
alu
e8
,31
7,0
04
8,0
30
,21
17
,74
3,4
18
7,4
56
,62
57
,16
9,8
31
6,8
83
,03
86
,59
6,2
45
6,3
09
,45
26
,02
2,6
58
5,7
35
,86
55
,44
9,0
72
5,1
62
,27
94
,87
5,4
85
4,5
88
,69
24,3
01
,89
94
,01
5,1
06
3,7
28
,31
23
,44
1,5
19
3,1
54
,72
62
,86
7,9
33
Capital
Acc
ount
Tota
l C
ost
8,6
03
,79
80
00
00
00
00
00
00
00
00
00
8,6
03
79
8
Less
Consu
mer
Contr
ibutions
00
00
00
00
00
00
00
00
00
00
0
Less
Serv
ice L
ine C
on
nect
ion
(2,4
19
,40
0)
00
00
00
00
00
00
00
00
00
0(2
,41
9,4
00
)
Fee f
rom
Con
sum
ers
Less
Subsi
dy
Contr
ibutions
(7,3
13
,22
8)
00
00
00
00
00
00
00
00
00
0(7
,31
3,2
28
)
Less
Loan
00
00
00
00
00
00
00
00
00
00
0
Bala
nce
(C
ontr
ibutio
n b
y T
AN
)(1
,12
8,8
30
)(1
,12
8,8
30
)0
00
00
00
00
00
00
00
00
00
(1,1
28
,83
0)
INC
OM
E A
ND
EXPEN
DIT
UR
E
Inco
me
1,3
33
,95
8
Ele
ctri
city
and
oth
er
Sale
s3
,01
7,6
11
1,3
09
,97
51
,43
2,6
11
1,5
65
,05
91
,70
8,1
02
1,8
62
,58
81
,96
6,8
67
2,0
76
,35
92
,19
1,3
26
2,3
12
,04
12
,43
8,7
92
2,5
18
,64
52
,60
0,8
94
2,6
85
,61
02
,77
2,8
68
2,8
62
,74
32
,95
5,3
15
3,0
50
,66
43
,14
8,8
73
3,2
50
,02
94
7,7
26
,97
4
Gra
nts
and o
ther
Inco
me
7,3
25
,21
92
3,9
83
23
,98
32
3,9
83
23
,98
32
3,9
83
23
,98
32
3,9
83
23
,98
32
3,9
83
23
,98
32
3,9
83
23
,98
32
3,9
83
23
,98
32
3,9
83
23
,983
23
,98
32
3,9
83
23
,98
37
,78
0,8
90
55
,50
7,8
64
Infla
tio
n –
Inco
me
03
3,3
49
73
,74
01
22
,18
21
79
,81
32
47
,91
13
17
,92
63
96
,30
54
83
,83
05
81
,35
06
89
,78
57
93
,52
09
05
,29
11
,02
5,6
11
1,1
55
,02
61
,29
4,1
14
1,4
43
,48
71
,60
3,7
92
1,7
75
,71
61
,95
9,9
88
15
,08
2,7
34
Loans
Dra
wn D
ow
n0
00
00
00
00
00
00
00
00
00
00
Inte
rest
Rece
ived
/(Pa
id)
09
,03
91
4,2
94
7,5
00
2,2
49
(1,5
89
)(4
,02
6)
(5,1
72
)(5
,18
2)
(3,9
08
)(1
,19
8)
3,1
20
8,8
93
15
,94
12
4,3
78
34
,32
24
5,9
00
59
,24
77
4,5
09
91
,83
73
70
,15
3
Sta
rt-u
p C
ap
ital
(Eq
uity
Contr
ibution)
00
0
Tota
l In
com
e1
0,3
42
,83
11
,37
6,3
46
1,5
44
,62
81
,71
8,7
23
1,9
14
,14
62
,13
2,8
93
2,3
04
,74
92
,49
1,4
74
2,6
93
,95
72
,91
3,4
65
3,1
51
,36
23
,33
9,2
68
3,5
39
,06
03
,75
1,1
45
3,9
76
,25
44
,21
5,1
62
4,4
68
,68
44
,73
7,6
86
5,0
23
,08
15
,32
5,8
36
70
,96
0,7
51
Exp
en
ditu
re
Ele
ctri
city
Purc
ha
ses
39
9,6
21
84
1,0
49
88
5,6
25
93
3,1
46
1,0
07
,79
81
,08
8,4
22
1,1
42
,84
31
,19
9,9
85
1,2
59
,98
41
,32
2,9
84
1,3
89
,13
31
,43
0,8
07
1,4
73
,73
11
,51
7,9
43
1,5
63
,48
11
,61
0,3
86
1,6
58
,69
71
,70
8,4
58
1,7
59
,71
21
,81
2,5
03
26
,00
6,3
10
Ma
inte
na
nce
Co
sts
43
5,4
92
87
0,9
84
87
0,9
84
87
0,9
84
87
0,9
84
87
0,9
84
87
0,9
84
87
0,9
84
87
0,9
84
87
0,9
84
87
0,9
84
87
0,9
84
87
0,9
84
87
0,9
84
87
0,9
84
87
0,9
84
87
0,9
84
87
0,9
84
87
0,9
84
87
0,9
84
16
,98
4,1
88
Inflation –
Dir
ect
Cost
s0
42
,80
18
8,9
28
13
8,7
21
19
5,0
42
25
7,4
82
32
1,5
95
39
0,7
62
46
5,4
10
54
5,9
97
63
3,0
24
71
8,3
58
80
8,6
66
90
4,2
35
1,0
05
,37
01
,112
,39
31
,22
5,6
45
1,3
45
,48
41
,47
2,2
92
1,6
06
,47
01
3,2
78
,67
6
Fix
ed
Ass
et
Exp
end
iture
8,6
03
,79
80
00
00
00
00
00
00
00
00
00
8,6
03
,79
8
Infla
tio
n –
Ca
pita
l Exp
end
iture
00
00
00
00
00
00
00
00
00
00
0
Loa
n R
ep
aym
ents
00
00
00
00
00
00
00
00
00
00
Tota
l Exp
enditure
9,4
38
,91
11
,75
4,8
34
1,8
45
,53
71
,94
2,8
51
2,0
73
,82
42
,21
6,8
88
2,3
35
,42
22
,46
1,7
32
2,5
96
,37
82
,73
9,9
65
2,8
93
,14
13
,02
0,1
49
3,1
53
,38
13
,29
3,1
62
3,4
39
,83
63
,59
3,7
63
3,7
55
,32
63
,92
4,9
26
4,1
02
,98
84
,28
9,9
57
64
,87
2,9
72

ERT A
pp
en
dix
A A
rush
a Y
EA
RS
12
34
56
78
91
01
11
21
31
41
51
61
71
81
92
0
Typ
e..
....
....
....
..M
ete
r2
00
62
00
72
00
82
00
92
01
02
01
12
01
22
01
32
01
42
01
52
01
62
01
72
01
82
01
92
02
02
02
12
02
22
02
32
02
42
02
5
Move
ment
in P
eri
od
90
3,9
20
(37
8,4
88
)(3
00
,91
0)
(22
4,1
28
)(1
59
,67
8)
(83
,99
5)
(30
,67
3)
29
,74
29
7,5
79
17
3,5
00
25
8,2
22
31
9,1
19
38
5,6
79
45
7,9
83
53
6,4
19
62
1,3
99
71
3,3
58
81
2,7
60
92
0,0
93
1,0
35
,87
96
,08
7,7
79
Openin
g B
ank B
ala
nce
09
03
,92
05
25
,43
12
24
,52
23
94
(15
9,2
84
)(2
43
,27
9)
(27
3,9
52
)(2
44
,20
9)
(14
6,6
31
)2
6,8
70
28
5,0
92
60
4,2
10
98
9,8
90
1,4
47
,87
21
,98
4,2
91
2,6
05
,69
03
,31
9,0
48
4,1
31
,80
75
,05
1,9
00
Clo
sing B
ank B
ala
nce
90
3,9
20
52
5,4
31
22
4,5
22
39
4(1
59
,28
4)
(24
3,2
79
)(2
73
,95
2)
(24
4,2
09
)(1
46
,63
1)
26
,87
02
85
,09
26
04
,21
09
89
,89
01
,44
7,8
72
1,9
84
,29
12
,60
5,6
90
3,3
19
,04
84
,13
1,8
07
5,0
51
,90
06
,08
7,7
79
Ave
rage B
ala
nce
duri
ng Y
ear
45
1,9
60
71
4,6
75
37
4,9
76
11
2,4
58
(79
,44
5)
(20
1,2
81
)(2
58
,61
5)
(25
9,0
80
)(1
95
,42
0)
(59
,88
0)
15
5,9
81
44
4,6
51
79
7,0
50
1,2
18
,88
11
,71
6,0
82
2,2
94
,99
02
,96
2,3
69
3,7
25
,42
84
,59
1,8
54
5,5
69
,84
0
Inte
rest
(Pa
id)/
Rece
ived
9,0
39
14
,29
47
,50
02
,24
9(1
,58
9)
(4,0
26
)(5
,17
2)
(5,1
82
)(3
,90
8)
(1,1
98
)3
,12
08
,89
31
5,9
41
24
,37
83
4,3
22
45
,90
05
9,2
47
74
,50
99
1,8
37
11
1,3
97
Pro
fit
and L
oss
Inco
me
10
,34
2,8
31
1,3
67
,30
71
,53
0,3
34
1,7
11
,22
41
,91
1,8
97
2,1
34
,48
22
,30
8,7
75
2,4
96
,64
62
,69
9,1
38
2,9
17
,37
43
,15
2,5
60
3,3
36
,14
83
,53
0,1
67
3,7
35
,20
43
,95
1,8
77
4,1
80
,84
04
,42
2,7
84
4,6
78
,43
84
,94
8,5
72
5,2
33
,99
9
Exp
en
dit
ure
9,4
38
,91
11
,75
4,8
34
1,8
45
,53
71
,94
2,8
51
2,0
73
,82
42
,21
6,8
88
2,3
35
,42
22
,46
1,7
32
2,5
96
,37
82
,73
9,9
65
2,8
93
,14
13
,02
0,1
49
3,1
53
,38
13
,29
3,1
62
3,4
39
,83
63
,59
3,7
63
3,7
55
,32
63
,92
4,9
26
4,1
02
,98
84
,28
9,9
57
Gro
ss M
arg
in9
03
,92
0(3
87
,52
8)
(31
5,2
03
)(2
31
,62
7)
(16
1,9
27
)(8
2,4
06
)(2
6,6
47
)3
4,9
15
10
2,7
60
17
7,4
09
25
9,4
19
31
5,9
99
37
6,7
86
44
2,0
42
51
2,0
41
58
7,0
77
66
7,4
58
75
3,5
12
84
5,5
85
94
4,0
42
Dep
reci
atio
n2
86
,79
32
86
,79
32
86
,79
32
86
,79
32
86
,79
32
86
,79
32
86
,79
32
86
,79
32
86
,79
32
86
,79
32
86
,79
32
86
,79
32
86
,79
32
86
,79
32
86
,79
32
86
,79
32
86
,79
32
86
,79
328
6,7
93
28
6,7
93
Op
era
ting
Pro
fit
61
7,1
26
(67
4,3
21
)(6
01
,99
6)
(51
8,4
21
)(4
48
,72
0)
(36
9,1
99
)(3
13
,44
0)
(25
1,8
79
)(1
84
,03
3)
(10
9,3
85
)(2
7,3
74
)2
9,2
06
89
,99
31
55
,24
82
25
,24
83
00
,28
43
80
,66
54
66
,71
95
58
,79
16
57
,24
8
Inte
rest
Pa
id9
,03
91
4,2
94
7,5
00
2,2
49
(1,5
89
)(4
,02
6)
(5,1
72
)(5
,18
2)
(3,9
08
)(1
,19
8)
3,1
20
8,8
93
15
,94
12
4,3
78
34
,32
24
5,9
00
59
,24
77
4,5
09
91
,83
71
11
,39
7
Inte
rest
on L
oans
00
00
00
00
00
00
00
00
00
00
Nett
Pro
fit
befo
re T
ax
62
6,1
66
(66
0,0
27
)(5
94
,49
7)
(51
6,1
71
)(4
50
,30
9)
(37
3,2
25
)(3
18
,61
3)
(25
7,0
60
)(1
87
,94
1)
(11
0,5
82
)(2
4,2
54
)3
8,0
99
10
5,9
34
17
9,6
26
25
9,5
69
34
6,1
83
43
9,9
12
54
1,2
27
65
0,6
28
76
8,6
45
Fin
an
cia
l V
iab
ility
1,1
28
,83
06
26
,16
6(6
60
,02
7)
(59
4,4
97
)(5
16
,17
1)
(45
0,3
09
)(3
73
,22
5)
(31
8,6
13
)(2
57
,06
0)
(18
7,9
41
)(1
10
,58
2)
(24
,25
4)
38
,09
91
05
,93
41
79
,62
62
59
,56
93
46
,18
34
39
,91
25
41
,22
76
50
,62
87
68
,64
5
(TA
N C
ontr
ibution)
Assumptions
Appendix
4A

1,000,000
800,000
600,000
400,000
200,000
0
-200,000
-400,000
-600,000
-800,000
1 2 3 4 5 6 7 8 9 10 11 12 13 14 15 16 17 18 19 20
Years
Net Profit (Loss)before Tax US$
Profit
7,000,000
6,000,000
5,000,000
4,000,000
3,000,000
2,000,000
1,000,000
0
(-1,000,000)
1 2 3 4 5 6 7 8 9 10 11 12 13 14 15 16 17 18 19 20
Bank Cash
ANNEX 4: EXAMPLE FROM TANZANIA
145

SUB-SAHARAN AFRICA: INTRODUCING LOW-COST METHODS IN ELECTRICITY DISTRIBUTION NETWORKS
146
Analysis of Sales
Year
15.00
10.00
5.00
0.00
-5.00
-10.00
2006 2007 2008 2009 2010 2011 2012 2013 2014 2015 2016 2017 2018 2019 2020 2021 2022 2023 2024 2025
Profit on Sales Net Operating Cost
US$

147
Data
Connections US$ US$
Area Dom Other Cost Cost/Con
Usa 1 3,656 1,893 2,233,945 403
Usa 2 350 220 149,412 262
Usa 3 460 104 217,710 386
Monduli 1 50 0 26,793 536
Monduli 2 33 0 21,629 655
Monduli 3 170 42 113,372 535
Monduli 4 100 39 33,112 238
Monduli 5 200 33 108,900 467
Mererani 844 110 809,779 849
Babati 1 702 154 725,831 848
Babati 2 260 54 101,608 324
Babati 3 55 10 10,497 161
Karatu 280 106 412,370 1,068
Mbulu 1,140 377 1,219,439 804
Totals Original 8,300 3,142 6,184,397 540
Totals as Revised 11,023 1,074 6,184,398 511
Total Connections 12,097
ANNEX 4: EXAMPLE FROM TANZANIA
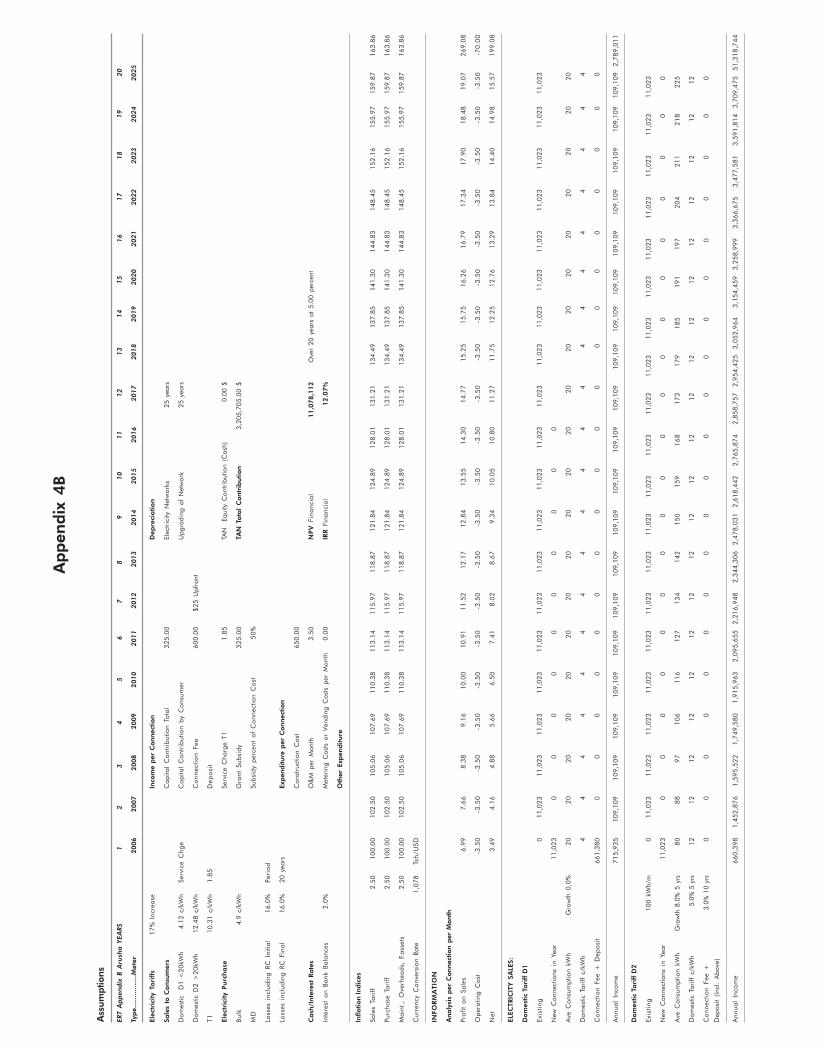
ERT A
pp
en
dix
B A
rush
a Y
EA
RS
12
34
56
78
91
01
11
21
31
41
51
61
71
81
92
0
Typ
e..
....
....
....
..M
ete
r2006
2007
2008
2009
20
10
20
11
20
12
20
13
20
14
20
15
20
16
20
17
20
18
20
19
20
20
20
21
20
22
20
23
20
24
20
25
Ele
ctri
city
Ta
riff
s1
7%
Incr
ease
Inco
me p
er
Connect
ion
Dep
reci
ation
Sale
s to
Consu
mers
Ca
pita
l C
ontr
ibutio
n T
ota
l3
25
.00
Ele
ctri
city
Netw
ork
s25 y
ears
Dom
est
ic
D1
<2
0kW
h4.1
2 c
/kW
hServ
ice C
hg
eC
ap
ital
Contr
ibution b
y C
onsu
mer
Upgra
din
g o
f N
etw
ork
25 y
ears
Dom
est
ic D
2 >
20
kWh
12.4
8 c
/kW
hC
on
nect
ion
Fee
60
0.0
0$
25
Upfr
ont
T1
10.3
1 c
/kW
h1
.85
Dep
osi
t
Ele
ctri
city
Pu
rch
ase
Serv
ice C
harg
e T
11
.85
TAN
Equity
Contr
ibution (
Cash
)0.0
0 $
Bulk
4.9
c/k
Wh
Gra
nt
Sub
sid
y3
25
.00
TAN
Tota
l C
ontr
ibution
3,2
05,7
05.0
0 $
MD
Sub
sid
y p
erc
ent
of
Connect
ion C
ost
50
%
Loss
es
incl
ud
ing
RC
Initia
l1
6.0
%Peri
od
Loss
es
incl
ud
ing
RC
Fin
al
16
.0%
20 y
ears
Exp
enditure
per
Connect
ion
Const
ruct
ion C
ost
65
0.0
0
Cash
/Inte
rest
Rate
sO
&M
per
Month
3.5
0N
PV
Fin
an
cia
l11,0
78,1
12
Ove
r 20 y
ears
at
5.0
0 p
erce
nt
Inte
rest
on B
ank
Bala
nce
s2
.0%
Mete
ring C
ost
s or
Vendin
g C
ost
s per
Month
0.0
0IR
R F
inanci
al
12.0
7%
Oth
er
Exp
en
ditu
re
Inflation
In
dic
es
Sa
les
Tari
ff2
.50
10
0.0
01
02
.50
10
5.0
61
07
.69
11
0.3
81
13
.14
11
5.9
71
18
.87
12
1.8
41
24
.89
12
8.0
11
31
.21
13
4.4
91
37
.85
14
1.3
01
44
.83
14
8.4
51
52
.16
15
5.9
71
59
.87
16
3.8
6
Purc
hase
Tari
ff2
.50
10
0.0
01
02
.50
10
5.0
61
07
.69
11
0.3
81
13
.14
11
5.9
71
18
.87
12
1.8
41
24
.89
12
8.0
11
31
.21
13
4.4
91
37
.85
14
1.3
01
44
.83
14
8.4
51
52
.16
15
5.9
71
59
.87
16
3.8
6
Ma
int.
, O
verh
ea
ds,
F.a
ssets
2.5
01
00
.00
10
2.5
01
05
.06
10
7.6
91
10
.38
11
3.1
41
15
.97
11
8.8
71
21
.84
12
4.8
91
28
.01
13
1.2
11
34
.49
13
7.8
51
41
.30
14
4.8
31
48
.45
15
2.1
61
55
.97
15
9.8
71
63.8
6
Curr
ency
Conve
rsio
n R
ate
1,0
78
Tsh
/USD
INFO
RM
ATIO
N
Analy
sis
per
Connect
ion p
er
Month
Pro
fit
on S
ale
s6
.99
7.6
68
.38
9.1
61
0.0
01
0.9
11
1.5
21
2.1
71
2.8
41
3.5
51
4.3
01
4.7
71
5.2
51
5.7
51
6.2
61
6.7
91
7.3
41
7.9
01
8.4
81
9.0
72
69
.08
Op
era
ting
Cost
-3.5
0-3
.50
-3.5
0-3
.50
-3.5
0-3
.50
-3.5
0-3
.50
-3.5
0-3
.50
-3.5
0-3
.50
-3.5
0-3
.50
-3.5
0-3
.50
-3.5
0-3
.50
-3.5
0-3
.50
-70
.00
Net
3.4
94
.16
4.8
85
.66
6.5
07
.41
8.0
28
.67
9.3
41
0.0
51
0.8
01
1.2
71
1.7
51
2.2
51
2.7
61
3.2
91
3.8
41
4.4
01
4.9
81
5.5
71
99
.08
ELE
CTRIC
ITY S
ALE
S:
Dom
est
ic T
ari
ff D
1
Exi
stin
g0
11
,02
31
1,0
23
11
,02
31
1,0
23
11
,02
31
1,0
23
11
,02
31
1,0
23
11
,02
31
1,0
23
11
,02
31
1,0
23
11
,02
31
1,0
23
11
,02
31
1,0
23
11
,02
31
1,0
23
11
,02
3
New
Connect
ions
in Y
ear
11
,02
30
00
00
00
00
0
Ave
Consu
mption k
Wh
Gro
wth
0.0
%2
02
02
02
02
02
02
02
02
02
02
02
02
02
02
02
02
02
02
02
0
Dom
est
ic T
ari
ff c
/kW
h4
44
44
44
44
44
44
44
44
44
4
Co
nnect
ion F
ee +
Dep
osi
t6
61
,38
00
00
00
00
00
00
00
00
00
00
Annua
l In
com
e7
15
,93
51
09
,10
91
09
,10
91
09
,10
91
09
,10
91
09
,10
91
09
,10
91
09
,10
91
09
,10
91
09
,10
91
09
,10
91
09
,10
91
09
,10
91
09
,10
91
09
,10
91
09
,10
91
09
,10
91
09
,10
910
9,1
09
10
9,1
09
2,7
89
,01
1
Dom
est
ic T
ari
ff D
2
Exi
stin
g100 k
Wh/m
01
1,0
23
11
,02
31
1,0
23
11
,02
31
1,0
23
11
,02
31
1,0
23
11
,02
31
1,0
23
11
,02
31
1,0
23
11
,02
31
1,0
23
11
,02
31
1,0
23
11
,02
31
1,0
23
11
,02
31
1,0
23
New
Connect
ions
in Y
ear
11
,02
30
00
00
00
00
00
00
00
00
00
Ave
Consu
mption k
Wh
Gro
wth
8.0
% 5
yrs
80
88
97
10
61
16
12
71
34
14
21
50
15
91
68
17
31
79
18
51
91
19
72
04
21
12
18
22
5
Dom
est
ic T
ari
ff c
/kW
h5.0
% 5
yrs
12
12
12
12
12
12
12
12
12
12
12
12
12
12
12
12
12
12
12
12
Co
nnect
ion F
ee +
3.0
% 1
0 y
rs0
00
00
00
00
00
00
00
00
00
0
Deposi
t (Incl
. A
bove
)
Annua
l In
com
e6
60
,39
81
,45
2,8
76
1,5
95
,52
21
,74
9,5
80
1,9
15
,96
32
,09
5,6
55
2,2
16
,94
82
,34
4,3
06
2,4
78
,03
12
,61
8,4
42
2,7
65
,87
42
,85
8,7
57
2,9
54
,42
53
,05
2,9
64
3,1
54
,45
93
,25
8,9
99
3,3
66
,67
53
,47
7,5
81
3,5
91
,81
43
,70
9,4
75
51
,31
8,7
44
Appendix
4B
Assumptions
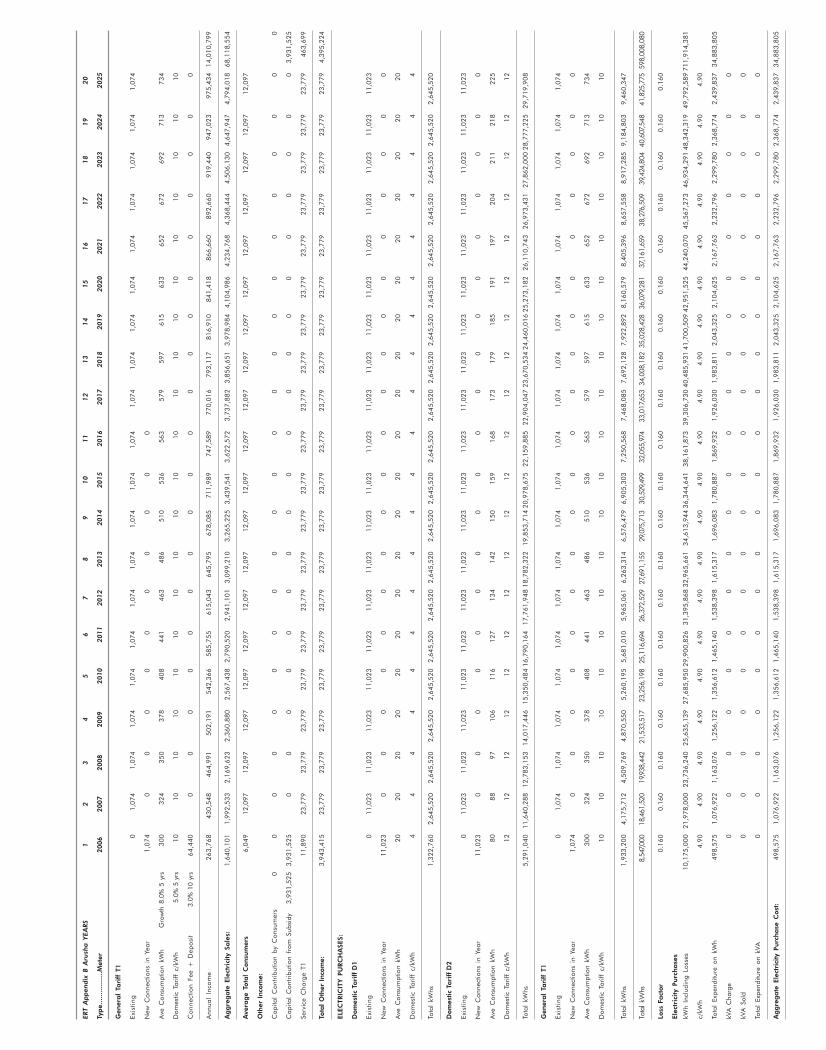
ERT A
pp
en
dix
B A
rush
a Y
EA
RS
12
34
56
78
91
01
11
21
31
41
51
61
71
81
92
0
Typ
e..
....
....
....
..M
ete
r2006
2007
2008
2009
20
10
20
11
20
12
20
13
20
14
20
15
20
16
20
17
20
18
20
19
20
20
20
21
20
22
20
23
20
24
20
25
Genera
l Ta
riff
T1
Exi
stin
g0
1,0
74
1,0
74
1,0
74
1,0
74
1,0
74
1,0
74
1,0
74
1,0
74
1,0
74
1,0
74
1,0
74
1,0
74
1,0
74
1,0
74
1,0
74
1,0
74
1,0
74
1,0
74
1,0
74
New
Connect
ions
in Y
ear
1,0
74
00
00
00
00
00
Ave
Consu
mption k
Wh
Gro
wth
8.0
% 5
yrs
30
03
24
35
03
78
40
84
41
46
34
86
51
05
36
56
35
79
59
76
15
63
36
52
67
26
92
71
37
34
Dom
est
ic T
ari
ff c
/kW
h5.0
% 5
yrs
10
10
10
10
10
10
10
10
10
10
10
10
10
10
10
10
10
10
10
10
Co
nnect
ion F
ee +
Dep
osi
t3.0
% 1
0 y
rs6
4,4
40
00
00
00
00
00
00
00
00
00
0
Annua
l In
com
e2
63
,76
84
30
,54
84
64
,99
15
02
,19
15
42
,36
65
85
,75
56
15
,04
36
45
,79
56
78
,08
57
11
,98
97
47
,58
97
70
,01
67
93
,11
78
16
,91
08
41
,41
88
66
,66
08
92
,66
09
19
,44
094
7,0
23
97
5,4
34
14
,01
0,7
99
Ag
gre
gate
Ele
ctri
city
Sale
s:1
,64
0,1
01
1,9
92
,53
32
,16
9,6
23
2,3
60
,88
02
,56
7,4
38
2,7
90
,52
02
,94
1,1
01
3,0
99
,21
03
,26
5,2
25
3,4
39
,54
13
,62
2,5
72
3,7
37
,88
23
,85
6,6
51
3,9
78
,98
44,1
04
,98
64
,23
4,7
68
4,3
68
,44
44
,50
6,1
30
4,6
47
,94
74
,79
4,0
18
68
,11
8,5
54
Avera
ge T
ota
l C
on
sum
ers
6,0
49
12
,09
71
2,0
97
12
,09
71
2,0
97
12
,09
71
2,0
97
12
,09
71
2,0
97
12
,09
71
2,0
97
12
,09
71
2,0
97
12
,09
71
2,0
97
12
,09
71
2,0
97
12
,09
71
2,0
97
12
,09
7
Oth
er
Inco
me:
Cap
ital
Contr
ibution b
y C
onsu
mers
00
00
00
00
00
00
00
00
00
00
00
Cap
ital
Contr
ibution f
rom
Sub
sid
y3
,93
1,5
25
3,9
31
,52
50
00
00
00
00
00
00
00
00
00
3,9
31
,52
5
Serv
ice C
harg
e T
11
1,8
90
23
,77
92
3,7
79
23
,77
92
3,7
79
23
,77
92
3,7
79
23
,77
92
3,7
79
23
,77
92
3,7
79
23
,77
92
3,7
79
23
,77
92
3,7
79
23
,77
92
3,7
79
23
,77
92
3,7
79
23
,77
94
63
,69
9
Tota
l O
ther
Inco
me:
3,9
43
,41
52
3,7
79
23
,77
92
3,7
79
23
,77
92
3,7
79
23
,77
92
3,7
79
23
,77
92
3,7
79
23
,77
92
3,7
79
23
,77
92
3,7
79
23
,77
92
3,7
79
23
,77
92
3,7
79
23
,77
92
3,7
79
4,3
95
,22
4
ELE
CTRIC
ITY P
URC
HA
SES:
Dom
est
ic T
ari
ff D
1
Exi
stin
g0
11
,02
31
1,0
23
11
,02
31
1,0
23
11
,02
31
1,0
23
11
,02
31
1,0
23
11
,02
31
1,0
23
11
,02
31
1,0
23
11
,02
31
1,0
23
11
,02
31
1,0
23
11
,02
31
1,0
23
11
,02
3
New
Connect
ions
in Y
ear
11
,02
30
00
00
00
00
00
00
00
00
00
Ave
Consu
mption k
Wh
20
20
20
20
20
20
20
20
20
20
20
20
20
20
20
20
20
20
20
20
Dom
est
ic T
ari
ff c
/kW
h4
44
44
44
44
44
44
44
44
44
4
Tota
l kW
hs
1,3
22
,76
02
,64
5,5
20
2,6
45
,52
02
,64
5,5
20
2,6
45
,52
02
,64
5,5
20
2,6
45
,52
02
,64
5,5
20
2,6
45
,52
02
,64
5,5
20
2,6
45
,52
02
,64
5,5
20
2,6
45
,52
02
,64
5,5
20
2,6
45
,52
02
,64
5,5
20
2,6
45
,52
02
,64
5,5
20
2,6
45
,52
02
,64
5,5
20
Dom
est
ic T
ari
ff D
2
Exi
stin
g0
11
,02
31
1,0
23
11
,02
31
1,0
23
11
,02
31
1,0
23
11
,02
31
1,0
23
11
,02
31
1,0
23
11
,02
31
1,0
23
11
,02
31
1,0
23
11
,02
31
1,0
23
11
,02
31
1,0
23
11
,02
3
New
Connect
ions
in Y
ear
11
,02
30
00
00
00
00
00
00
00
00
00
Ave
Consu
mption k
Wh
80
88
97
10
61
16
12
71
34
14
21
50
15
91
68
17
31
79
18
51
91
19
72
04
21
12
18
22
5
Dom
est
ic T
ari
ff c
/kW
h1
21
21
21
21
21
21
21
21
21
21
21
21
21
21
21
21
21
21
21
2
Tota
l kW
hs
5,2
91
,04
01
1,6
40
,28
81
2,7
83
,15
31
4,0
17
,44
61
5,3
50
,48
41
6,7
90
,16
41
7,7
61
,94
81
8,7
82
,32
21
9,8
53
,71
42
0,9
78
,67
52
2,1
59
,88
52
2,9
04
,04
72
3,6
70
,53
42
4,4
60
,01
62
5,2
73
,18
22
6,1
10
,74
32
6,9
73
,43
12
7,8
62
,00
02
8,7
77
,22
52
9,7
19
,90
8
Genera
l Ta
riff
T1
Exi
stin
g0
1,0
74
1,0
74
1,0
74
1,0
74
1,0
74
1,0
74
1,0
74
1,0
74
1,0
74
1,0
74
1,0
74
1,0
74
1,0
74
1,0
74
1,0
74
1,0
74
1,0
74
1,0
74
1,0
74
New
Connect
ions
in Y
ear
1,0
74
00
00
00
00
00
00
00
00
00
0
Ave
Consu
mption k
Wh
30
03
24
35
03
78
40
84
41
46
34
86
51
05
36
56
35
79
59
76
15
63
36
52
67
26
92
71
37
34
Dom
est
ic T
ari
ff c
/kW
h1
01
01
01
01
01
01
01
01
01
01
01
01
01
01
01
01
01
01
01
0
Tota
l kW
hs
1,9
33
,20
04
,17
5,7
12
4,5
09
,76
94
,87
0,5
50
5,2
60
,19
55
,68
1,0
10
5,9
65
,06
16
,26
3,3
14
6,5
76
,47
96
,90
5,3
03
7,2
50
,56
87
,46
8,0
85
7,6
92
,12
87
,92
2,8
92
8,1
60
,57
98
,40
5,3
96
8,6
57
,55
88
,91
7,2
85
9,1
84
,80
39
,46
0,3
47
Tota
l kW
hs
8,5
47,0
00
18,4
61,5
20
19,
938,4
42
21,5
33,5
17
23,2
56,1
98
25,1
16,6
94
26,3
72,5
29
27,
691,1
55
29,
075
,713
30,5
29,
499
32,0
55,9
7433,0
17,
653
34,0
08,1
82
35,0
28,4
28
36,0
79,
281
37,
161,6
59
38,2
76,5
09
39,
424,8
04
40,6
07,
548
41,8
25,7
75
598,0
08,0
80
Loss
Fact
or
0.1
60
0.1
60
0.1
60
0.1
60
0.1
60
0.1
60
0.1
60
0.1
60
0.1
60
0.1
60
0.1
60
0.1
60
0.1
60
0.1
60
0.1
60
0.1
60
0.1
60
0.1
60
0.1
60
0.1
60
Ele
ctri
city
Pu
rch
ase
s
kWh I
ncl
udin
g L
oss
es
10
,17
5,0
00
21
,97
8,0
00
23
,73
6,2
40
25
,63
5,1
39
27
,68
5,9
50
29
,90
0,8
26
31
,39
5,8
68
32
,96
5,6
61
34
,61
3,9
44
36
,34
4,6
41
38
,16
1,8
73
39
,30
6,7
30
40
,48
5,9
31
41
,70
0,5
09
42
,95
1,5
25
44
,24
0,0
70
45
,56
7,2
73
46
,93
4,2
91
48
,34
2,3
19
49
,79
2,5
89
71
1,9
14
,38
1
c/kW
h4
.90
4.9
04
.90
4.9
04
.90
4.9
04
.90
4.9
04
.90
4.9
04
.90
4.9
04
.90
4.9
04
.90
4.9
04
.90
4.9
04
.90
4.9
0
Tota
l Exp
enditure
on k
Wh
49
8,5
75
1,0
76
,92
21
,16
3,0
76
1,2
56
,12
21
,35
6,6
12
1,4
65
,14
01
,53
8,3
98
1,6
15
,31
71
,69
6,0
83
1,7
80
,88
71
,86
9,9
32
1,9
26
,03
01
,98
3,8
11
2,0
43
,32
52
,10
4,6
25
2,1
67
,76
32
,23
2,7
96
2,2
99
,78
02
,36
8,7
74
2,4
39
,83
73
4,8
83
,80
5
kVA
Charg
e0
00
00
00
00
00
00
00
00
00
0
kVA
Sold
00
00
00
00
00
00
00
00
00
00
Tota
l Exp
enditure
on k
VA
00
00
00
00
00
00
00
00
00
00
Ag
gre
gate
Ele
ctri
city
Pu
rch
ase
Cost
:4
98
,57
51
,07
6,9
22
1,1
63
,07
61
,25
6,1
22
1,3
56
,61
21
,46
5,1
40
1,5
38
,39
81
,61
5,3
17
1,6
96
,08
31
,78
0,8
87
1,8
69
,93
21
,92
6,0
30
1,9
83
,81
12
,04
3,3
25
2,1
04
,62
52
,16
7,7
63
2,2
32
,79
62
,29
9,7
80
2,3
68
,77
42
,43
9,8
37
34
,88
3,8
05

ERT A
pp
en
dix
B A
rush
a Y
EA
RS
12
34
56
78
91
01
11
21
31
41
51
61
71
81
92
0
Typ
e..
....
....
....
..M
ete
r2006
2007
2008
2009
20
10
20
11
20
12
20
13
20
14
20
15
20
16
20
17
20
18
20
19
20
20
20
21
20
22
20
23
20
24
20
25
Main
tenance
Cost
s:
Mete
r Rea
din
g,
etc
00
00
00
00
00
00
00
00
00
00
0
O&
M c
ost
25
4,0
37
50
8,0
74
50
8,0
74
50
8,0
74
50
8,0
74
50
8,0
74
50
8,0
74
50
8,0
74
50
8,0
74
50
8,0
74
50
8,0
74
50
8,0
74
50
8,0
74
50
8,0
74
50
8,0
74
50
8,0
74
50
8,0
74
50
8,0
74
50
8,0
74
50
8,0
74
9,9
07
,44
3
Tota
l C
ost
s2
54
,03
75
08
,07
45
08
,07
45
08
,07
45
08
,07
45
08
,07
45
08
,07
45
08
,07
45
08
,07
45
08
,07
45
08
,07
45
08
,07
45
08
,07
45
08
,07
45
08
,07
45
08
,07
45
08
,07
45
08
,07
450
8,0
74
50
8,0
74
9,9
07
,44
3
Loans:
Ente
r one d
raw
dow
n i
n o
nly
one y
ear:
Loan A
LOA
N A
Ca
pit
al
3,0
00
,00
00
00
00
00
00
00
00
00
00
00
00
Term
10 y
rs
Rep
aym
ent
Inst
.3
99
,18
90
00
00
00
00
00
00
00
00
00
0
Inte
rest
7.0
% p
.a.
00
00
00
00
00
00
00
00
00
00
Yea
r-end
Ba
lance
00
00
00
00
00
00
00
00
00
00
Tota
l Ye
ar-
end B
ala
nce
All L
oans
00
00
00
00
00
00
00
00
00
00
Const
ruct
ion C
ost
s:
Do
mest
ic
No o
f C
onsu
mers
12
,09
70
00
00
00
00
00
00
00
00
00
Unit V
alu
e6
50
65
06
50
65
06
50
65
06
50
65
06
50
65
06
50
65
06
50
65
06
50
65
06
50
65
06
50
65
0
Co
st7
,86
3,0
50
00
00
00
00
00
00
00
00
00
0
Tota
l C
onst
ruct
ion C
ost
– A
nnual
Additio
ns
7,8
63
,05
00
00
00
00
00
00
00
00
00
00
7,8
63
,05
0
Ven
din
g S
tation
s In
stalled
Am
oun
t0
00
00
00
00
00
00
00
00
00
0
Upgra
din
g o
f N
etw
ork
No
11
11
11
11
11
11
11
11
11
11
Unit V
alu
e0
00
00
00
00
00
00
00
00
00
0
Ass
et
Va
lue
00
00
00
00
00
00
00
00
00
00
Tota
l A
nnual C
apex
Incl
. C
on
stru
ctio
n C
ost
s7
,86
3,0
50
00
00
00
00
00
00
00
00
00
0
FIX
ED
ASSET S
UM
MA
RIE
S
Ele
ctri
city
Netw
ork
s
Netw
ork
Cost
– b
/f7
,86
3,0
50
7,8
63
,05
07
,86
3,0
50
7,8
63
,05
07
,86
3,0
50
7,8
63
,05
07
,86
3,0
50
7,8
63
,05
07
,86
3,0
50
7,8
63
,05
07
,86
3,0
50
7,8
63
,05
07
,86
3,0
50
7,8
63
,05
07,8
63
,05
07
,86
3,0
50
7,8
63
,05
07
,86
3,0
50
7,8
63
,05
0
Additio
ns
in Y
ear
7,8
63
,05
07
,86
3,0
50
00
00
00
00
00
00
00
00
00
0
(incl
ud
ing
Const
ruct
ion C
ost
s)
Infl
ati
on
00
00
00
00
00
00
00
00
00
00
Cost
c/f
7,8
63
,05
07
,86
3,0
50
7,8
63
,05
07
,86
3,0
50
7,8
63
,05
07
,86
3,0
50
7,8
63
,05
07
,86
3,0
50
7,8
63
,05
07
,86
3,0
50
7,8
63
,05
07
,86
3,0
50
7,8
63
,05
07
,86
3,0
50
7,8
63
,05
07
,86
3,0
50
7,8
63
,05
07
,86
3,0
50
7,8
63
,05
07
,86
3,0
50
Dep
reci
ation –
b/f
31
4,5
22
62
9,0
44
94
3,5
66
1,2
58
,08
81
,57
2,6
10
1,8
87
,13
22
,20
1,6
54
2,5
16
,17
62
,83
0,6
98
3,1
45
,22
03
,45
9,7
42
3,7
74
,26
44
,08
8,7
86
4,4
03
,30
84
,71
7,8
30
5,0
32
,35
25
,34
6,8
74
5,6
61
,39
65
,97
5,9
18
Charg
ed i
n t
he y
ear
31
4,5
22
31
4,5
22
31
4,5
22
31
4,5
22
31
4,5
22
31
4,5
22
31
4,5
22
31
4,5
22
31
4,5
22
31
4,5
22
31
4,5
22
31
4,5
22
31
4,5
22
31
4,5
22
31
4,5
22
31
4,5
22
31
4,5
22
31
4,5
22
31
4,5
22
31
4,5
22
Dep
reci
ation c
/f3
14
,52
26
29
,04
49
43
,56
61
,25
8,0
88
1,5
72
,61
01
,88
7,1
32
2,2
01
,65
42
,51
6,1
76
2,8
30
,69
83
,14
5,2
20
3,4
59
,74
23
,77
4,2
64
4,0
88
,78
64
,40
3,3
08
4,7
17
,83
05
,03
2,3
52
5,3
46
,87
45
,66
1,3
96
5,9
75
,91
86
,29
0,4
40
Ele
ctri
city
Netw
ork
s N
et
Book V
alu
e7
,54
8,5
28
7,2
34
,00
66
,91
9,4
84
6,6
04
,96
26
,29
0,4
40
5,9
75
,91
85
,66
1,3
96
5,3
46
,87
45
,03
2,3
52
4,7
17
,83
04
,40
3,3
08
4,0
88
,78
63
,77
4,2
64
3,4
59
,74
23,1
45
,22
02
,83
0,6
98
2,5
16
,17
62
,20
1,6
54
1,8
87
,13
21
,57
2,6
10
Appendix
4B
Assumptions

ERT A
pp
en
dix
B A
rush
a Y
EA
RS
12
34
56
78
91
01
11
21
31
41
51
61
71
81
92
0
Typ
e..
....
....
....
..M
ete
r2006
2007
2008
2009
20
10
20
11
20
12
20
13
20
14
20
15
20
16
20
17
20
18
20
19
20
20
20
21
20
22
20
23
20
24
20
25
Upgra
din
g o
f N
etw
ork
Pla
nt
and E
quip
ment
Cost
– b
/f0
00
00
00
00
00
00
00
00
00
Additio
ns
in Y
ear
00
00
00
00
00
00
00
00
00
00
0
Infl
ati
on
00
00
00
00
00
00
00
00
00
00
Cost
c/f
00
00
00
00
00
00
00
00
00
00
Dep
reci
ation –
b/f
00
00
00
00
00
00
00
00
00
0
Charg
ed i
n t
he Y
ear
00
00
00
00
00
00
00
00
00
00
Dep
reci
ation c
/f0
00
00
00
00
00
00
00
00
00
0
Upgra
din
g o
f N
etw
ork
Net
Book V
alu
e0
00
00
00
00
00
00
00
00
00
00
Tota
l C
ost
7,8
63
,05
07
,86
3,0
50
7,8
63
,05
07
,86
3,0
50
7,8
63
,05
07
,86
3,0
50
7,8
63
,05
07
,86
3,0
50
7,8
63
,05
07
,86
3,0
50
7,8
63
,05
07
,86
3,0
50
7,8
63
,05
07
,86
3,0
50
7,8
63
,05
07
,86
3,0
50
7,8
63
,05
07
,86
3,0
50
7,8
63
,05
07
,86
3,0
50
Tota
l D
epre
ciation
31
4,5
22
62
9,0
44
94
3,5
66
1,2
58
,08
81
,57
2,6
10
1,8
87
,13
22
,20
1,6
54
2,5
16
,17
62
,83
0,6
98
3,1
45
,22
03
,45
9,7
42
3,7
74
,26
44
,08
8,7
86
4,4
03
,30
84
,71
7,8
30
5,0
32
,35
25
,34
6,8
74
5,6
61
,39
65
,97
5,9
18
6,2
90
,44
0
Tota
l N
et
Book V
alu
e7
,54
8,5
28
7,2
34
,00
66
,91
9,4
84
6,6
04
,96
26
,29
0,4
40
5,9
75
,91
85
,66
1,3
96
5,3
46
,87
45
,03
2,3
52
4,7
17
,83
04
,40
3,3
08
4,0
88
,78
63
,77
4,2
64
3,4
59
,74
23,1
45
,22
02
,83
0,6
98
2,5
16
,17
62
,20
1,6
54
1,8
87
,13
21
,57
2,6
10
Capital
Acc
ount
Tota
l C
ost
7,8
63
,05
00
00
00
00
00
00
00
00
00
00
7,8
63
,05
0
Less
Consu
mer
Contr
ibutions
00
00
00
00
00
00
00
00
00
00
0
Less
: Serv
ice L
ine C
onnect
ion
(72
5,8
20
)0
00
00
00
00
00
00
00
00
00
0
Fee f
rom
Con
sum
ers
Less
Subsi
dy
Contr
ibutions
(3,9
31
,52
5)
00
00
00
00
00
00
00
00
00
0(3
,93
1,5
25
)
Less
Loan
00
00
00
00
00
00
00
00
00
00
0
Bala
nce
(C
ontr
ibution b
y TA
N)
3,2
05
,70
53
,20
5,7
05
00
00
00
00
00
00
00
00
00
03
,20
5,7
05
INC
OM
E A
ND
EXPEN
DIT
UR
E
Inco
me
2,0
16
,31
3
Ele
ctri
city
and
oth
er
Sale
s1
,64
0,1
01
1,9
92
,53
32
,16
9,6
23
2,3
60
,88
02
,56
7,4
38
2,7
90
,52
02
,94
1,1
01
3,0
99
,21
03
,26
5,2
25
3,4
39
,54
13
,62
2,5
72
3,7
37
,88
23
,85
6,6
51
3,9
78
,98
44
,10
4,9
86
4,2
34
,76
84
,36
8,4
44
4,5
06
,13
04
,64
7,9
47
4,7
94
,01
86
8,1
18
,55
4
Gra
nts
and o
ther
Inco
me
3,9
43
,41
52
3,7
79
23
,77
92
3,7
79
23
,77
92
3,7
79
23
,77
92
3,7
79
23
,77
92
3,7
79
23
,77
92
3,7
79
23
,77
92
3,7
79
23
,77
92
3,7
79
23
,779
23
,77
92
3,7
79
23
,77
94
,39
5,2
24
Infla
tio
n –
Inco
me
05
0,4
08
11
1,0
41
18
3,3
58
26
9,0
02
36
9,8
22
47
3,4
72
58
9,2
64
71
8,3
28
86
1,8
92
1,0
21
,28
71
,17
3,9
64
1,3
38
,31
71
,51
5,0
90
1,7
05
,07
21
,90
9,0
99
2,1
28
,05
72
,36
2,8
83
2,6
14
,57
22
,88
4,1
75
22
,27
9,1
04
Loans
Dra
wn D
ow
n0
00
00
00
00
00
00
00
00
00
00
Inte
rest
Rece
ived
/(Pa
id)
0(3
0,3
21
)(5
6,5
25
)(4
7,4
86
)(3
6,3
57
)(2
2,4
94
)(5
,54
7)
14
,33
93
6,9
60
62
,57
39
1,4
52
12
3,8
94
15
9,7
02
19
8,6
32
24
0,8
97
28
6,7
21
33
6,3
41
39
0,0
08
44
7,9
89
51
0,5
66
2,7
01
,34
3
Sta
rt-u
p C
ap
ital
(Eq
uity
Contr
ibution)
00
Tota
l In
com
e5
,58
3,5
15
2,0
36
,39
92
,24
7,9
19
2,5
20
,53
22
,82
3,8
62
3,1
61
,62
73
,43
2,8
05
3,7
26
,59
24
,04
4,2
93
4,3
87
,78
54
,75
9,0
91
5,0
59
,52
15
,37
8,4
51
5,7
16
,48
56,0
74
,73
46
,45
4,3
67
6,8
56
,62
17
,28
2,8
01
7,7
34
,28
78
,21
2,5
38
97
,49
4,2
25
Exp
en
ditu
re
Ele
ctri
city
Purc
ha
ses
49
8,5
75
1,0
76
,92
21
,16
3,0
76
1,2
56
,12
21
,35
6,6
12
1,4
65
,14
01
,53
8,3
98
1,6
15
,31
71
,69
6,0
83
1,7
80
,88
71
,86
9,9
32
1,9
26
,03
01
,98
3,8
11
2,0
43
,32
52
,10
4,6
25
2,1
67
,76
32
,23
2,7
96
2,2
99
,78
02
,36
8,7
74
2,4
39
,83
73
4,8
83
,80
5
Ma
inte
na
nce
Co
sts
25
4,0
37
50
8,0
74
50
8,0
74
50
8,0
74
50
8,0
74
50
8,0
74
50
8,0
74
50
8,0
74
50
8,0
74
50
8,0
74
50
8,0
74
50
8,0
74
50
8,0
74
50
8,0
74
50
8,0
74
50
8,0
74
50
8,0
74
50
8,0
74
50
8,0
74
50
8,0
74
9,9
07
,44
3
Inflation –
Dir
ect
Cost
s0
39
,62
58
4,6
02
13
5,6
50
19
3,5
78
25
9,2
97
32
6,8
08
40
0,6
54
48
1,3
94
56
9,6
38
66
6,0
43
75
9,6
51
85
9,4
23
96
5,7
33
1,0
78
,97
61
,199
,57
31
,32
7,9
67
1,4
64
,62
81
,61
0,0
53
1,7
64
,76
71
4,1
88
,06
0
Fix
ed
Ass
et
Exp
end
iture
7,8
63
,05
00
00
00
00
00
00
00
00
00
00
7,8
63
,05
0
Infla
tio
n –
Ca
pita
l Exp
end
iture
00
00
00
00
00
00
00
00
00
00
0
Loa
n R
ep
aym
ents
00
00
00
00
00
00
00
00
00
00
Tota
l Exp
en
diture
8,6
15
,66
21
,62
4,6
21
1,7
55
,75
21
,89
9,8
46
2,0
58
,26
42
,23
2,5
11
2,3
73
,28
02
,52
4,0
45
2,6
85
,55
22
,85
8,5
99
3,0
44
,04
83
,19
3,7
55
3,3
51
,30
83
,51
7,1
32
3,6
91
,67
53
,87
5,4
10
4,0
68
,83
74
,27
2,4
82
4,4
86
,90
14
,71
2,6
78
66
,84
2,3
58
Move
ment
in P
eri
od
(3,0
32
,14
7)
41
1,7
78
49
2,1
67
62
0,6
86
76
5,5
98
92
9,1
16
1,0
59
,52
51
,20
2,5
47
1,3
58
,74
11
,52
9,1
86
1,7
15
,04
21
,86
5,7
65
2,0
27
,14
32
,19
9,3
53
2,3
83
,05
92
,57
8,9
57
2,7
87
,78
43
,01
0,3
19
3,2
47
,38
73
,49
9,8
60
30
,65
1,8
67
Openin
g B
ank B
ala
nce
0(3
,03
2,1
47
)(2
,62
0,3
68
)(2
,12
8,2
02
)(1
,50
7,5
16
)(7
41
,91
8)
18
7,1
99
1,2
46
,72
42
,44
9,2
71
3,8
08
,01
25
,33
7,1
98
7,0
52
,24
08
,91
8,0
06
10
,94
5,1
49
13,1
44
,50
21
5,5
27
,56
11
8,1
06
,51
82
0,8
94
,30
12
3,9
04
,62
02
7,1
52
,00
7
Clo
sing B
ank B
ala
nce
(3,0
32
,14
7)
(2,6
20
,36
8)
(2,1
28
,20
2)
(1,5
07
,51
6)
(74
1,9
18
)1
87
,19
91
,24
6,7
24
2,4
49
,27
13
,80
8,0
12
5,3
37
,19
87
,05
2,2
40
8,9
18
,00
61
0,9
45
,14
91
3,1
44
,50
21
5,5
27
,56
11
8,1
06
,51
82
0,8
94
,30
12
3,9
04
,62
02
7,1
52
,00
73
0,6
51
,86
7
Ave
rage B
ala
nce
duri
ng Y
ear
(1,5
16
,07
3)
(2,8
26
,25
8)
(2,3
74
,28
5)
(1,8
17
,85
9)
(1,1
24
,71
7)
(27
7,3
60
)7
16
,96
11
,84
7,9
97
3,1
28
,64
24
,57
2,6
05
6,1
94
,71
97
,98
5,1
23
9,9
31
,57
71
2,0
44
,82
51
4,3
36
,03
11
6,8
17
,03
91
9,5
00
,40
92
2,3
99
,46
02
5,5
28
,31
32
8,9
01
,93
7
Inte
rest
(Pa
id)/
Rece
ived
(30
,32
1)
(56
,52
5)
(47
,48
6)
(36
,35
7)
(22
,49
4)
(5,5
47
)1
4,3
39
36
,96
06
2,5
73
91
,45
21
23
,89
41
59
,70
21
98
,63
22
40
,89
72
86
,72
13
36
,34
13
90
,00
84
47
,98
95
10
,56
65
78
,03
9

ERT A
pp
en
dix
B A
rush
a Y
EA
RS
12
34
56
78
91
01
11
21
31
41
51
61
71
81
92
0
Typ
e..
....
....
....
..M
ete
r2006
2007
2008
2009
20
10
20
11
20
12
20
13
20
14
20
15
20
16
20
17
20
18
20
19
20
20
20
21
20
22
20
23
20
24
20
25
Pro
fit
and L
oss
Inco
me
5,5
83
,51
52
,06
6,7
21
2,3
04
,44
42
,56
8,0
18
2,8
60
,21
93
,18
4,1
22
3,4
38
,35
23
,71
2,2
53
4,0
07
,33
34
,32
5,2
12
4,6
67
,63
94
,93
5,6
26
5,2
18
,74
85
,51
7,8
53
5,8
33
,83
76
,16
7,6
47
6,5
20
,28
06
,89
2,7
93
7,2
86
,29
87
,70
1,9
72
Exp
en
dit
ure
8,6
15
,66
21
,62
4,6
21
1,7
55
,75
21
,89
9,8
46
2,0
58
,26
42
,23
2,5
11
2,3
73
,28
02
,52
4,0
45
2,6
85
,55
22
,85
8,5
99
3,0
44
,04
83
,19
3,7
55
3,3
51
,30
83
,51
7,1
32
3,6
91
,67
53
,87
5,4
10
4,0
68
,83
74
,27
2,4
82
4,4
86
,90
14
,71
2,6
78
Gro
ss M
arg
in(3
,03
2,1
47
)4
42
,10
05
48
,69
26
68
,17
28
01
,95
59
51
,61
11
,06
5,0
72
1,1
88
,20
81
,32
1,7
81
1,4
66
,61
31
,62
3,5
90
1,7
41
,87
11
,86
7,4
40
2,0
00
,72
22
,14
2,1
62
2,2
92
,23
62
,45
1,4
43
2,6
20
,31
02
,79
9,3
98
2,9
89
,29
4
Dep
reci
atio
n3
14
,52
23
14
,52
23
14
,52
23
14
,52
23
14
,52
23
14
,52
23
14
,52
23
14
,52
23
14
,52
23
14
,52
23
14
,52
23
14
,52
23
14
,52
23
14
,52
23
14
,52
23
14
,52
23
14
,52
23
14
,52
231
4,5
22
31
4,5
22
Op
era
ting
Pro
fit
(3,3
46
,66
9)
12
7,5
78
23
4,1
70
35
3,6
50
48
7,4
33
63
7,0
89
75
0,5
50
87
3,6
86
1,0
07
,25
91
,15
2,0
91
1,3
09
,06
81
,42
7,3
49
1,5
52
,91
81
,68
6,2
00
1,8
27
,64
01
,977
,71
42
,13
6,9
21
2,3
05
,78
82
,48
4,8
76
2,6
74
,77
2
Inte
rest
Pa
id(3
0,3
21
)(5
6,5
25
)(4
7,4
86
)(3
6,3
57
)(2
2,4
94
)(5
,54
7)
14
,33
93
6,9
60
62
,57
39
1,4
52
12
3,8
94
15
9,7
02
19
8,6
32
24
0,8
97
28
6,7
21
33
6,3
41
39
0,0
08
44
7,9
89
51
0,5
66
57
8,0
39
Inte
rest
on L
oans
00
00
00
00
00
00
00
00
00
00
Net
Pro
fit
befo
re T
ax
(3,3
76
,99
0)
71
,05
31
86
,68
43
17
,29
34
64
,93
96
31
,54
17
64
,89
09
10
,64
61
,06
9,8
32
1,2
43
,54
31
,43
2,9
63
1,5
87
,05
21
,75
1,5
50
1,9
27
,09
62
,11
4,3
61
2,3
14,0
55
2,5
26
,92
92
,75
3,7
78
2,9
95
,44
23
,25
2,8
11
Fin
an
cia
l V
iab
ility
(3,2
05
,70
5)(3
,37
6,9
90
)7
1,0
53
18
6,6
84
31
7,2
93
46
4,9
39
63
1,5
41
76
4,8
90
91
0,6
46
1,0
69
,83
21
,24
3,5
43
1,4
32
,96
31
,58
7,0
52
1,7
51
,55
01
,92
7,0
96
2,1
14
,36
12
,31
4,0
55
2,5
26
,92
92
,75
3,7
78
2,9
95
,44
23
,25
2,8
11
(TA
N C
ontr
ibution)
Appendix
4B
Assumptions

Profit
4,000,000
3,000,000
2,000,000
1,000,000
0
-1,000,000
-2,000,000
-3,000,000
-4,000,000
1 2 3 4 5 6 7 8 9 10 11 12 13 14 15 16 17 18 19 20
Net Profit (Loss)before Tax US$
Years
35,000,000
30,000,000
25,000,000
20,000,000
15,000,000
10,000,000
5,000,000
0
(-5,000,000)
1 2 3 4 5 6 7 8 9 10 11 12 13 14 15 16 17 18 19 20
Bank Cash
ANNEX 4: EXAMPLE FROM TANZANIA

SUB-SAHARAN AFRICA: INTRODUCING LOW-COST METHODS IN ELECTRICITY DISTRIBUTION NETWORKS
154
25.00
20.00
15.00
10.00
5.00
0.00
-5.00
Analysis of SalesU
S$
Years
Profit on Sales Net Operating Cost
2006 2007 2008 2009 2010 2011 2012 2013 2014 2015 2016 2017 2018 2019 2020 2021 2022 2023 2024 2025

155
Connections US$ US$
Area Dom Other Cost Cost/Con
Usa 1 3,656 1,893 2,233,945 403
Usa 2 350 220 149,412 262
Usa 3 460 104 217,710 386
Monduli 1 50 0 26,793 536
Monduli 2 33 0 21,629 655
Monduli 3 170 42 113,372 535
Monduli 4 100 39 33,112 238
Monduli 5 200 33 108,900 467
Mererani 844 110 809,779 849
Babati 1 702 154 725,831 848
Babati 2 260 54 101,608 324
Babati 3 55 10 10,497 161
Karatu 280 106 412,370 1,068
Mbulu 1,140 377 1,219,439 804
Totals Original 8,300 3,142 6,184,397 540
Totals as Revised 11,023 1,074 6,184,398 511
Total Connections 12,097
Data
ANNEX 4: EXAMPLE FROM TANZANIA


Contrary to popular belief, the model shows that electrification, using ERT principles combined with a smart
subsidy of 50 percent and “low-cost” strategies can be viable and sustainable and even generate a good
profit margin. This has been demonstrated elsewhere in Africa2 and comes as no surprise to the proponents
of this concept.
It is clear that viable rural and peri-urban networks do exist and that they work satisfactorily.
The low-cost package will promote viability especially if it includes:
a) A marketing strategy for both networks and consumption;
b) Reduction of construction and operating and maintenance costs by the use of local labor; and
c) Monetizing of the local population in area to be electrified by training and the deployment of local
labor.
Utility companies will need to be flexible with respect to standards, construction, metering, revenue collection
and O&M methods.
Utility companies will need to adopt a more business-oriented approach to electrification if it is to be sustainable
and thereby acquire support from local banks.
The low-cost construction technologies set out in this report are tried and tested methods that work well.
Some utilities still express reluctance to adopt some of these new methods citing that they need to be tested
under local conditions. This appears to be overly cautious, as all the methods have already been tried and
tested over many years in various African countries.
4. Conclusion
2 Transitional Electricity Distributor, please see the references at the end of this section.
157

SUB-SAHARAN AFRICA: INTRODUCING LOW-COST METHODS IN ELECTRICITY DISTRIBUTION NETWORKS
158
It is proposed that in future, the World Bank should encourage competitive bidding for ERT smart subsidies
on the basis of the lowest subsidy per connection. This would encourage acceptance of low-cost strategies
and business-oriented methods.
Possibly, there should be an independent African organization to act like an African Energy Regulator to
administer funds for electrification. This organization would invite and assess bids based on the lowest cost
per connection and, thereafter, award funds in terms of a set of rules. Connections actually made would be
audited before releasing the funds. In most circumstances, there would have to be some advance funding
to facilitate aerial photography, mapping, design, estimation and preparation of bid documents.
Hopefully, this approach would lead to a rapid increase in access to electricity throughout the continent. As
everyone knows, electricity usage and wealth creation are closely linked and this is surely one of the fastest
and most cost-effective ways of improving the lives of ordinary people and facilitating improvements in both
health and education.

159
1. ESMAP presentations 1 to 8 on “Mainstreaming Low-Cost Innovations in Electricity Distribution Networks”.
World Bank Energy Week, 2006.
2. An assessment of SA prepaid electricity meter experiment, lessons learned and their policy implications
for developing countries, 2002. D. O. Tewari and Tushaar Shah, (in electronic format) www.elsevier/
locate/enpol
3. Davies, I. C.: Response to the above report, February 2003.
4. National Electrification Program (NEP) 1994-1999, Summary Evaluation Report, Department of
Minerals and Energy, RSA, November 2001.
5. National Electrification Program (NEP) 1994-1999, Report 8, DBSA, Transitional Electricity Distributor
TED (Pty) Ltd, Mpumalanga, RSA.
6. Davies, I.C.: Transitional Electricity Distributor (TED) Mpumalanga South Africa. An example of a
viable distributor to low-income households, 2004.
5. References


Annex 5
Typical Program forWorkshops held in Tanzania,Mozambique, Uganda and Zambia


1. Introduction
Opening Remarks by the World Bank Representative
Mr Ralph Karhammer welcomed members to the workshop and appreciated their continued interest in RE.
He noted that high costs of new connections in rural areas are a hindrance to RE. However, some countries
had successfully introduced several methods of low-cost RE achieving a wider coverage.
The high costs of RE had resulted in a lot of attention. World Bank and other agencies promoting RE had
sponsored the workshop.
Presentation of Papers
Various papers on low-cost innovations were presented. Country-specific experiences from Tunisia, Ghana,
South Africa, Australia, and New Zealand were presented.
The main facilitators of the workshop were:
• Mohamad Moncef Aissa, STEG, from Tunisia;
• Jabesh Amissah-Arthur from Ghana;
• John Tulloch from New Zealand; and
• Ian Davies from South Africa.
163


165
2. Rural Electrificationin Tunisia
The Presentation Covered the Following:
• The history of STEG, which undertakes rural electrification programs.
• The importance of national commitments to their RE program.
• Recent developments in RE in Tunisia which has grown from 6 percent in 1976 to 97 percent in
2002.
• RE as one of the national pillars of development.
• Institutional approach to RE.
• The selection process in identifying RE projects.
• Financing of RE.
Factors that Led to Cost Reduction and Optimization
• Early computerization and development of software applications
• Training
• Demand forecasting – planning of grid expansion
• Operational norms and guidelines
• Private participation in electric grid material supply
• A sophisticated inventory management system
• A rigorous consumer management
• Hotline working
• Consumer service
Socio-economic Impacts of RE Perception
As a result of RE, many synergy effects have resulted. The RE policy in Tunisia has been highly integrated
with rural development including drinking water, transportation and communication, infrastructure, health
and education. The socio-economic achievements include:

SUB-SAHARAN AFRICA: INTRODUCING LOW-COST METHODS IN ELECTRICITY DISTRIBUTION NETWORKS
166
• Poverty has reduced to 7 percent today
• Primary school enrolment increased to 97 percent
• Literacy rate of 74.2 percent
• Life expectancy now increased from 50 to 75 years
• Status of women has improved. They are now one-third of the workforce
• Real GDP per capita increased from US$770 in 1975 to US$2,700 in 2003
• Rate of urbanization reduced from 4.3 percent in 975 to 1.2 percent in 1999
• Nationally, 72 percent of Tunisians had refrigerators and 92 percent had televisions during the 1994
Census
RE has, therefore, benefited the sectors of education, health, small-scale enterprises, water, agriculture and
communication.

167
3. The Shield Wire Schemein Ghana
The Presentation Addressed the Following:
• Background and rationale for SWS
• SWS – description
• Introduction and deployment in the field of SWS
• Features of SWS
• Application of SWS
• Benefits and savings of SWS
• Limitations and challenges
• Special SWS specification equipment
• Conclusions and recommendations regarding SWS
Description of SWS
• The SWS uses the sky/shield wire which is normally grounded with no voltage and only shields the
power lines below
• The sky/shield wire in this case is
- Insulated for MV operation
- Energized 20 kV to 34 kV from substation
- Supplies loads using earth ration current
- It still functions as a power line protection
Savings and Benefits
• Installation cost is lower due to common usage of conductors and ground rods
• Does not add to the transmission line “right-of-way”
• Operational performance is better
• Outage rates are low and permanent faults are rare
• Low sub-transmission losses due to the conductor size

SUB-SAHARAN AFRICA: INTRODUCING LOW-COST METHODS IN ELECTRICITY DISTRIBUTION NETWORKS
168
• Maintenance burden is extremely low
• Other benefits include community protection of the transmission line
Conclusions and Recommendations
• Ghana has had 15 years of satisfactory operation
• SWS is technically viable and financially cost-effective for power supply to settlements within a 20 km
corridor of the transmission line up to 100 or 150 km from the source
• Operation is simple but design requires expertise
• Deployment of SWS is best implemented within construction of new transmission lines
• SWS is best suited for sparsely populated regions traversed by transmission lines

169
4. New Zealand andAustralian Experience
The Presentation on the New Zealand and Australian Experience with SWER
Covered the Following:
• What SWER stands for
• How it all started
• How it works
• Advantages of SWER
• SWER basics
• SWER limitations
• Design requirements
• SWER options
• Voltage selection
• Upgrading
• SWER in New Zealand
• SWER in Australia
• The SWER experience
It was observed that by using SWER, the two countries had benefitted from substantial cost savings. Capital
cost savings were also made to the tune of 50 percent less than two-wire, three-phases. The estimated cost
saving in SWER maintenance is 50 percent
In conclusion, from their experience, the SWER is a success – it achieved its purpose, it is safe, reliable and
provides economic power supply to remote, sparsely populated areas, and it enables setting up of modern
farming and rural industries.


171
The target initially aimed at having US$450 construction cost per connection, expected 350 kWh per month
per household, having US$9 as connection fees and a tariff of 3 US cents per kWh.
The reality was far from their expectations. The construction cost was US$400-US$700 per connection;
consumption was 90 kWh per month per household. The connection fee was increased to US$150 for
60 Amp single-phase and the O&M cost exceeded income even at the marginal cost.
A survey conducted to review the electrification program came up with the following findings:
• There is strength in diversity of institutions
• Most networks were not financially viable or sustainable
• There was little economic activity generated by electrification where 2.5 Amp connections were used
• Prepaid metering did not solve the problem of non-payment and prepayment meters have a short
lifespan and are expensive
• Basic information was not available in many cases
This model was not found to be affordable in Africa.
Other Experiences
There were other areas with better experience in RE
• Middleburg had 98 percent payment rate and 100 percent electrification
• Kimberly was making profit
• Northern Electricity, Namibia, was successful
• TED had more than 95 percent payment levels, 90,000 connections in rural areas, involved low-cost,
was viable and sustainable.
5. The South Africa Experience
SUB-SAHARAN AFRICA: INTRODUCING LOW-COST METHODS IN ELECTRICITY DISTRIBUTION NETWORKS
172
The approach used by TED included:
• Joint venture between the community and Eskom – 50/50
• Market demand-driven approach
• Low-cost design and construction
• Upgradable network
• Financial discipline
• Lower losses 18 percent (10 percent technical and 8 percent non-technical)
This resulted in the following cost reductions:
• Design reduced to bare essentials
• Very accurate knowledge of load flows and network conditions
• 60 Amp supply – 0.6 kVA ADMD
• Upgradable network (when upgrading is needed the increased load flow results in increased revenue
and the upgrade can often be managed out of the increased revenue)
• Lowest construction cost by using local contractors
• Keeps cash within the community
• Reduced costs by 50 percent without comprising on quality, quantity and safety
The overall result in 1999
• TED doubled target for connections rising from 60,000 in 10 years to 120,000
• All bills were paid on time
• Good commercial activity
• There was US$1.7m cash in the bank
• There was good cash flow and investment opportunities
Conclusion
• Low-cost viable networks exist
• They are viable and sustainable even for rural areas
• They need to be nursed financially for about eight years after which they are self-supporting
• This can be a winning strategy for many countries

173
The Presentation Covered the Following:
• Change in focus for mass electrification
• Affordability survey – this is the key task
• Network and construction cost
• Modern technology
• Marketing the product
• Marketing the network
• Various metering options
• Management issues
• Common thread for viable distribution companies
In summary it was noted that:
• Most of Africa needs huge distribution development (70 percent)
• Democratic and demographic pressures will drive the demand
• Electrification can be affordable for all
• Successful countries will be more economically active and competitive
• Affordable electrification generates wealth for all
• Mass electrification need not be a black hole into which money is sunk without any benefits
6. “Appropriate Engineering” fromthe South African Experience


175
7. Cost Reduction Ideas forUganda Emerging from the
Workshop
A two-day workshop was held in the Africana Hotel at Kampala, from January 16-17, 2005. Forty delegates
attended on Day One and 25 on Day Two. The presentations during Day One were well-received by the
audience and pertinent questions were asked to the speakers. An invited panel at the end of Day One
discussed various barriers and different aspects of RE. On Day Two, the workshop aimed at highlighting
possible ways forward for Uganda, taking into consideration the specific situation in the country and lessons
from Tunisia, Ghana, New Zealand, South Africa, etc.
Two groups presented their findings. The summary of these discussions was:
• SWT on 132 kV transmission lines should be applied to both existing lines as well as to forthcoming
ones. In case of upgrading, special consideration should be taken to change existing steel wires to
ACSR conductors, also likely to include optical fiber links.
• Shield wire techniques should be applied by UEDCL in all future projects. REA should consider developing
future projects with shield wire distribution.
• Regarding system voltages, special attention shall also be given to 22 kV for rural electric distribution.
• SWER systems should be widely accepted and used wherever possible. However, special attention
should be taken to protect the earth wires/conductors from being stolen or vandalized perhaps by
concealing the earth wire in hollow concrete poles. It was further recommended that ongoing pilot
projects should be designed to demonstrate the applicability of SWER technology in Uganda.
It was stressed that the Makerere SWER pilot project should be carefully monitored and evaluated. REA was
requested to come up with more demonstration projects. Some delegates were of the opinion that this
technique had been amply demonstrated and there should be no impediment to applying it without further
delay. It was proposed that metering options should be flexible and applied according to the local conditions.
Moreover, the group recommended that connection fees should be payable on extended credit (12 months)
to assist poorer households.
• It was further stressed that ready boards and simpler house wiring techniques should be implemented
in Uganda in forthcoming projects. Ready boards should be more actively promoted by the ERA and
locally produced in Uganda, due attention being paid to quality control and safety standards.

SUB-SAHARAN AFRICA: INTRODUCING LOW-COST METHODS IN ELECTRICITY DISTRIBUTION NETWORKS
176
• Design codes should be adjusted to allow for simpler construction methods and allow low-cost techniques.
In a concluding remark, the ERA also pointed out the strong need to introduce a “culture of maintenance”,
now almost invisible in Uganda.

177
8. Cost Reduction Ideas forTanzania Emerging from the
Workshop
Discussions concentrated on changing specifications to reduce costs, safety aspects when changing house
wiring and introducing of ready boards. Aspects of planning and possible marketing of the network were
also discussed. It was also mentioned that “living standards” should be applied and rigid, inflexible standards
discarded. Regions remote from the national grid should be addressed by the REA as a priority.
Discussion also focused on the linkage between policy and technology matters. It was recommended that
there should be greater flexibility with metering issues, (e.g. prepayment, credit, flat rate and current
limiting devices). Optimal use should be considered, based on the local conditions.
Distribution line standards should be reviewed taking account of safety issues to reduce costs.
Internal house wiring should be made cheaper (based on Dar es Salaam Institute of Technology (DIT)
findings) and ready boards produced locally in Tanzania (it may be noted that DIT has taken the initiative
with prototype, locally made, ready boards and research into house wiring).
Further, more efforts should be put on marketing the distribution lines to end-users.
The following cost reduction ideas were proposed for Tanzania:
• Introduction of least-cost electrification
• Introduction of single-phase motors (3-75 kW) into the Tanzanian commercial market
• Introduction of SWER technology for energizing small remote rural load centers
• Introduction of shield wires in new transmission line corridors for cost-effective distribution
• Introduction of ready boards and current limiting devices and simpler house wiring methods to address
the needs of poorer households
The government-initiated plans from 2007 to 2010 are expected to increase the rate of new connections
dramatically to about 200,000 over this four-year period by using ERT and low-cost technologies.

179
9. Cost Reduction Ideas forMozambique Emerging from the
Workshop
The one-and-half-day workshop held in Hotel Avenida, Maputo, was very well-attended.
Two groups discussed the strategies for a way forward. The summaries of the group recommendations are:
• Need for wider distribution of knowledge about low-cost options
It was recommended that there should be more, specifically oriented workshops involving more
categories of technicians in the design and planning process. More time should be spent analyzing
input data before constructing RE projects. Peri-urban electrification should be included in the master
plan as a high priority and the master plan should be used to integrate all RE activities (urban/peri-
urban and rural)
• Involvement of communities in the early stages of planning
It was recommended that EdM make contact with local community leaders during the early planning
stages to optimize designs and get priorities right. Projects should be developed with a view to sustainability
rather than from purely social considerations.
• More flexible payment schemes needed
As one of the key barriers for rural people are the upfront connection costs, it was recommended that
the connection cost be spread out over one to two years.
Revise the Present Standards and
Develop more Appropriate Rural Standards
A more flexible design approach was recommended in which innovative ideas would be adopted to find the
most appropriate solutions. It was proposed that better and cheaper house wiring schemes and ready
boards should be permitted to reduce the cost of connection for poor households.


181
10. Cost Reduction Ideas forZambia that Emerged from the
Workshop
During the workshop, various questions and issues were raised about the tariffs, experiences from shield
wires and the SWER. One important lesson learnt was how STEG, in Tunisia, successfully changed their
distribution network, although adding 9 percent cost to line costs but saving 30-40 percent overall on the
distribution network.
During panel discussions, it was suggested that grid extension should not be the only solution for the provision
of electricity to rural areas. It was crucial to consider the economics of grid extension and consider other
systems such as mini- and micro-hydro, biomass, etc, where these could offer least-cost and effective
options.
It was suggested that the Government should consider smart subsidies on capital costs for RE so that economic
and affordable tariffs could be charged.
The need for private sector and local equity were emphasized to ensure empowerment was realized at the
local level.
Two groups (A and B) were formed and were requested to discuss what methods, techniques and approaches
from Tunisia, South Africa, Ghana and New Zealand could be applied in Zambia and how should an “ideal”
RE strategy emerge.
The discussion revolved around the following themes:
• Approach and targets
• Mechanism
• Techniques

SUB-SAHARAN AFRICA: INTRODUCING LOW-COST METHODS IN ELECTRICITY DISTRIBUTION NETWORKS
182
Group A Submissions
• Since the Government is not able to extend the national grid to all corners, the Government has to
come up with a strategy to use PV as a start-up for development.
• Mini-hydro sites, which have already been identified, should be developed to lower grid extension
costs.
• Government to encourage private sector participation and tariff-settings to be left to the investor and
Energy Regulation Board (ERB).
• Areas in far isolated locations of Zambia should be connected to electricity systems.
• Tariff was identified as a hindrance to private sector participation since the present ZESCO tariff was
considered to be too low. Tariff-setting should consider applying cost-reflective tariffs.
Group B Submissions
Approach and targets
• Rural Electrification Agency (REA) was identified as the “key driver” for RE.
• Once fully operational, REA should formulate a RE master plan.
• The master plan should consider needs/demand assessments, resource availability and technology
selection influenced by need and resource availability.
• Tariff-setting should consider cost-reflective principle.
• Consider an integrated approach to issues of subsidy.
• Master plan to set targets and for priority projects list devised for implementation.
Mechanisms
• Master plan to formulate financing mechanisms which takes account of community participation.
• Master plan to outline how projects will be implemented either through Build Own Transfer (BOT) or
Build Own Operate (BOO) or a combination.
Techniques
• Different techniques may be used in Zambia but they have to be cost-reflective.
• In view of special peculiarities, the techniques proposed (SWER, SWS, etc,) will require pilot studies
and testing to ascertain suitability.
• Socio-economic studies should be undertaken to consider non-technical issues like theft.

Elizabeth Cecelski, Ahmed OunalliMoncef Aissa, and Joy Dunkerley
Annex 6
Low-cost Electricity andMultisector Developmentin Rural TunisiaImportant Lessons from the Tunisian Success Story


The Government of Tunisia has strongly supported rural electrification (RE) since the early 1970s. Although
the program has done many things right to accomplish the country’s goal of universal electricity access, one
unique feature of the program has been the extensive consultation with other agencies and reliance on
funds from rural development programs. The country’s leaders understood from the start of the program
that electricity, by itself, will not have the development impact of a program which is integrated into a
broader strategy of rural development.
Tunisia’s RE program was launched in the mid-1970s, a time when only 6 percent or 30,000 of the
country’s rural households had electricity. At that time, about one-half of Tunisia’s population lived in rural
areas. Over the ensuing years, the country has made impressive gains in providing electricity to its rural
population. By the end of 2000, 88 percent of all rural households had electricity service. Today, the
country has begun a program to serve even the most remote areas with PV systems. The current goal is to
achieve total rural coverage by the year 2010, with 97 percent households having a grid connection and 3
percent of households served by PV systems. The accomplishment is even more remarkable because of the
very conservative definition of rural areas, which includes only households outside of incorporated areas.
People living in the villages in other countries would be defined as “rural”, but in Tunisia villages and towns
are defined as “urban”. Thus, Tunisia’s rural population is highly dispersed and isolated, with long distances
between small groups of sometimes scattered houses.
Tunisia has been able to artfully balance the sometimes conflicting priorities of having substantial state
subsidies, integrate RE with rural development goals and maintaining the commercial viability of a public
electricity company. As Tunisia approaches universal electricity coverage, the question arises as to whether
the experience in Tunisia is applicable to RE programs in other African nations. The many factors that
contributed to the program’s success – strong government policy and financial commitment, gender and
social equity, institutional esprit de corps, technical innovation and uniquely enabling political and economic
conditions – are lacking in many other African countries. Nonetheless, the Tunisian experience can provide
useful lessons – even in some of the most unpromising situations.
1. Electricity and MultisectorDevelopment in Rural Tunisia*
185
* This chapter was prepared by Elizabeth Cecelski, Ahmed Ounalli, Moncef Aissa and Joy Dunkerley. The authors are particularly grateful to RaoufMaalej, Anis Besbes and Radhouane Masmoudi of the STEG Distribution Directorate and to the STEG District Chiefs and offices for their valuablecontributions and comments. The authors would also like to thank Neiji Amaimia and Amor Ounalli of the ANER for their analysis of Tunisia’sphotovoltaic (PV) experience. Thanks also go to N Hammami for his comments and to the ANER office in Kef, particularly M Njaimi, for fieldassistance. Finally, the authors wish to thank Gerald Foley and Robert van der Plast for reviewing drafts of this chapter and Allen Inversin, of theNational Rural Electric Cooperative Association (NRECA), for his useful insights and comments.

186
SUB-SAHARAN AFRICA: INTRODUCING LOW-COST METHODS IN ELECTRICITY DISTRIBUTION NETWORKS
History of Rural Electrification in Tunisia
Electricity generation in Tunisia began in 1902, when a French concessionaire, which was already providing
gas, installed the first power plant to service the capital city of Tunis. Various French companies rapidly
followed suit, constructing power plants in the cities of Sousse (1905), Sfax (1907), Ferryville (1909) and
Bizerte (1911). On the eve of Tunisia’s independence from France, in 1956, seven concessionaires controlled
the country’s electricity generation and distribution. The largest of these companies was the CTET, established
in 1952, which serviced Grand Tunis and parts of the northwest region. The concessionaires designed their
own networks and produced their own electricity or subcontracted producers to maximize profitability of
their concession areas and duration of their respective contracts. This resulted in companies sacrificing
long-term interests for short-term profitability, making few investments in infrastructure and alleviating
shortages with uncertain solutions.
CTET owned Goulette, Tunisia’s oldest and most powerful steam thermal power station (57 MW in 1952).
FHET, the country’s second largest concessionaire, created in 1952, was responsible for hydroelectric
power plants in Ben Metir and Neber in the northwest region. Other companies, which mainly generated
diesel, distributed electricity to various cities and urban areas, including Béja, Bizerte, Gabès, Gafsa,
Médenine, Sousse, Sfax, Tozeur and Zarzis. In addition, Tunisia imported electricity from the Algerian
Electricity and Gas Company (EGA), which also had interests in FHET. The network consisted of the
interconnection with Algeria and the connection between hydroelectric plants in the northwest and Grand
Tunis. At this time, RE was extremely limited.
After gaining independence, the Tunisian Government initiated a general policy to nationalize key economic
activities, including electricity and gas, water, railroads and banks. In 1958, the Government temporarily
took control of the concessionaires, replacing CTET and the other companies with management committees.
On April 3, 1962, the government nationalized electricity generation, electricity and gas transport and
distribution. These activities were entrusted to STEG (as a public utility). At that time, only 26 percent of
Tunisian households had access to electricity.
In the decade that followed, owing to rapid growth in domestic consumers and initial extension of the grid
into rural areas, electricity consumption increased at a pace of 11.5 percent annually. STEG concentrated
its efforts on rationalizing the system it had inherited from the concessionaires. Electricity generation and
transport were developed to meet the demand of new industrial projects, such as El Fouledh steelworks, and
the textile industry. In 1965, Goulette 2 was installed, including four groups of 27.5 MW each. In 1972, a
power plant was built in the southern city of Ghannouch, which included two groups of 30 MW each and a
15 MW gas turbine. Part of the electricity thus generated was used in Gabès’ new industrial units and the
rest was transported to other regions through a newly looped system. Electricity generation in Baves was
favored through exploitation of flared gas in the southern region (El Borma oilfield associated gas) and
construction, in 1972, of a gas pipeline connecting the oil field with the Gabès area.

187
With assistance from the French utility, EdF, and the proactive education policy of the Tunisian Government,
STEG developed a cadre of highly qualified technicians and engineers. By the mid-1970s, the utility had
established sound business practices and financial sustainability achieved through tariffs related to marginal
costs. As indicated, just 6 percent of rural households and only 37 percent of all households in the country
had access to electricity during that period of time.
The Tunisian Government, now increasingly concerned about the exodus from rural areas caused by lack
of public services, turned its attention to expanding RE. In 1973, STEG, with the assistance of Hydro-
Quebec, undertook a technical audit of distribution systems. The audit took into account the Government’s
ambitious goals of providing universal electricity coverage for the whole country, the potentially quite low
levels of rural energy consumption and high financial requirements.
The main recommendation of the audit was to study a new, lower cost means of electricity distribution which
combined three-phase and single-phase lines. Based on the North American model, this system was known
in Tunisia as the MALT. Although controversial at the time, the recommendation was confirmed by technical
and economic studies conducted for the Master Plan for Distribution in 1974-1975. The studies estimated
18-24 percent savings using the MALT system. In 1976, the technical decision was made to begin converting
to the new system, using three-phase/single-phase lines and 30 kilovolts kV. On this basis, the Planning
Ministry, together with STEG, set RE goals that were incorporated into the Vth Plan (1977-1981) and
subsequent Five-Year Plans (Table A 6.1).
Table A 6.1: Evolution of Tunisia’s Rural Electrification Program, 1972-2001
Five-year Planning Periods
IV V VI VII VIII IX
Factor (1972-1976) (1977-1981) (1982-1986) (1987-1991) (1992-1996)(1997-2001)
Total Investment (MTD) 29 52 105 130 134
No. of New Connectionsa 30,000 70,000 80,000 114,000 180,000 135,000
Cumulative Connections 100,000 180,000 294,000 474,000 609,000
% Rural HH with Electric 6 16 28 48 75.7 88.1
% Total HH with Electric 37 56 69 81 90.0 94.9
No. of New HH With PV Systemb 3,919c 3,838
a Implemented through the year 2000.b PV program adds about 1 percent to rural electrification coverage.c Cumulative through the end of the Eighth Plan.
ANNEX 6: ELECTRICITY AND MULTISECTOR DEVELOPMENT IN RURAL TUNISIA

188
SUB-SAHARAN AFRICA: INTRODUCING LOW-COST METHODS IN ELECTRICITY DISTRIBUTION NETWORKS
The Vth Plan allocated Government funds for system expansion and identified villages to be electrified,
based on lowest-cost criteria. STEG’s main emphasis was on converting the existing distribution system to
the MALT system. During this five-year period, 70,000 rural households were connected, and investment
costs were fully recovered. During the VIth Plan (1982-1986), 80,000 rural households were connected.
Savings from the new distribution system made it possible to connect an additional 10,000 households
under the same budget, raising the rate of RE to 28 percent.
The majority of the financing for RE came directly from the budget of the Government. It was not until the
VIIth Plan (1987-1991) that Tunisia’s Government, for the first time, mobilized external funding for the
program from ADB, the Kuwait Fund and the ADF. This initiated a very intensive phase of the RE program.
From 1987 to 2000, 429,000 households were connected to the grid, raising the rate of RE from
28 percent in 1986 to 88 percent in 2000. Recognizing that the last remaining households were scattered
throughout very remote areas, the National Agency for Renewable Energy (ANER) in 1990 launched a PV
program that has now reached about 1 percent of rural households.
National Commitment to Rural Electrification
Tunisia’s achievement in RE has been rooted in a strong national commitment to integrated rural development,
gender equity and social equality. The rationale for the national Government’s long-standing resolve for
rural development and modernization was based on the goal that seek to raise the living standard of its rural
citizens, to promote security in outlying regions and to moderate urban growth.
The three pillars under which rural development was initiated by the country’s IVth Five Year Plan
(1972-1976) were basic education, improved health services (including family planning) and RE. These
goals were progressively complemented by other development programs, such as roads and telephone
networks, better housing, and promotion of rural economic activities.
At the dawn of independence, the population of Tunisia was predominantly rural, with a high demographic
growth rate, high infant mortality and high rate of illiteracy. Improving basic living conditions in rural
areas – through the education of children and the improvement of sanitary and health conditions of families
– was seen as necessary to laying the foundation for rural development. Mothers were viewed as essential
to ensuring education and health, so the decision was taken to give Tunisian women the pivotal role in rural
development and to associate women with all rural development efforts.
The three pillars of rural development – education, health and electricity
The first pillar of Tunisia’s rural development strategy, formalized in 1972, was education. Since its
independence from France in 1956, Tunisia has been at the vanguard of promoting human resources
development in the region, with particular emphasis on women’s education.

189
Prior to independence, most Tunisian women were illiterate. The most advantaged women had only an
elementary level of education. Even by the 1960s, female university graduates numbered only about 100.
Nonetheless, women participated actively in the struggle for national independence. This was perhaps a
factor in the keen personal interest of Tunisia’s first President, Habib Bourguiba, in promoting women’s
rights.
Immediately following independence, on August 13, 1956, a Personal Services Code (PSC) was promulgated.
Among its other provisions, the PSC abolished polygamy, instituted judicial divorce, gave women the right to
vote, and set a minimum age of 17 for girls to marry. The suppression of polygamy, in particular, had an
enormous symbolic effect in Tunisia and throughout the world, even though it represented only 4 percent of
marriages in Tunisia.
In the decades following the introduction of the PSC, the Tunisian Government invested heavily in education
to ensure that women could take advantage of their new legal rights. The emancipation of women, viewed
as a struggle against ignorance, emphasized the education of girls. As a result, attitude toward girls’ education
changed radically. The principle of co-educational schools was recognized as a fundamental means of
progress and was adopted in schools run by the Ministry of Education. Today, more than 90 percent of both
girls and boys are enrolled, and Tunisian women have one of the highest literacy rates in the Arab world.
Female students outnumber males in universities; 5,000 women head private companies and 12 percent
of senior business executives and 35 percent of doctors are women.
The second pillar in the rural development strategy was health. This program mainly involved provision of
basic health and family planning services. Women’s right to control fertility and have access to modern
means of contraception was central. At the time of independence, female mortality was higher than male
mortality. Subsequent improvement of women’s access to health services, as well as education, allowed
greater participation of women in salaried work, another positive factor for women’s rights. Today, Tunisian
women have an average life expectancy of 74 years and an average of only 2.2 children.
RE was the third pillar of Tunisia’s rural development program, and the Government understood that it was
important for it to be coordinated with both education and health. Not only did RE facilitate education and
health services as well as the provision of water and economic activities; it permitted higher penetration of
the media, especially television, which introduced rural Tunisian families to various roles for women in
urban areas and in other countries.
The national commitment to developing and improving rural living standards involved considerable investments
in RE on the part of the Government. Such investments were clearly a critical factor in the success of all
three aspects of the development program. Government support has proven remarkably steady in weathering
political and economic changes.
ANNEX 6: ELECTRICITY AND MULTISECTOR DEVELOPMENT IN RURAL TUNISIA
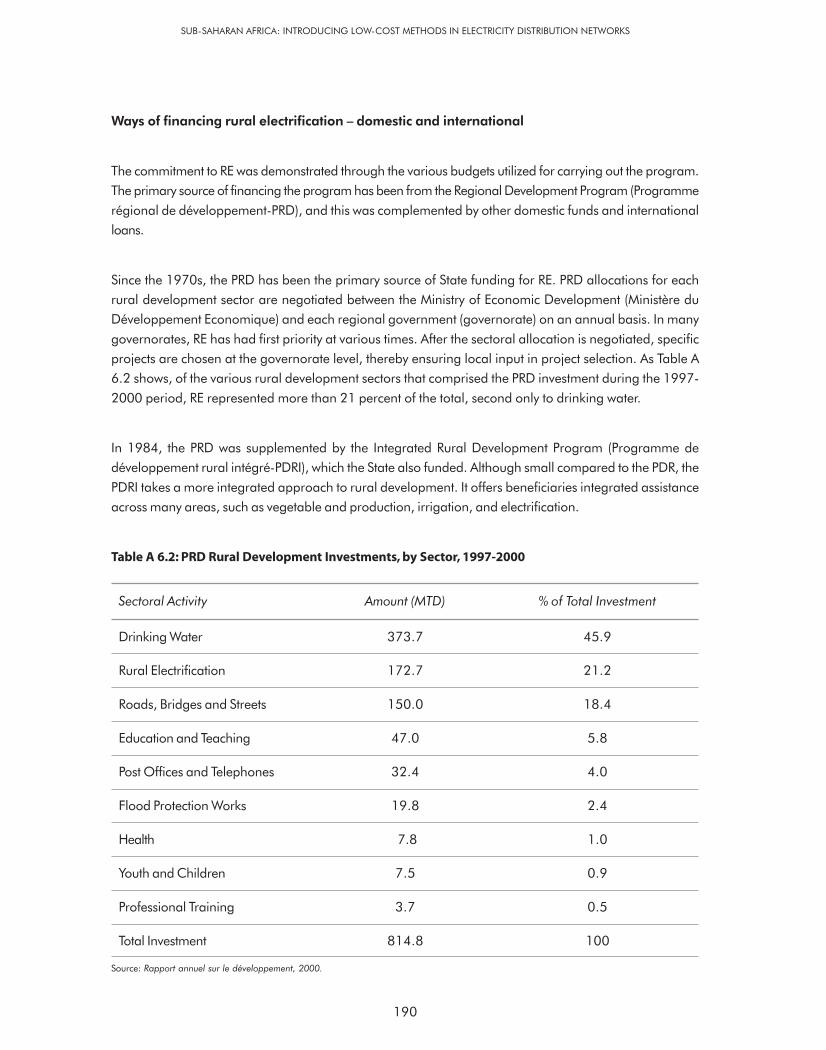
190
SUB-SAHARAN AFRICA: INTRODUCING LOW-COST METHODS IN ELECTRICITY DISTRIBUTION NETWORKS
Ways of financing rural electrification – domestic and international
The commitment to RE was demonstrated through the various budgets utilized for carrying out the program.
The primary source of financing the program has been from the Regional Development Program (Programme
régional de développement-PRD), and this was complemented by other domestic funds and international
loans.
Since the 1970s, the PRD has been the primary source of State funding for RE. PRD allocations for each
rural development sector are negotiated between the Ministry of Economic Development (Ministère du
Développement Economique) and each regional government (governorate) on an annual basis. In many
governorates, RE has had first priority at various times. After the sectoral allocation is negotiated, specific
projects are chosen at the governorate level, thereby ensuring local input in project selection. As Table A
6.2 shows, of the various rural development sectors that comprised the PRD investment during the 1997-
2000 period, RE represented more than 21 percent of the total, second only to drinking water.
In 1984, the PRD was supplemented by the Integrated Rural Development Program (Programme de
développement rural intégré-PDRI), which the State also funded. Although small compared to the PDR, the
PDRI takes a more integrated approach to rural development. It offers beneficiaries integrated assistance
across many areas, such as vegetable and production, irrigation, and electrification.
Table A 6.2: PRD Rural Development Investments, by Sector, 1997-2000
Sectoral Activity Amount (MTD) % of Total Investment
Drinking Water 373.7 45.9
Rural Electrification 172.7 21.2
Roads, Bridges and Streets 150.0 18.4
Education and Teaching 47.0 5.8
Post Offices and Telephones 32.4 4.0
Flood Protection Works 19.8 2.4
Health 7.8 1.0
Youth and Children 7.5 0.9
Professional Training 3.7 0.5
Total Investment 814.8 100
Source: Rapport annuel sur le développement, 2000.

191
In addition to the PRD in which funding was allocated according to a strict planning criteria, a program was
created to assist projects that failed to meet the usual criteria. The President of the Republic created two
extra-budgetary funds. The first was a special Presidential Fund, which finances projects that the President
selects at regional Ministry-level meetings and during visits throughout the country. The second was a
National Solidarity Fund (Fonds de Solidarité Nationale-FSN), which the President created in 1992 to
improve Tunisian living conditions, particularly in underprivileged areas (zones d’ombre). Voluntary
contributions to the FSN are solicited from NGOs, public and private businesses, and Tunisian citizens. As a
result of this financing, the rate of RE has been increased by an estimated 10 percent. These personal
initiatives of the President, supported by contributions from a broad spectrum of society, exemplify the
country’s strong political commitment to rural development, and to RE, in particular.
Later in the program, the Government also borrowed money to finance RE. Since 1977, the State has
incurred more than 200 MTD in external debt – not always at concessional rates – with which to finance RE.
The most significant source has been the ADB, which has provided five lines of credit for RE or about 80
percent of external financing. Other funding sources have included the World Bank (7.8 percent); Agence
Française de Développement (7.5 percent); and the Kuwait Fund (2.6 percent). Together with ADB support,
these loans have helped to finance the connection of 376,000 rural residents, 61.7 percent of the 609,000
rural households connected during the times of these investments.
Finally, national commitment to total RE has been demonstrated by the development and funding of an
ambitious, high-quality PV program, established in the mid-1980s to reach the most isolated households
that otherwise would not meet the selection criteria. This program is financed primarily, not by beneficiary
and regional-government contributions, but through suppliers, World Bank credits and NGOs.
Effective Institutional Structure for Project Planning and Selection
Tunisia’s RE program benefits from an institutional structure that has proven highly effective in achieving a
rapid growth and spread of RE. An iterative five-year planning and implementation process balances economic
and social criteria and imposes financial discipline on rural development projects, including RE. The system
is characterized by centralized planning, with major regional and subregional inputs and initiatives. This is
done within the framework of a comprehensive rural development program.
Tunisia’s RE program is influenced by various social, economic and technical factors. Multiple institutions
are involved in developing and implementing RE programs. At the national policy and planning level, these
primarily include the MDE and the MI, with input from STEG and the ANER. At the regional and local levels,
regional governorates and their subdivisions, called delegations, provide input into rural deve lopment
planning, while the STEG and ANER are responsible for implementation.
At first glance, having so many agencies involved in RE appears unwieldy. However, these disparate entities
are unified through well-defined roles, an official coordinating body, and a planning and implementation
process that guarantees continuous interaction between agencies. Clear criteria govern the selection of RE
ANNEX 6: ELECTRICITY AND MULTISECTOR DEVELOPMENT IN RURAL TUNISIA

192
SUB-SAHARAN AFRICA: INTRODUCING LOW-COST METHODS IN ELECTRICITY DISTRIBUTION NETWORKS
projects. All cooperating agencies are aware of the criteria governing the process and can concentrate on
efficient implementation. Such close cooperation continues throughout implementation
Well-defined roles and mandates for agencies
Each agency has a clearly defined role and mandate in RE. The MDE, in collaboration with its specialized
agencies, including the General Regional Development Commissariat (Commissariat Général de
Développement Régional-CGDR), defines the overall rural development policy and this provides the
framework for RE. The MDE is charged with disbursing a share of national revenue to subsidize RE projects
in a cost-effective and equitable way. It mobilizes finances, and divides the national budget for rural
development between the regional governments and implementing agencies. Both the PDR and the PDRI
are housed within the MDE.
The MI develops Tunisia’s energy policy. It is responsible for supervising the various branches of the energy
sector: hydrocarbon exploration and production; refining and distribution of petroleum products; and
production, transport and distribution of gas and electricity. As part of its mandate, the MI houses the
National Rural Electrification Commission (Commission Nationale d’Electrification Rurale-CNER) and has
supervisory authority over STEG. It also provides input into the five-year planning process.
The governorates, in their role as regional executive agencies of the Ministry of the Interior, are charged,
together with their delegations, with selecting RE projects, including RE projects, and allocating funds disbursed
from the national budget, in addition to their own resources. The governorates are also responsible for
overseeing the timely and efficient completion of projects. Thus, the governorates and their delegations
provide, at an official level, primary regional and local input into project selection and design. In identifying
RE projects in their jurisdictions, the delegations also consult with oumdas (leading citizens who act as
spokespersons for local interests).
The two implementing agencies – STEG and ANER – also have clearly defined roles. As the national electric
utility, STEG is responsible for electricity generation, transmission, and distribution, as well as transport and
distribution of natural gas. Although STEG falls within the MI’s jurisdiction, it enjoys considerable autonomy
in practice, especially in technical matters. However, decisions of a broader social nature, such as changes
in tariffs, are made in consultation with the MI.
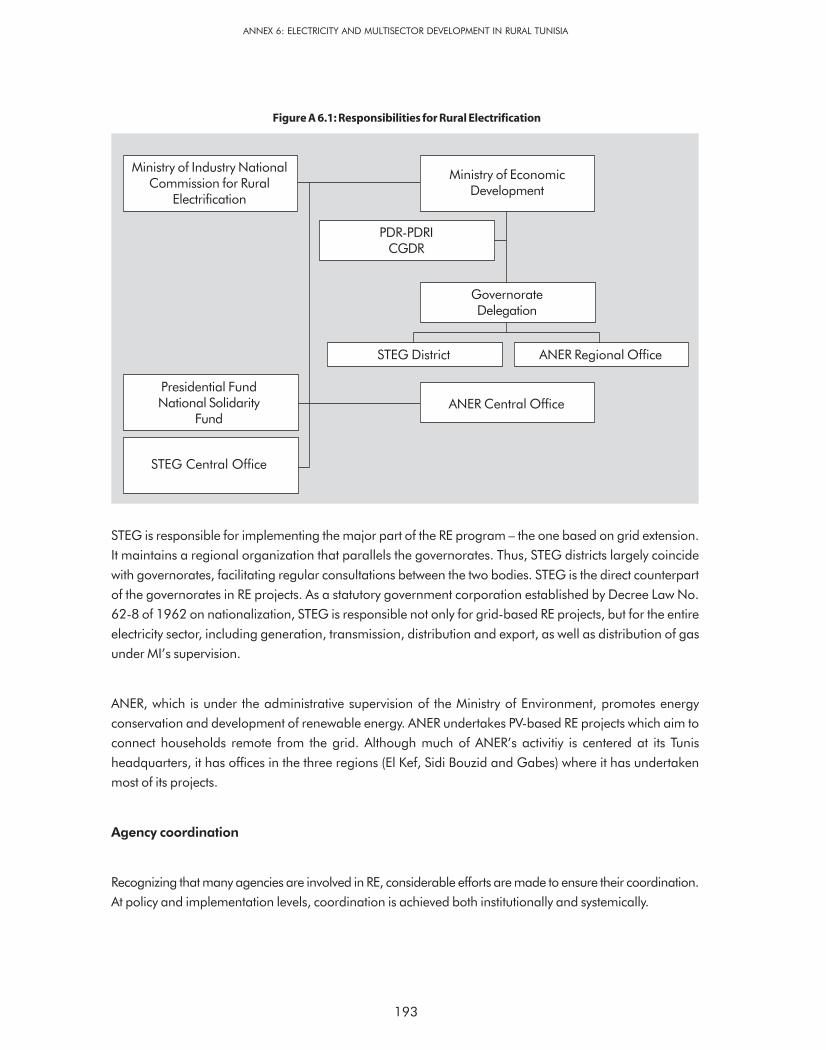
193
STEG is responsible for implementing the major part of the RE program – the one based on grid extension.
It maintains a regional organization that parallels the governorates. Thus, STEG districts largely coincide
with governorates, facilitating regular consultations between the two bodies. STEG is the direct counterpart
of the governorates in RE projects. As a statutory government corporation established by Decree Law No.
62-8 of 1962 on nationalization, STEG is responsible not only for grid-based RE projects, but for the entire
electricity sector, including generation, transmission, distribution and export, as well as distribution of gas
under MI’s supervision.
ANER, which is under the administrative supervision of the Ministry of Environment, promotes energy
conservation and development of renewable energy. ANER undertakes PV-based RE projects which aim to
connect households remote from the grid. Although much of ANER’s activitiy is centered at its Tunis
headquarters, it has offices in the three regions (El Kef, Sidi Bouzid and Gabes) where it has undertaken
most of its projects.
Agency coordination
Recognizing that many agencies are involved in RE, considerable efforts are made to ensure their coordination.
At policy and implementation levels, coordination is achieved both institutionally and systemically.
Figure A 6.1: Responsibilities for Rural Electrification
PDR-PDRICGDR
ANER Regional Office
Presidential FundNational Solidarity
Fund
STEG Central Office
STEG District
Ministry of Industry NationalCommission for Rural
Electrification
Ministry of EconomicDevelopment
ANER Central Office
GovernorateDelegation
ANNEX 6: ELECTRICITY AND MULTISECTOR DEVELOPMENT IN RURAL TUNISIA

194
SUB-SAHARAN AFRICA: INTRODUCING LOW-COST METHODS IN ELECTRICITY DISTRIBUTION NETWORKS
The CNER, a coordinating body chaired by the MI’s Director of Electricity and Gas, includes representatives
of STEG, ANER, MDE, Ministry of Environment, Ministry of the Interior and FSN. Through regular meetings,
CNER keeps members informed of RE activities that are carried out throughout the country. It provides a
forum in which policymaking, planning and implementing agencies can exchange views and identify problems.
Such a coordinating body, though useful, is rarely adequate to cope with the entire range of issues that arise
during the planning and implementation of a major program. Therefore, in Tunisia, CNER’s work is
supplemented by continuous interaction – both horizontal and vertical – between agencies. For example,
two-way communication between the MDE, MI, STEG, ANER and CNER is continuous when the five-year
plans are being drawn up to arrive at RE targets consistent with available financial and technical resources.
Similarly, at the regional level, the governorates interact continuously with STEG districts and ANER offices
during program execution.
The contents of the five-year plans’ RE programs are also developed iteratively through two-way
communication between central and regional authorities. In fact, the first estimate of RE projects within the
overall rural development budget, established by the MDE, originates at the subregional (delegation) level.
Far from being entirely top-down, the process incorporates a substantial amount of bottom-up content, at
least at the official level.
Planning and implementation
The dynamics of this coordination are further illustrated in the planning process, from initial design of the
national rural development budget in the five-year plan to the selection of specific RE projects.
The criteria governing these choices are an important aspect of a successful RE program. During most
program years, more villages or households wish to receive new electricity service than there are funds
available to do so. It is, therefore important to ensure that RE planning is open and objective and uses clearly
defined criteria to rank villages and households for connection. Clear criteria respond to concerns about
social justice or fairness, reduce local political pressure to “jump the queue”, and allow for a more rational
and economic, long-term electrification program. They also greatly facilitate the planning and implementation
of RE projects, as they eliminate potential contention between cooperating agencies.
Tunisia has established a project selection method which is orderly, transparent and meticulous. RE plans
and targets are made publicly available so that progress can be monitored and assessed. In the STEG
program, which accounts for more than 90 percent of connections, selecting sites for electrification is a
two-step process. For the first step, within the framework of the current five-year plan, the MDE identifies
the delegations or zones to include in the rural development program. Selection is based on such criteria as
income level, unemployment, environmental quality, gender status, expected rate of return from projects
and the costs involved in job creation and improved living conditions.

195
In the second step, potential RE projects are identified within the delegations and zones selected in the first
step. The governorate asks the delegations to list all non-electrified agglomerations, defined as a minimum
of 10 households or adjacent households no further than 200 m apart, built with walls and roofs of permanent
materials. Potential sites for electrifying agricultural pumping and water drilling in the delegations are also
identified. This list is drawn up in collaboration with the local oumdas.
Next, STEG district offices in each governorate review this list in detail. They make site visits to verify the
information provided by the governorates and collect additional data, including lengths of needed MV and
LV lines which are available, number of transformers, and number of housing units suitable for electrification.
This information is then mapped onto the existing grid.
In this way, a database of economic and technical information is constructed for each STEG district. This
information is processed in STEG’s computer-driven economic feasibility model in order to evaluate the
investments per project or grappe (several projects served by the same medium tension [MT] line). STEG
headquarters then estimates costs, based on STEG unit costs, of electrifying the various households,
agglomerations and pumping and drilling sites. On the basis of this estimate, a table is prepared showing
the number of households that can be electrified at various cost levels, and estimating the total costs of
providing electricity to the number of households at each cost level.
This process permits STEG to provide the MDE scenarios for electrification. Each scenario gives, for
each governorate, the number of beneficiaries, cost of projects and rates of electrification. Once the
rural development objectives of the five-year plan are fixed, these scenarios are used to establish
project costs. For example, in the IXth Plan (1997-2001), the MDE fixed the ceiling at 2,200 TD (of
which beneficiaries pay 200, STEG pays 200 and the State pays 1,800). Thus, all projects that cost
less than this ceiling are selected for inclusion in the provisional five-year plan for RE, based on grid
extension; however, projects that cost more than 2,200 TD may possibly be included in supplementary
programs, such as the PP or FSN.
At the regional level, the governorate, in collaboration with the STEG district office, adopts these projects
and the funds allocated by the MDE for RE. The CNER then checks for inconsistencies between the adopted
governorate rural-electrification projects and those in other programs, such as the PRD, PRDI, PP and FSN.
The governorate program is finally confirmed at the national level in meetings between the MDE, governorate,
STEG, and ANER. The five-year plan is the consolidation of the various regional plans.
Regarding the much smaller ANER program, the number of households that could benefit from PV systems
is based on Census data, results of STEG inquires and a 1995 study estimating the role of renewable
energy that concluded 70,000 households would not be served by the grid. On this basis, ANER planned in
the VIIIth and IXth Five-Year Plans to install 10,000 systems (of which 7,700 have been installed).
ANER’s selection process is largely determined by the advance of the grid-connected system. In the past,
because of the time lag between ANER project definition and installation (as long as two-to-three years), PV
ANNEX 6: ELECTRICITY AND MULTISECTOR DEVELOPMENT IN RURAL TUNISIA
196
SUB-SAHARAN AFRICA: INTRODUCING LOW-COST METHODS IN ELECTRICITY DISTRIBUTION NETWORKS
projects were sometimes overtaken by arrival of the grid. In other cases, the grid arrived shortly after the PV
project had been implemented, thereby duplicating efforts and wasting resources. For example, in
20 percent of cases, the grid arrived to connect households within three months to a year after they had
installed PV equipment.
To avoid such duplication, coordination between ANER, STEG and the governorates is being tightened.
ANER now asks each governorate to provide a list of potential beneficiaries of PV systems. The list is based
on rural development needs, present and projected distance from the grid and householder interest.
Increasingly, efforts are being made to ensure that projects are situated well beyond the anticipated extension
of the grid. The list is, therefore, checked with STEG before program implementation.
Achievements and challenges
The RE experience throughout the world suggests that there is no single institutional structure or process for
success. Regardless of the structure adopted, however, certain characteristics are essential. These include
clarity of purpose, well-defined roles for all agencies involved and established procedures that ensure
equitable agency coordination. As noted above, the Tunisian system scores well on all counts.
Nonetheless, Tunisia’s RE program has its shortcomings. Coordination has sometimes broken down, as the
above example of duplicating PV systems and grid extension projects illustrates, resulting in wasted resources.
Moreover, while the project selection process appears admirably clear and transparent, it may be criticized,
in practice, for verging on the mechanical, especially in cases where local costs diverge from the national
averages used to estimate total costs of RE. Finally, although the selection process is initiated at the community
level, in consultation with the local oumda, this input is considered official rather than at the citizenry level,
and could, therefore, be incomplete.
On balance, however, the successful record of Tunisia’s RE program reflects its efficient, well-coordinated
processes, as well as its perceived fairness. These factors, in turn, have reinforced a national commitment
to improving living conditions for rural residents by making RE an integral part of the country’s broader
rural development program.
Implementation through STEG – An Effective Utility
The STEG’s long record as an effective, efficient utility has earned it an international reputation as one of
the best developing country power utilities in the world (Hicks, et al, 1993; ESMAP 1991). Insulated from
unwarranted political influences through its mandate, STEG has been a key partner in Tunisia’s rural
development. It is viewed as a model enterprise in the Tunisian Government and economy, having attracted
the best and brightest Tunisian engineers and economists to implement the nation’s rural development
mission during the 1970s. Two decades later, the high level of confidence vested in STEG’s technical
assessments still plays an important role in the successful adoption of cutting-edge technology.

197
Several operational factors have contributed to STEG’s success. They include the encouragement of private
sector participation in the construction phase of RE projects and the promotion of a local supply industry for
equipment and material. STEG also developed a sophisticated computerized inventory management system
and rigorous commercial practices, including control of non-technical losses and effective billing and
connection payment practices. Finally, findings on consumer satisfaction and quality of service are analyzed.
Mandate and management structure
STEG is a statutory Government corporation, of a commercial and industrial nature. Established by Decree
Law No. 62-8 of April 3, 1962, STEG, under the MI’s supervision, is responsible for the generation,
transmission, distribution, import and export of electricity and natural gas. The utility’s three departments
and 15 directorates report to the Chairman and Managing Director and are responsible for operating the
electricity and gas systems and managing the utility.
The Directorate for Electricity and Gas Distribution has primary responsibility for RE, through its Department
of Program and Budget, Logistical Directorate, five Regional Directorates, and 34 district branch offices.
This Directorate is supported directly, however, by the general management, which approves plans and
budgets, and by central administrative STEG units, including the Directorate for Finance and Accounts,
Directorate for Studies and Planning (which sets tariffs) and the Directorate for Human Resources and Legal
Affairs (which trains external contractors).
STEG’s 14-member Board of Directors includes a Chairman and Managing Director, Assistant Managing
Director, nine members representing the State (including a representative of the Ministry of Environment),
two members representing employers and one financial controller. STEG also has a cooperative agreement
with the Association of Consumer Protection to provide consumer input through regular meetings with STEG
headquarters, as well as with field offices and the newly implemented call centers.
STEG’s organizational structure reveals two key reasons for its success in RE. First, the utility has enjoyed the
backing of highly professional, experienced administrative units within a large corporation with well-established
operating and consumer management procedures. Second, it has benefited from a highly decentralized
implementation structure since 1977, when the decision was made to establish district offices in each
Governorate. Today, in fact, many governorates have more than one STEG district office, which facilitates
coordination with rural development planning through the local selection of STEG projects in close cooperation
with the regional administration.
Early computerization and development of software applications
STEG was the first major Tunisian corporation to computerize operations. This occurred in the early 1970s,
the same time that the country’s RE drive was launched. By the late 1970s, nearly all departments had been
computerized, which allowed a sophisticated level of data collection, analysis and management that contributed
greatly to STEG’s ability to monitor and improve its performance in all areas, including RE.
ANNEX 6: ELECTRICITY AND MULTISECTOR DEVELOPMENT IN RURAL TUNISIA

198
SUB-SAHARAN AFRICA: INTRODUCING LOW-COST METHODS IN ELECTRICITY DISTRIBUTION NETWORKS
During the mid-1970s, various software applications fundamental to the everyday operations of STEG
were designed and adopted. These included activities such as personnel and salary management, billing
and collection and inventory management. During this initial period, STEG emphasized software development
as an operational and business management tool. Engineers and software technicians were recruited to
design and put in place these software applications. Software applications were also developed to facilitate
the design of RE systems. These included the “Tanouir’ software for sizing MV lines and the software for
daily account records of LV consumers.
Transparent norms and guidelines
STEG’s operational norms and guidelines, updated regularly, are used by both STEG technicians and
outside contractors to ensure a standardized approach and adherence to contracts. These guidelines illustrate
the attention to details that is paid by the company.
The Section on Specific Administrative Clauses (Cahier des Clauses Administratives Particulières) covers all
administrative details, such as costs that can be included in bids, those for which STEG is responsible,
escalating factors for unit costs, terms of payment to contractors, general billing conditions, applicable taxes,
penalties, insurance requirements, construction supervision and project acceptance by STEG.
The Section on Specific Technical Clauses includes all general specifications for project construction, such as
the tolerance level when laying out lines, transport and handling procedures for various components,
specifications for preparing concrete, installation of line hardware and proper stringing of conductors and
preparation of grounds.
The Technical Guide to STEG Electricity Distribution includes all specifications for the design and construction
of RE projects and is supplemented by a series of documents detailing Tunisian standards.
The Global State (Mercuriale) is prepared by STEG every 12-18 months on the basis of the historical RE
costs. These costs are prepared for each assembly that is used in a RE project and include supply costs plus
storage fees, overhead, in-country transport from central storage to job site and installation costs. The
Mercuriale facilitates the preparation of invoices for construction, equipment and services rendered by
STEG to its consumers, as well as the calculation of project costs, regardless of source of project financing.
The Tariff Contract contains unit costs for each task undertaken during project construction as a basis for
payment to small enterprises. This document is revised every three years for each zone on the basis of unit
costs bid by the large enterprise which is the lowest bidder for large projects in that specific zone (minus the
transport costs from central storage to the district, which is STEG’s responsibility for small jobs). Taken
together, these guidelines have provided an implementation framework for RE which has reduced costs and
raised efficiency considerably through standardization.

199
Successful Project Implementation and Construction
STEG’s successful implementation and construction of RE projects are based on four major factors. The first
is the encouragement of private sector participation during the construction phase. Secondly, local industry
is developed to supply equipment and material. Also, a sophisticated, computerized inventory management
system is used. Finally, rigorous commercial practices are in place, including control of non-technical losses
and effective billing and connection payment procedures.
Private sector participation in construction
Most RE projects are constructed by outside contractors, not STEG. More often, STEG’s role involves project
planning and design, selecting and training contractors, procuring and managing grid supplies, developing
detailed standards and guidelines for construction and monitoring and evaluating completed projects. This
approach has succeeded in maintaining low costs and ensuring quality construction, as well as supporting
the development of local expertise and enterprises.
Both large national enterprises and small local firms participate in the construction of RE projects. Those
projects whose labor costs exceed 30,000 TD are bid upon. A verification committee, composed of
independent evaluators, uses a technically and financially rigorous process through which to evaluate the
bids. For projects whose labor costs are less than 30,000 TD, STEG’s district office selects small local firms,
based on their availability and technical capacity. In 1992, 36 percent of Tunisia’s RE construction was
undertaken by large enterprises, 56 percent by small firms and the remaining 8 percent by STEG itself.
When the drive towards RE first began, the country’s few local enterprises lacked the skills needed to
construct MV/LV substations and lines. STEG encouraged these firms to increase their competence by
providing trainers from the Sectoral Center for Professional Training (part of the Tunisian Agency for
Professional Training). In 1999-2000, for example, this Center trained 30 foremen and 63 linemen, who
represented firms from throughout Tunisia. This training program has helped to establish a qualified cadre
of RE contractors in all regions.
As projects progress, STEG technicians regularly check their adherence to the utility’s technical distribution
guidelines. STEG prepares regular project status reports, which are submitted to the regional governments,
the MI (which supervises STEG) and financing organizations. Once projects are completed, a STEG team
carries out an inspection to ensure that they conform to the terms of the contract and relevant construction
norms. Since STEG assumes all financial responsibility for subsequent use of the system, these inspections
are quite rigorous. The contractor must remedy any inadequacies before payment is made.
ANNEX 6: ELECTRICITY AND MULTISECTOR DEVELOPMENT IN RURAL TUNISIA

200
SUB-SAHARAN AFRICA: INTRODUCING LOW-COST METHODS IN ELECTRICITY DISTRIBUTION NETWORKS
Participation of local supply industry
Tunisia’s RE program has encouraged the development of national industries to supply its needs. In externally
funded projects, local suppliers compete directly with international firms (with a 15 percent preference
given over the lowest international bid), which has pushed local suppliers to improve their product quality
and adjust prices to the international market. The bidding process for electricity grid supplies is meticulous.
Pre-defined rules are followed for deadlines, method of evaluating technical bids independent of price bids
and method of submitting bids for specialized commissions’ approval. These rules guarantee maximum
transparency and give suppliers the confidence to make their best offers. Currently, the average share of
Tunisian suppliers for grid materials is about 64 percent.
Now that Tunisia’s electrification market is nearly saturated, suppliers are turning towards export markets.
According to the World Bank (2000a), exports of electrical machinery are booming, having grown from
1.2 percent in 1980 to 7.5 percent in 1997, and now poised to grow even more. Thus, STEG’s strategy of
using local suppliers appears to have not only reduced its own costs, but have also encouraged growth of a
national export industry.
Rigorous commercial practices
The electricity company also follows rigorous commercial practices in its minimizing of non-technical losses,
billing practices, payment collection and debt reduction. In Tunisia, non-technical losses – the financial
losses a utility incurs when the power it supplies is consumed but not paid for – are comparable to those of
developed country utilities. In the STEG distribution system, non-technical losses have been minimized,
largely as a result of a consumer management improvement program introduced in the 1980s, which
reduced losses significantly. For the entire distribution network, in the early 1990s it was estimated that
there are only 10.3 percent technical losses and only 3.1 percent non-technical losses for a total of 13.4
percent system-wide losses (ESMAP 1991).
In rural areas, fraud and meter tampering are minimal. One major reason is that rural consumers have
more respect for the electricity utility than urban consumers. Also, meters in rural areas have been installed
more recently than those in urban areas. Therefore, they are less often damaged and billing problems
caused by damaged meters are rare.
STEG’s policy on illegal connections may also be a deterrent. This policy includes frequent, regular monitoring
and meter inspection campaigns. Meter readers are rotated regularly among districts. Abnormally low
consumption is investigated after generating computerized lists. In addition, bonuses are given for identifying
cases of fraud and strict legal action is taken in such cases. On the technical side, insulated cables are used
for networks and supply lines to prevent illegal tapping of power lines by consumers.
Consumers are automatically billed from two computer centers: one in Tunis and another in Sfax. In the
early 1970s, STEG set up an integrated billing software program, whose effectiveness has been proven

201
through thorough testing. The first consumer who requests a connection activates the system. Each consumer
file is followed closely through connection, cash payment, hook-up and finally metering and billing of
consumption. This system allows for daily monitoring of consumption and regular monitoring of installed
meters to avoid unaccounted for consumption.
The software used can monitor meter readings and signal any deviation in the bimonthly reading regarding
a consumer’s historic consumption pattern. This allows the detection of index errors and signals any potential
cases of fraud as soon as any unexplained changes in consumption levels occur.
Although LV consumer’s are billed bimonthly, meters are read only every six months in rural areas (compared
to every four months in urban areas, and every other month for Government offices and water pump
plants). Thus, for rural consumers, between each meter reading, two bills are estimated on the basis of the
average bi-monthly consumption over the last three rolling years. When the meter is read, the actual
consumption is calculated, and the amount paid in intermediate bills is deducted. Large consumers are
metered and billed on a monthly basis. Billing is spread out over time in order to better divide the handling
of consumer files and cash flow during the month.
STEG agents deliver statements to consumers’ business addresses or residences within three-to-five days;
however, this method is expensive. Postal service is also considered unreliable, expensive and faces delivery
problems similar to those of STEG. Both the postal service and STEG leave bills for more isolated rural
consumers at the local general store, which serves as an informal post office. This can result in payment
delays and cutting off of service for rural consumers.
In most rural areas, consumers give top priority to paying their electricity bills. Most unpaid bills originate in
the public sector, but, as Table A 6.3 shows, payment has improved in recent years. Unpaid bills for LV
consumers (both rural and urban) represented less than 5 percent of STEG’s total unpaid bills in
1997-1998.
Table A 6.3: Comparison of STEG’s Unpaid Bills, 1990 and 1997-1998
1990 1998
Unpaid Bills MTD % MTD %
Total Public Sector 21.3 81 48.1 79.6
Total Private Sector 5.0 19 12.3 20.4
LV Consumers (Rural and Urban) 3.2 12 2.9 4.8
Total 26.3 100 60.4 100
ANNEX 6: ELECTRICITY AND MULTISECTOR DEVELOPMENT IN RURAL TUNISIA

202
SUB-SAHARAN AFRICA: INTRODUCING LOW-COST METHODS IN ELECTRICITY DISTRIBUTION NETWORKS
Payment facilities for connection costs are extremely generous, as STEG has learned from experience that
rural households can maintain only low monthly payments. When the RE program was first launched,
consumers had to pay their connection fees over a 10-month period. When even this proved unaffordable
for many rural consumers, the amount was progressively spread out over 40 months in 20 bimonthly
payments, and later extended to 72 months in 36 bimonthly payments, where it remains today. This policy
of spreading out payments has greatly reduced the monthly bills of connecting households; as a result, there
are few non-payments.
Analysis of Consumer Service: Problems and Solutions
STEG has sought technical answers, such as innovative billing practices and the MALT system, to resolve
consumer service problems. However, little monitoring of consumer satisfaction with quality of service has
occurred. It is assumed that the economic cost of an undistributed kWh in a rural area – characterized by
low electricity demand – is much less than one in an urban area, that daytime power outages will often go
unnoticed by consumers, and economic losses are insignificant.
According to the informal field work carried out for this chapter, power outages, though infrequent, did
occur in the villages studied. Some were programed (as part of works in progress), while others were
unanticipated (due to natural causes, such as violent weather). Health clinics have complained of not having
been informed of prolonged outages, which have resulted in spoiled refrigerated vaccines. To protect
against such damages, some clinics have had to reduce vaccine inventories or have had to maintain emergency
coolers. Communications problems between STEG and its consumers were also discovered. For example,
rural consumers have had difficulty in contacting STEG because of out-of-order or inaccessible telephone
booths or because they believed the utility would be automatically informed about the problem.
Voltage fluctuations have damaged domestic appliances and television sets. When regional development
authorities and agricultural and agro-processing consumers were interviewed for this study, it was found
that voltage fluctuations had damaged electric motors used for water pumping.3, 4 In the future, such fluctuations
could increase as the network expands to include houses located remotely from MT/LT substations.
Agro-processing consumers in the areas studied were also concerned about lack of access to three-phase
power (single-phase power prevails in rural areas). Private silos, usually located near grain fields, require
three-phase power because they are fed by electrogenes groups. Refrigerated collection centers require a
power of 15-22 kW and three-phase power. Rural development authorities also mentioned projects that
companies are prepared to invest in and which are located in areas where water is available; however,
power is limited to the single-phase grid.
3 One disadvantage of electric water pumping for agricultural use is that it rapidly exhausts the water table. For this reason, it must be carefullymonitored. The water authority sets maximum outputs, which farmers cannot vary according to their needs; therefore, a reservoir must beconstructed.4 Some farmers and water associations also complained about bimonthly billing (they would prefer monthly bills), inconvenience of peak loadmanagement periods, power factor penalties and taxes on electricity bills.
203
Over the past two years, STEG has launched a high priority effort (ecoute client) to formulate strategies on
resolving consumer problems. Service representatives are employed in branch offices to handle consumer
billing problems and complaints. Moreover, pilot call centers have been set up in certain districts to handle
consumer inquiries. Additional monitoring of consumer needs and service levels is needed in rural areas,
which perhaps could lead to educational campaigns for consumers and alternative approaches by the utility.
Financial Sustainability from Grants, Loans and Revenues
Unlike many developing countries, Tunisia has implemented its RE program without undue stress on
government or implementing agency finances. Four major sources of financing and subsidies have contributed
to this achievement. First, during much of the period of rapid RE, Tunisia’s economy grew at a fast pace
(4-5 percent), thereby generating adequate budgetary support. Second, decline of investment in electricity
generation during the 1980s released funds for RE. Third, rural consumption represented only 4 percent of
total consumption, which minimized the effects of subsidies on operating costs. Fourth, Tunisia had access to
loans and grants from a wide range of international donors and agencies.
RE typically has involved both high capital costs and some type of subsidies. As the grid is extended into new
areas, there typically is some type of capital subsidy for system expansion. Once in place, for the most
remote areas, some type of cross-subsidy is also needed to offset the prohibitive costs of providing electricity
service to remote communities. These aspects of the program are explained in details in this section.
Financing grid expansion
Grid expansion was achieved through effectively mobilizing STEG, beneficiaries and state resources. Although
each contributed, the state bore the largest share, either through domestic budgetary resources or borrowing
from various international organizations. Since 1977, a formula has been used to define the RE contributions
of each of the three funding sources. This type of subsidy is very similar to those being advocated for
privates sector companies involved in rural electriciation, but in this case it is for a public company (Brook
and Smith, 2001). In the case of Tunisia, these incentives have been provided to the public electricity
company, and have worked quite well.
Beneficiaries are also required to participate in the cost of connections. This participation is fixed at a level
of TD200, calculated so that electricity costs less than expenditures on alternative energy sources (candles,
kerosene or batteries). As initial connection charges are often a barrier to low-income rural families, STEG
spreads them out as 36 bimonthly payments. In some regions, beneficiaries have agreed to contribute
more than the required TD200 to expedite household connection (for example, Bizerta’s level is TD273,
Nabeul’s is 400-600 and Sfax’s is 400).
With regard to STEG’s contribution to grid expansion, a cost ceiling per average connection has been
established. This simple, workable formula sets a limit on STEG financial participation and provides incentives
ANNEX 6: ELECTRICITY AND MULTISECTOR DEVELOPMENT IN RURAL TUNISIA

204
SUB-SAHARAN AFRICA: INTRODUCING LOW-COST METHODS IN ELECTRICITY DISTRIBUTION NETWORKS
to undertake economically justified investments. From the Vth Plan (1977-1981) through the VIth (1982-
1986), STEG contributed up to TD100 per household connection and TD250 for agricultural pumping,
thereby providing an additional incentive for the more immediately economically productive activity. However,
since 1989, STEG’s participation in household connections increased to TD200, reflecting higher costs and
a special national effort to improve the quality of rural life.
For each project, an average cost of electrification is calculated in terms of an upper and lower limit. The
lower limit equals the maximum STEG connection contribution and the beneficiary’s contribution (each
gives TD200 per domestic connection). Thus, projects costing less than TD400 are considered feasible, and
are financed by STEG. However, for those projects costing more than TD400, the State provides a subsidy
to the company equal to the additional costs incurred. For such projects costing more than TD400, a
maximum or ceiling is defined every five years in the Economic and Socia l Development Plan. For the IXth
Plan, this ceiling was set at TD2,200. Those projects that lie between the lower (TD400) and upper (TD2,200)
limits are co-financed by the State under such programs as the PRD and the PDRI. Projects costing more
than the maximum (TD2,200) can still draw upon special funds available for this purpose (PP, FSN or
voluntary citizens’ rural development fund).
The State, through its various programs, assumes the balance of investment costs not covered by the STEG
or beneficiaries. The State’s contribution now accounts for up to 85 percent of total project connection costs,
compared to 45 percent in the program’s early years. The practical nature of this subsidy is that by contributing
lower subsidies in earlier years, this public utility was encouraged to build a system that would provide them
with greater revenues in the early years of the program. As the system expanded, this base revenue
resulted in less financial burden on the company.
Sustainable financial and tariff strategies
For long-term sustainability, a RE program must establish a system of tariffs and charges that are self-
financing and do not depend on increasingly larger subsidies from State revenues. In this respect, Tunisia’s
tariff policy has avoided many of the pitfalls encountered in other developing countries. STEG prices power
close to its long-term marginal cost, and makes considerable efforts to keep rates in line with the cost of
providing electricity.
The tariff structure, negotiated between STEG and the MI, reflects the differing costs in providing electricity
supplies to broad consumer groups (Table A 6.4). Thus, tariffs are lower for HV, industrial consumers with
high consumption levels and higher for LV consumers, who typically are households with low levels of
consumption. On the other hand, differences in costs of delivering energy based on location are not reflected
in current tariffs. Thus, tariffs are established on a national basis without taking into account, for example,
the considerable cost differences in supplying rural and urban households. In this regard, rural household
tariffs benefit from a significant cross-subsidy since each new connection costs significantly more than the
STEG bills.

205
According to a STEG-requested tariff study conducted in 1996, high-and medium-voltage tariffs, on an
average, reflect marginal costs of supply. However, LV tariffs were about 10 percent lower than their long-
term marginal costs of supply, despite their being generally higher than high-and MV tariffs.
Table A 6.4: Average Price of Electricity (Excluding Taxes), by Consumer Group,
1994-1999 (millimes* per kWh)
Year
Voltage Group 1994 1995 1996 1997 1998 1999
High 42.3 43.9 43.4 43.7 44.0 44.2
Medium 56.7 58.5 58.7 58.7 58.5 58.6
Average Price 61.1 63.1 63.7 64.0 64.1 64.5
*1,000 millimes = 1 TD.
A second characteristic of the tariff structure is the distinction between peak and off-peak usage in all
electricity markets (Table A 6.5). In many cases, peak hour tariffs are nearly twice as high as off-peak
tariffs.
The low voltage supply, of which rural users account for 11 percent, has various tariffs designed to promote
social equity and rural development. For example, a low “lifeline tariff’ applies to consumers who use less
than 50 kWh per month. These consumers pay 63 millimes per kWh for the first tranche, which rises to 90
millimes per kWh for consumption of more than 50 kWh per month. The progressive nature of these tariffs
encourages consumers to manage their consumption in order to reduce consumption in the next higher
tranche. Public lighting, which ensures greater public security, benefits from a special tariff.
STEG tariffs are also designed to promote rural development, especially agriculture. Thus, irrigation benefits
from the lowest tariffs (Table A 6.5). A low off-peak tariff (35 millimes per kWh compared to 45 millimes
per kWh) encourages farmers to irrigate at night. Since the early days of RE, tariff policies have particularly
encouraged two activities: oil pressing and milling/grinding. Until 1978, each activity benefited from its own
tariff, which was substantially lower than the average low-tension tariff. Between 1979 and 1993, the two
tariffs were combined into one that was still lower than the average. In 1994, however, in an effort to
simplify, this tariff was aligned with the average low-tension tariff. These advantageous agricultural tariffs
are part of a broader program to stimulate rural development, which also includes low-interest loans and
subsidies to such projects as irrigation, storage centers for agricultural products, milk collection centers and
rural industries (including repair shops, bakeries, hairdressers and weaving sheds).
ANNEX 6: ELECTRICITY AND MULTISECTOR DEVELOPMENT IN RURAL TUNISIA

206
SUB-SAHARAN AFRICA: INTRODUCING LOW-COST METHODS IN ELECTRICITY DISTRIBUTION NETWORKS
Table A 6.5: Electricity Tariffs (Excluding Taxes), 2001
Fixed Charges1 Energy Price (Mill/kWh)1,2
Subscription Power
Voltage (Mill/Consumer/ (Mill/kWh/
Level Tariff Month Month Day Peak Evening Night
High 4 times a day - 2,500 42 82 63 29
Tension 3 times a day - 2,500 44 80 NA 30
Back-up - 1,000 53 95 68 31
Medium Uniform - 3003 65
Tension Time of Day - 3,000 50 94
Water Pumping - 3,000 51 93Agricultural Use - - 50 Out
Pumping for Irrigation - - 50 Out
Back-up - 1,500 63 102
Low Economic Tranche4
Tension (1 and 2 kVA) - 1003 63
Normal Tranche (> 2 VA) - 1003 90
Public Lighting - 2003 77
Water Heating 400 - 66 Out 66
Heating and Cooling 300 - 98Irrigation Uniform 300 1003 61
Time of Day 700 - 45 Out NA 35
1 A value-added tax is applied at the following rates: 18 percent on all fixed charges and on the energy price (taxes excluded)for all uses except domestic and irrigation; 10 percent on the energy price (taxes excluded) for domestic and irrigation uses.2 A municipal tax is applied at the rate of 3 millimes per kWh.3 Millimes per kVA per month.4 Below 50 kWh per month; above this, the normal tranche applies.mill. = millimes. NA = Not Applicable.
Unlike tariffs in many developing countries, Tunisia’s tariffs are frequently increased in order to preserve
the utility’s financial balance. Since 1992, five increases have occurred (7 percent in 1992, 3 percent in
1993, 5.9 percent in 1994, 4.6 percent in 2000 and 2.4 percent in 2001), which have yielded an
average tariff increase of more than 2 percent a year. However, this is substantially less than the 4.6
percent cost-of-living increase and, therefore, represents, in real terms, a decline in overall tariff level.
Tariffs for domestic consumers, including rural consumers, have declined more sharply than the average
(by about 16 percent over the past five years). From 1991 to 2001, the price of the ‘lifeline’ segment (less
than 50 kWh) rose only 6 millimes per kWh, while tariffs for consumption above 50 kWh rose 20 millimes
per kWh (Table A 6.6).
Although STEG does not provide sectoral accounts, it is believed that, over the past decade, the gap between
electricity sector costs and prices has been modest. During the mid-1990s, the costs of supplying electricity
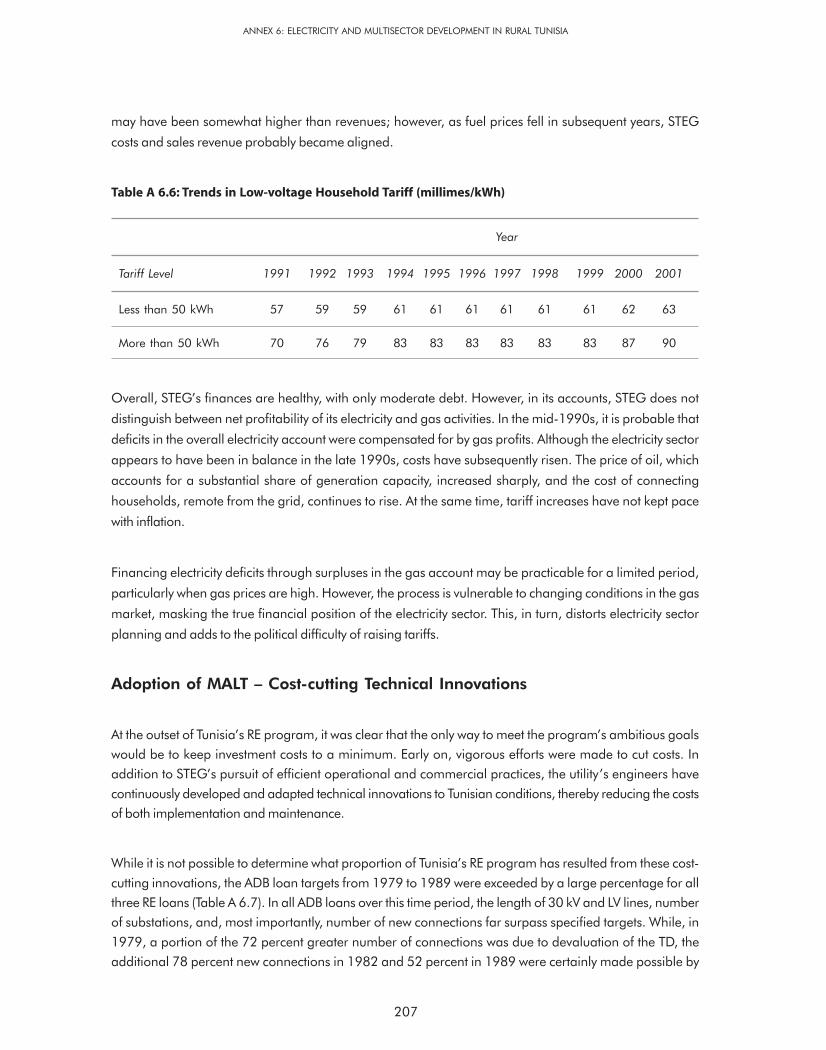
207
may have been somewhat higher than revenues; however, as fuel prices fell in subsequent years, STEG
costs and sales revenue probably became aligned.
Table A 6.6: Trends in Low-voltage Household Tariff (millimes/kWh)
Year
Tariff Level 1991 1992 1993 1994 1995 1996 1997 1998 1999 2000 2001
Less than 50 kWh 57 59 59 61 61 61 61 61 61 62 63
More than 50 kWh 70 76 79 83 83 83 83 83 83 87 90
Overall, STEG’s finances are healthy, with only moderate debt. However, in its accounts, STEG does not
distinguish between net profitability of its electricity and gas activities. In the mid-1990s, it is probable that
deficits in the overall electricity account were compensated for by gas profits. Although the electricity sector
appears to have been in balance in the late 1990s, costs have subsequently risen. The price of oil, which
accounts for a substantial share of generation capacity, increased sharply, and the cost of connecting
households, remote from the grid, continues to rise. At the same time, tariff increases have not kept pace
with inflation.
Financing electricity deficits through surpluses in the gas account may be practicable for a limited period,
particularly when gas prices are high. However, the process is vulnerable to changing conditions in the gas
market, masking the true financial position of the electricity sector. This, in turn, distorts electricity sector
planning and adds to the political difficulty of raising tariffs.
Adoption of MALT – Cost-cutting Technical Innovations
At the outset of Tunisia’s RE program, it was clear that the only way to meet the program’s ambitious goals
would be to keep investment costs to a minimum. Early on, vigorous efforts were made to cut costs. In
addition to STEG’s pursuit of efficient operational and commercial practices, the utility’s engineers have
continuously developed and adapted technical innovations to Tunisian conditions, thereby reducing the costs
of both implementation and maintenance.
While it is not possible to determine what proportion of Tunisia’s RE program has resulted from these cost-
cutting innovations, the ADB loan targets from 1979 to 1989 were exceeded by a large percentage for all
three RE loans (Table A 6.7). In all ADB loans over this time period, the length of 30 kV and LV lines, number
of substations, and, most importantly, number of new connections far surpass specified targets. While, in
1979, a portion of the 72 percent greater number of connections was due to devaluation of the TD, the
additional 78 percent new connections in 1982 and 52 percent in 1989 were certainly made possible by
ANNEX 6: ELECTRICITY AND MULTISECTOR DEVELOPMENT IN RURAL TUNISIA

208
SUB-SAHARAN AFRICA: INTRODUCING LOW-COST METHODS IN ELECTRICITY DISTRIBUTION NETWORKS
ongoing, successful reductions in costs. Thus, the costs reductions enable STEG to provide rural electricity
service to a greater number of consumers.
Table A 6.7: Targets and Achievements of ADB Rural Electrification Loans to Tunisia, 1979-1989
Major ADB 30 kV Lines Substations Low Voltage New
Loans (km) Lines (km) Connections
1979
Target 500 175 280 17,400
Achievement 910 574 1,375 29,900
% Difference 54 330 391 72
1982
Target 860 616 605 16,110
Achievement 1,293 1,114 1,531 28,640
% Difference 50 81 150 78
1989
Target 2,810 2,800 3,900 61,000
Achievement 3,715 3,976 6,590 92,557
% Difference 32 42 69 52
Commitment to customized solutions
One key reason for these cost reductions was Tunisia’s early adoption, in the mid-1970s, of a low-cost,
three-phase/single-phase distribution system, known as MALT. Unlike most African countries and many
other developing countries, Tunisia chose not to adopt the technical standards it had inherited from Europe,
which included a three-phase LV distribution system, suited to densely populated areas and heavy loads.
Many developing countries that did adopt this system, following the advice of European utilities, ended up
with a high-cost-per-km distribution infrastructure which was poorly suited to their scattered settlements and
low demand levels.
Tunisia’s decision to adapt the lower-cost, three-phase/single-phase distribution technology used in North
America and Australia to its unique environment, is arguably the singlemost important reason for the country’s
later success in RE (Box A6.1). Wider use of single-phase distribution not only reduced costs dramatically,
enabling electrification of far more households within the same budget, but it also fostered in STEG a

209
Box A 6.1: Adopting the MALT System: Key Technical Decisions
The three-phase/one-phase MALT distribution system adopted in Tunisia consists of major arteries ofoverhead lines in three-phase, 30 kV, line-to-line voltage, with four conductors (three-phases and oneneutral wire) and secondary, single-phase, 17.32 kV, line-to-neutral voltage rural distribution overheadlines (two wires: one-phase and one neutral).
If heavy loads are to be fed, then three-phase lines with four conductors are used. Fuse cut-outs protect MVlines. Single-phase transformers give a secondary, phase-to-neutral voltage of 230V (single -phase, LVlines), which is used by most rural consumers. The distribution system is composed of robust materials andequipment which are easy to use and maintain.
When Tunisia adopted the MALT system, it made a second key technical decision: opting for a relativelyhigh, single-phase 17.32 kV voltage, rather than the weak 3 or 5 kV of the North American model. Thehigher voltage was selected for the single-phase RE overhead lines because of the long distances betweenvillages and the nearest three-phase artery and to provide for future demand growth over the 30-yearlifetime of the lines.
unique esprit de corps that grew out of this courageous technical decision. Though much criticized at the
outset, it was later proven correct and supported by the political establishment. Moreover, STEG gained
confidence through solving numerous technical and related problems involved in setting up the new system.
As a result, the utility was motivated to continuously develop and implement vigorous cost-cutting efforts and
innovative technical approaches over the following decades.
Steps toward MALT: Technical and economic decision-making
When Tunisia’s need to accelerate RE became evident in the early 1970s, as indicated, STEG undertook a
technical audit of distribution to assess existing distribution methods, of which there were only two: the North
American approach (characterized by widespread use of single-phase lines, combined with a three-phase
backbone) and the European approach (with extended three-phase lines throughout the service zone). This
audit indicated that the predominant European three-phase system was not well adapted to Tunisia’s ambitious
program of low-cost RE. Given the features of Tunisia’s targeted population – low rural incomes, dispersed
households and consumption limited to lighting and basic appliances (mainly refrigerators and television
sets) – it was clear that the cost of RE could not be financed solely through tariffs and that limited resources
should be invested wisely. This led the technical audit to recommend considering a new means of distribution,
using single-phase lines.
The adoption of the new distribution arrangement certainly was not done without controversy. According to
one Tunisian engineer who participated in the program, “never had a technical recommendation raised as
many debates and exchanges of points of view in STEG” (Essebaa 1994). The environment at that time was
hostile to the changeover, according to a later ADB report (ADB 1995a), with opposition from both system
operators and European partners. However, a technical study for the Master Plan for Distribution confirmed
the audit’s recommendations. To avoid pitting the European and North American systems against each
other, the Tunisians called the new three-phase/single-phase distribution system Mise A La Terre, referring
to MALT’s grounding of the fourth neutral wire.
ANNEX 6: ELECTRICITY AND MULTISECTOR DEVELOPMENT IN RURAL TUNISIA
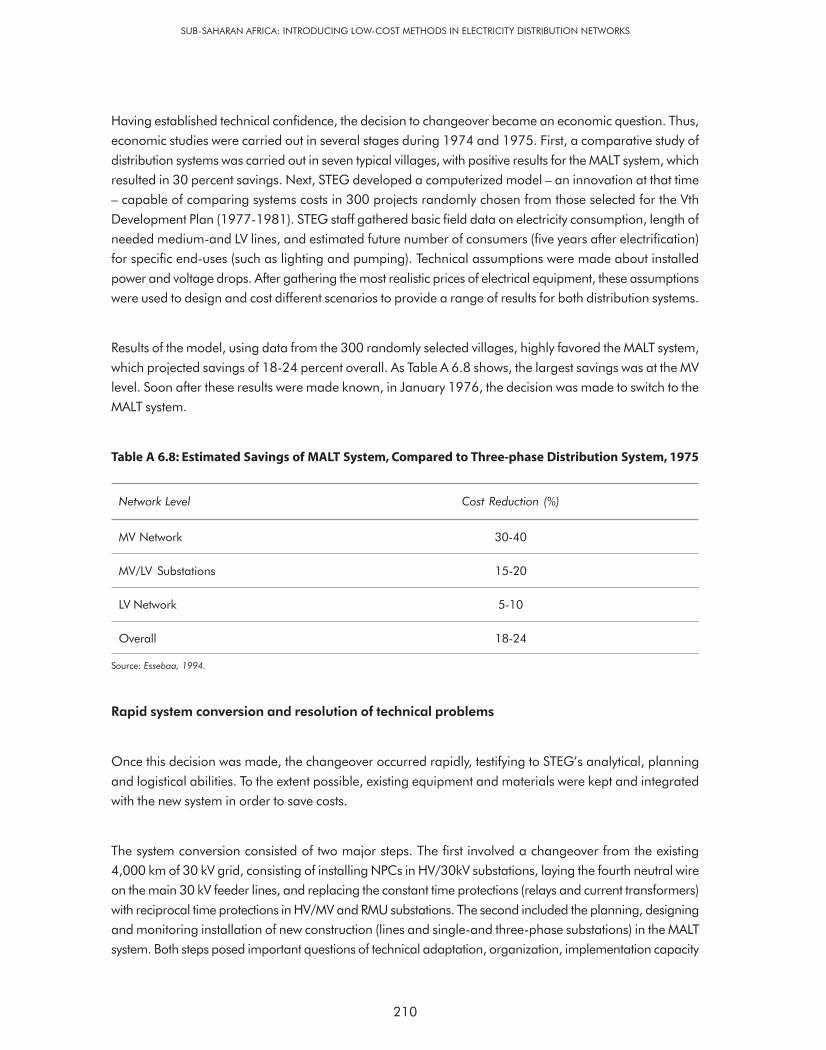
210
SUB-SAHARAN AFRICA: INTRODUCING LOW-COST METHODS IN ELECTRICITY DISTRIBUTION NETWORKS
Having established technical confidence, the decision to changeover became an economic question. Thus,
economic studies were carried out in several stages during 1974 and 1975. First, a comparative study of
distribution systems was carried out in seven typical villages, with positive results for the MALT system, which
resulted in 30 percent savings. Next, STEG developed a computerized model – an innovation at that time
– capable of comparing systems costs in 300 projects randomly chosen from those selected for the Vth
Development Plan (1977-1981). STEG staff gathered basic field data on electricity consumption, length of
needed medium-and LV lines, and estimated future number of consumers (five years after electrification)
for specific end-uses (such as lighting and pumping). Technical assumptions were made about installed
power and voltage drops. After gathering the most realistic prices of electrical equipment, these assumptions
were used to design and cost different scenarios to provide a range of results for both distribution systems.
Results of the model, using data from the 300 randomly selected villages, highly favored the MALT system,
which projected savings of 18-24 percent overall. As Table A 6.8 shows, the largest savings was at the MV
level. Soon after these results were made known, in January 1976, the decision was made to switch to the
MALT system.
Table A 6.8: Estimated Savings of MALT System, Compared to Three-phase Distribution System, 1975
Network Level Cost Reduction (%)
MV Network 30-40
MV/LV Substations 15-20
LV Network 5-10
Overall 18-24
Source: Essebaa, 1994.
Rapid system conversion and resolution of technical problems
Once this decision was made, the changeover occurred rapidly, testifying to STEG’s analytical, planning
and logistical abilities. To the extent possible, existing equipment and materials were kept and integrated
with the new system in order to save costs.
The system conversion consisted of two major steps. The first involved a changeover from the existing
4,000 km of 30 kV grid, consisting of installing NPCs in HV/30kV substations, laying the fourth neutral wire
on the main 30 kV feeder lines, and replacing the constant time protections (relays and current transformers)
with reciprocal time protections in HV/MV and RMU substations. The second included the planning, designing
and monitoring installation of new construction (lines and single-and three-phase substations) in the MALT
system. Both steps posed important questions of technical adaptation, organization, implementation capacity

211
and consumer relations, given the repeated interruptions in supply which inevitably occurred during the
changeover.
Hydro-Quebec engineers provided technical advice on the three-phase/single-phase system, and short-
term technical visits to Canada were organized for district chiefs and system operators and engineers
beginning in 1976. However, planning of the new system and resolution of the problems encountered
throughout the course of switching to the new system were entirely the work of STEG staff.
The changeover, which was completed in 1980, laid the foundation for launching a vast program of RE in
single-phase overhead branch lines. The length of single-phase lines rose from 0 km in 1976 to nearly
19,000 km in 2000. As the five-year plans were implemented, the number of kms of single-phase lines
increased more rapidly than the number of kms of three-phase lines, and the single-phase investment grew
increasingly dominant. Today, single-phase lines account for 51 percent of the total network, compared to
only 16 percent in 1981. Similarly, the number of single-phase substations has risen from none in 1976 to
more than 22,000 in 2000. Single-phase substations dedicated to RE now account for 70 percent of all
STEG substations.
Technical Solutions for Large-motor Productive Uses
As the MALT system has advanced and proven its reliability and safety, criticism has diminished, but some
negative points are still raised. Single-phase lines present no difficulties for household uses such as refrigerators
or color televisions or small motors such as electric pumps or manual tools. However, adaptations and
conversions must be made in order to serve large motors above 7.5 hp, agro-industrial and deep-borehole
irrigation loads. This is a potential problem for large-scale industrial development in more remote areas,
where rural consumers must bear the additional costs.
Most industrial development occurs in industrial zones and incorporated villages, which are supplied with
three-phase, 30 kV lines. Outside these areas, conversion from single-phase to three-phase lines can be
made later, if justified by the load. However, in practice, this has seldom happened in Tunisia.
Technical solutions – widely marketed and practiced in North America – consist of special, more expensive
motors, which, for 100 hp loads, can cost an additional US$2,000-15,000. These costs are minor compared
to the cost of installing three-phase lines, and it has been recommended to use single-phase lines even in
areas with high loads from agro-industry and pumping (Hicks, 1993). In Tunisia, however, early experience
with single-phase, 7.5 hp electric pumps was unsatisfactory, which created suspicion among consumers that
single-phase lines were somehow inferior. STEG has developed several solutions for rural consumers who
own large motors. Still, these solutions are not widely practiced mainly because there are not many cases of
large loads. In all cases, however, the consumer must bear the extra costs.
ANNEX 6: ELECTRICITY AND MULTISECTOR DEVELOPMENT IN RURAL TUNISIA
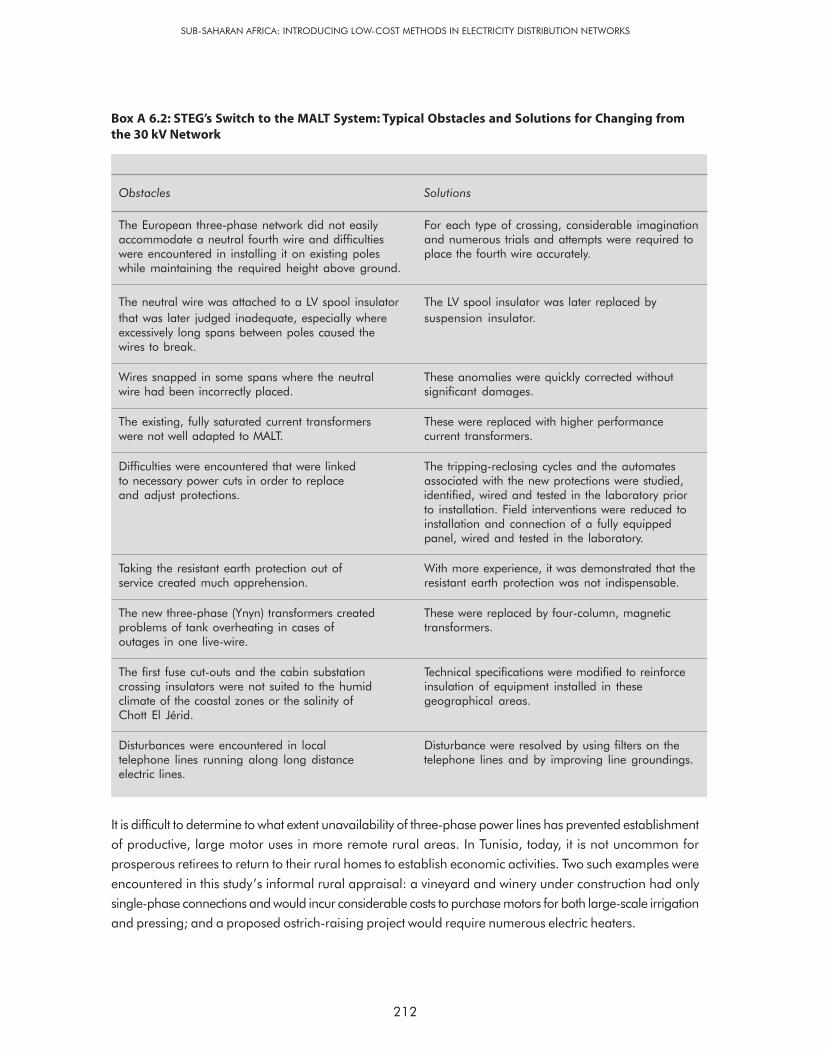
212
SUB-SAHARAN AFRICA: INTRODUCING LOW-COST METHODS IN ELECTRICITY DISTRIBUTION NETWORKS
Box A 6.2: STEG’s Switch to the MALT System: Typical Obstacles and Solutions for Changing fromthe 30 kV Network
Obstacles Solutions
The European three-phase network did not easily For each type of crossing, considerable imaginationaccommodate a neutral fourth wire and difficulties and numerous trials and attempts were required towere encountered in installing it on existing poles place the fourth wire accurately.while maintaining the required height above ground.
The neutral wire was attached to a LV spool insulator The LV spool insulator was later replaced by
that was later judged inadequate, especially where suspension insulator.excessively long spans between poles caused thewires to break.
Wires snapped in some spans where the neutral These anomalies were quickly corrected withoutwire had been incorrectly placed. significant damages.
The existing, fully saturated current transformers These were replaced with higher performancewere not well adapted to MALT. current transformers.
Difficulties were encountered that were linked The tripping-reclosing cycles and the automatesto necessary power cuts in order to replace associated with the new protections were studied,and adjust protections. identified, wired and tested in the laboratory prior
to installation. Field interventions were reduced toinstallation and connection of a fully equippedpanel, wired and tested in the laboratory.
Taking the resistant earth protection out of With more experience, it was demonstrated that theservice created much apprehension. resistant earth protection was not indispensable.
The new three-phase (Ynyn) transformers created These were replaced by four-column, magneticproblems of tank overheating in cases of transformers.outages in one live-wire.
The first fuse cut-outs and the cabin substation Technical specifications were modified to reinforcecrossing insulators were not suited to the humid insulation of equipment installed in theseclimate of the coastal zones or the salinity of geographical areas.Chott El Jérid.
Disturbances were encountered in local Disturbance were resolved by using filters on thetelephone lines running along long distance telephone lines and by improving line groundings.electric lines.
It is difficult to determine to what extent unavailability of three-phase power lines has prevented establishment
of productive, large motor uses in more remote rural areas. In Tunisia, today, it is not uncommon for
prosperous retirees to return to their rural homes to establish economic activities. Two such examples were
encountered in this study’s informal rural appraisal: a vineyard and winery under construction had only
single-phase connections and would incur considerable costs to purchase motors for both large-scale irrigation
and pressing; and a proposed ostrich-raising project would require numerous electric heaters.

213
Continuing tradition of cost-reducing technical innovation
The successful adoption of the MALT system fostered STEG’s aggressive approach to cost-cutting, technical
innovation. Throughout the 1980s and 1990s, technical and economic studies and pilot projects were
undertaken to further reduce distribution system costs. These resulted in a number of changes and cost
savings, of which examples are given below (roughly in order of importance of cost savings): replacement
of copper wiring with aluminum alloy; pin insulators replacing suspension chains; cheaper, lighter round
iron poles; fuses rather than circuit breakers; less expensive meters; backfilling rather than concrete
foundations around poles; and mixed MV and LV network. Standardization of equipment and procedures
were pursued, mainly to improve quality of service and reduce network losses, but these changes – such as
the replacement of spark gap by lightning arresters, the introduction of three-phase transformers, and the
development of a distribution-system construction guide -resulted in cost reductions as well. Stock management
(on-time delivery) and bulk buying methods were also used to reduce costs considerably.5
STEG has continued to reduce distribution system costs through further innovations. These include the SWER
and the MALT 4.16 kV, single-phase line. SWER, a variation on the MALT system, was introduced in 1990.
It has only one live wire and no neutral wire. Instead, the return current passes through at a grounding point
at the end of the line (the MV/LV substations). The technique allows an additional cost reduction of 26-30
percent, compared to single-phase MALT (according to a 1996 study on village cases). SWER was introduced
with a number of precautions because of the potential risks of the returning current to humans and animals
if lines are not carefully installed and monitored.6 By late 1996, the feeder lines implemented using SWER
as pilot projects supplied 425 villages through 1,148 MV/LV substations. District chiefs have the freedom to
decide whether to use SWER in specific RE projects.
The MALT 4.16 kV, single-phase line can reduce the costs of electrifying rural villages in which houses are
widely dispersed. As the rate of RE increases, the number of locations with groups of houses decreases, the
remaining households without electricity are more scattered and the average cost per consumer increases.
This technique is also suitable only for the relatively few projects at the end of the network, where no further
extensions will occur. Hence, the gains are relatively small and usually unjustified by the increased
management needs of introducing another level of voltage and range of network materials. Nonetheless,
district chiefs have the option of choosing to use the 4.16 kV, single-phase line for projects with widely
scattered households at the end of the grid.
Thus, the attempts to reduce the costs of RE in Tunisia have been widespread. The company executing the
RE program could have taken the conservative approach of overbuilding the systems, as has occurred in
many others countries. However, this would have dramatically increased the investments needed to complete
the program.
5 Though the savings of any one innovation may be relatively modest, the cumulative effect is considerable, testifying to the importance of STEG’sculture of continuous improvement.6 The disadvantage of SWER is that a more extensive and costly grounding network is necessary at every point where the line is grounded, as thevoltage drop at the grounding points could be sufficiently high to shock livestock or humans who accidentally touch the line. In Tunisia, SWER isused in more remote areas, where loads are usually low; hence, the voltage is low and less dangerous. Nonetheless, given the increasing loads inremote areas, effective grounding will need to be carefully monitored in the future.
ANNEX 6: ELECTRICITY AND MULTISECTOR DEVELOPMENT IN RURAL TUNISIA
214
SUB-SAHARAN AFRICA: INTRODUCING LOW-COST METHODS IN ELECTRICITY DISTRIBUTION NETWORKS
Photovoltaics: Complementary Strategy for Isolated Users
Tunisia’s national PV program underscores the country’s commitment to provide at least a minimal level of
electrification service to even its most remote rural households, which otherwise would remain unconnected.
Interest in PV developed during the early 1980s, based on environmental and social grounds. Several
demonstration projects were followed by pilot dissemination projects, which showed that the technology
could contribute to meet the basic electricity needs of isolated rural households and that individual PV
systems were better adapted to isolated households than centralized systems, biogas or grid extension.7
As indicated, currently, 7,750 households (about 1 percent of total electrified rural households), 200
schools and a few clinics and forest/border posts have PV installations. The grid and PV programs are
complementary. PV systems give basic electricity service, including lighting, television and radio, but is not
feasible for activities that require higher power requirements such as irrigation and refrigeration. For those
households with minimum electricity requirements, PV has become an interesting alternative to the grid. At
a connection cost of TD1,900 per household, PV compares favorably with grid-connection ceiling costs of
TD1,500-2,200 or even TD2,500 for FSN projects.
Tunisia’s PV RE program has sought to meet user needs in several ways. First, system sizes have been
increased, initially from 50 W to 70 W, with the present standard now at 100 W, in recognition of greater
power needs and less insolation during winter. This equipment feeds a continuous 12-volt current: three
light bulbs, one black-and-white television, and one radio-cassette player. Still, surveys have shown that the
daily consumption level – up to six hours per day for lighting and television viewing, and three hours for
radio-cassette player use – is 300 Wh. Households regularly overload their systems, sometimes leading to
regulator-induced outages to protect the accumulator battery. To avoid such outages, users connect their
televisions directly to the battery, resulting in further damage.
ANER rather than STEG is the implementing agency for the PV program. ANER has principal responsibility
for Tunisia’s renewable energy policy and promotion, the Ministry of Economy, in 1993, designated ANER
to play the lead role in PV RE. Since then, ANER’s implementation role has continued. Though the roles of
STEG and ANER differ, their work is closely coordinated by the CNER, under the aegis of the General
Directorate of Energy, which includes representatives of the Ministries of the Interior, Economic Development
and Environment; FSN; as well as STEG and ANER.
In Tunisia, electricity is viewed as a minimum public service to which every household has a social right.
More than 90 percent of the country’s PV RE program is subsidized. Beneficiaries are required to pay
TD100 per system, with TD200 financed by the regional government, and the remaining TD1,600 financed
by State sources. Currently, consideration is being given to increasing the amount that beneficiaries pay
since 20 percent of system costs today would equal TD500 (TD100 represented 20 percent in 1990). The
largest funding sources are PV-module exporting countries, which have provided supplier credits for some
7 Major projects included the GTZ-funded project in Kef and a State-financed rural schools program.

215
50 percent of the PV systems installed till date. The World Bank has provided loan credits for another 25
percent of installed systems; while national development funds, NGOs and beneficiaries have contributed
the remainder. Clearly, the success of national PV RE depends heavily on the availability of credits and
subsidies.
Thus, RE in Tunisia will reach even the most remote households in the next 10 years. Because the cost of
serving them with grid electricity would be extremely expensive, policy makers in the country decided that
it would be best to provide electricity to remote populations with PV systems.
Lessons in Integrated Rural Development and Social Equity
The lesson of the Tunisian RE program is that the goal of provision of electricity services to widely scattered
rural populations in Africa is certainly achievable. The Tunisian program has done many things right in its
quest to have its rural population enjoy the benefits of electricity. The national Government has provided a
long term stream of financing for a program that was integrated into its rural development strategy. The
company carrying out the program decided early on to treat RE differently than their urban approaches,
and developed both technical and marketing strategies to deal with potential problems. So what are the
reasons for success in Tunisia?
National Commitment. Tunisia’s RE achievement has been motivated by continuing national commitment as
part of a broader, integrated rural development program that has emphasized social equality. Since its
independence from France in 1956, the country has been at the vanguard in promoting human resources
development, particularly gender equity. This is evidenced by the PSC that was promulgated immediately
after independence and the IVth Development Plan, implemented in 1972, whose three pillars were basic
education (for girls and boys), improved health services (with an emphasis on family planning), and RE
(whose socio-economic criteria included gender equity).
Integrated Rural Development Context. Regional planning processes and successive five-year plans have
tightly incorporated RE into broader integrated rural development program and this has produced synergistic
effects. It is well known that growth in RE and national socioeconomic indicators are strongly correlated. But
in addition, informal surveys in several rural areas attest to the multiple benefits of RE as perceived by rural
households and especially women. These include education, health and family planning, economic
opportunities and enhanced security. Also, integrating gender equity into the socioeconomic criteria for RE
has been a key factor in State support for and subsequent success of RE.
Effective Institutional Approach. Regardless of the structure or process that a country adopts for RE, certain
principles are essential for success. These include well-defined, coordinated roles for all agencies concerned
and established procedures that ensure agency cooperation which is perceived as being fair. The Tunisian
system scores well on both counts. All agencies that participate in Tunisia’s RE program have well-defined
roles. Coordination is ensured through an agency with a specific mandate for coordination. Equally important,
policymaking and implementation agencies at both regional and national levels collaborate closely. Agency
ANNEX 6: ELECTRICITY AND MULTISECTOR DEVELOPMENT IN RURAL TUNISIA

216
SUB-SAHARAN AFRICA: INTRODUCING LOW-COST METHODS IN ELECTRICITY DISTRIBUTION NETWORKS
cooperation is facilitated through a project selection process which is meticulous, orderly and transparent.
Through this process, concerns about social justice are addressed, thereby reducing political pressure in
identifying projects, allowing for a more rational and economic long-term program.
Well Managed and Innovative Utility. STEG’s effectiveness and efficiency have earned it both political and
popular support. Much of the utility’s success can be attributed to a clear mandate and a management
structure that combines the benefits of centralized planning and design with decentralized operations. Published
norms, guidelines, and standard contracts contribute to operational transparency.
STEG’s implementation of commercial practices (including control of non-technical losses, billing and collection
practices) has been outstanding. Despite difficulties of delivering bills to isolated communities and their
limited means of payment, rural consumers have an excellent payment record. Success factors include a
consumer management improvement program that has focused on sound meter-reading policies and
practices, development of an integrated billing software program and spreading out connection-cost payments.
Successful construction and implementation of RE projects owes much to encouraging private-sector
participation in construction and promoting local-industry efforts to supply equipment and materials.
Lowering Costs of Rural Electrification. STEG has demonstrated a high-level capacity for adapting technology
to meet Tunisia’s clearly-defined, RE objectives. Early on, the utility computerized its management systems
and developed customized software applications, including a sophisticated inventory management system.
Introduction of the MALT three-phase/single-phase distribution system has dramatically demonstrated STEG’s
high level of innovative technical expertise. Indeed, the utility’s switch to the MALT system has been the
single largest change introduced into the Tunisian program, permitting rapid expansion of RE. In addition,
the MALT system has provided a high level of service by reducing the rate and duration of outages.
Effective Tariff Policy. Tariffs broadly reflect the varying costs of supplying high-, medium- and low-voltage
consumers. All markets distinguish between off-peak and peak usage to encourage more efficient capacity
use. LV supply, of which rural users account for 11 percent, has various tariffs designed to promote social
equity and rural development. These include a lifeline tariff for those who consume less than 50 kWh per
month, subsidized public lighting and low tariffs for irrigation. Such tariffs benefit from a significant, yet
apparently manageable, cross-subsidy. Although STEG does not publish detailed power-sector finances, it is
believed that, over the last decade, there has been only a modest gap between electricity-sector costs and
prices.
Complementary PV Strategy. Tunisia’s high-profile PV program – with its goal of providing a minimum 100-
W level of electricity service to all households by 2010 – reflects a commitment to including even the most
remote rural areas in national development. The program features the high-quality technical support and
robust finances that have characterized the country’s rapidly expanding grid program. Success factors have
included close institutional coordination with STEG; careful selection and adaptation of equipment; strong
domestic and international donor support; and an emphasis on user needs, maintenance, and after-sales
support.

217
Conclusion
Africa has the lowest rates of RE in the world. In most countries the rates are 10 percent or less. In contrast,
Tunisia’s achievement of 100 percent urban and 88 percent RE is remarkable, all the more so because the
country’s definition of RE is restricted to connections made outside incorporated areas. Tunisia’s rural
population – although only 35 percent of the total population – is highly dispersed and isolated, with long
distances between small groups of often scattered houses. This has led to many technical and managerial
innovations. But the question also arises as to whether the considerable technical expertise of STEG and its
related partners can be shared with other RE programs in Africa.
In this regard, the MALT system has attracted the attention of various African countries. Both Senegal and
Mali have sent their technicians to STEG for training or to obtain information that they can potentially apply
in their countries. At the request of Madagascar’s Ministry of Energy, STEG carried out a study for a pilot
project in that country and technicians from Madagascar’s utility have participated in STEG training courses.
Most of the STEG assistance in Africa thus far has been highly technical, on the MALT system and on
electricity pricing. However as this review shows, a number of institutional, structural, financial and political
factors have also played an important role in the success of the Tunisian RE program. Indeed, encouraging
STEG’s technical assistance to RE programs throughout Africa and to other developing countries
worldwide – through both bilateral and multilateral programs – is an interesting option.
As total RE rapidly approaches, Tunisia still faces many new challenges. Changes toward democratizing
Tunisian society may create pressures for greater consumer participation in sectoral decision-making and
the need for better communication between STEG and its consumers. While in theory, Tunisia’s
project-selection process is transparent and minimizes political pressure, in practice, it may be criticized for
verging on the mechanical. This is especially so in cases where local costs diverge from the national
averages used to estimate the total costs of RE. Finally, as electricity is provided to the final 12 percent of the
rural population without it, the respective roles of the institutions providing PV systems and grid electrification
will require clarification and improved coordination.
Despite these challenges, the program in Tunisia with its emphasis on coordinating access to electricity
access with rural development has been quite a success. The political and socioeconomic conditions that
have contributed to this achievement may not be replicated in other countries. Experience of the utility and
the solutions to problems that it faced throughout the last 30 years may not provide a precise blueprint for
other countries, but nonetheless, they certainly can provide useful insights. The accomplishments of the
program in Tunisia may be a beacon for other countries that want their rural populations to have the
modern benefits of electricity, but are having difficulty figuring out how to approach such an important long
term commitment.
ANNEX 6: ELECTRICITY AND MULTISECTOR DEVELOPMENT IN RURAL TUNISIA


219
African Development Bank. The African Development Bank Experience with Rural Electrification: The Case
of Tunisia. Workshop Proceedings on Financing Photovoltaic Rural Electrification in Developing Countries,
March 5-7. Rome: ENEA, 1995a.
_______. Tunisie: Rapport d’Achèvement, Projet d’Electrification Rurale (Electricite IV), Departement
Infrastructure et Industrie, Region Nord. Abidjan : African Development Bank, 1995b.
_______. Rapport d’Evaluation du Projet d’Electrification Rurale (Electricite VI): Tunisie, Departement par
pays Region Nord. Abidjan : African Development Bank, 1999.
Amaïmia, Néji, and Ounalli, Amor: Programme Tunisien d’Electrification Rurale par Systèmes Photovoltaïques.
Tunis: National Agency for Renewable Energy, 2001.
AME and GTZ. Solar Rural Electrification in Tunisia: Approach and Practical Experience, Vols.1 and 2. Tunis:
Agence pour la Maîtrise de l’Energie, 1999.
ANER. Stratégie de Développement des Energies Renouvelables. Tunis: National Agency for Renewable
Energy, 1996.
_______. Project d’électrification de 200 foyers ruraux, d’une école primaire et d’un dispensaire au
Gouvernorat de Siliana, Coopération Tuniso-Espagnole, Rapport de Synthèse. Tunis: National Agency for
Renewable Energy, 1998.
_______. Rapport Annuel d’Activité. Tunis: National Agency for Renewable Energy, 1999.
Brook, Penelope and Suzanne Smith, eds. Contracting for Public Services: Output Based Aid and Its
Applications. The World Bank and International Finance Corporation: Washington DC, 2001.
2. References

220
SUB-SAHARAN AFRICA: INTRODUCING LOW-COST METHODS IN ELECTRICITY DISTRIBUTION NETWORKS
Belkhiria, Hachemi. Etude d’un projet pilote pour l’électrification rurale en 4.16kV monophasé. Tunis:
Tunisian Electricity and Gas Company, 1996.
_______. Etude de l’alimentation des zones de pompage par un réseau basse tension à 3 fils et 2 niveaux
de tension. Tunis: Tunisian Electricity and Gas Company, 2001.
Berthier, Gregory: Les politiques d’électrification de la Tunisie: Des dernières années du protectorat aux
premières années de l’indépendance 1952-1962. Paris : Université Paris X-Nanterre, Département d’Histoire,
2000.
Bouraoui, Soukaina: “Droits des femmes et évolution des rapports hommesfemmes depuis l’Indépendance.”
In Population et Développement en Tunisie, eds. Jacques Vallin and Thérese Locoh. Tunis: Centre d’Etudes
et de Recherches Economiques et Sociales (CERES), 2001.
Chaib, Sawsen, Moncef Aissa, and Ahmed Ounalli: Enquête sur l’impact socioéconomique de l’électrification
rurale: Méthodologie et résultats. Internal report, 2001.
Energy Management Assistance Program: “Tunisia: Interfuel Substitution Study: A Joint Report.” ESMAP
Report 114/90, World Bank, Washington, D.C, 1990.
_______. “Power Efficiency Study.” ESMAP Report 136/91, World Bank, Washington, D.C, 1992a.
_______. “Tunisia: Energy Management Strategy in the Residential and Tertiary Sectors.” ESMAP Report
146/92, World Bank, Washington, D.C, 1992b.
_______. “Tunisie: Les Potentiels de Valorisation des Energies Renouvelables.” ESMAP Report 190A/96,
Vols. 1 and 2, World Bank, Washington, D.C, 1996.
Essebaa, Hachemi. Le systeme MALT: un système de distribution adapté. Tunis: Revue de l’Electricité et du
Gaz, Décembre 1994 FAO. 1993. Evaluation du Programme Rural Intégré (PDRI). Rome: Food and Agriculture
Organization of the United Nations, 1994.
Hicks, Jack, Allen Inversin, Mounir Majdoub, and Seyoum Solomon: Rural Electrification Evaluation Study:
Tunisia, November 1993. Washington, D.C.: National Rural Electrification Cooperative Association, 1993.
International Herald Tribune,: “Contemporary Tunisia: Women in Business,” August 13, 2001.

221
Masmoudi, Radhouane: l’Electrification Rurale. Revue Tunisienne de l’Energie, N° 47, Fourth Trimester.
Tunis: Ministère de l’Industrie, 1997.
Nordic Consulting Group: Etude d’impact de secteur de l’energie, Tunisie: Aide Memoire. Abidjan: African
Development Bank, 1997.
NRECA International: Reducing the Cost of Grid Extension for Rural Electrification. Washington, D.C.: Energy
Sector Management Assistance Programme (ESMAP), The World Bank, 1999.
Republic of Tunisia: Rapports Annuels sur les Indicateurs d’Infrastructure: Années Tunis: Ministry of Economic
Development, National Institute of Statistics, 1998-1999-2000.
_______. Rapport National sur le Développement Humain en Tunisie: Tunis: Ministry of Economic
Development, National Institute of Statistics, 1999.
STEG. L’électrification rurale par la méthode SWER: Rapport d’évaluation de l’expérience tunisienne. Tunis:
Tunisian Electricity and Gas Company, 1996.
_______. Rapports Annuels d’Activité: Tunis: Tunisian Electricity and Gas Company, 1980-1999.
_______. 2000. Statistiques Rétrospectives Direction des Etudes et de la Planification. Tunis: Tunisian
Electricity and Gas Company, 1989-1999.
World Bank. Republic of Tunisia, Social and Structural Review 2000: Integrating into the World Economy
and Sustaining Economic and Social Progress. Washington, D.C.: The World Bank, 2000a.
_______. Memorandum from IBRD President to Executive Directors on a CAS of the World Bank Group for the
Republic of Tunisia, Maghreb Country Management Unit, Middle East and North Africa Region, 2000b.
_______. Tunisia: Country Brief. Available at http://www.worldbank.org , 2001.
ANNEX 6: REFERENCES


Mohamed Moncef Aissa
Annex 7
STEG Technical Approach toCost-cutting in Rural Electrificationin Tunisia


1. Introduction
225
The ambitious scale of the Tunisian RE program – largely financed by the State, with some contributions
from the beneficiaries and from the utility – required close attention to the costs of system expansion. It was
clear from the beginning of the program that the only way to meet the specified goals would be to reduce
investment costs to a minimum. Vigorous efforts to cut the costs of RE were, thus, an early emphasis.
The present paper describes the technical innovations continuously developed and adapted by STEG engineers
to Tunisian conditions, in order to cut costs of both implementation and maintenance.
A key reason for these cost reductions was the early adoption of a low-cost three-phase/single-phase
distribution system, called the “MALT”, in the mid-1970s, followed by continual dynamic cost-cutting efforts
in the 1980s and 1990s. The majority of African countries that launched RE programs in the 1970s did so
with the assistance of European utilities, and used technical standards of Europe. These standards included
a three-phase distribution system suitable for the dense populations and heavy loads of Europe, but unnecessary
for scattered settlements and low levels of demand in developing countries.
Tunisia did not follow this path, in spite of having inherited the European three-phase system. Instead,
Tunisia chose, at an early stage of development of its RE system, to make use of the experience with lower-
cost three-phase/single-phase distribution systems used in North America and Australia, and to adapt this
technology uniquely to its own needs and environment.
According to many in Tunisia and elsewhere, this decision was perhaps the singlemost important factor in
enabling the later success of the Tunisian RE program. Not only did the broader use of single-phase distribution
reduce costs dramatically, enabling far more households to be electrified with the same budget. But the
effect of taking a courageous, much-criticized, and later-proven-correct technical decision, which was
supported by the political establishment – together with the experience of solving the numerous technical
and other problems involved with setting up the new system – went further than this. It appears to have
fostered in STEG, the Tunisian utility, confidence, and motivation to continually develop and implement,
over the years, a number of vigorous cost-cutting efforts and innovative technical approaches to RE.

227
2. Rigorous Technical andEconomic Evaluation of the Most
Appropriate Distribution System forTunisian Conditions
At the world level, two basic approaches for electrification are practiced: The North American approach
(with the widespread utilization of lines, combined with a three-phase backbone), and the European approach
(with the extension of three-phase lines throughout the service zone). In the early 1970s, the entire electricity
system in Tunisia was based on three-phase distribution.
When the need to accelerate RE became evident in Tunisia, STEG undertook a Technical Audit of Distribution
in 1973 to assess both of these distribution methods. The study indicated that the existing European system
was not best adapted to an ambitious program of low-cost RE under Tunisian conditions. Given low rural
incomes, dispersed households and the limited consumption of the targeted population – generally lighting
and less frequently refrigeration or television – it was clear that the cost of most RE could not be financed
solely through tariffs, and that the best use needed to be made of the limited investment resources available.
The Audit recommended the study of a new means of distribution using single-phase lines for RE.
According to one of the Tunisian engineers who participated in the program, “Never had a technical
recommendation raised as many debates and exchanges of points of view in STEG” (Essebaa, 1993). The
environment at the time was hostile to the changeover, according to a later AfDB report, given the predominant
European three-phase system, with opposition both from system operators and from European partners. But
a technical study for the Master Plan for Distribution confirmed the recommendations of the Technical Audit.
To avoid nationalist connotations of pitting the European against the North American system, the three-
phase/single-phase distribution system was baptized by the Tunisians as MALT “Mise a la Terre effective’,
referring to the grounding of the neutral wire.
After several complementary studies, STEG engineers felt confident regarding the technical feasibility of the
transformation and of the superiority in quality of service of the MALT system, since it also allowed automatically
isolating lines with outage, from the rest of grid.
At that point, the decision to change the system became an economic question, and economic studies were
developed in several stages in 1974-1975.

228
SUB-SAHARAN AFRICA: INTRODUCING LOW-COST METHODS IN ELECTRICITY DISTRIBUTION NETWORKS
First, the two types of distribution systems were studied for seven typical villages, with positive results for the
MALT showing 30 percent savings.
To extend these comparisons to a larger number of villages, STEG developed a computer model – an
innovation at that time – to allow comparison of costs for the two systems in 300 projects randomly chosen
from those selected for the Fifth Development Plan (1977-1981). Basic field data on electricity consumption,
length of MV and LV lines needed, and the number of subscribers for end-uses such as lighting and
pumping expected five years after electrification, were gathered by STEG staff. A number of technical
assumptions were made about installed power, voltage drops and so on; the most realistic prices of electrical
equipment were gathered; and these assumptions were used to design and cost different scenarios in order
to provide a realistic range of results for both distribution systems.
Table A 7.1: Estimated Savings from Implementation of Three-phase/Single-phase MALT Compared to
the Conventional Three-phase Distribution System Serving 300 Randomly Selected Villages (1975)
Network Level Cost Reduction
Medium Voltage 30 to 40%
MV/LV Substations 15 to 20%
LV Network 5 to 10%
Overall 18 to 24%
Source: Essabaa Hachemi, “Le système MALT: un système de distribution adapté,” Revue de l’Electricité et du Gaz (REG) de la STEG, Décembre 1994.
As the table above shows, the results of the model using data from the 300 randomly selected villages were
highly in favor of the MALT, with savings of 18-24 percent projected. The largest reduction was at the MV
level.
On January 29, 1976, the decision was taken to change over the existing distribution system to the
MALT.

229
3. The MALT DistributionSystem Design
Figure A 7.1: Typical MALT System
The three-phase/single-phase MALT distribution system adopted in Tunisia consists of major feeders of
overhead lines in three-phase 30 kV line-to-line voltage, with four wires (three-phases and one neutral
wire), and secondary single-phase 17.32 kV line-to-neutral voltage for rural distribution overhead lines
(two wires: one phase and one neutral). If heavy loads are to be fed, then three-phase lines with four
conductors are used. The MV single-phase lines are protected by fuse cut-outs. The single-phase transformers
give a secondary phase-to-neutral voltage of 230 V or 240 V (single-phase LV lines) and this is used by the
vast majority of rural subscribers.
The single-phase primary distribution necessarily provides an unbalanced system.

230
SUB-SAHARAN AFRICA: INTRODUCING LOW-COST METHODS IN ELECTRICITY DISTRIBUTION NETWORKS
For the changeover from classical system to MALT system, STEG replaced
• Existing Neutral Point Coils (NPC) in HV/30 kV substations;
• Existing constant time relays by reciprocal time relays protection; and
• Existing current transformers with CT-adapted to MALT specifications.
Characteristics of Tunisian MALT System
• Neutral is grounded approximately every 300 m (at one pole over 2).
• Constraints related to grounded neutral limiting over-voltages (sufficient relations but not necessary):
– 0<X0/X
d≤3
– 0<R0/X
d<1
Where
X0 : zero sequence reactance
Xd : positive sequence reactance
R0 : zero sequence resistance
• With these constraints, in case of short circuit between one phase and the ground or the neutral
conductor, over-voltages appearing in safe phases remain less than 140 percent of rated value (or
earthing factor less than 80 percent).
• In case of short circuit between phase and the ground, short circuit currents are much higher than with
classical three-phase system.
• Maximum permanent current acceptable in neutral wire is limited to 150 Amp by the NPC.
• Effective earthing of neutral is realized through the NPC connected to HV/MV substation transformer.
• Neutral wire cross-section is dimensioned for a load flow corresponding to 150 Amp and also to
withstand in case of short circuit. 54.6 mm² Aster-type wire was chosen for neutral wire.
• Adopted phase wire cross-section is 148.1 mm² Aster for main 3-phase overhead lines.
• Adopted phase wire cross-section is 54.6 mm² Aster for rural single-phase overhead lines (phase and
neutral wires)
• Each single-phase rural line is protected by a fuse cut-out. This fuse must be coordinated with other
protective devices installed in the feeder to which is connected the rural line (circuit breaker, recloser,
sectionalizer)
Advantages of Fuse Cut-outs
• Very cheap when compared to three-phase overhead switch.
• Visible power cut. When fuse melts fuse holder switches down.
• No need to cut power when re-fusing the cut-out (hot line remote shutting fuse holder with insulated
rod).
• Different types of fuse offering many possibilities to coordinate with other protective devices.
• In case of outage in the rural single-phase line, due to coordination between protective devices, the
fuse melts before final power cut of the main feeder. Only the affected rural line is cut. Consumers
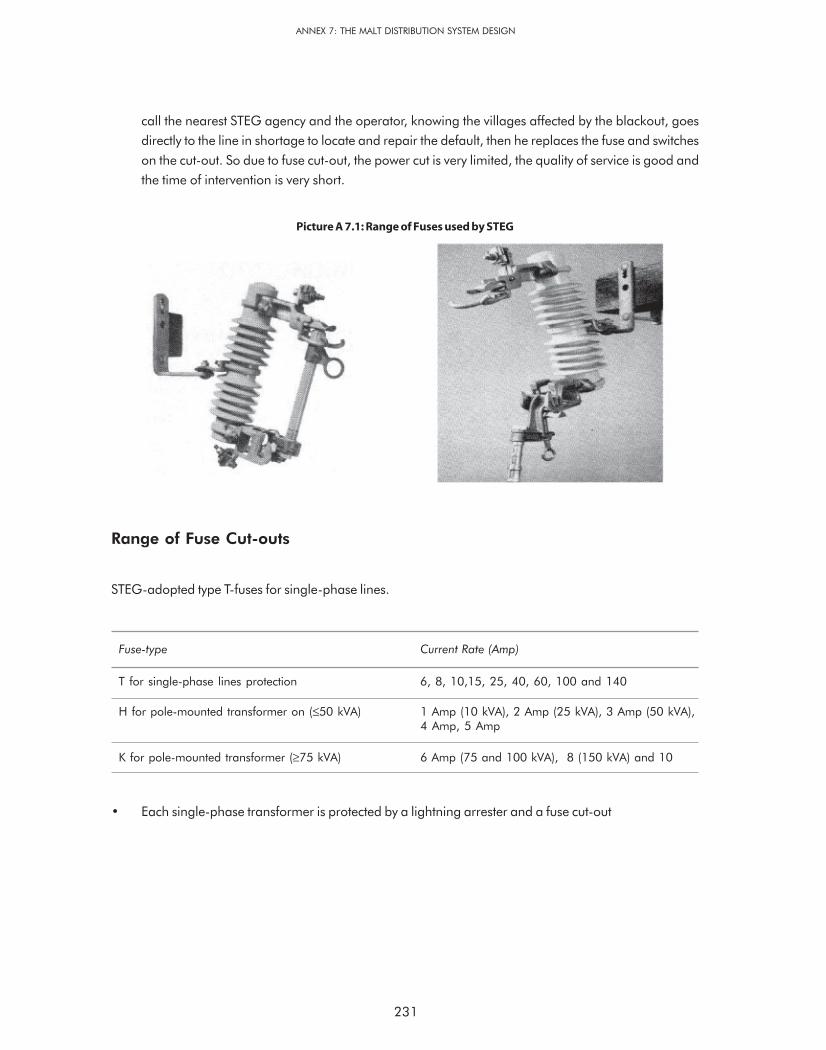
231
Picture A 7.1: Range of Fuses used by STEG
ANNEX 7: THE MALT DISTRIBUTION SYSTEM DESIGN
call the nearest STEG agency and the operator, knowing the villages affected by the blackout, goes
directly to the line in shortage to locate and repair the default, then he replaces the fuse and switches
on the cut-out. So due to fuse cut-out, the power cut is very limited, the quality of service is good and
the time of intervention is very short.
Range of Fuse Cut-outs
STEG-adopted type T-fuses for single-phase lines.
Fuse-type Current Rate (Amp)
T for single-phase lines protection 6, 8, 10,15, 25, 40, 60, 100 and 140
H for pole-mounted transformer on (≤50 kVA) 1 Amp (10 kVA), 2 Amp (25 kVA), 3 Amp (50 kVA),4 Amp, 5 Amp
K for pole-mounted transformer (≥75 kVA) 6 Amp (75 and 100 kVA), 8 (150 kVA) and 10
• Each single-phase transformer is protected by a lightning arrester and a fuse cut-out
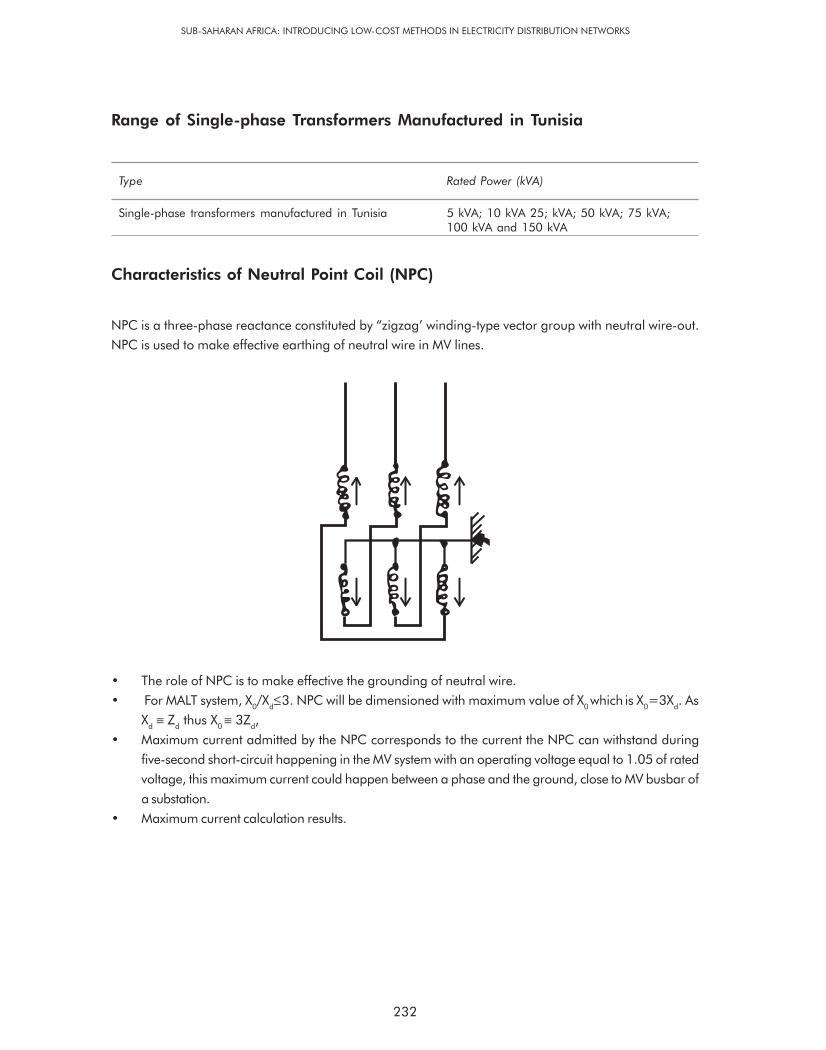
232
SUB-SAHARAN AFRICA: INTRODUCING LOW-COST METHODS IN ELECTRICITY DISTRIBUTION NETWORKS
Range of Single-phase Transformers Manufactured in Tunisia
Type Rated Power (kVA)
Single-phase transformers manufactured in Tunisia 5 kVA; 10 kVA 25; kVA; 50 kVA; 75 kVA;100 kVA and 150 kVA
Characteristics of Neutral Point Coil (NPC)
NPC is a three-phase reactance constituted by “zigzag’ winding-type vector group with neutral wire-out.
NPC is used to make effective earthing of neutral wire in MV lines.
• The role of NPC is to make effective the grounding of neutral wire.
• For MALT system, X0/X
d≤3. NPC will be dimensioned with maximum value of X
0 which
is X
0=3X
d. As
Xd ≡ Z
d thus X
0 ≡ 3Z
d,
• Maximum current admitted by the NPC corresponds to the current the NPC can withstand during
five-second short-circuit happening in the MV system with an operating voltage equal to 1.05 of rated
voltage, this maximum current could happen between a phase and the ground, close to MV busbar of
a substation.
• Maximum current calculation results.

233
Transformer-rated Power (MVA) X0 (Ω) Phase-neutral short-circuit Current (Amp)
15 18 1,800
20 13.5 2,300
25 10.8 2,900
30 11.25 2,800
40 8.4 3,700
50 6.75 4,600
• Permanent unbalanced system current (current in the neutral wire): this current is due to
– Capacitive currents generated by the overhead lines (about 8A/100km of 30 kV line)
– Unbalanced phases due to single-phase loads
– Instant changes in load flow in case of outage occurring in an single-phase line carrying a
relatively big load or when the operator cut a line for maintenance works
The maximum current value was fixed at 150 Amp in order to allow single-phase lines to carry
maximum load and also to avoid activating the maximum current protection of the substation
transformer following unbalanced system current.
The distribution system as a whole is composed of simple and robust materials and equipment, easy to use
and to maintain.
A second key technical decision taken, at the same time of the adoption of MALT technique, was opting for
a relatively high single-phase 17.32 kV voltage, rather than the weak 3 or 5 kV of the North American
model. The higher voltage was selected for the single-phase RE overhead lines due to the long distances
between villages and the nearest three-phase main feeder, and to provide for future growth in demand
over the 30-year lifetime of the lines.
ANNEX 7: THE MALT DISTRIBUTION SYSTEM DESIGN


235
4. Rapid System Conversion withResolution of Technical Problems
by Tunisian Engineers
The change in the system took place very rapidly, testifying to STEG’s analytical, planning and logistical
abilities. To the extent possible, existing equipment and material (circuit breakers, spark gaps, three-phase
underground cables, auxiliary relays of protection, 30 kV three-phase transformers and switching devices)
were kept and integrated with the new system in order to save costs.
The system conversion consisted of two major steps:
(1) The changeover of the existing 4,000 km of 30 kV grid, which consisted of:
– Replacing NPC in HV/30 kV substations, in order to increase the phase-to-neutral (or ground)
short-circuit current and, consequently, decrease the overvoltage occurring in the safe phases in
case of outage;
– Laying the fourth neutral wire on the main 30 kV feeders; and
– Replacing the constant time protections (relays current transformers) with reciprocal time protections
in HV/MV and RMU (Ring Main Unit) substations, in order to allow coordination between protective
devices including fuses;
– Replacing existent protection current transformers with ones more accurate for higher currents
(many times the rated current) in order to ensure coordination between protective devices.
(2) Training of technical staff, planning projects, designing and monitoring the installation of new construction
(lines, single-phase and three-phase MV/LV substations) in the MALT system, adaptation of equipment
with new standards, bulk purchase and stock management, etc.
Both of these steps posed important questions of technical adaptation, of organization, of implementation
capacity and of consumer relations, given the repeated interruptions in supply, necessary during the
changeover. Table A 7.2 gives some examples of the types of obstacles encountered, and how these were
overcome.

236
SUB-SAHARAN AFRICA: INTRODUCING LOW-COST METHODS IN ELECTRICITY DISTRIBUTION NETWORKS
Table A 7.2: Some Difficulties Encountered in the Changeover to MALT and how these were
Overcome by STEG
Difficulties Solutions
Changeover of the 30 kV network
Laying a neutral, 4th wire had not been foreseen in For each type of cross arm, considerablethe construction of the European-type three-phase imagination, and numerous trials and attemptsnetwork, so difficulties were encountered in installing were required to accurately place the 4th wirethe neutral wire on the existing poles whilemaintaining the required height above the ground
The neutral wire was attached to a LV spool The LV spool insulator was later replacedinsulator – later judged inadequate, especially by a suspension insulator.where excessively long spans between polescaused the wires to break
Snapping of the wires in some spans, where These anomalies were quickly correctedthe neutral wire had not been correctly placed, without significant damageswith flashovers occurring between the neutral andone of the three live wires
Changing the protections in HV/MV and switching substations
The existing fully saturated current transformers Replacement with high-performancewere not well adapted to MALT current transformers
Difficulties linked with the necessary power cuts for The tripping-reclosing cycles and the automatesthe replacement and adjustment of the protections associated with the new protections were studied,
identified, wired and tested in the laboratory priorto installation. Field interventions were reducedto installation and connection of a fully equippedpanel, wired and tested in the laboratory
Taking the resistant earth protection out of service With more experience, it was shown that theraised a lot of apprehensions resistant earth protection was not indispensable
Specifications of equipment and installations of the new system
The new three-phase “Ynyn’ transformers created They were replaced by four-column magneticproblems of tank overheating in case of outage transformers.in one live wire.
The first fuse cut-outs and the cabin substation Technical specifications were modified to reinforcecrossing insulators were unsuitable to the humid insulation of equipment installed in these typesclimate of the coastal zones and the salinity of of areasChott El Jérid
Disturbances in local telephone lines running along Capacitive disturbances were resolved with filterslong distance electric lines on the telephone lines, and inductive ones by
improving the groundings on the concerned lines

237
ANNEX 7: RAPID SYSTEM CONVERSION WITH RESOLUTION OF TECHNICAL PROBLEMS BY TUNISIAN ENGINEERS
Some technical advice on the three-phase/single-phase system was provided by Hydro-Quebec engineers,
and short-term technical visits to Canada were organized, beginning in1976, for system operators and
engineers. But the planning of the new system and solving of problems encountered in the course of
changing the system were entirely the work of the STEG staff.
The actual changeover of the 4,000 km, three-phase, 30 kV network to the MALT system took four years,
1976-1980, laying the basis for launching a vast program of RE in single-phase overhead branch lines.
As Table A 7.3 shows, the length of single-phase lines rose from zero km in 1976 to almost 19,000 in
2000. As the five-year plans were implemented, the number of Kms of single-phase lines increased more
rapidly than the number of kms of three-phase lines, and the single-phase investment became increasingly
dominant. Single-phase lines at the end of 2003 accounted for 53 percent of the total network, compared
with a mere 16 percent in 1981.
Table A 7.3: Length of Three-phase and Single-phase Medium-voltage Overhead Lines at the End of
Each Five-year Plan
Three-phase Single-phase
Plan Period km Growth (%) km Growth(%) Share ofSingle-phasein Total (%)
1977-1981 9,488 7.1 1,830 16.3 16.2%
1982-1986 12,312 5.3 3,318 12.6 21.0%
1987-1991 13,412 1.7 7,008 16.1 34.3%
1992-1996 15,551 3.0 13,920 14.7 47.2%
1997-2001 17,538 3.1 18,563 7.5 51.4%
2003 18,900 2.5 21,200 4.5 52.8%
Similarly, single-phase substations dedicated to RE now account for 72 percent of all STEG substations.
In just over 25 years, the number of single-phase substations has risen from zero in 1976, to over 25,000
in 2003.

238
SUB-SAHARAN AFRICA: INTRODUCING LOW-COST METHODS IN ELECTRICITY DISTRIBUTION NETWORKS
Table A 7.4: Number of Three-phase and Single-phase Medium-voltage/Low-voltage Substations at
the End of Each Five-year Plan
Year Total Number of Number of Average Yearly Percent Single-phaseSingle-phase and Single-phase Increasing Rate of Substations /Total
Three-phase STEG’s MV/LV STEG’s MV/LV Single-phase Number ofSubstations Substations MV/LV Substations Substations
1976 3,100 0 0%
1981 5,184 1,138 22%
1986 9,230 2,880 20.4% 31%
1991 14,732 7,028 16.5% 48%
1996 24,265 16,393 18.5% 68%
2000 31,519 22,334 8% 71%
2003 35,700 25,600 4.7% 72%

239
5. Clear Advantages of MALT:Cost Savings and Improved
Quality of Service
Figure A 7.2: Total Line Cost (Materials and Labor) and % Cost Savings for Three-phase and Single-phaseConfiguration in Different Countries (cost/km in US$)
Source: NRECA, Reducing the Cost of Grid Extension for Rural Electrification, December 1999.
The principal advantage of the MALT system is the reduction in costs, which permits service to be provided
to a larger number of households for a given investment. The original estimated overall reduction (MV and
LV) in costs of 18-24 percent, corresponding to a cost reduction of about 30-40 percent at the MV lines
level, would be consistent with recent comparisons of cost savings of the three-phase/single-phase over the
three-phase configuration shown in Figure A 7.2.
Total line cost (materials and labor) and percent cost savings forthree-phase and single-phase configuration in different countries.
Co
st/k
m (U
S$)
$25,000
$20,000
$15,000
$10,000
$5,000
$0
Laos
Bangla
des
h
El S
alv
ador
Met
tler, In
c.U
SA
Phili
ppin
es(M
ORESC
OI)
Phili
ppin
es(T
are
lco II)
Boliv
ia
Phili
ppin
es(N
EA
)
Ben
ton R
EC
(USA
)
Rapp
ahan
nock
EC
(U
SA)
26%
54%
33% 36%
47%35%
37%
48%
28%
37%Three-phase
Single-phase
EuropeanConfiguration
North AmericanConfiguration

240
SUB-SAHARAN AFRICA: INTRODUCING LOW-COST METHODS IN ELECTRICITY DISTRIBUTION NETWORKS
A calculation of cost reduction on a “typical’ 1.44 km long RE line in 54.6 mm² Aster-type of conductor was
made by STEG, with prices of year 2000, using the in-house “Tanouir’ software for designing MV lines (see
Annex).
Table A 7.5: Recent Reduction Estimate (US$2000) of Single-phase Overhead MV Lines/Conventional
Three-phase Lines
Insulator Pin Cost-cutting of PinString Insulator Insulator / Insulator
String Technique
Cost of 1 km European-type MV 11,157 10,532 5.6%three-phase overhead line (in US$)
Cost of 1 km MALT-type MV 8,146 6,665 18%single-phase overhead line (in US$)
Percent cost saving of 1 km single-phase 27.0% 37.0%two-wire line/European-type three-wire line
This resulted in a cost estimation of US$6,665 /km corresponding to a reduction of 37 percent in comparison
to three-phase line cost. The principal savings are in poles and line accessories, while there is a negligible
cost increase for grounding.
Table A 7.6 shows the distribution of cost reductions in percentage by group of items used in lines construction.
Table A 7.6: Distribution of Reductions in Both Types of Single-phase Lines
Contribution of Group of Items in Cost Reduction (%)Between Single-phase and Three-phase Overhead Lines
Item Groups Suspension Chain-type Line Pin Insulator-type Line
Conductors 6.6% 7.0%
Line Accessories 13.5% 11.5%
Earthing (or Grounding) Sets -2.0% -2.2%
Poles 7.2% 17.3%
Cross Arms 1.7% 3.1%
OVERALL 27% 36.7%

241
Despite a negligible surcharge of 2 percent in grounding neutral single-phase lines, calculations show
interesting savings in conductors, poles and line accessories. With pin insulators we can get additional
savings of about 10 in comparison to the suspension technique.
Surcharge of three-phase MALT line (four-wires) in comparison to classical three-phase line (three-wires)
is estimated at about only 4 to 5 percent since the additional neutral wire has a small cross-section (54.6
mm²) for a main feeder in 148.1 mm² for the three-phase wires.
During the Fifth Five Year Plan (1982-1986), for example, reduction from the MALT system allowed
electrification of 10,000 additional households.
The fact that this change to the MALT system was effected early in the development of the Tunisian grid
meant that the costs of change did not weigh too heavily on profitability, and these returns have been a
significant factor in the high rate of RE in Tunisia.
MALT also has a second advantage of automatically isolating the area suffering from damage, so that fewer
rural consumers are affected, failures can be more quickly identified, and repairs can be made more
promptly and at relatively low cost. The branch line affected by the failure is isolated by a fuse placed at the
head of each branch line, so the other feeder lines and the principal artery continue to operate normally.
This has improved the quality of service.
ANNEX 7: CLEAR ADVANTAGES OF MALT: COST SAVINGS AND IMPROVED QUALITY OF SERVICE


243
6. Questions about MALT forLarge Motor Productive Uses
As the three-phase/single-phase system has advanced and proven its reliability and safety, criticisms of the
MALT have diminished, but some negative points are still raised. The main disadvantage of the MALT is the
need to make adaptations and conversions in order to serve large motor (less than 7.5 hp in Tunisia,
greater than 100 hp in USA) agro-industrial and deep borehole irrigation loads requesting generally three-
phase electrical motors. This problem does not arise with any household uses such as refrigerators or color
TV, nor with small motors e.g., electric pumps, manual tools, which present no difficulties with single-phase
lines. But it does potentially present an extra obstacle to large-scale industrial development in remote rural
areas, since the additional costs are borne by the consumer.
Most industrial development, of course, takes place in industrial zones and incorporated villages, and these
are in any case supplied with three-phase 30 kV lines. Outside these areas, conversion from single-phase
to three-phase lines can be made later, if justified by the load; but in practice, this has seldom happened in
Tunisia.
Technical solutions are available and are indeed widely marketed and practiced in North America. These
consist of special, more expensive motors, which for 100 hp loads can cost an additional
US$2,000-US$15,000. USAID experts have pointed out that these costs are minor compared to the cost of
installing three-phase lines, and have recommended even wider use of single-phase even in areas with
high loads from agro-industry and pumping (Hicks, et al,1993). In Tunisia, however, early experience with
single-phase 7.5 hp electric pumps was unsatisfactory and this created a suspicion among consumers that
single-phase lines were somehow inferior.
STEG has offered several solutions for consumers in rural areas:
• For motors between 7.5 and 15 hp, a parallel assembly of two motors of 7.5 hp, at a cost of twice the
price of a single motor; but only when it is possible to put two motors in parallel. This solution was used
successfully in olive oil plants.
• For motors above 7.5 hp, a locally made roto-phase converter costing between US$2,400 (≅ TD3500)
for a 25 kVA converter and US$4480 (≅ TD6500; $1= TD1.45 when this estimate was done in

244
SUB-SAHARAN AFRICA: INTRODUCING LOW-COST METHODS IN ELECTRICITY DISTRIBUTION NETWORKS
2000) for a 50 kVA converter, depending on the motor hp, the voltage input and whether a three-
phase auto-transformer 230/400 is needed;
• Reinforcement of single-phase line to three-phase, at a cost of US$8,660 (≅ TD12,400) per km.
So installing a phase converter is cheaper than
• Reinforcing less than 300 m of single-phase line to three-phase for power not exceeding 25 kVA
• Reinforcing even half a km of single-phase line to three-phase for local power supply not exceeding
50 kVA
Converters are made in Tunisia.
In all cases, however, the extra costs are borne by the consumer.
It is difficult to know to what extent the unavailability of three-phase power lines has proven an obstacle to
the establishment of productive large motor uses in what are, admittedly, rather remote rural areas (by
definition outside of incorporated villages). But it is not uncommon in Tunisia today for prosperous retirees
to return to their rural homes wishing to establish an economic activity. Two examples of this were encountered
though in an informal rural appraisal : a vineyard and winery under construction had only a single-phase
connection and would incur considerable costs to purchase motors for both large-scale irrigation and pressing;
and a proposed ostrich-raising project would require numerous electric heaters.

245
7. Further Innovations inDistribution Techniques: SWER and
4.16 kV Single-phase Lines
STEG has continued to investigate ways to reduce distribution system costs further. These include SWER
(For more information see Appendix 7.4) and 4.16 kV single-phase lines.
SWER
SWER is a variation on MALT, with only one live wire and no neutral wire. Instead of a neutral wire, the
return current goes through a grounding point at the end of the line (at the MV/LV substations).
SWER allows an additional cost reduction of 26-30 percent compared to single-phase MALT, according to a
1996 study on actual village cases. This technique was introduced in 1990 with a number of precautions
and in a limited fashion, due to the risks which the returning current could pose to people and animals
unless the lines are carefully installed and monitored.
The overhead lines implemented, using SWER as pilot projects at end of 1996, were supplying:
• 425 villages with;
• 1,200 MV/LV SWER substations; and
• 1,180 km SWER overhead lines.
The disadvantage of SWER is that a more extensive and expensive grounding network is necessary at every
point where the line is grounded, as the voltage drop at the grounding points could be sufficiently high to
present the danger of shock to livestock and humans. In remote areas, where SWER is used in Tunisia, the
load is typically low and the voltage hence small and less dangerous. Nonetheless, given the increasing
loads, effective grounding will need to be carefully monitored in the future.

246
SUB-SAHARAN AFRICA: INTRODUCING LOW-COST METHODS IN ELECTRICITY DISTRIBUTION NETWORKS
District chiefs have the latitude to decide whether to use SWER in specific RE projects
A MALT single-phase line of 4.16 kV can reduce the costs of electrification in villages with very dispersed
houses. As the rate of RE increases, the number of locations with groups of houses diminishes, households
are more scattered, and the average cost per subscriber of electrification increases. This requires an
increasingly long LV network. Pilot projects in 1996 illustrated that a cost reduction of between 7 and 14
percent can be obtained for houses that have an average dispersal, and an even more important reduction
of 31-33 percent for extremely dispersed houses. This technique is, however, only suitable for the relatively
few projects at the end of the network, where there will be no further extensions. Hence the gains are
relatively small and usually not justified by the increased management needs of introducing another level of
voltage and a new range of network equipment. Nonetheless, district chiefs do have the option of deciding
to use single-phase 4.16 kV for projects with very scattered households at the end of the grid.

247
8. A Continuing Tradition ofCost-reducing Technical Innovation
The successful adoption of the MALT system fostered an aggressive approach in STEG to cost-cutting technical
innovation. Throughout the 1980s and 1990s, technical and economic studies and pilot projects were
undertaken with a view to further reducing costs in the distribution system. These resulted in a number of
changes and cost savings, of which examples are given below, roughly in order of importance of cost
savings. Though the savings of any one innovation may be relatively modest, the cumulative effect is
considerable and testifies to the importance of a culture of “continuous improvement’ within STEG.
i. Aluminum alloy cheaper than copper wiring. From 1991, MV lines were constructed using
aluminum alloy (ASTER) wires rather than copper, after a study pointed out that international copper
prices continued to rise, and estimated the potential savings at DT500,000/year.
ii. Pin insulators cheaper than suspension chains. The introduction of pin insulators on MV lines
beginning in the 1990s reduced costs because with this design, the conductor is held higher on the
pole, so shorter supports can be used to achieve the same ground clearance. In the district of Kasserine,
for instance, savings of 20 percent for both single and three-phase lines were achieved compared to
lines with suspension chains.
iii. Cheaper, lighter poles. PAC poles have been gradually replaced with a new type of “round iron
poles’. The round iron pole is cheaper, much lighter and much less fragile than the equivalent in PAC.
Transportation of iron poles is much easier, especially for RE. The range of PAC poles has been
reduced to three classes of nine-meter poles, while 18 class and length combinations of round iron
poles are in the inventory.

248
SUB-SAHARAN AFRICA: INTRODUCING LOW-COST METHODS IN ELECTRICITY DISTRIBUTION NETWORKS
Table A 7.7: Types of Poles used in MV and LV Networks (m/daN)
Prestressed Armored Round Iron (m/daN)Concrete (PAC) in (m/daN)
9/150 8/150 8/500 9/180 9/500 10/180 10/500 10/1000
9/300 12/300 12/500 12/925 13/450 143/900 13/1700
9/600 13/3400 15/450 15/800 15/1600 15/3200
iv. Cheaper protections. Expensive LV circuit breakers at MV/LV substations were replaced with very
cheap yet adequate fuses.
v. Less expensive meters. Limiting three-phase meters to large consumers and increasing the power
phase meters.
vi. Pole fastenings. Backfilling around the pole with stone was adopted, rather than using cement
foundations for weak poles (8/150, 9/150 and 9/180 m/daN), to reduce line construction cost.
vii. Mixed medium- and low-voltage network. Use of MV network poles to carry part of the LV
network as under-built lines was done wherever possible, so that fewer LV poles are needed.

249
Efforts are made to reduce stock inventory by standardizing components where possible. An ongoing internal
standardization commission worked for many years part-time in STEG to improve the quality of service,
reduce losses in the network and research technical specifications for network materials that would be better
adapted to Tunisian environmental and climatic conditions. While the main emphasis here was on improving
the quality of service and inventory management, many of the changes adopted also contributed to reductions
in maintenance and management costs. The most important of the resulting changes in terms of cost
reductions were:
• Replacement of spark gap by lightning arresters, to better protect pole-mounted MV/LV substation
transformers and diminish the frequency of breakdowns in the transformers.
• Introduction of three-phase “Ynyn with 4 magnetic columns” transformers, the fourth column
serving to absorb imbalances in the two other phases caused by overheating of the transformer tank
in the original three-column star connection transformers.
• Development of a distribution system construction guide for use by the planning office in the
utility, work units and maintenance units, with state-of-the-art technical rules and guidelines for
construction.
Other standardization efforts that reduced costs included:
• Hot galvanization, to avoid corrosion, considerably prolonged the life of metal constituents of the
grid for a small additional cost.
• Installation of capacitor banks on MV branch lines and in large consumer substations, to increase
the power factor, reducing both voltage drops and the level of losses in the MV and LV network,
without having to reinforce the grid; this was accomplished through an educational campaign that
informed large consumers of the cost-effectiveness of purchasing the capacity banks, rather than
paying the penalties caused by their power factors falling below 0.8.
• Development of the in-house “Tanouir” software, adapted to the Tunisian MV network, for sizing
MV lines. This software considerably reduced the length of studies and permitted studying different
design variations for a specific agglomeration and choosing the least-cost solution.
9. Standardization of Equipmentand Procedures

250
SUB-SAHARAN AFRICA: INTRODUCING LOW-COST METHODS IN ELECTRICITY DISTRIBUTION NETWORKS
• Standardization of both pole-mounted and cabin MV/LV substations (structure, protection and
grounding).
• Coordination of protections (circuit breakers, reclosers and fuses) in a selectivity cascade, allowing
the automatic isolation of the affected line from the grid, and reducing considerably the undistributed
energy. With each grid extension or major modification in the operating diagram, the coordination of
protections must be restudied in order to guarantee the effectiveness of the selectivity cascade.

251
10. Conclusion
The MALT three-phase/single-phase distribution system has been outstandingly successful in permitting a
rapid expansion of RE in Tunisia. This system also provides a higher level of service by reducing the rate and
duration of power cuts. Though the switch to the MALT system was the single largest change introduced to
the Tunisian RE system by the Tunisian electric utility in this period, the record shows a continual process of
innovation and improvement in all aspects of the electricity system. The MALT experience was largely
responsible for unleashing this process. As the ADB wrote in 1995,
..the quality of the works and installations constructed since 1979 and the very good technical operating
results obtained are indicative of the level of expertise attained by the technical staff of the electricity
company (STEG) in the design, construction and operation of the medium voltage single-phase power
supply network.
The fact that Tunisian engineers implemented the MALT and solved its technical problems themselves, with
national engineering expertise and relatively little international input, gave utility staff increased confidence
to propose and implement other innovative cost-cutting solutions.
Although no studies have been done on the overall cost-effect of technical innovation in Tunisia, it is clear
that these cost reductions (including the MALT distribution system) have permitted a significantly greater
number of households to be electrified with the same budget. The MALT distribution system alone is estimated
to have saved 37 percent of costs compared to the conventional three-phase system.
Given the current Government priority concerns with employment, the main question at present is whether
the MALT system, while appropriate at the time, may now need to be adapted and reinforced to better
support rural industrial development. Investigation may be needed on whether a more aggressive consumer
education campaign on technical alternatives, or the introduction of other incentive measures to amortize
the costs of electrification of high power motors could play a role in encouraging needed rural industrial
development.

252
SUB-SAHARAN AFRICA: INTRODUCING LOW-COST METHODS IN ELECTRICITY DISTRIBUTION NETWORKS
Furthermore, as Tunisian RE approaches saturation, the question arises of how the considerable technical
expertise built up in STEG can be maintained and used. The success of MALT in Tunisia has attracted
attention elsewhere in Africa, and many countries (Senegal, Burkina, Niger, Comoros, Mali, Mauritania,
Yémen…) have sent technicians and/or staff for information and/or training to STEG to study the potential
in their countries. In Madagascar, STEG carried out a study for a pilot project, at the request of the Ministry
of Energy, and technicians from the utility have participated in STEG training courses. An evaluation by the
Nordic Consulting Group for the ADB in 1993 recommended the dissemination on a large scale of the
STEG experience, and further technical assistance by STEG to RE programs in Africa and elsewhere would
seem to be an interesting option to encourage through both bilateral and multilateral programs.
In fact, STEG participated as a consultant in several electrification studies for African countries like Chad
(Electrification Master Plan), Madagascar (assistance in two pilot projects: single-phase supply and SWER
supply techniques), Comoros (Electrification of 80 villages) and Senegal (Electrification of two rural
Departments: Tambacoundan and Kédougou).

253
11. References
African Development Bank, Rapport d’Evaluation du Projet d’Electrification Rurale (Electricite VI): Tunisie,
Departement par pays Region Nord, Fevrier 1999.
African Development Bank, Tunisie: Rapport d’Achevement, Projet d’Electrification Rurale, Electricite IV,
Departement Infrastructure et Industrie, Region Nord, Juin 1995.
Belkhiria, Hachemi: “Etude de l’alimentation des zones de pompage par un réseau basse tension à 3 fils et
2 niveaux de tension”, Juin 2001.
Belkhiria, Hachemi: “Etude d’un projet pilote pour l’électrification rurale en 4.16kV monophasé”, STEG,
Février 1996.
Berthier, Gregory: “Les politiques d’électrification de la Tunisie: Des dernières années du protectorat aux
premières années de l’indépendance 1952-1962,” Université Paris X-Nanterre, Département d’Histoire,
2000.
Chaib, Sawsen: Moncef Aissa et Ahmed Ounalli, Enquête sur l’impact socio-économique de l’électrification
rurale: Méthodologie et résultats, Annexe 1, Août 2001.
Essabaa, Hachemi: “Le systeme MALT: un système de distribution adapté,” Revue de l’Electricité et du Gaz
(REG) de la STEG, Décembre 1994.
Hicks, Jack, Inversin, Allen, Majdoub, Mounir and Solomon, Sayoum: Rural Electrification Evaluation Study
– Tunisia, November 1993, Prepared for the Ministry of Plan and Regional Development of the Government
of Tunisia by the National Rural Electric Cooperative Association, Washington, DC, at the request of USAID.
Masmoudi, Radhouane: “l’Electrification Rurale” Revue Tunisienne de l’Energie, N° 47, 4ième Trimestre
1997.

NRECA International, Reducing the Cost of Grid Extension for Rural Electrification, ESMAP, December
1999.
Organisation des Nations Unies pour l’Agriculture et l’Alimentation “Evaluation du Programme Rural Intégré
“PDRI)”, Rome, Juillet 1993.
STEG, Direction des Etudes et de la Planification “Statistiques Rétrospectives 1989-1999”, Octobre 2000.
STEG, “Rapports Annuels d’Activité: 1980-2003”.
STEG -Commission SWER “L’électrification rurale par la méthode SWER: rapport d’évaluation de l’expérience
tunisienne”, Décembre 1996.
World Bank, Tunisia: Country Brief, www.worldbank.org 8/30/01.
World Bank, Power Efficiency Study, ESMAP Report No. 136/91, February 1992.
INTRODUCING LOW-COST METHODS IN ELECTRICITY DISTRIBUTION NETWORKS IN SUB-SAHARAN AFRICA
254

To give an idea of the cost reduction, in present prices, due to using single-phase MALT lines compared to
conventional three-phase lines (European-type), a representative line was chosen from the rural network,
from among lines that had already been studied. The selected line has a length of 1.44 km in ASTER
54.6 mm², a typical section used in RE.
The methodology of study consists in using a MV line design software known as “Tanouir” to initially analyze
the costs of the line as a three-phase European-type (without neutral wire), and then to suppress two-phase
conductors and add a neutral wire in order to study the same 1.44 km line in MALT single-phase (one phase
+ one neutral). First, a suspended-type line is considered, and then the simulation is duplicated with a pin
insulator-type line. The comparison of both types also allows estimating the cost reduction per km resulting
from the introduction of the pin insulator technique.
The following table recapitulates the results of the study:
Suspension Pin Cost-cutting of PinChain Insulator Insulator Insulator/Suspension
Insulator
Cost of 1 km European-type MV 11,157 10,532 5.6%three-phase overhead line (in US$)
Cost of 1 km MALT-type MV 8,146 6,665 18.0%single-phase overhead line (in US$)
Percent cost saving for 1 km single-phase 27.0% 36.7%two-wire line/European-type three-wire line
The exchange rate is the current rate in Tunisia in the middle of September 2001, namely: $1 = 1.45
TND.
255
Appendix 7.1
An Example of Cost Reduction withthe MALT Distribution System, based on Actual
Prices used by STEG
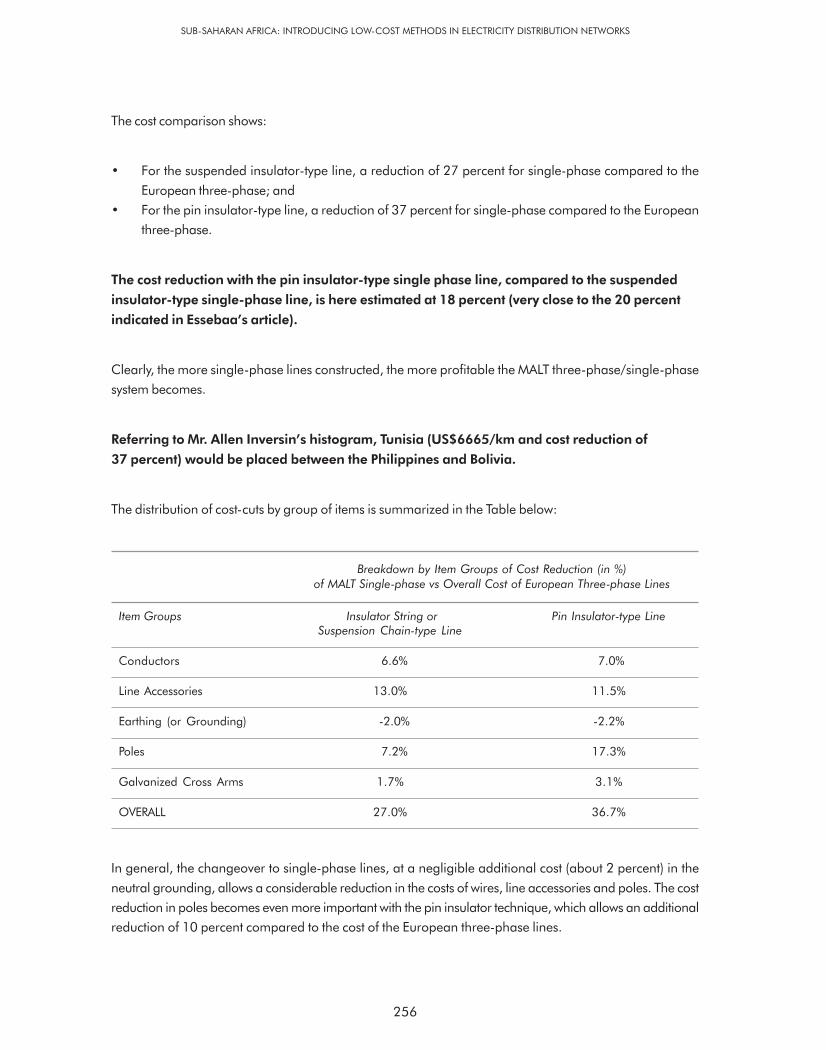
256
SUB-SAHARAN AFRICA: INTRODUCING LOW-COST METHODS IN ELECTRICITY DISTRIBUTION NETWORKS
The cost comparison shows:
• For the suspended insulator-type line, a reduction of 27 percent for single-phase compared to the
European three-phase; and
• For the pin insulator-type line, a reduction of 37 percent for single-phase compared to the European
three-phase.
The cost reduction with the pin insulator-type single phase line, compared to the suspended
insulator-type single-phase line, is here estimated at 18 percent (very close to the 20 percent
indicated in Essebaa’s article).
Clearly, the more single-phase lines constructed, the more profitable the MALT three-phase/single-phase
system becomes.
Referring to Mr. Allen Inversin’s histogram, Tunisia (US$6665/km and cost reduction of
37 percent) would be placed between the Philippines and Bolivia.
The distribution of cost-cuts by group of items is summarized in the Table below:
Breakdown by Item Groups of Cost Reduction (in %)of MALT Single-phase vs Overall Cost of European Three-phase Lines
Item Groups Insulator String or Pin Insulator-type LineSuspension Chain-type Line
Conductors 6.6% 7.0%
Line Accessories 13.0% 11.5%
Earthing (or Grounding) -2.0% -2.2%
Poles 7.2% 17.3%
Galvanized Cross Arms 1.7% 3.1%
OVERALL 27.0% 36.7%
In general, the changeover to single-phase lines, at a negligible additional cost (about 2 percent) in the
neutral grounding, allows a considerable reduction in the costs of wires, line accessories and poles. The cost
reduction in poles becomes even more important with the pin insulator technique, which allows an additional
reduction of 10 percent compared to the cost of the European three-phase lines.

257
It should be noted that these estimates are exact only for the particular line studied here. A line presenting
more slopes (due to uneven soil) or more curves will be more expensive. To estimate a valid average cost
for all of Tunisia, it would be necessary to study several dozens of lines, and for each of them, to perform
the same simulation as above. That would not only be time-consuming, but would still not give exact results,
since with the saturation of RE in Tunisia, the terrain and curves in the lines remaining to be constructed may
not be the same as in those already constructed, so costs may differ.
APPENDIX 7.1: AN EXAMPLE OF COST REDUCTION WITH THE MALT DISTRIBUTION SYSTEM, BASED ON ACTUAL PRICES USED BY STEG


Cost of Laying Fourth Neutral Wire
Overhead Line-type Wires Cross-section Cost/km % Over Cost
A Three-phase-three-wire Line Cross-section 3x54.6mm² Aster 20,826
B Three-phase-three-wire Line Cross-section 3x148.1mm² Aster 26,412
C MALT Three-phase-four-wire Line Cross-sections 3x148.1+1x54.6mm² Aster 28,836 C/B: 9%
D MALT Three-phase-four-wire Line Cross-section 4x54.6mm² Aster 24,502 D/A: 18%
E Cost of laying 4th wire 1x54.6mm² Aster 2,424to a 3x148.1 Aster line
F Cost of laying 4th wire 1x54.6mm² Aster 3,676to a 4x54.6 Aster line
3x54.6 and 4x54.6 mm² overhead lines are rarely used for RE, they are mainly used for small urban,
industrial or touristy areas
Comparison Between Three-phase Cut-out and Single-phase Fuse Cut-out
(FCFA)
Price (FCFA) Comparison
A One-phase Fuse cut-out 131,000
B Three-phase Overhead Switch 590,000 B/A: 4.5 times more expensive
259
Appendix 7.2
Cost Estimate in TD – 2003

Comparison Between Single-phase Transformer and Three-phase
Transformer having the same kVA Power
Transformer SACEM SACEM* Cost Réduction
Power One-phase Three-phase 1-Ph / 3-Ph
kVA TD TD %
10 1,100
15 1,200 2,575 53%
25 1,580 2,844 44%
50 2,500 3,512 29%
100 3,700 4,550 19%
150 4,400 5,827 24%
*SACEM is a Tunisian transformer manufacturer.
260
SUB-SAHARAN AFRICA: INTRODUCING LOW-COST METHODS IN ELECTRICITY DISTRIBUTION NETWORKS

At the Level of the Substation (Reciprocal Time Protection)
Main components of protection:
• Two maximum current relays with very reciprocal time/current curves for phase-to-phase short-circuits.
• One maximum current relays with very reciprocal time/current curves for phase-to-neutral
short-circuit (called slow neutral).
• One maximum current relays with extremely reciprocal time/current curves for protection against
phase-to-ground short-circuits to neutral short-circuit, faster than fuse melting (called fast neutral).
This protection is used in case of resistant short-circuit.
261
Typical Scheme of Protection Relays:
Appendix 7.3
MV Overhead Lines Protection

262
SUB-SAHARAN AFRICA: INTRODUCING LOW-COST METHODS IN ELECTRICITY DISTRIBUTION NETWORKS
Note: With a second circuit breaker installed in cascade with the first one in the same feeder, we have to use
a second protective device (a constant time maximum current zero sequence relay in order to insure
coordination between both protections).
Protection of single-phase lines (reciprocal time protection)
The cheapest way to protect single-phase branches is the use of fuse cut-outs in the beginning of the line. It
allows, with reasonable cost to:
• Eliminate outages occurring in the single-phase lines without cutting power to consumers. Power
should be supplied by other lines connected to the same feeder;
• Reduce operating cost since the branch line concerned by the outage is located and time of intervention;
• Number of consumers is limited to those supplied by the line in outage, and power cutting time is also
limited then the undistributed energy is not important; and
• For the protection of a single-phase line (phase-neutral) only one fuse cut-out is enough, there is no
need to protect neutral cause, it is grounded and is supposed to be having the potential of the ground.
Avec :F1 : FuseF2 : Fuse with lower current rate than F1D1 : Circuit breaker N°1Icc : Short circuit current (in Amperes)T1 : Response time (in seconds) of corresponding curve
Protections Working: (Case of Single-phase Short-circuit)
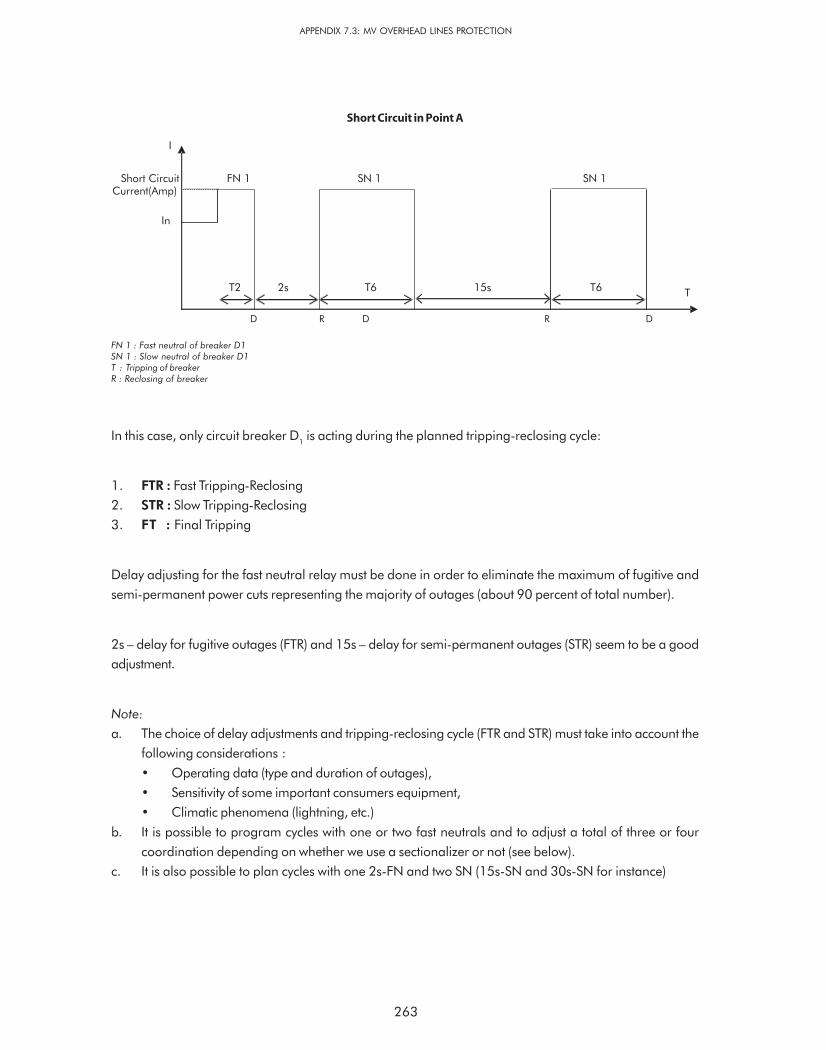
263
FN 1 : Fast neutral of breaker D1SN 1 : Slow neutral of breaker D1T : Tripping of breakerR : Reclosing of breaker
Short Circuit in Point A
In this case, only circuit breaker D1 is acting during the planned tripping-reclosing cycle:
1. FTR : Fast Tripping-Reclosing
2. STR : Slow Tripping-Reclosing
3. FT : Final Tripping
Delay adjusting for the fast neutral relay must be done in order to eliminate the maximum of fugitive and
semi-permanent power cuts representing the majority of outages (about 90 percent of total number).
2s – delay for fugitive outages (FTR) and 15s – delay for semi-permanent outages (STR) seem to be a good
adjustment.
Note:
a. The choice of delay adjustments and tripping-reclosing cycle (FTR and STR) must take into account the
following considerations :
• Operating data (type and duration of outages),
• Sensitivity of some important consumers equipment,
• Climatic phenomena (lightning, etc.)
b. It is possible to program cycles with one or two fast neutrals and to adjust a total of three or four
coordination depending on whether we use a sectionalizer or not (see below).
c. It is also possible to plan cycles with one 2s-FN and two SN (15s-SN and 30s-SN for instance)
APPENDIX 7.3: MV OVERHEAD LINES PROTECTION
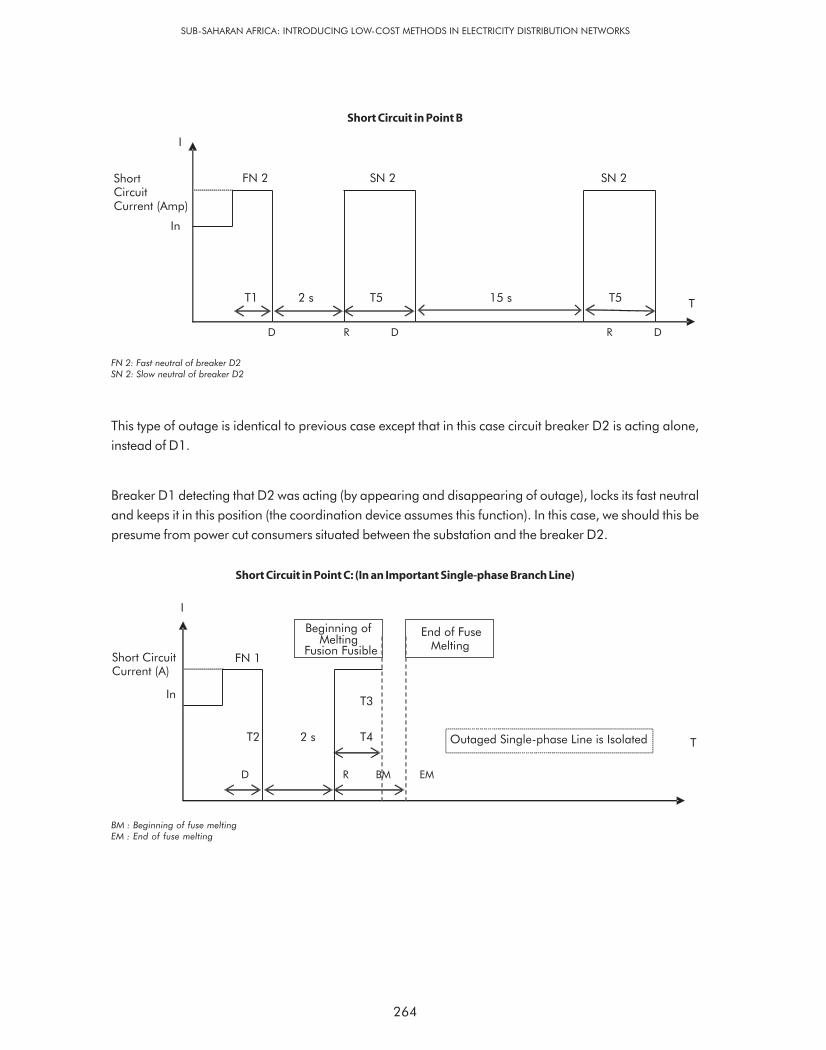
264
SUB-SAHARAN AFRICA: INTRODUCING LOW-COST METHODS IN ELECTRICITY DISTRIBUTION NETWORKS
FN 2: Fast neutral of breaker D2SN 2: Slow neutral of breaker D2
Short Circuit in Point B
This type of outage is identical to previous case except that in this case circuit breaker D2 is acting alone,
instead of D1.
Breaker D1 detecting that D2 was acting (by appearing and disappearing of outage), locks its fast neutral
and keeps it in this position (the coordination device assumes this function). In this case, we should this be
presume from power cut consumers situated between the substation and the breaker D2.
Short Circuit in Point C: (In an Important Single-phase Branch Line)
BM : Beginning of fuse meltingEM : End of fuse melting
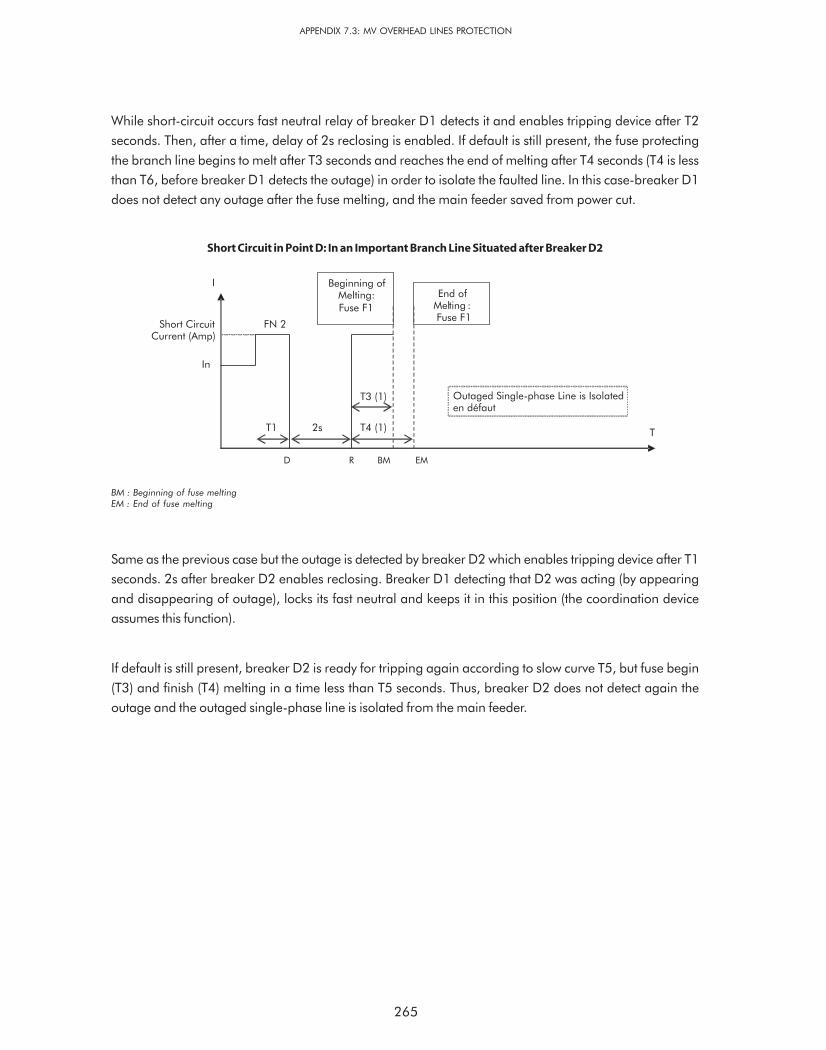
265
While short-circuit occurs fast neutral relay of breaker D1 detects it and enables tripping device after T2
seconds. Then, after a time, delay of 2s reclosing is enabled. If default is still present, the fuse protecting
the branch line begins to melt after T3 seconds and reaches the end of melting after T4 seconds (T4 is less
than T6, before breaker D1 detects the outage) in order to isolate the faulted line. In this case-breaker D1
does not detect any outage after the fuse melting, and the main feeder saved from power cut.
Same as the previous case but the outage is detected by breaker D2 which enables tripping device after T1
seconds. 2s after breaker D2 enables reclosing. Breaker D1 detecting that D2 was acting (by appearing
and disappearing of outage), locks its fast neutral and keeps it in this position (the coordination device
assumes this function).
If default is still present, breaker D2 is ready for tripping again according to slow curve T5, but fuse begin
(T3) and finish (T4) melting in a time less than T5 seconds. Thus, breaker D2 does not detect again the
outage and the outaged single-phase line is isolated from the main feeder.
Short Circuit in Point D: In an Important Branch Line Situated after Breaker D2
BM : Beginning of fuse meltingEM : End of fuse melting
APPENDIX 7.3: MV OVERHEAD LINES PROTECTION
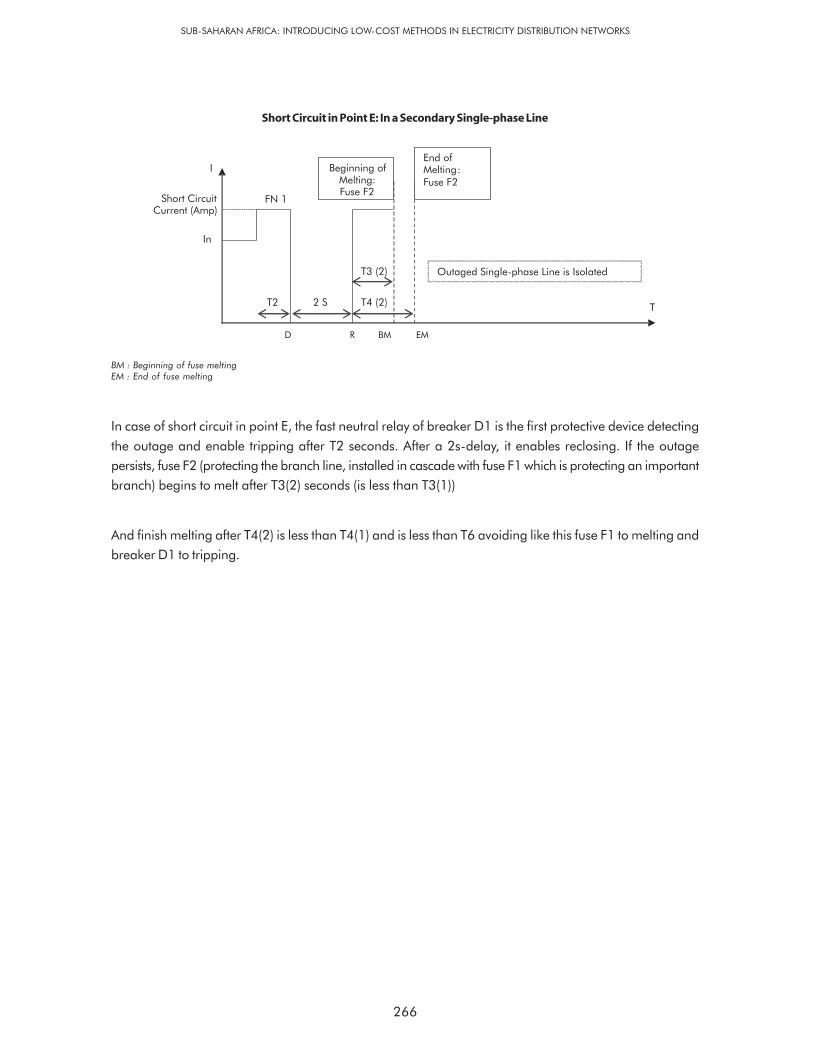
In case of short circuit in point E, the fast neutral relay of breaker D1 is the first protective device detecting
the outage and enable tripping after T2 seconds. After a 2s-delay, it enables reclosing. If the outage
persists, fuse F2 (protecting the branch line, installed in cascade with fuse F1 which is protecting an important
branch) begins to melt after T3(2) seconds (is less than T3(1))
And finish melting after T4(2) is less than T4(1) and is less than T6 avoiding like this fuse F1 to melting and
breaker D1 to tripping.
Short Circuit in Point E: In a Secondary Single-phase Line
BM : Beginning of fuse meltingEM : End of fuse melting
266
SUB-SAHARAN AFRICA: INTRODUCING LOW-COST METHODS IN ELECTRICITY DISTRIBUTION NETWORKS

The construction cost is probably the most important factor governing the choice of an electrification system
for rural areas.
The single-phase primary distribution system is cheaper than the three-phase system.
According to STEG experience Single-phase technique allowed savings of about 35 percent in MV lines and
17 percent in MV/LV overhead substations.
267
Appendix 7.4
SWER Technique

268
SUB-SAHARAN AFRICA: INTRODUCING LOW-COST METHODS IN ELECTRICITY DISTRIBUTION NETWORKS
Network Level Cost Reduction
Medium Voltage 30 to 40%
MV/LV Substations 15 to 20%
LV Network 5 to 10%
Overall 18 to 24%
SWER technique brings an additional cost reduction estimated by STEG at about 28 percent of MV lines.
SWER is the abbreviation of Single Wire Earth Return.
SWER lines utilize only one conductor and the earth to distribute power.
This technique was introduced in Tunisia by STEG in 1990 with a number of precautions and in a limited
fashion, lines were carefully constructed and monitored.
Phase-to-earth voltage = 17.32 kV
Wire cross-section : 54.6 mm² aluminum alloy. With smaller cross-section, additional savings are possible.
Features Contributing to Cost Reduction
• Saving of one overhead conductor
• Elimination of the cross arm
• Elimination of an insulator
• A pin insulator placed at the pole-top provides added ground clearance, allowing cost reduction with
longer spans or shorter poles
• Only one bushing
• The earth as a return conductor has negligible resistance, so that the losses and voltage drops associated
with the return conductor of an overhead line are substantially eliminated

269
APPENDIX 7.4: SWER TECHNIQUE
Disadvantages of SWER
SWER system usually requires
• More extensive earthing system (more expensive)
• More care to ensure that telecommunication lines are not affected
• Losses on SWER system can be up to 100 percent greater than those on a single-phase system similar
loads
• Particular care must be taken to maintain the conductibility of SWER earthing system to the general
mass of earth remains within specification
• Frequent monitoring earthing system and measuring earth resistance at the earthing points, especially
during the dry seasons.
The overhead SWER lines implemented as pilot projects at the end of 1996 were supplying:
• 425 rural villages through
– 1,180 km SWER overhead lines; and
– 1,200 MV/LV SWER substations.
Technical Aspects
The reliability and design of earthing system is critical to the safety and success of SWER distribution
systems.
Failure of a SWER earthing system presents a serious safety hazard. Voltage potentials due to load currents
will create hazards to people and livestock living in the vicinity of the earthing system as it may ignite timber
poles or nearby dry vegetation.
Not only must the SWER earthing system conduct current of occasional outages but it must reliably conduct
the continuous load current as well.
Soil resistivity determine the complexity and cost of the earthing systems.
The seasonal variation of soil resistivities should be considered when designing the SWER earthing systems.
An earthing system carrying load current is subject to resistance loss and this results in heating and consequent
drying of the soil adjacent to the earth electrodes.

This factor determines the style and minimum size of a SWER earthing system, particularly in drought-prone
areas.
SWER distribution may not be an economical choice in areas with high soil resistivities.
For safety reasons, the voltage drop on the earth system must not exceed 25 V (Tunisian standard).
Earthing maximum resistance was fixed at 3 ohms for a maximum current of 8 Amps, which is equivalent
to 140 kW at a maximum load of 17.32 kV.
V=RI = 3*8=24 V
R (Ohm) 3 4 5 10 15 20 25 30 35 40
I max (Amp.) 8 6 5 2.5 1.7 1.25 1 0.8 0.7 0.6
P (kW) 138.5 104 87 43 29 22 17 14 12 10
SWER lines must be compulsorily connected to a line with effectively earthed neutral (4-wire or 2-wire
lines). This is not a constraint since all the overhead system is equipped with earthed neutral wire.
Isolating substation is not required.
District chiefs have the latitude to decide whether to use SWER in specific RE projects.
270
SUB-SAHARAN AFRICA: INTRODUCING LOW-COST METHODS IN ELECTRICITY DISTRIBUTION NETWORKS

Jabesh Amissah-Arthur
Annex 8
National Electrification ExperiencesGhana: 1985-2004


Preamble
This paper has been prepared at the request of the World Bank as part of a project for the mainstreaming
of innovations and experiences in national electrification in support of the goal of advancing electrification
in Zambia, Tanzania, Mozambique and Uganda.
The principal objective of the project, however, is to reduce the high costs of RE in sub-Saharan Africa by
mainstreaming proven, innovative low-cost methods and techniques in the design, construction and
management of electricity networks.
The level of RE in sub-Saharan Africa is very low, with less than 10 percent of households having access to
electricity. One of the key barriers to accelerating RE is the high cost of connections typically associated with
outdated standards, unsuitable design and planning methods and less appropriate methodologies. However,
a number of countries have successfully applied new and innovative methods to lower costs for RE, but only
a few in Africa (e.g., Tunisia, Ghana and South Africa). It is, therefore, desired to leverage the relevant
experiences of these countries.
The paper sets out the program for electrification in Ghana, the starting conditions, the progress, the
present status, lessons learned, successes and failures, then makes recommendations based on how
“low-cost” techniques have contributed to the program and its success especially as regards RE.
Background
Ghana’s power sector is dominated by three state-owned operating utilities; the Electricity Company of
Ghana (ECG), the Volta River Authority, (VRA) and its division the Northern Electricity Department (NED).
These three were the only operating entities in the sector until the Takoradi International Company (TICo),
an Independent power producer (IPP) started commercial operations in 2000. The VRA was the statutory
1. Introduction
273

274
SUB-SAHARAN AFRICA: INTRODUCING LOW-COST METHODS IN ELECTRICITY DISTRIBUTION NETWORKS
body which operated the transmission network as well as the hydroelectric generating plants. The responsibility
for the distribution of electricity was shared between ECG, which had the six southern-most regions, and
NED, which catered to the four regions in the northern parts of the country.
Generation Facilities: Electricity supplies to the many prominent towns in Ghana were being provided from
isolated diesel generation plants prior to the commencement of the Volta River Development Project which
created the Volta Lake and also culminated in the commissioning of the large Akosombo Hydroelectric Plant
in the mid-1960s. Power generation in Ghana, since then has been substantially dependent on Lake Volta.
The isolated diesel stations, which were serving the many towns not connected to the grid, had seen little
maintenance or no capital injection. They had, thus, become either grossly inadequate to meet the growing
demands or fell into disrepair and were decommissioned. By 1985, therefore, there was virtually no
generation of electricity in the country beside that obtained from the hydroelectric plants on the Volta.
The Volta Lake feeds two hydroelectric facilities that together produce the bulk of electric energy on Ghana’s
power grid. The two hydroelectric plants have a total capacity of 1,180 MW and are owned and operated
by the VRA. Until 1997, these two hydroelectric plants had been adequate to meet the country’s electricity
demands from year to year except for two periods of extreme drought in 1983/1984 and 1995/1996.
The low cost of power from the large hydro plants have enabled power tariffs in Ghana to remain historically
low.
The only non-hydro generating facility, the Takoradi Thermal Plant, was planned as a crude oil-fired 660 MW
development to supplement the hydroelectric production from the mid-1990s, and was constructed in two
blocks. The first 330 MW combined cycle block, which is wholly owned and operated by the VRA, started
commercial operations in 1998. The second 330 MW block (220 MW of which was completed in the year
2000) is owned and operated by the IPP called TICo, which is a joint venture IPP owned 10 percent by VRA
and 90 percent by CMS Energy Corporation. TICo’s 220 MW plant is currently the only non-state-owned
power facility in Ghana.
Transmission System: Concurrent with the damming of the Volta River at Akosombo and erection of the
hydroelectric plant in 1965, was the construction of a 161kV transmission grid. The HV transmission system
in Ghana is also owned and operated by the VRA. It provided bulk electricity from the large hydroelectric
generators to only five out of the nine administrative regions of Ghana which were all in the southern-most
one-third of the country. The limited reach of the national transmission grid was to remain essentially
unchanged from the mid-1960s to the mid-1980s. Network extensions carried out subsequently have,
however, ensured that the network serves every region of the country. The network currently comprises
some 39 transformer substations and about 4,000km of 161 kV transmission lines.
Distribution System: The ECG and the NED a wholly-owned subsidiary of the VRA, are the only two distribution
utilities in the country. They operate 8,000 km of sub-transmission lines and 30,000 km of distribution
networks.

275
Regulatory arrangements: From the mid-1980s until 1997, the Ministry of Energy in Ghana formulated a
policy and also exercised regulatory power. In 1997, however, the Government of Ghana (GoG) enacted
two critical laws that initiated the reform of the power sector by creating two new regulatory agencies: the
Public Utilities Regulatory Commission (PURC) for independent commercial regulation; primarily rate-setting,
and the Energy Commission (EC) for technical regulation, licensing and policy advice. The Ministry of
Energy has retained responsibility for the formulation of energy policy even as the EC is required to provide
policy advice.
Responsibility for National Electrification: The current institutional arrangements in Ghana do not place the
responsibility for the pursuit and implementation of electrification initiatives with any particular entity. In
addition to its policy formulation role, therefore, the Ministry of Energy manages the National Electrification
Program and also plays the role of the implementation agency, procuring material, selecting contractors
and awarding electrification contracts.
ANNEX 8: INTRODUCTION


The conditions at the start of Ghana’s electrification drive were dire. Only five out of the 10 regional
capitals were being supplied from the national grid and a total of only about 250 towns had electricity supply
in Ghana.
2. Starting Conditions
277
Figure A 8.1: Ghana Grid – 1985

278
SUB-SAHARAN AFRICA: INTRODUCING LOW-COST METHODS IN ELECTRICITY DISTRIBUTION NETWORKS
Table A 8.1: Ghana Particulars
*At Start of Study Period, 1985
Number of Regions 9
Number of Districts 110
Number of “Large” Towns (ie. Population >5,000) 202
Number of “Small” Towns (ie., 500< Population <5,000) 4,000
Total Population 12.3m
*Current Particulars, as of 2004
Number of Regions 10
Number of Districts 138
Number of “Large” Towns (ie., Population >5,000) 364
Number of “Small” Towns (ie., 500< Population <5,000) 5,900
Total Population 18.9m
Data Source: Ghana Statistical Service.
As shown by Figure A 8.1, two-thirds of Ghana’s land mass did not have access to the infrastructure for grid
supply as at the start-off of the electrification drive in 1985. Meanwhile, virtually all the isolated
diesel-generating plants in the off-grid locations, predominantly in the north of the country, were not
operational. Data from the 1984 Census indicated that the percentage of the Ghanaian households with
access to electricity service stood at around 23 percent. Access to electricity in Ghana at the start of the
electrification drive could, therefore, be summarized as follows: “Either you had supply from the grid or you
had no supply at all”.

279
What was to become the national electrification drive in Ghana started in 1985 with the preparation of a
project by VRA to extend the 161 kV National Grid northwards to reach all the administrative regions of
Ghana under a project called the Northern Electrification and System Reinforcement Project (NESRP).
The challenges faced by the NESRP project were many. The project which was to cost about US$150 million
was being conceived at a time when the country was yet to recover from its worst economic downturn.
Furthermore, the project area included some of the most economically depressed regions of Ghana. It was,
therefore, doubtful that at the micro economic level, the beneficiaries could pay for the service or that the
project would be viable. These conditions created substantial justification problems for the project. Added to
these financial and economic viability concerns were significant technical/design viability and operational
stability questions regarding the very long (about 600 km) and lightly loaded (16 MW) radial line required
to serve three regional capitals and their surrounding communities.
The VRA completed the definition of the project and obtained financial support for the first phase from ADB
in 1987. Thereafter, several other multilateral agencies joined in quick succession to provide support to the
entire scope of NESRP.
Implementation of the NESRP project was successful beyond the imagination of those who conceived it in
every respect: financial, technical and social. Within three years of project commencement, electricity all
the remaining regional capitals was supplied from the national grid except for the Upper West regional
capital in the north-western corner of the country which was being supplied from a newly-built diesel station.
The construction, commissioning and testing of the 600 kms of HV(161 kV) lines and associated substations
had been completed within budget and ahead of schedule. As a result of the completion of this project, the
general sense of well-being amongst the residents of the project areas had evidently risen sharply and the
economic empowerment of the newly supplied towns had transformed the towns within a short period of
time.
The impact of the achievement of the NESRP objective by the VRA spurred the political leadership of the
country to commission consultants to prepare a plan called the National Electrification Scheme (NES) which
was subsequently issued in 1990. The ambitious goal of the NES was to provide, within a 30-year timeframe,
electricity access to all settlements which, according to the 1984 Census, had an adult population greater
3. The Electrification Drive

280
SUB-SAHARAN AFRICA: INTRODUCING LOW-COST METHODS IN ELECTRICITY DISTRIBUTION NETWORKS
than 500. These settlements numbered about 4,200 and were a far cry from the 400-odd towns that had
supply at the release of the NES planning document in 1990.
The overall goal or target of the NES was pursued through various implementation vehicles and numerous
otherwise discrete electrification projects. Prominent amongst these were: the Northern Electrification Project
which covered four of the hitherto unconnected regions of Brong-Ahafo, Northern, Upper-East and Upper-
West; the Regional Electrification Projects for each of the six other regions and the Self-Help Electrification
Project (SHEP) which has turned out to be probably the most significant as regards its contribution to the
number of communities (about 1,800) connected to the national grid.
GoG, in line with the Economic Recovery Program (ERP), had developed the NES in 1989 with the goal that
electricity supply will reach all parts of the country over a 30-year period from 1990-2020.
Under the unfunded NES plan, many more communities qualified for supply than could be realistically
undertaken within what was considered to be a reasonable period. For ease of implementation, the
implementation plan was made up of six phases of five years each spanning a 30-year period. The frustration
for many communities, especially the smaller ones, was that they were further down the priority ladder than
they had wished.
This comparisons between communities kindled some kind of competition amongst neighboring communities
that caused a flood of requests for earlier connection. Not surprisingly, the relative placement of communities
in the schedule also generated unhealthy tensions. Intense lobbying by communities and their representatives
for priority attention became a major difficulty for public officials managing the NEP which was the
open-ended program borne out of the NES.
The SHEP was a nationwide scheme that was introduced as a policy framework under which “impatient”
communities could advance their electrification projects ahead of the dates indicated in the NEP by meeting
agreed criteria for community contributions to the project implementation. The SHEP undertaking was to get
connected to the national grid, ahead of their respective scheduled dates for connection under the NES
plan, any communities that: i) were within 20 km of an existing 33kV or 11KV network; ii) had procured LV
poles for the network within the community; and iii) had a certain minimum number of premises wired and
ready to receive power. The government’s obligation was to provide the conductors, transformers, pole-top
and other materials and assume responsibility for the construction works required to have the connection
effected.
Many communities have met the three requirements and have been connected. The connection fee for
individual consumers has also capped at a concessionary rate in order to enable the less affluent to also
obtain supply.

281
The most significant accomplishment in the first five years of the electrification drive was the extension of the
161 kV backbone of the national grid to cover virtually the entire land mass of Ghana and the connection
of the regional capitals to the national grid. By 1990, therefore, the source of electricity supply for all the
regional capitals except the one8 which was in the north western-most corner of the country was from the
national supply grid. About 150 communities were also connected in the first five-year period to 1990.
The focus of the second five-year period was the connection to the national grid of the majority of the district
capitals i.e., 87 out of 110 as well as those lucky communities that were reasonably close to the existing
infrastructure and did not require much additional work to connect them. The total number of communities
connected during this period was about six hundred (600).
In the next five-year period to 2000, the HV grid was further extended to consolidate its coverage and all
the district capitals had electricity supply from the national grid. The total number of communities with supply
from the national grid by the year 2000 had also risen to about 2,350. The progress of the electrification
from 1985 is given by the Table A 8.2.
Table A 8.2 : Progress of Electrification 1985-2005
No of Number of Settlements with Grid Electricity No of
Settlements At Start Expected Settlements
1984 Census 1985 1990 1995 2000 2005 2000 Census
# of Regional Capitals 10 5 9 9 10 10 10
# of District Capitals 110 36 46 87 110 138 138
Other “Towns” 4,055 200 354 934 2,231 3,041 5,752
(ie., Population >500)
Total 4,175 241 409 1,030 2,351 3,189 5,900
4. Progress and Accomplishments
8 Wa, the capital of the Upper-West region, was served by a new diesel station from 1990 until the grid was extended to supply it with bulk powerin 1997.
282
SUB-SAHARAN AFRICA: INTRODUCING LOW-COST METHODS IN ELECTRICITY DISTRIBUTION NETWORKS
The achievements of the electrification drive, i.e., connecting 2,350 communities just 10 years after the
launch of the NES plan, were impressive when compared to the initial 30-year target of 4,200 communities.
That would have been 56 percent of the long-term target number of communities. This accomplishment
was, however, diminished by population growth and demographic changes. The national Census of year
2000 showed that the number of towns with population exceeding 500 had increased from 4,200 to about
5,900 so the accomplishment was 40 percent. The year 2000 Census also indicated that the percentage of
households in Ghana that were supplied from the national grid was 43.7 percent.
The history of Ghana’s electrification progress will be incomplete without giving a special place of pride to
the SHEP. The number of communities provided with electricity under SHEP has grown steadily since its
inception. The advancement of electrification from year 2000 to 2004 has been primarily through the
continued realization of the SHEP scheme. Its contribution to the number of new communities supplied now
dominates and is about 50 percent of the total.
Renewable Energy Technologies (RETs) have unfortunately not played much of a role far in improving
access to electricity in Ghana. There appears to be several contributory factors for this situation. Firstly, the
propaganda to obtain public support for the development of the Volta River Project in the early 1960s left
the lasting impression that it would bring cheap electricity to Ghana which all citizens could share for a very
long time. Non-supply from the national grid has, therefore, been viewed by the populace, and particularly
the un-served communities, as being denied their share of the “national cake.”
Secondly, regulatory policies and practices together with Government subsidies for grid supply had exacerbated
the inherent difference in cost between grid and renewable energy supplies. What this meant for the
consumer was that the cost of electricity service was substantially higher when provided from RE sources
than when obtained from the grid.
Finally, the history of unreliable supply from isolated diesel systems recounted earlier has left a permanent
perception amongst Ghanaians that, in the long run, the only reliable, good quality and sustainable source
of electricity supply for any Ghanaian community is the national grid. For these reasons, residents have
tended to spurn efforts to be provided electricity services from off-grid RETs.
The limited impact of RET has, to a large extent, also been due to distortions created by a failure of the
electricity subsidy policy. A considerable “lifeline” subsidy has been provided within the regulated tariff
structure for low-income consumers of grid power. There, is however, no corresponding subsidy for those
supplied from renewable energy sources. The unfairness of this structure is that residents of isolated and
rural settlements who have accepted renewable energy systems are denied a subsidy that they would have
received if they had been resident in a grid-connected settlement. Renewable energy supplies have, therefore,
tended to be relatively more expensive and this is especially ironic where the renewable energy systems are
meant for the poor in isolated rural communities as is often the case. Not surprisingly, communities have
shown an undeniable preference for supply from the national grid. In the East Mamprusi district, for example,
communities that had previously accepted supply from quasi-private energy providers, using Solar-PV
systems, have demanded their removal and replacement with supply from the national grid.

283
In Ghana, Low-Cost Technology (LCT) contributions have been employed with variable success both in the
infrastructure development stage as well as in the O&M phase of the distribution network. Some of the LCTs
discussed in this paper were introduced during central planning, yet, others evolved as what worked best in
the field or was most cost-effective for operators and contractors engaged in implementing the infrastructure
projects. No further distinction is, however, necessary between these since they have all advanced and
improved the sustenance of the electrification drive of the country and provided their own practical lessons.
Development Stage LCTs
The initial obstacles facing the extension of electricity to the unserved larger part of Ghana were both
technical and financial. The technical challenge was to find a viable design for supplying electricity over
very long-lightly-loaded HV lines. This technical problem of voltage control was, however, soon solved by a
group of engineering minds led by Professor Francesco Iliceto from the Rome University. The second
obstacle lay in finding the large financial resources for constructing the infrastructure needed to provide the
service. This financial obstacle was again reduced in magnitude by the innovative propositions of the technical
team during the planning, definition and design of the grid extension project and, then again, later during
the construction phase. Two of these, the Shield Wire Scheme (SWS) and the Labor-intensive Pole Erection
Technique, are worthy of note.
Shield wire scheme
The most noteworthy LCT innovation in the electrification of Ghana has been the SWS. The concept of the
SWS utilizes the shield wire of the HV transmission line to deliver power in addition to its customary protective
purpose of shielding the main power lines from lightning strikes. The dual use of the shield wire eliminates
the need to construct separate sub-transmission lines or step-down substations in order to serve communities
living near the transmission line route. Using this scheme, these communities which would, otherwise, not
have been supplied because the two standard options for supplying them: i) building a 161 kV step-down
substation to supply the small load; or, ii) building a very long 34 kV line from the source to serve the
community were both considered prohibitively expensive, could now be served at a minimal cost. The
5. Contribution of Low-costTechnologies
284
SUB-SAHARAN AFRICA: INTRODUCING LOW-COST METHODS IN ELECTRICITY DISTRIBUTION NETWORKS
saving of about 85 percent in the cost of sub-transmission infrastructure remains the primary advantage of
SWS over conventional supply.
The technical viability of SWS had been proven in the field in 1985 under an experimental pilot scheme
implemented on a short section of VRA’s 161 kV transmission grid. Subsequently, the engineering design
team considering Ghana’s Northern Electrification and System Reinforcement Project in the mid-1980s,
proposed the first commercial deployment of SWS. This project was particularly suited for the deployment
of SWS. This was because the 500+ km line under consideration would traverse sparsely populated
countryside to reach its target which was three regional capitals in the northern two-thirds of Ghana. The
transmission system was, therefore, bound to have very long distances of about 200 km between substations.
It was anticipated that the cost of serving the 30 or more small towns and villages along the line route would
be prohibitive if the conventional sub-transmission design was used. SWS was the best option for delivering
power to these small rural communities along the line route.
Pole erection technique
The 415 V distribution system within communities was designed to be constructed with wood poles which
were available locally and were relatively cheaper. The selection of contractors for the early township
electrification works was by international competitive bidding. Most of this work ended up being awarded to
foreign construction companies. These contractors initially employed mechanical augers and pole-planting
machines and substantially mechanized the erection of wooden poles for the 415V distribution lines within
the towns. The equipment could dig the hole, raise and erect the pole as well as assist in backfilling.
Although the erection works proceeded expeditiously, there were the challenges of maintaining such equipment
in the rural setting and the high cost of these equipment which remained a concern.
In subsequent phases of the electrification, contractors were found to have discarded the use of mechanized
equipment for the planting of poles in favor of labor-intensive methods. Local labor was employed for the
digging of the hole, the transportation of the wood poles from local stockpiles as well as the erection and
backfilling of the pole. It is logical to infer that savings are being made by the contractor, else they would
have no reason to employ these method. There is, nevertheless, insufficient data to confirm the magnitude
of any such benefits.
The obvious benefits from this technique would appear at the first instance, to accrue to the contractor and
the local labor, who may otherwise not have received the additional income. However, one can expect that
part of any savings from the employment of this techniques are likely to be passed on through the competitive
bidding process to the owner in the form of a lower quoted cost for similar works. Accordingly, although the
use of labor-intensive techniques is not a design innovation whose benefit can be quantified and anticipated,
its wide acceptance in the construction industry can only have the potential effect of reducing the cost of
distribution network construction.

285
Operation and Maintenance of LCTs
The challenges for providing sustainable electricity service do not end after surmounting the primary obstacle
of finding investment resources for the construction of the electricity infrastructure but continue during the
O&M phase. The next challenges after the construction phase in Ghana were also financial in nature.
These included the need to progressively reduce the proportion of revenue that was being expended for the
O&M of the service. The two activities for which some amelioration of costs have been sought are the
provision of consumer metering and billing services and the collection of revenues. Innovations in this
respect include the introduction of load limiters in place of regular credit or prepaid meters and the use of
bonded cashiers in small communities for the receipt of payments instead of the normal practice of engaging
permanent utility employees for each community.
Load limiters
The electricity tariff structure in Ghana, like that of many other developing countries, incorporates a “lifeline”
tariff that is supposed to cater to the disadvantaged groups in society by stipulating a subsidized charge or
tariff for low quantity consumers. The cost of energy meters for consumers in the “lifeline” category tends
to be a significant element in the cost build-up for the service provider and a substantial proportion of the
revenue received from such consumers.
In Ghana, the “lifeline” threshold has been set at 50 kWh per month so that the regulator-approved
“lifeline” charge for all users consuming less than the threshold is cedis 18,000 (equivalent to about
US$2.00). An analysis of the regional consumption pattern indicates that for the less economically endowed
regions of Ghana, such as Volta, Brong-Ahafo, Northern, Upper-East and Upper-West, about 40 percent of
the utility’s consumers fall, within this category. The challenge posed by this statistic is that the below-cost
rate received from the lifeline consumer does not cover the cost of the energy purchased and provided to
him by the utility, much less cover the cost of the meter installation, monthly meter reading, bill processing,
printing and submission. In short, the magnitude of consumption expected from these users does not justify
the installation and operation of an energy meter.
In response to this dilemma, the utilities have sought to install the load limiter which costs about US$15 in
place of the regular energy meter at a cost of about US$35 per. The load limiter interrupts the supply of
electricity to the consumer if he draws too much power at any one time but does not measure the quantity
of energy used. Three standard rated load limiters are available and are selected for application according
to the needs and usage pattern of the consumer. The consumer is then charged the block or fixed charge at
the end of each billing period commensurate with the rating of the installed load limiter.
The arrangement is intended to reduce the installation cost for the utility as described above and also
eliminate the costs associated with monthly meter reading and bill processing. Ghana’s experience in
respect of the load limiter initiative has, however, not lived up to the full potential because the cost of the
load limiters were not as low as expected.
ANNEX 8: CONTRIBUTION OF LOW-COST TECHNOLOGIES

286
SUB-SAHARAN AFRICA: INTRODUCING LOW-COST METHODS IN ELECTRICITY DISTRIBUTION NETWORKS
Bonded cashiers
The traditional revenue collection arrangement for the power utility in Ghana has been to employ an
accounting-type clerk who will be accommodated in a suitable office with a cash register and other office
equipment to receive payments from consumers.
Usually these clerks would then lodge the money received in a bank account at the end of the day or other
such regular interval.
In providing electricity services in the many small towns in the sparsely populated northern parts of Ghana,
it soon became evident that the traditional model for bill collection or revenue mobilization would not be
suitable. The first problem observed was the long periods during which the receiving clerk sat idle because
no payments were being made. This was partly because the income of these consumers was seasonal and
linked to the predominant economic activity of these communities which was farming. More importantly,
however, the arrangement was not suitable because the consumer base was too small for a full-time
receiving clerk. The net result for the utility was that the costs associated with receiving payments could often
be more than 50 percent of the amount collected.
The innovation that was introduced was to designate as bonded cashiers – individuals within each community
who typically were running a trading outlet or engaged in some other such enterprise to receive monies on
behalf of the utility for a commission. The utility thus avoided the cost of having to employing its own
collectors and providing them with accommodation and office equipment.

287
As a result of the many years of electrification efforts, the primary backbone for the delivery of grid
electricity is in place and most of the currently unserved communities are now within reach (i.e., about
30 km) of some electricity infrastructure suitable for interconnection to the national grid. The state of the
national high voltage grid in Ghana is as presented in the Figure A 8.2.
6. Present Situation
Figure A 8.2: Ghana Grid – 2000

288
SUB-SAHARAN AFRICA: INTRODUCING LOW-COST METHODS IN ELECTRICITY DISTRIBUTION NETWORKS
The number of communities with electricity supply will have risen eight-fold from about 400 in 1990 to
about 3,200 in 2005. The accomplishment of the national electrification drive, as measured against the
planned target, is as demonstrated in Figure A 8.3.
A recent survey has indicated that about 50 percent of households in Ghana now have electricity supplied
from the national grid.
Figure A 8.3: Ghana’s National Electrification Program: Status
289
Extension of National Grid
The extension of the HV grid has essentially been sufficiently advanced that the backbone for universal grid
supply in Ghana is now in place. The electrification challenge has, therefore, shifted from the highly visible
development of major power infrastructure which is characterized by large capital projects to smaller less
visible community electrification and productive use initiatives.
Connection of Communities
The number of communities connected over the five-year windows of the NES has been as high as 1,300.
The average size of the communities being connected to the grid has been reducing as the drive advances
making connections progressively easier. It is, therefore, estimated that a connection rate of about 1,500
communities every five years should be sustainable.
A projection of the data on electrification accomplishments; i.e., the number of communities or settlements
connected over the period, as compared to the lofty goals of the NES; i.e., to connect all settlements with
population greater than 500 within 30 years, is shown in Figure A 8.4.
7. Successes and Failures

290
SUB-SAHARAN AFRICA: INTRODUCING LOW-COST METHODS IN ELECTRICITY DISTRIBUTION NETWORKS
Figure A 8.4 shows clearly that Ghana’s goal of providing electricity service to all settlements with population
greater than 500 by 2020 is achievable if the current pace of community connections that has been
realized over the past 10 years (about 1,000 communities every five years) is maintained for the next 15
years at a slightly augmented level. The program for connection of communities to the national grid can,
therefore, be said to have been successful.
Electricity Access for Individuals
A subsidized connection charge has helped many low-income families get connected in the first instance. A
low block charge “lifeline tariff” to make electricity affordable for small consumers or the poor, has also
been in existence in Ghana for as long as can be remembered. The subsidized lifeline tariff has also been
successful in helping more people, especially the poor, stay connected.
In spite of the “lifeline” tariff, a significant number of consumers especially in newly connected rural
communities, have still been unable to pay their bills and maintain their supply. Utility managers have
reported that in a few villages, large numbers of consumers have not sought reconnection after being
disconnected for non-payment of bills. The situation is reported to be so severe that only the chief’s palace
and a few other houses have supply. Although these are extreme cases, they adequately demonstrate that
there is a financial obstacle to certain individual households sustaining their access.
Figure A 8.4: Ghana’s National Electrification Program: Projection to 2020

291
The SHEP mechanism described earlier has been very effective in providing communities with a means for
expediting the extension of grid power to serve them and meet their aspirations. By requiring communities
to first demonstrate in tangible terms their commitment and desire for electricity services, the scheme has at
the same time provided public officials with a convenient means for phasing the implementation without
having to undertake the unpleasant and contentious duty of determining electrification priorities amongst the
towns. It is certain that in the absence of this SHEP mechanism, there would have been a flood of requests
for electrification. This would have presented selection difficulties because of the complex local sensitivities
and the non-availability of acceptable and objective criteria for determining such relative priorities amongst
community groupings.
An unfortunate and unfair perception of the SHEP scheme could be that the rural poor have to bear the cost
of poles from their own resources, whilst residents of urban communities do not have to contribute anything
for their supply. The rural poor may thus be viewed as being penalized for living outside the urban centers.
This is, however, not quite so given the unofficial practice in the presently connected areas. The common
practice in these areas has been for those desiring supply to contribute towards the extension of the network
to their premises. There may, therefore, be little difference in the approaches except that the SHEP mechanism
is officially recognized whilst the other is not. Some way needs to be found to regularize the practices and
ensure that no perception of the imbalance is created.
Productive Usage and Affordability do Affect the Sustainability of Access
The extension of the grid to poor communities has not brought an end to one part of the problem of access.
Some consumers however, have difficulty paying for and retaining the service once connected. As mentioned
earlier, it has come to light in discussion with commercial managers of the distribution companies that there
are some villages where the majority of consumers have been disconnected for non-payment leaving in
extreme cases only the chief’s palace with supply. This could in part be explained by the general unwillingness
of consumers to pay for service based on the notion amongst a large section of Ghanaian society that such
utility services must be free or at least heavily subsidized. The issue could also be viewed more as an issue
of an inability-to-pay because there is no productive use for the service or that there is insufficient household
income. Whatever the explanation, the lesson from the Ghana experience may be that affordability of the
8. Lessons Learnt

292
SUB-SAHARAN AFRICA: INTRODUCING LOW-COST METHODS IN ELECTRICITY DISTRIBUTION NETWORKS
rates for service can have a significant effect on the advancement of true access for the individuals within
the nation.
Structuring a Sustainable “Lifeline Tariff”
The structure of a “lifeline tariff” in Ghana has, over the years, had to be revised a few times in order for
it to maintain its relevance by addressing some unintended burdens, side-effects and complications. An
obvious “technical flaw” in the initial structure was that the subsidy was not targeted and every consumer
enjoyed it. That is the first 100 kWh of every consumer’s consumption was billed at the “lifeline” rate. As a
result, the proportion of energy sales that enjoyed the subsidy was very large and the burden of funding the
subsidy fell disproportionately on industrial consumers and a few high residential consumers. This “flaw”
was later corrected by applying the “lifeline” rate to only those consumers whose total consumption for the
month fell below the threshold.
The second lesson was with regard to the threshold kWh level for the “lifeline tariff”. The profile of residential
usage by region indicates that when the threshold level is set at 100 kWh as was initially the case, then as
shown in Figure A 8.5, about 40 percent of residential consumers qualify for the subsidy.
The large number of consumers that met the initial “lifeline” threshold of 100 kWh/month was overburdening
the others and was subsequently reduced to 50 kWh. From Figure A 8.5, this reduced the proportion of
residential users entitled to the subsidy from 40 percent to 23 percent (read from the Average line, the
percentage value that corresponds to a consumption of 100 kWh/month and 50 kWh/month). The reduction
in number of entitled consumers has, in turn, reduced the financial burden on the utilities and GoG. The
lesson from the above experience is that it is essential to consider carefully the setting of the threshold for
“lifeline tariffs”.
Figure A 8.5: Profile of Residential Usage

293
Residential Tariffs and Implicit Subsidies
Beyond the “lifeline rate”, the structure of rates has been stepwise and progressive; i.e., higher rates for
higher bands of monthly consumption. A continuing difficulty with the tariff structure, however, is the
consumption level beyond which the tariff breaks-even for the utility and subsidies do not apply.
It can be seen from the percentage value of the “average” line in Figure A 8.5 that 83 percent of residential
consumers are below the 300 kWh/month level. Accordingly, where the tariff for consumption up to 300 kWh
is set below the computed cost as is currently the case, then the remaining 17 percent of the residential user
population are expected to fund the subsidy for the overwhelming majority that qualify for the subsidy. Not
surprisingly, the revenues/tariffs required from the 17 percent to achieve balance within the residential
category turn out to be unreasonably exorbitant and have approached the limit of what can be imposed
without the consumer choosing self-generation.
Currently in Ghana, the price for consumption up to 300 kWh has been set below the break-even price
determined by the regulator, the PURC, refer to Figure A 8.6.
The implicit and unrealistic requirement of the existing tariff structure; for only 17 percent of the residential
consumer base to subsidize the larger 83 percent, is a regulatory failure that continues to pose a problem
for the long-term financial viability of the sector.
ANNEX 8: LESSONS LEARNT
Figure A 8.6: Comparison of Residential Prices and Cost

294
SUB-SAHARAN AFRICA: INTRODUCING LOW-COST METHODS IN ELECTRICITY DISTRIBUTION NETWORKS
The regulatory tendency has consequently been to shift part of this subsidy burden unto the commercial and
industrial categories of users. This group of users, led by the Association of Ghanaian Industries, has
however been articulating its concern for the long-term profitability, competitiveness and survival of their
enterprises and has accordingly been resisting the transfer of additional burdens.
A stronger electricity sector that can shoulder on its own the requirements for extensions in addition to its
operational burdens can be created if tariffs for all consumption classes, except “lifeline” consumers,
adequately recovered costs. This could be achieved if only 23 percent of residential users were to qualify
for the below-cost tariffs. This subsidy could, in turn, be more sustainably funded by the remaining 77
percent without recourse to Government support as is currently the case.
Sense of Quality of Life
The feeling among residents of newly electrified settlements of an improved quality of life, which feeling
seems to arise just from the better opportunities for entertainment and recreation, should not be underestimated.
For many residents, the new and positive feeling of a higher standard of life and well-being may by itself be
worth the electrification effort.

295
The dual use of the HV shield wire to transmit power at the same time as it protects the power line eliminates
the need for separate MV lines to serve communities along the line route.
The cost of implementing a SWS is only about 15 percent of the equivalent MV line.
It is recommended that SWS be deployed for all settlements within a 20-km corridor of the HV transmission
line that are also located at a distance not exceeding 150 km from the HV substation from which the shield
wire would be energized.
9. Conclusions andRecommendations


Jabesh Amissah-Arthur
Annex 9
Ghana’s Experience withthe Shield Wire Scheme


Preamble
299
This paper has been prepared as part of a project for the mainstreaming of innovations and experiences in
national electrification in support of the goal of advancing electrification in Zambia, Tanzania, Mozambique
and Uganda.
The principal objective of the project, however, is to reduce the high costs of RE in sub-Saharan Africa by
mainstreaming proven, innovative low-cost methods and techniques in the design, construction and
management of electricity networks.
Ghana pioneered the development of an innovation low-cost arrangement which has been successfully
deployed for the supply of electricity to small rural settlements. The arrangement has been referred to as the
Shield Wire Scheme, SWS.
This paper seeks to review the experience of Ghana with the use of the SWS and make recommendations
for the consideration in the development of electrification plans by the four target countries.


301
1. Background and Rationale forShield Wire Scheme
The hydroelectric power development which was undertaken from 1960 on the Volta River in Ghana
created the largest man-made lake in the world and displaced about 80,000 people in 52 villages. This
transmission network, however, served only the major towns in the country. Virtually, none of the citizens
who had sacrificed their land and livelihoods or were most affected by the project, received electricity
service from the infrastructure which had been developed.
Over the years, this perceived injustice became a sore Corporate Social Responsibility (CSR) issue and
public relations headache for the VRA which was created to own and operate all the facilities.
In the early 1980s, the VRA invited Professor Francesco Iliceto of the Rome University to join it in considering
and proposing a low-cost scheme for the supply of power to communities living near VRA’s 161kV transmission
lines.


2. The Shield Wire Scheme
303
Figure A 9.1: Diagrammatic Representation of SWS
The Professor and his team proposed a SWS which was to use the sky/shield wire, which is at the top of
every HV transmission line, in an additional role. The sky/shield wire is normally grounded for its sole
purpose of providing lightning protection for the main power line below it. The additional role foreseen
under the SWS was the transportation of power. The shield wire with power imposed would still perform its
purpose of protecting the power line against lightning strikes thus making it a dual use resource.
In order to do this, the sky wire, which normally would have been firmly connected to the grounded steel
tower body, would now be insulated from the tower body for MV operation. The insulated shield wire would
then be energized at between 20 kV or 34 kV from the sending high voltage substation. Take-off towers
would then be erected at points close to human settlements for the power to be taken off at 20 to 34 kV and
fed into regular distribution networks within the settlements.
The SWS thus replaces the MV sub-transmission line. Otherwise, the arrangements at the sending substation
as well as the distribution network within the beneficiary community do no change. See the figure below for
a diagrammatic representation of the SWS.
415/240V
SWL
HV Circuit
Disconnecting Switchwith Fuses
GroundConductor
Pole-mounted MY/LVTransformer Station
Fuses Cut-outLine to Village
SAs
MultipleGrounding Rodsof MV SWS usedfor Earth Returnof Current
Take-off Tower
Buried BareConductor 4m 3m Multiple
Grounding Rodscf LV Network


3. Introduction and Deployment ofSWS in the Field
The Professor’s proposals were subsequently tested in a pilot scheme in southern Ghana. This pilot scheme
successfully supplied power to four villages that had no supply and a television retransmission station which
was being served by an isolated diesel generation set. This pilot scheme successfully transmitted power over
the test distance of 31 km. The quality of service to consumers was equivalent to services from a conventional
34 kV overhead radial line.
By 1985, the SWS proposals had been proved to be technically viable and the scheme was proposed for
incorporation and commercial deployment as part of the VRA’s major transmission project for the extension
of power to northern Ghana.
The rationale was to be able this time round to provide electricity services to small communities scattered
along the 500+ km transmission line route which, because of technical and cost considerations, could not
have been served using the normal transmission system design.
305


4. Features and Application of SWS
Figure A 9.2: Single and Double Towers
The SWS uses earth return so that when one shield wire is installed on the HV transmission system then, a
single-phase supply is possible. See Figure A 9.1.
Where there are two shield wires on the transmission tower, a three-phase supply can be provided. See
Figure A 9.1.
The SWS, in operation in Ghana, use the regular 76 sq mm to 125 sq mm shield wire, but the same
scheme can be employed where an optical ground wire is installed since the SWS does not interfere with the
optical fiber transmission. The design criteria and constraints for the SWS are similar to conventional MV
supply except that there are limitations on negative sequence voltage of < 1 percent.
Presently, the SWS in Ghana has been implemented on about 526 km of 161 kV lines. A total of about 30
communities and 10,000 premises/households are being served from the scheme. The scheme has been
in commercial operation for almost 15 years now. The largest town served is Kintampo with a population of
about 30,000 and located 58 km north of its sending substation, Techiman. The largest single loads include
SKOD sawmills and the Tanoso waterworks, drawing up to 250 kVA.
307
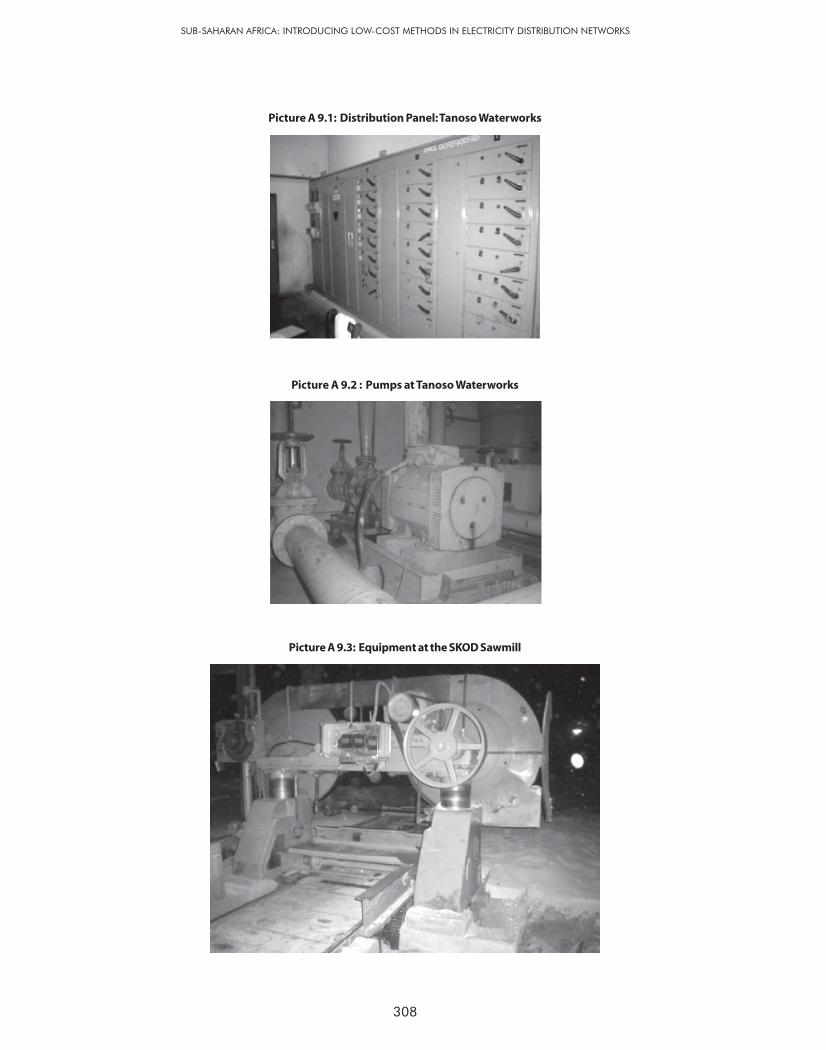
308
SUB-SAHARAN AFRICA: INTRODUCING LOW-COST METHODS IN ELECTRICITY DISTRIBUTION NETWORKS
Picture A 9.2 : Pumps at Tanoso Waterworks
Picture A 9.1: Distribution Panel: Tanoso Waterworks
Picture A 9.3: Equipment at the SKOD Sawmill

309
The SWS has been able to deliver good quality MV supply to communities up to 100 km away from the
sending substation. It has been used to serve communities up to 20 km from the centre line of the transmission
line. The town of Buipe, which is located 104 km south of the sending substation at Tamale, is served by
SWS. Currently, the maximum distance of any community from the take-off point at the transmission line is
21.5 km.
ANNEX 9: FEATURES AND APPLICATION OF SWS


311
It is known that similar SWS have been deployed in Brazil, Ethiopia and Laos. In Brazil, the SWS has been
implemented in about 370 km of 230 kV lines. In Ethiopia, the SWS has been installed in 200 km of
132 kV lines. In Laos, 190 km of 115 kV lines have been equipped with SWS to provide supply. It is,
therefore, evident that the scheme can be deployed over a wide range of transmission lines voltages. The
indications are also that Ghana has the largest experience with SWS in operation so far having implemented
it on 500+ km of lines after pioneering the field testing.
5. Other Applications


313
The concept of SWS makes possible electricity supply to communities located near transmission lines which
would, otherwise, not have been served by conventional MV systems. This is the first and most apparent
benefit of the SWS. The other advantages of the SWS include both non-quantifiable benefits and quantifiable
savings in the constructional/installation and operational phases.
One of the major challenges which has confronted the transmission utility has been the pilfering of steel
members of the transmission towers. This had been especially difficult to monitor in locations removed from
major townships by some distance. It is alleged that the bolts and nuts stolen from towers are valued for
reuse in many ways by local artisans. The tower members, usually in the form of angle iron, are also
supposed to be reused in the making of steel beds as well as other items. By providing these communities
with supply, it has been discovered that the dwellers have taken a keener interest in the protection of the
transmission line assets. This has gone a long way to reduce the incidents of pilfering tower members which
have, on occasion, resulted in expensive tower failures.
The implementation of the SWS uses essentially the same LV distribution network within the communities.
There, is, therefore, no cost difference in the construction of the LV network.
By the dual use of shield wire, the cost of sub-transmission towers, conductors, grounding mats and other
materials are completely avoided. The only exception to the elimination or reduction of material needs is for
insulators.
The only element of incremental cost in the bill of materials, above that of a conventional HV transmission
line, is from the replacement of insulators with those having appropriate arcing horns. On construction
costs, one can expect that there is a small nominal increase in erection cost for a transmission line with
insulated shield wires over the erection of a line without the SWS.
6. Benefits and Savings
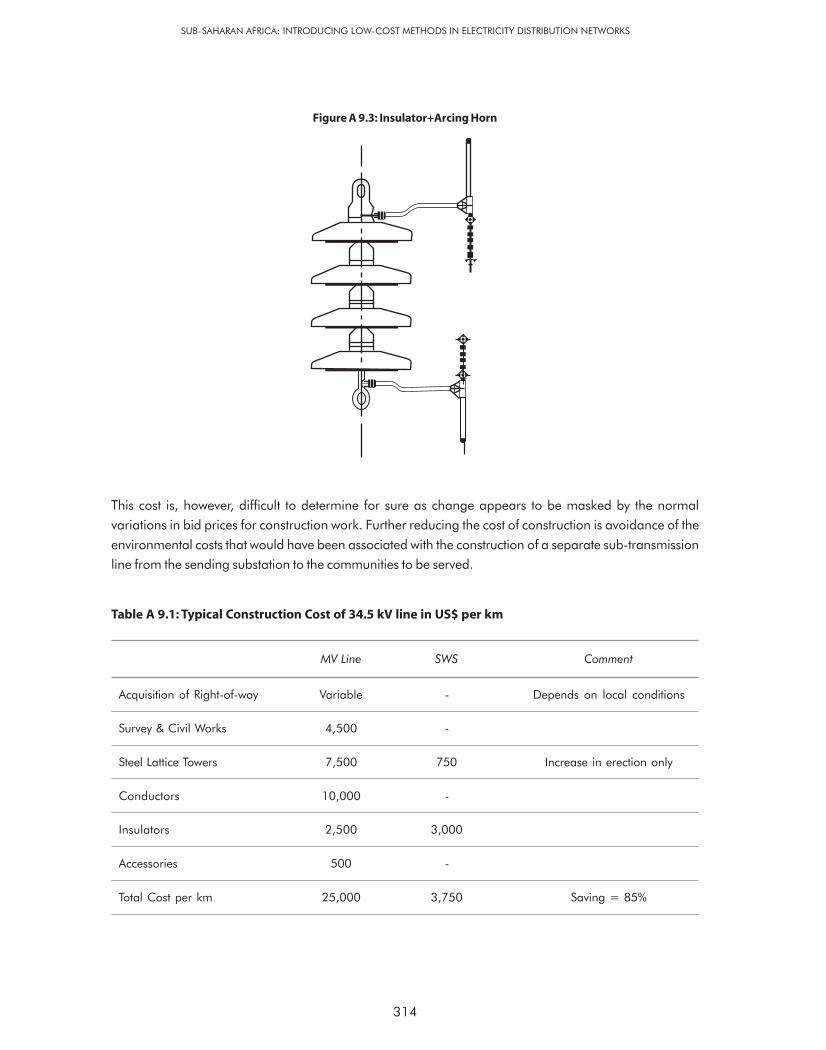
314
SUB-SAHARAN AFRICA: INTRODUCING LOW-COST METHODS IN ELECTRICITY DISTRIBUTION NETWORKS
This cost is, however, difficult to determine for sure as change appears to be masked by the normal
variations in bid prices for construction work. Further reducing the cost of construction is avoidance of the
environmental costs that would have been associated with the construction of a separate sub-transmission
line from the sending substation to the communities to be served.
Table A 9.1: Typical Construction Cost of 34.5 kV line in US$ per km
MV Line SWS Comment
Acquisition of Right-of-way Variable - Depends on local conditions
Survey & Civil Works 4,500 -
Steel Lattice Towers 7,500 750 Increase in erection only
Conductors 10,000 -
Insulators 2,500 3,000
Accessories 500 -
Total Cost per km 25,000 3,750 Saving = 85%
Figure A 9.3: Insulator+Arcing Horn

315
At the sending substation, the equipment for energizing the shield wire are not very dissimilar from that
required for interposing energizing the conventional MV line. The primary difference is the requirement of
an interposing transformer, the cost of which does not exceed US$20,000, and does not make a significant
change to the cost of the substation arrangements. The cost at the sending substation, therefore, remains
essentially the same. There are, however, substantial savings from using SWS instead of a conventional MV
line to supply towns.
The SWS has cost advantages in the operational phase as well. The first amongst these is the saving in
maintenance cost. The maintenance responsibility for the shield wire does not increase perceptibly as the
transmission company would have had to undertake virtually the same maintenance activities in the absence
of the SWS service. In the Ghana set-up, the feeder arrangement for energizing the MV line, or shield wire,
is, in any case, the responsibility of the transmission utility and not the distribution entity. So there is no impact
on either of them. Secondly, there is no requirement for the maintenance of a second right-of-way since the
SWS is implemented using the same transmission towers. As regards maintenance, therefore, the SWS
essentially eliminates all sub-transmission maintenance costs for the distribution utility. In addition to all the
above, the larger-than-normal size of conductor used for the SWS tends to lower sub-transmission losses.
This is another source of savings.
Finally, the operational records from Ghana’s SWS experience shows clearly that the outage rates for shield
wire supply are substantially lower than that of conventional supply. Figure A 9.4 compares the operational
performance of two SWS and two conventional MV supply schemes. These four have been specially selected
Figure A 9.4: Comparison of Construction Costs in US$/km
ANNEX 9: BENEFITS AND SAVINGS
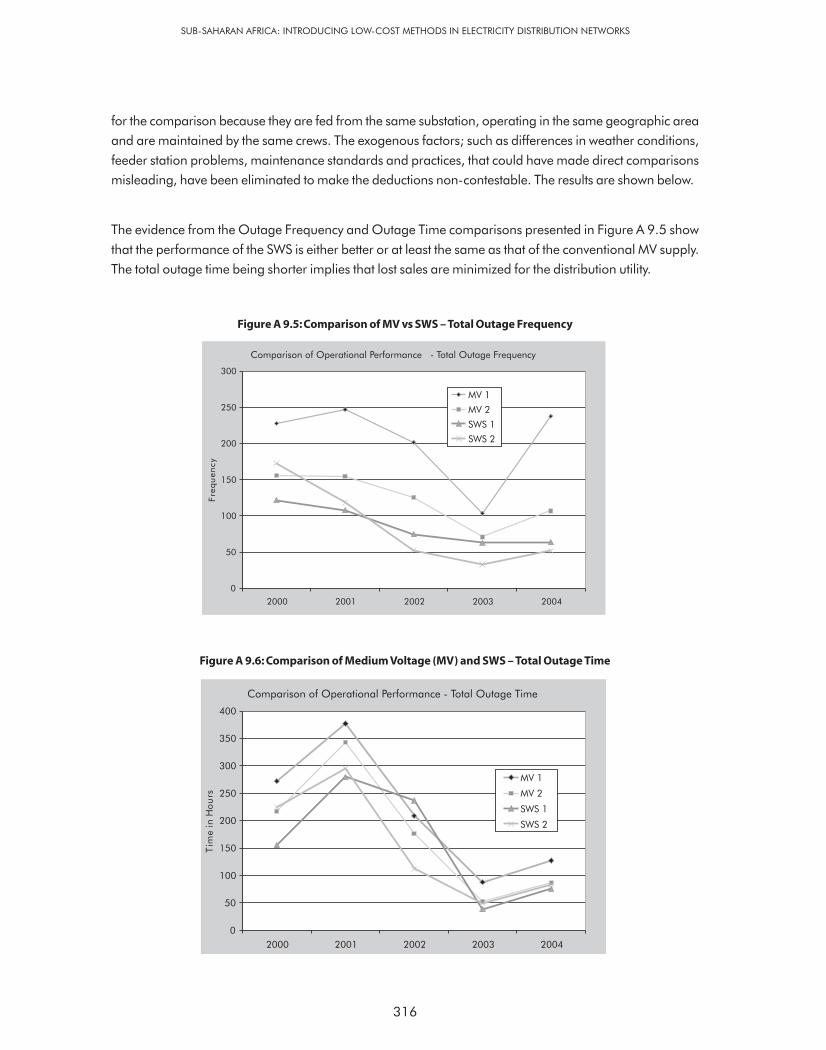
316
SUB-SAHARAN AFRICA: INTRODUCING LOW-COST METHODS IN ELECTRICITY DISTRIBUTION NETWORKS
for the comparison because they are fed from the same substation, operating in the same geographic area
and are maintained by the same crews. The exogenous factors; such as differences in weather conditions,
feeder station problems, maintenance standards and practices, that could have made direct comparisons
misleading, have been eliminated to make the deductions non-contestable. The results are shown below.
The evidence from the Outage Frequency and Outage Time comparisons presented in Figure A 9.5 show
that the performance of the SWS is either better or at least the same as that of the conventional MV supply.
The total outage time being shorter implies that lost sales are minimized for the distribution utility.
Figure A 9.5: Comparison of MV vs SWS – Total Outage Frequency
Figure A 9.6: Comparison of Medium Voltage (MV) and SWS – Total Outage Time
Comparison of Operational Performance - Total Outage Frequency
0
50
100
150
200
250
300
2000 2001 2002 2003 2004
Fre
qu
en
cy
MV 1
MV 2
SWS 1
SWS 2
Comparison of Operational Performance - Total Outage Time
0
50
100
150
200
250
300
350
400
2000 2001 2002 2003 2004
Tim
ein
Ho
urs
MV 1
MV 2
SWS 1
SWS 2

317
7. Limitations and Challenges
The load-carrying capacity of the SWS using the smaller 76 sq mm ACSR shield wire is in excess of 9 MW. The
load-carrying capacity at a distance of 100 km is about 4 MW. It has been computed that at the extreme
distance of about 150 km from the sending substation, the capacity of the shield wire system is limited to about
3 MW. These capacities have turned out to be more than adequate for the implementation in Ghana.
Where the transmission tower has two shield wires, it has been possible to provide three-phase supply. This
has been suitable for running motors and other loads with capacities up to 100 kW. The largest consumers
currently being supplied by Ghana’s SWS, as noted earlier, includes sawmills and waterworks.
The main concern of potential consumers in the initial period was about the single-phase supply. As noted
earlier, single-phase supply is possible only where there is one solitary shield wire on the transmission tower.
The complaint against single-phase supply has been found to be only valid in the exceptional cases where
consumers desire or require using motors of capacity greater than 50 kW. For the majority of users in the
rural setting, the single-phase supply presents no limitation.
The shield wire system has a higher phase-to-ground voltage than the normal MV system. This requires a
nominal increase in equipment insulation of about 20 percent. Accordingly, the BIL of shield wire equipment
typically increases from 170 kV to 200 kV. This is a relatively minor increase which has not been difficult
for suppliers to meet.
The dual use of the shield wire for power transfer, at the same time as it performs the lightning protection
role, requires the insulators which are used for the SWS to have arcing horns. The accurate setting of the
arcing horn gap has been found to be critical for the satisfactory performance of the lightning protection
function. During the installation phase, therefore, particular attention has to be paid by the contractor to
ensure that the arcing horn gap is set accurately.
Apart from the challenges and limitations discussed above, the technical implementation of the SWS is the
same as that of the conventional MV system. The maintenance of the LV distribution network does not
change neither does the standard operating requirements for the equipment in the distribution network or at
the sending substation.


319
8. Special Shield Wire Equipment
The most significant deviation of the SWS from the conventional MV system is the installation of an interposing
transformer which can be produced by many transformer manufacturers. Most of the interposing transformers
used for the SWS in Ghana have been procured from AEG in Turkey.
Other minor equipment with special specification/requirements include lightning arrestors, capacitors and
the insulators with arcing horns. None of these present any significant challenge to manufacturers and are
widely available.
The design of each SWS application is, however, complicated by the earth return of current, the voltage
balancing needs and the interaction with the HV power circuit below.
Picture A 9.4: Interposing Transformer at Techiman Substation


The deployment of a SWS is best suited for sparsely populated territories which are traversed by HV
transmission lines and is best implemented with the construction of new transmission lines.
The operation of a SWS is simple and can be performed by regular distribution utility personnel. It is,
however, recommended that the design of each SWS application is undertaken or at least supervised by
professionals with the required experience and expertise.
Ghana has had a very satisfactory and successful implementation of the shield wire scheme over its
15 years of operating experience covering 520 km and serving more than 10,000 premises/households in
30 communities. The performance of the system has been better in terms of outage rates and losses than
a conventional MV sub-transmission. The cost of these SWS has been only 15 percent of that for a comparable
MV line.
In summary, the SWS has been proven to be technically viable and financially cost-effective for supply to
settlements located at distances of up to 100 km from the sending substation and which are also within a
20 km corridor of the transmission line.
It is, therefore, recommended that SWS be deployed to provide electricity service to settlements in sparsely
populated regions traversed by HV transmission lines.
9. Conclusion andRecommendations
321


323
Iliceto, F: Lightly loaded long HV Transmission Lines, 1982-83.
Iliceto, F., Cinieri, E., Casely-Hayford, L. and Dokyi, G.: New concepts on MV Distribution from Insulated
Shield Wires on HV lines. IEEE Transactions on Power Delivery, Vol 4, No 4 October 1989, pp 2130-44.
D'Ajuz, A., Mendes, E.F.R., Iliceto, F. and Gatta, F.M.: Transmission lines with Energized Shield Wires. An
economical solution for the supply of isolated communities. October 1993.
10. References


John TullochTulloch Consulting LimitedNew Zealand
Annex 10
Single Wire Earth Returnas an Option forLow-cost Rural ElectrificationLow-cost Techniques


327
1. Introduction
In coming to grips with rural electrification (RE) and the particular economic and technical challenges
presented in rural projects or development scenarios, serious consideration must be given to all the options
available to meet the prospective consumers needs.
Often the economics are clearly in favor of connecting new consumers via extensions to the grid. This has
the dual benefit of efficiently making supply available and increasing revenue from the existing system.
Many power authorities, in different parts of the world and particularly in New Zealand and Australia, have
successfully adopted SWER systems to directly underpin RE policy which is, principally, aimed at directly
supporting economic development and to facilitate a standard of living the community requires.
SWER is an economical solution for extending power supply into more sparsely populated, low-load density
areas. Its advantages are its low initial capital cost, design simplicity, ease of construction, excellent level of
reliability and low maintenance costs. Limitations include restricted load capacity, the requirement for reliable
low resistance earthing, possible interference to metallic communications systems and higher losses due to
charging currents.
Many of the design considerations for SWER are similar to those of other power distribution systems, particularly
with regard to pole strengths, sags and tensions, although the stringing of only one conductor means that
much longer spans can be achieved for the same strength poles and size and type of conductor. Special
requirements for SWER are the need for isolator transformers and the need for low-resistance earth banks
at isolator and distribution transformer stations. Standard protections systems are applicable.
This paper describes technical considerations for SWER systems.

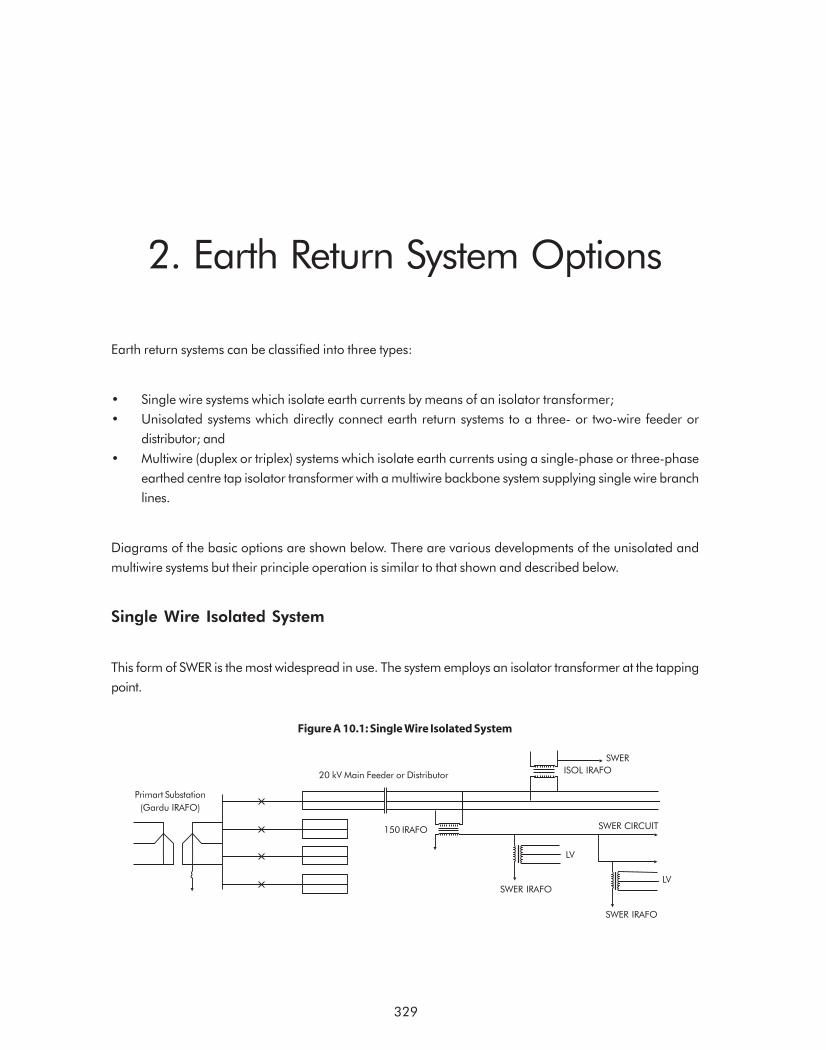
2. Earth Return System Options
329
Earth return systems can be classified into three types:
• Single wire systems which isolate earth currents by means of an isolator transformer;
• Unisolated systems which directly connect earth return systems to a three- or two-wire feeder or
distributor; and
• Multiwire (duplex or triplex) systems which isolate earth currents using a single-phase or three-phase
earthed centre tap isolator transformer with a multiwire backbone system supplying single wire branch
lines.
Diagrams of the basic options are shown below. There are various developments of the unisolated and
multiwire systems but their principle operation is similar to that shown and described below.
Single Wire Isolated System
This form of SWER is the most widespread in use. The system employs an isolator transformer at the tapping
point.
Figure A 10.1: Single Wire Isolated System
20 kV Main Feeder or Distributor
Primart Substation
(Gardu IRAFO)
150 IRAFO SWER CIRCUIT
LV
SWER
ISOL IRAFO
LVSWER IRAFO
SWER IRAFO
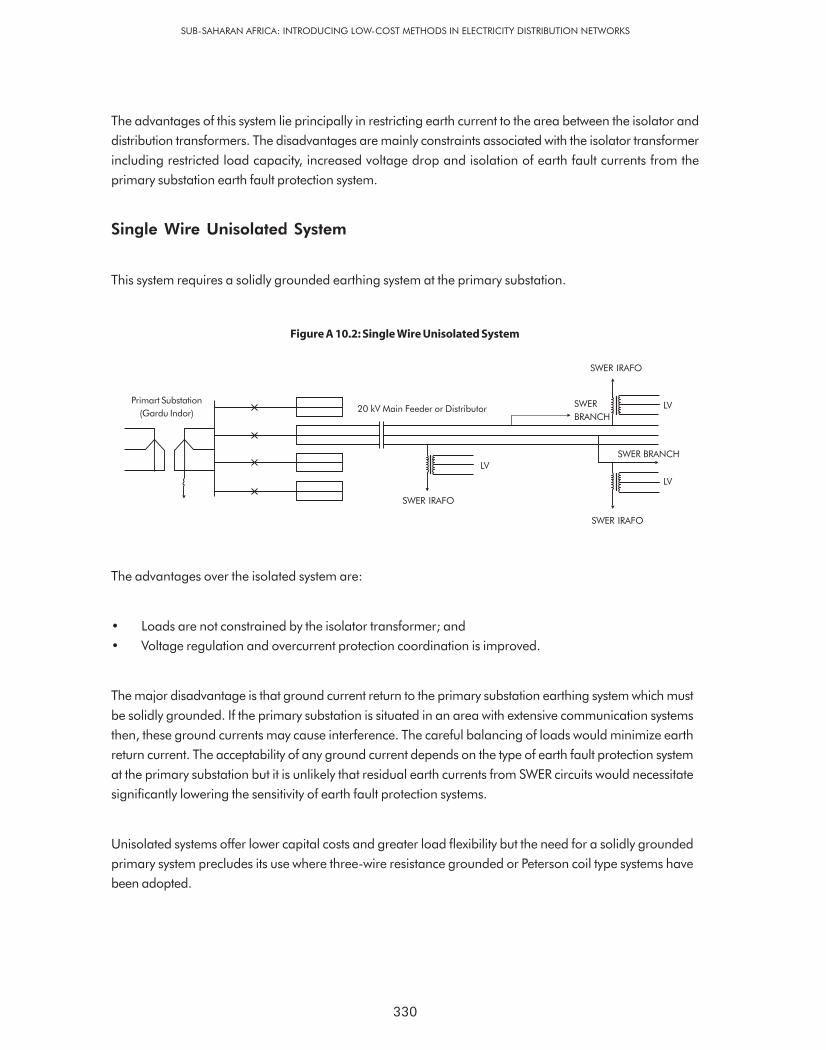
330
SUB-SAHARAN AFRICA: INTRODUCING LOW-COST METHODS IN ELECTRICITY DISTRIBUTION NETWORKS
Figure A 10.2: Single Wire Unisolated System
The advantages of this system lie principally in restricting earth current to the area between the isolator and
distribution transformers. The disadvantages are mainly constraints associated with the isolator transformer
including restricted load capacity, increased voltage drop and isolation of earth fault currents from the
primary substation earth fault protection system.
Single Wire Unisolated System
This system requires a solidly grounded earthing system at the primary substation.
The advantages over the isolated system are:
• Loads are not constrained by the isolator transformer; and
• Voltage regulation and overcurrent protection coordination is improved.
The major disadvantage is that ground current return to the primary substation earthing system which must
be solidly grounded. If the primary substation is situated in an area with extensive communication systems
then, these ground currents may cause interference. The careful balancing of loads would minimize earth
return current. The acceptability of any ground current depends on the type of earth fault protection system
at the primary substation but it is unlikely that residual earth currents from SWER circuits would necessitate
significantly lowering the sensitivity of earth fault protection systems.
Unisolated systems offer lower capital costs and greater load flexibility but the need for a solidly grounded
primary system precludes its use where three-wire resistance grounded or Peterson coil type systems have
been adopted.
20 kV Main Feeder or DistributorPrimart Substation
(Gardu Indor)
SWER IRAFO
LV
SWER
BRANCH
LV
SWER IRAFO
SWER IRAFO
LV
SWER BRANCH

331
Figure A 10.3: Multiwire System
Multiwire System
There are two different multiwire systems – the two-wire duplex and the three-wire triplex. Figure A 10.3
shows the more commonly used duplex system.
Two-wire Duplex System
This system is based on a two-wire backbone distribution circuit supplied by an earthed center tapped single
phase isolator transformer. This system provides two 12.7 kV or 19.1 kV circuits in a 12.7 kV-0-12.7 kV
(19.1 kV-0-19.1 kV) format or 22 kV (38.1 kV) line-to-line. Single wire unisolated tap-off spurs are made
from this backbone.
This system has applications for reticulating areas in which the existing or projected loads exceed the
limitations of single-wire systems and where it is economically viable to construct a two-wire isolator backbone
with single-wire laterals. The duplex system permits the line-to-line connection of additional isolator
transformers or another centre tapped duplex extension, neither of which adds to the ground current of the
main isolator transformer and, therefore, permits significantly larger networks. There is, however, a limit on
the single-phase load unbalance which can be tolerated on the three-phase network and the problems of
overcurrent protection coordination is exacerbated. The duplex system also facilitates the use of earth
return systems in high earth resistivity areas where it is not possible to obtain sufficiently low earth resistance
for the isolator transformer but where it is feasible for the smaller capacity distribution transformers.
It is generally used where additional capacity is required over that deliverable by the single-wire system.
Harmonics, as well as fundamental ground currents, are cancelled by balancing loading, thereby reducing
communications interference to about 10 percent of a conventional SWER circuit.
Three-wire Triplex System
This system employs a three-phase isolator transformer coupled with a three-wire backbone distribution
circuit which facilitates connection of SWER laterals.
ANNEX 10: EARTH RETURN SYSTEM OPTIONS
20 kV Main Feeder or Distributor
Primart Substation
(Gardu Indor)
150L IRAFO
LV
SWER BRANCH
LV
SWER IRAFOSWER BRANCH
SWER IRAFO
SWER IRAFO
2-WIRE DUPLEX CIRCUIT

332
SUB-SAHARAN AFRICA: INTRODUCING LOW-COST METHODS IN ELECTRICITY DISTRIBUTION NETWORKS
The economies are achieved through the SWER laterals and this system is only economic in areas where
these savings exceed the higher cost of the three-phase isolated backbone system. The advantages of this
system are the capability of supplying three-phase loads from the backbone circuit and isolation of ground
currents. It is also possible to use substantially larger isolator transformers and maintain acceptable grounding
system voltage gradients provided the network is extensive enough to facilitate load balancing over the three
phases. Ground charging currents are similarly reduced.
Generally, this system tends to have limited application.
The remainder of this paper describes requirements for the single-wire isolated system which is, by far, the
most commonly adopted SWER system.

333
3. SWER Basics
The key issues to enabling the adoption of SWER are:
• Earthing requirements
• Protection
• Load densities
• Voltage selection
• Isolator transformers
• Technical characteristics
Earthing and protection are the main key enablers which must be satisfied in order for SWER to be an
option.


335
4. Earthing Requirements
The reliability and design of earthing systems is critical to the safety and success of SWER distribution
systems. Not only must the SWER earthing system conduct the occasional fault currents, but it must conduct
the continuous load current as well. Particular care must be taken to maintain the continuity of the earth
system and to ensure the resistance of the earthing remains within specification.
Earth Banks
Low MV SWER transformer earth resistances are essential. To achieve this, the following key elements are
required:
• Deep-driven 4.8 m (minimum) earth electrodes in most soils to ensure continuous contact with low
resistivity soils which are not affected by climatic vagaries and to eliminate drying out of soils due to
heating from the continuous current flow.
• The MV SWER earth bank should be a minimum of 0.50 m below ground to minimize mechanical
damage.
• The earth electrodes should be copper plated or clad to minimize electrolytic corrosion.
• Electrodes should be connected by PVC covered 25 mm2 copper earth conductor from the transformer
to the first earth pin in each leg.
• The connection of the electrode and PVC copper earth conductor should be by compression jointing.
Exothermic welding is also acceptable but care must be taken to ensure that the moulds do not contain
any moisture. Bolted clamp joints are not acceptable underground due to the continuous earth current
accelerating electrolytic corrosion.
• Mechanical protection of the earthing system is essential to reduce to a minimum the potential of
damage to the earthing system, theft or malicious damage. The use of galvanized water pipe, securely
fastened to the pole to protect the PVC-covered earth wire from transformer level to 500 mm below
ground level, is the recommended practice.
Although it is desirable to use standard earth banks as far as practicable, it is nevertheless essential to check
soil resistivity and ground conditions in the area before finally determining the earth bank design. Appendix

336
SUB-SAHARAN AFRICA: INTRODUCING LOW-COST METHODS IN ELECTRICITY DISTRIBUTION NETWORKS
A gives details of how to measure soil resistivity and electrode resistance and shows the relationship between
resistance and length of electrodes and also the relationship between resistance and multiple electrodes.
The final selection of types of electrodes will depend on soil acidity. Copper-plated steel electrodes, 15 to
16mm in diameter, provide long life in most environments unless soil acidity requires the use of
copper-clad steel, solid copper or stainless steel electrodes. Galvanized electrodes and pipes are not acceptable
as electrolytic corrosion is accelerated due to the continuous current flow. The earth electrodes may comprise
continuous 4.8 m rods. Alternatively, for ease of installation, they may comprise three connectable 1.6 m
segments to form the 4.8 m electrode.
For distribution transformers, three long electrodes placed in an equilateral triangle with about 5 m electrode
spacing, is recommended. In most soil types, this should produce an earth resistance of 5 to 10 ohms or less
which is suitable for small distribution transformer of around 32 kVA. The required resistance for 100 kVA
transformers should not exceed 5 ohms and should ideally be less than 3 ohms. These figures will result in
voltage gradients of less than 20 v. The maximum safe voltage gradient is 30 v.
For isolator transformers, additional isolator expenditure is required. The objective is to achieve a bank
resistance of less than 1 ohm for a 400 kVA isolator transformer and 2 ohms for a 200kVA transformer in
all vagaries of soil condition and climate. These figures will limit the voltage gradient to about 25 v. If the soil
resistivity is such that the basic earth system will not meet the above criterion, the following options should be
considered:
• From each point of the triangle a further electrode may be required 5 m away to give a six electrode
star system. Alternatively select one leg to install three additional electrodes. The first option is usually
more effective, but land restrictions may constrain the positioning of the additional electrodes for the
star system.
• Another bank may have to be installed 10 m or more from the first.
• In poor soil conditions, aerial earth wires may have to run some distance to find better resistivity soils
and electrodes connected to the earth wire and installed at each pole or selected poles along this line.
This practice, common in four-wire systems, can dramatically lower earth resistance to acceptable
levels, even in very poor conditions.
• Evaluate locating the transformer to an area with better soil resistivity.
• As a last resort, the expensive option of deep-drilled electrodes to constant moisture zones can be
employed. This is a method which has been adopted in some semi-desert areas in Central Queensland,
Australia and involves drilling a 100 mm hole until at least 6 m of constant moisture zone is encountered.
A copper electrode (30 mm x 3 mm flat copper strap) is installed with a 4:1 dry weight bentonite and
gypsum blend poured down the hole. Subsequent swelling of the bentonite ensures good contact and
moisture retention. Three electrodes at 20 m spacing or more will, on test after one week, give a
combined resistance typically less than 1 ohm and at six months 0.5 ohms.
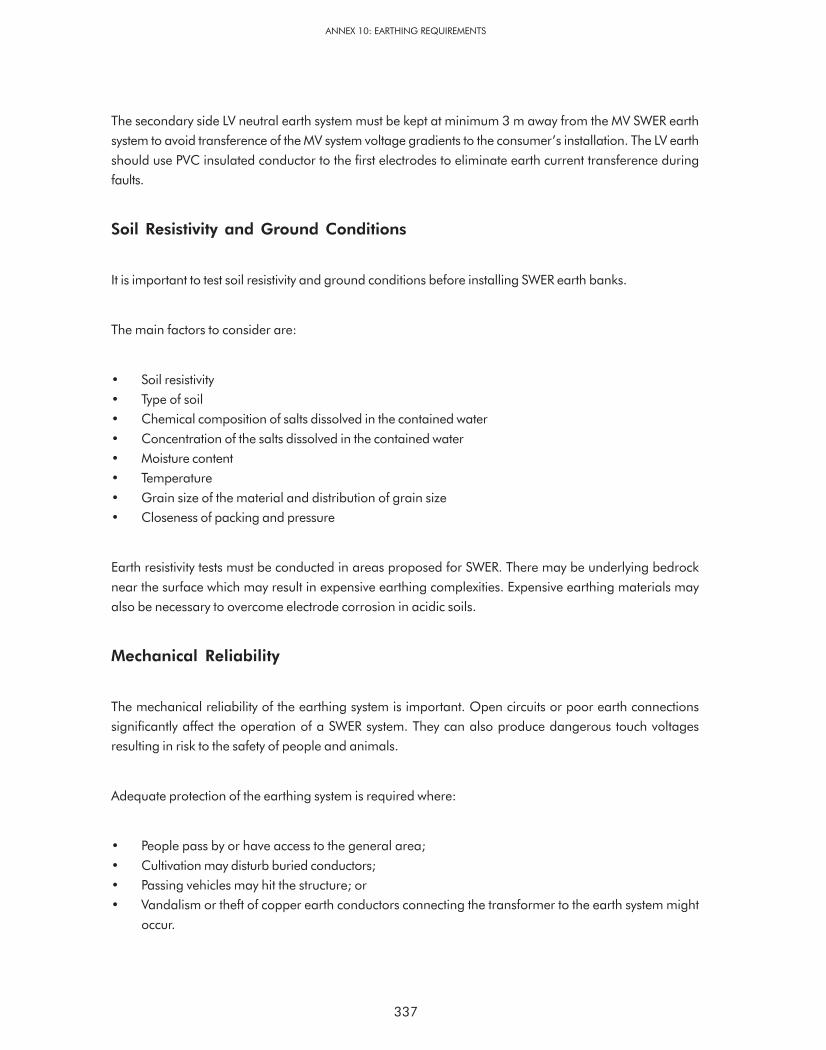
337
The secondary side LV neutral earth system must be kept at minimum 3 m away from the MV SWER earth
system to avoid transference of the MV system voltage gradients to the consumer’s installation. The LV earth
should use PVC insulated conductor to the first electrodes to eliminate earth current transference during
faults.
Soil Resistivity and Ground Conditions
It is important to test soil resistivity and ground conditions before installing SWER earth banks.
The main factors to consider are:
• Soil resistivity
• Type of soil
• Chemical composition of salts dissolved in the contained water
• Concentration of the salts dissolved in the contained water
• Moisture content
• Temperature
• Grain size of the material and distribution of grain size
• Closeness of packing and pressure
Earth resistivity tests must be conducted in areas proposed for SWER. There may be underlying bedrock
near the surface which may result in expensive earthing complexities. Expensive earthing materials may
also be necessary to overcome electrode corrosion in acidic soils.
Mechanical Reliability
The mechanical reliability of the earthing system is important. Open circuits or poor earth connections
significantly affect the operation of a SWER system. They can also produce dangerous touch voltages
resulting in risk to the safety of people and animals.
Adequate protection of the earthing system is required where:
• People pass by or have access to the general area;
• Cultivation may disturb buried conductors;
• Passing vehicles may hit the structure; or
• Vandalism or theft of copper earth conductors connecting the transformer to the earth system might
occur.
ANNEX 10: EARTHING REQUIREMENTS

338
SUB-SAHARAN AFRICA: INTRODUCING LOW-COST METHODS IN ELECTRICITY DISTRIBUTION NETWORKS
Additional mechanical protection should be provided in the form of galvanized steel pipe over the PVC
covered 25 mm2 earth wire. The pipe should be installed from at least 3 m above the ground level to 500
mm below ground where the earthing conductor connects to the first earth pin. This provides mechanical
protection against a wide range of potential incidents including theft, malicious and accidental damage and
reduces the hazards to a level similar to three-phase systems.
339
5. Protection
Prospective fault currents and the issues regarding fuse element/energizing current constraints are key to
SWER success. With good earthing, adequate protection is viable even with low fault currents.
A major issue is ground contact in the case of fallen lines. To enhance or increase fault level discrimination,
techniques such as operating at higher voltages (19.1 or 20 kV) and using low impedance or larger source/
isolator transformers are options. Increased fault levels enable reliable and safe operation of protection if
ground contact is a problem.
The protection solutions for most site situations include:
• Standard dropout fuse protection;
• Standard HRC fuse protection;
• circuit breaker with overcurrent protection relay; and
• circuit breaker with special ground current sensing relay
The first three options meet most protection requirements. A typical circuit breaker equipped with auto-close
functions provides excellent circuit protection for longer circuits and would be used on 200 kVA and
400 kVA isolator transformers.
The last option is more expensive, as the relay cost is approximately US$2500. The relay monitors for
arcing patterns rather than fault current and, thus, can detect very low current faults of a few Amps against
the primary current. It is usually only considered in desert or very dry areas where ground contact resistances
are very high.
With a SWER voltage of 19.1 kV, protection will not be a major technical constraint. Usually a dropout fuse
or a circuit breaker equipped with auto-reclose, overcurrent and fault protection at the isolator transformers
and standard dropout fuse protection elsewhere will meet the requirements.
Standard surge arrestors should be installed at isolator and distribution transformer locations in
lightning-prone areas.


6. Load Densities
The dominant criterion for adopting SWER for a particular area is loading. Unless interference with open
wire communication systems is likely, a maximum SWER capacity of 480 kVA limited by 25 Amp at 19.1 kV
is suggested. If loads or prospective loads within the next 10 years are likely to exceed the SWER capacity of
the line, then a two-wire or three-wire option should be investigated or, at the very least, upgradability, as
described in the following Section, should be built into the design.
341

7. Voltage Selection
Selection of a voltage is usually dependent on the load to be delivered, the distance from the three-phase
backbone and the conductor selected. Operational experience confirms the selection of 19.1 kV
phase-to-ground as a good voltage to use. This is a simple √3 derivative from a 33 kV backbone but may
also be derived from 11 kV and 22 kV primary systems. It should be noted that the selected voltage is
derived from the isolator transformer and not from the backbone feeder voltage.
343

8. Isolator Transformers
The following are considerations concerning the use of isolator transformers on the SWER distribution
systems:
• Isolator transformers enable selection of a voltage independent of the voltage of the parent system.
For example, an 11 kV or 22 kV backbone can provide a 19.1 kV SWER voltage via the isolator
transformer.
• Isolator transformers ensure earth currents, which may cause interference with telephone systems,
are restricted to the areas between distribution transformers and the isolator transformer that supplies
them.
• Isolator transformers enable the use of sensitive earth fault protection schemes on the feeders emanating
from the zone or primary substations.
• Isolator transformers are essential on systems employing neutral grounding reactors at the zone or
primary substations.
• Isolator transformers enable better voltage balance on the feeder emanating from the zone or primary
substations as supply is taken across two phases.
• Isolator transformers ensure cost-effective voltage control on the SWER lines by providing voltage
tapping ranges which permit the use of low-cost fixed tap distribution transformers.
• As the isolator transformer must carry the total load current plus line charging current, care in specifying
impedances (3 percent to 4 percent on rating) is required to minimize losses.
Isolating substations require a reliable and low resistance MV earthing system which requires regular testing.
345


9. Technical Characteristics
The following technical characteristics and design issues, which are peculiar to SWER networks, require
consideration in relation to adoption of SWER.
• Voltage gradient limits must be set for safety. The passage of load current and the resistance of the
earthing system will result in a voltage gradient over the earthing area and a voltage rise in the
earthing conductor. The normal limit placed on this voltage to ensure that persons and animals are not
affected is in the order of 40 V per meter under worst-case conditions. It is normal to allow a factor of
safety of two for systems where the voltage rise can be reflected via the neutral to consumer premises.
This occurs where a common earth is used for primary and secondary sides of the transformer. If
separate earth systems are used, then, a safe maximum gradient of 30 V per metre can be used.
The above criterion can usually be met without difficulty for a small distribution substation, as the earth
return current is small. A 32 kVA distribution transformer at 150 percent overload would require a 12
ohm earth to maintain a voltage gradient of about 30 V; this being easily achievable with a simple
3 by 4.8 m triangular electrode system. Even though 1.8 m electrodes will meet the requirement,
usually 4.8 m electrodes are chosen to ensure that the electrodes are in a zone of permanent moisture
so that heating effects or drought conditions do not dry out the soil and thus affect the soil resistivity.
For large capacity isolator transformers, a higher investment is required to minimize the earth resistance
and hence voltage rise. Thus, the earth mat resistance for a 480 kVA supply would have to be
maintained at around 1 ohm for a 25 v gradient. This can involve a complex earthing system depending
on soil resistivity but for 100 ohm metre soil is achievable without major cost using a similar system as
above with 4.8 m electrodes and extending the grid laterally.
• Reactance. The earth return currents flow at an average depth of 1,500 m, depending on soil resistivity.
This increases reactance significantly. For example, a conductor commonly used in SWER is 3/4/2.5
Raisin. The reactance per km rises from 0.40 Ω/km for a two-wire circuit to 0.83 Ω/km for the SWER
circuit. The overall impedance per km thus rises from 1.63 to 1.78Ω/km.
• Resistance. The earth return path resistance is typically 0.05 Ω/km. As the earth resistances at both
the isolator transformer and distribution transformer must be kept low, the earth return path resistance
makes minimal contribution to the overall resistance and is usually omitted from voltage regulation
calculations.
• Earth Return Charging Current. In SWER systems, the charging current occurs between line-to-ground
rather than line-to-line as for multiwire circuits. This current is proportional to line length and is in the
order of 0.038 A/km at 19.1 kV.
347
348
SUB-SAHARAN AFRICA: INTRODUCING LOW-COST METHODS IN ELECTRICITY DISTRIBUTION NETWORKS
This current effects voltage regulation, communication circuits and losses as follows:
– Voltage Regulation. Charging current has only a small effect on voltage drop under load conditions,
but it can cause voltage rise under no load conditions on lines over 30 km long. This may be
overcome by the insertion of a LV series capacitor in the earthing conductor of the isolator
transformer. This solution is also occasionally adopted in areas where low power factor exists.
– Communication Circuits. The harmonic currents associated with SWER-charging current can be
a source of interference with metallic communication circuits where they are constructed within
3 km of a SWER line. This factor has restricted maximum SWER capacity in some countries but
now that metallic circuits are being replaced with radio communication or fiber optics, this restriction
should be reevaluated on a case-by-case basis.
– Losses. Losses due to charging current can be significant for long, high-resistance SWER lines;
particularly those operated at higher voltages. Appendix 10B shows how to calculate SWER
charging current and losses.
• Voltage Regulators. For remote rural areas, it sometimes becomes necessary to include a voltage
regulator to compensate for the drop in the three-phase supply circuit. A low-cost option is available
for SWER lines by installing correction at the isolator transformer using a buck/boost transformer
energized from an automatic variable output transformer supplied from a tertiary winding in the
isolator transformer. The buck/boost transformer need only be about 5 percent of the rating of the
isolator transformer.

349
10. Load Considerations
A single-phase one-wire 19.1 kV SWER system may be used where loads are less than 480 kVA and
single-phase motor loads are restricted to 22 kW. At 100 km and 10 percent volt drop (∆V) using Walnut
conductor, the full SWER capacity of 480 kVA can be delivered. At 5 percent ∆V the 100 km capacity is
180 kVA. In practice, the capability to deliver these loads will be further restricted by lead-up network volt
drops, though adjusting the tap setting at the SWER isolator transformer will compensate in part.


11. Energy Losses
The energy losses in a SWER circuit are higher than that for conventional reticulation and additional losses
as a result of which the following issues must be determined and considered in the project evaluation.
• The isolator transformer load and iron losses offset in part by the lower load losses in single-phase
transformers compared to the same rated three-phase transformer.
• The higher impedance of a SWER circuit.
• The charging current losses, though this can be reduced by the insertion of capacitors in the earth
return circuit.
351


353
12. Communications Interference
Modern communications systems use radio and fiber optics and these are the most likely systems to be used
in developing rural areas. Neither of these systems are affected by SWER. Open wire communication
systems are affected by SWER and if these are prevalent, a restriction of 8 to 10 Amps for SWER circuits to
limit communication interference may have to apply. Alternatively, a duplex SWER system may need to be
used.


13. Comparative Costs andLoad Capacities
Table A 10.1 summarizes the typical costs and load capacities for three-wire and one-wire options using
Leopard, Walnut or Raisin ACSR conductors.
Table A 10.1: Comparative Costs and Load Capacities
Construction-conductor $/km KVA-50km1 KVA-25km1 Span Length m Relative Cost
3W 33kV – Leopard 19,740 4,000 8,000 120 100%
3W 33kV – Walnut 14,647 2,600 5,200 150 74%
3W 33kV – Raisin 9,502 1,080 2,160 225 48%
1W 19.1kV – Leopard 6,415 440 4802 240 32%
1W 19.1kV – Walnut 4,693 365 4802 300 24%
1W 19.1kV – Raisin 4,032 190 380 300 20%
1 At five percent volt drop. Capacity can be doubled for 10 percent volt drop: for SWER to the 480kVA limit.2 Maximum SWER capacity 480kVA limited by maximum SWER current of 25Amps.
355

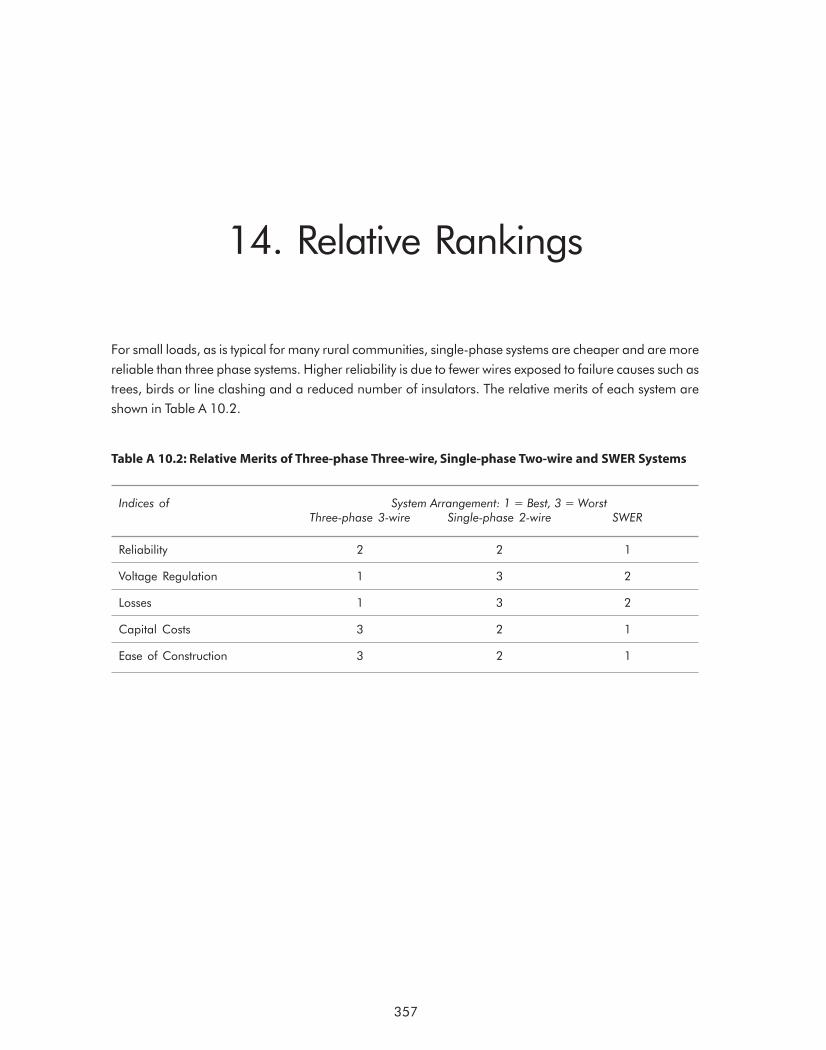
14. Relative Rankings
For small loads, as is typical for many rural communities, single-phase systems are cheaper and are more
reliable than three phase systems. Higher reliability is due to fewer wires exposed to failure causes such as
trees, birds or line clashing and a reduced number of insulators. The relative merits of each system are
shown in Table A 10.2.
Table A 10.2: Relative Merits of Three-phase Three-wire, Single-phase Two-wire and SWER Systems
Indices of System Arrangement: 1 = Best, 3 = WorstThree-phase 3-wire Single-phase 2-wire SWER
Reliability 2 2 1
Voltage Regulation 1 3 2
Losses 1 3 2
Capital Costs 3 2 1
Ease of Construction 3 2 1
357


15. Upgradability
Smart selection of pole heights and strengths, conductor-types and configuration arrangements enable
SWER lines to be built in a manner which will enable simple upgrade to a two-wire single-phase or
three-wire three-phase system. Given that the initial capital cost of a well-designed SWER line, including
isolator transformer, is usually 30 percent of the initial capital of a three-phase line, substantial project cost
reductions are achieved. The upgrade would be at a capital cost which would only be marginally higher
(<15 percent) overall than building a three-phase system initially. In practice, the requirement to upgrade
to three-phase is not likely to eventuate for a long time (10 to 30 years) after the initial installation. Discounted
cash flow calculations would, therefore, support the case for the lower initial installation cost.
The distribution transformers would also require changing to the standard supply voltage. For a three-phase
upgrade, some additional three-phase LV distribution could be required and rebalancing of phases for all
single-phase loads. Any 460 V single-phase motors would need reconfiguring to 230 V or replaced with
three-phase units.
Technologies are available which enable the production of a three-phase supply from a single-phase system
if motor loads exceed 22 kW. The cost and serviceability of such systems requires balancing against the cost
of the upgrade.
In practice, only a small percentage of rural supplies will require future upgrade within the life expectancy
of the line. Even if the unexpected happened and some lines require upgrade within a short duration
(< five years), then the overall savings and, hence, economics are still favorable. These events will happen
due to the enterprise of those communities which will fully grasp the opportunities of electrification. In such
cases, growth will justify and fund the additional capital.
359

360
SUB-SAHARAN AFRICA: INTRODUCING LOW-COST METHODS IN ELECTRICITY DISTRIBUTION NETWORKS
The lowest cost intermediate SWER structure is a pole with the line post insulator directly mounted horizontally
as per Figure A 10.4. There is a small additional cost using option B for the insulator support bracket, but
larger spans are possible and hence reductions in structure requirements. On upgrading, the lower conductors
are installed either directly to the pole as a lateral delta as shown in Figure A 10.5 or on a short cross arm
in a vertical delta as shown in Figure A 10.6. The options chosen for these intermediate structures depend
on the conductor, pole sizes and strengths, sags and span lengths chosen. In Figure A 10.7 the lower
insulators may be pin-types, as the upper conductor will act as a shield wire.
The upgradeable design would normally involve spacing the SWER poles so that at the time of upgrade an
additional pole would be placed in between. This enables retaining advantage in the short term of the
longer spans achievable with SWER.
Figure A 10.4: SWER Line Figure A 10.5: SWER Line
Figure A 10.6: Lateral Delta 3ph Figure A 10.7: Vertical Delta 3ph
361
16. Summary
The SWER system is a simple and economical way to extend power distribution networks to consumers in
remote rural areas.
Because it involves the stringing of only one wire, the construction techniques are simple and cheap, long
spans can be achieved and maintenance costs are low. Capital costs are less than one-third of those for a
conventional three-wire system.
The Single Wire Isolated System, which employs an isolator transformer at the tapping point into the
three-phase backbone system, is the most widely used and is recommended because it restricts earth
currents to the area between the isolator transformer and distribution transformers.
Earthing requirements are the most important consideration with regard to SWER. At isolator transformers,
the earth bank resistance should be restricted to between 1 and 2 ohms, and at distribution transformers
between 5 and 10 ohms. Mechanical reliability of the earthing system is important and it is recommended
that the PVC-covered earth wires be protected by galvanized steel pipe to at least 3 m above ground and to
500 mm below ground.
Standard protection such as dropout fuses and circuit breakers with overcurrent relay are adequate for the
SWER system and will operate very satisfactorily, especially if the SWER voltage is of the order of 19.1 kV.
Provided there are no immediate open wire communication circuits in the area, loads of up to 25 Amps are
quite achievable on a SWER system and by selecting ACSR conductor such as Walnut, 480 kVA load
capacity can be transferred 100 km at 10 percent volt drop. Single-phase motor loads should be restricted
to 22 kW.
Open wire communications can be affected by SWER, and if these are in the immediate vicinity, SWER load
currents should be restricted to 8 to 10 Amps.

362
SUB-SAHARAN AFRICA: INTRODUCING LOW-COST METHODS IN ELECTRICITY DISTRIBUTION NETWORKS
SWER has better reliability, lower capital costs and is easier to construct than either two-wire or three-wire
systems. It also has better voltage regulation and lower losses than two-wire, but is inferior in these respects
compared to three-wire.
If it is expected that loads will increase beyond the 25 Amp limitation of SWER within the foreseeable future,
consideration should be given to designing the pole construction and spacing for ease of upgrade to
two-wire or three-wire.
363
1. Drew, N.P. and Postlethwaite, D.J.: Single Wire Earth Return Distribution Systems – Economic Rural
Electrification.
2. Taylor, J. and Effeny, T.: Service Experiences With Single Wire Earth Return Distribution in Central
Queensland. 7th CEPSI 1988 Paper 3-64.
3. Harvey, J.L.W., Richardson, H.K. and Montgomery, I.B.: Single Wire Earth Return High Voltage
Distribution for Victorian Rural Areas.
4. Horsley, H.G.: High Voltage Earth Return System – A study of Economic Factors. MIE Aust.
5. Hoffman, B., Chief Engineer, Capricornia Electricity Board, Rockhampton, Australia: Rural Industry –
Technology in Developed and Developing Countries. “Rural Electrification in Australia – Queensland
in Particular”. May 3, 1988.
6. Mandeno Lloyd, B.E., MIEE: Rural Power Supply – Especially in Back Country Areas. NZIE Published
Proceedings, Vol 33, 1947.
7. Blackburn, R.F.: Medium Voltage Earth Return Distribution for Rural Electrification. Design Report to
PLN Nov 1993.
8. High voltage earth return distribution for rural areas. Fourth Edition. Issued by the Electricity Authority
of New South Wales-revised 1978.
9. Code of Practice for Earth Return High Voltage Power Lines, ESAA Issue 2, 1977.
10. The Current-loading Capacity of Earth Electrodes. IEE, Vol 77, 1935.
17. References

P
C1 C
PotentialElectrode CurrentElectrodeB A

P1 P2
C1 C2
aa a a
365
The following information and procedures should be adopted in the calculation and design of SWER earthing
systems:
Method of Measuring Soil Resistivity
ρ = 2πRa
Where: ρ = resistivity in ohm-metersR = measured resistance in ohmsa = distance between electrodes in meters
The depth of auxiliary electrodes should not exceed a/6 m.
Appendix 10 A
Earthing Design Data

366
SUB-SAHARAN AFRICA: INTRODUCING LOW-COST METHODS IN ELECTRICITY DISTRIBUTION NETWORKS
P
C1 C
Potential
Electrode
Current
Electrode
B
A
Method of Measuring Electrode Resistance
Resistance of electrode is read directly from instrument.
From this, it is possible to approximate the soil resistivity from the following:
ρ = 272 R l / (log10
400 l / d) x 100
Where: ρ = resistivity in ohm metersR = measured resistance of electrode in ohmsd = diameter of electrode in mm
l = length of electrode in meters
This method should only be used if the proper four terminal test equipment (as used in Method 1 above) is
not available.
Typical Values of Soil Resistivity
The following are typical soil resistivity values:
Type of Soil Ohm-meters
Clay and Soil 5-150
Chalk, Limestone 90-400
Sand and Gravel 100-3,000
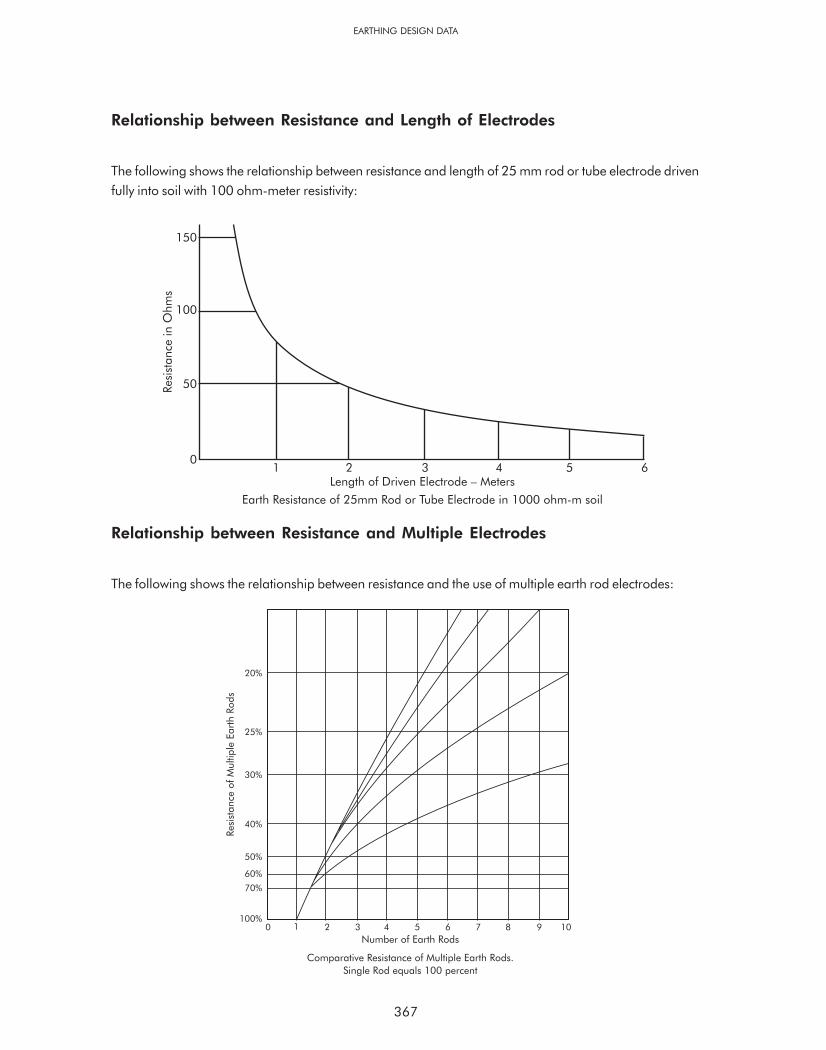
367
Relationship between Resistance and Length of Electrodes
The following shows the relationship between resistance and length of 25 mm rod or tube electrode driven
fully into soil with 100 ohm-meter resistivity:
Relationship between Resistance and Multiple Electrodes
The following shows the relationship between resistance and the use of multiple earth rod electrodes:
EARTHING DESIGN DATA


369
The value of SWER charging current for selected conductors can be calculated as follows:
Ich
= E L / Xg x 106
Where:Ich
= SWER charging current in AmpsE = SWER line-to-ground voltage in VoltsL = Line length in kmX
g= Line charging reactance in Mohm km= X
1 + X
3
Where:X
1= Charging reactance due to conductor GMR
X3
= Charging reactance due to GMD between conductor and return path.
Values for X1 and X
3 are as follows:
Conductor 16mm2 AAC 35mm2 AAC Raisin 18mm2GZ
X1
0.34 0.321 0.321 0.335
Average height of Meters
conductor above ground 6 7 8 9 10 12 14 16
X3
.142 .152 .159 .166 .172 .182 .191 .199
Appendix 10 B
Calculation of SWER Charging Current and Losses

The calculation of charging current and losses due to charging current will be subject to the voltage profile
of the SWER network which will vary according to demand and source voltage fluctuations at the SWER tap-
off point. In calculating SWER line losses due to charging current, it is sufficient for most purposes to use an
approximation as follows:
LLch
= 0.3 Ich
2 (Rc + R
t) watts
Where: LLch
= Line loss due to charging current in wattsIch
= SWER charging current at isolator transformer in AmpsR
c= Conductor resistance in ohms
Rt
= Transformer resistance in ohms
370
SUB-SAHARAN AFRICA: INTRODUCING LOW-COST METHODS IN ELECTRICITY DISTRIBUTION NETWORKS

John TullochTulloch Consulting LimitedNew Zealand
Annex 11
Single Wire Earth Returnas an Option forLow-cost Rural ElectrificationNew Zealand and Australia Experience


373
1. Introduction
During the 1940s, people in the more remote rural areas of New Zealand and Australia, began to demand
the same reliable distributed electrical power system which was enjoyed by almost everybody in the urban
areas. Not only was the convenience of power supply needed by these people but it was apparent that such
supply would bring economic benefits to the farming and associated rural industries and would help reduce
the growing trend for population drift from rural to urban regions.
At the time, both nations were very dependant on the agricultural industry for their wealth and it was
recognized by authorities and the governments that electrification in remote rural areas would improve the
productive output of farming and be of economic advantage to the population as a whole. The problem was
the high cost of both construction and maintenance for extending power distribution networks into these
remote areas.
The SWER power distribution system was first invented in New Zealand in 1925 by Lloyd Mandeno and
established in Tauranga and the Bay of Islands in 1930. By 1940, it was finally seen as the preferred
solution for the economic extension of power distribution networks into remote rural areas in both New
Zealand and Australia. Today, there is more than 200,000 km of SWER power lines spread throughout the
rural areas of both countries.
The advantages of SWER are its low initial capital cost, excellent level of reliability and low maintenance
cost. It is an economical solution for extending power supply into more sparsely populated, low-load density
areas. With over 70 years of experience, it is well proven and can justly be regarded as the “economic
enabler” for full-scale electrification of remote, sparsely populated rural areas.


375
2. SWER
SWER is basically a single-wire system using the ground as a return conductor.
A typical SWER configuration is as shown in Figure A 11.1:
The significant features are the isolator transformer at the tap-off from the backbone three-phase supply
and the earthing systems providing a return path from the single-phase distribution transformers to the
isolator transformer. It should also be noted that the LV earth at the distribution transformer is kept separate
from the HV SWER earth at the distribution transformer. The reclosers, surge arresters and dropout fuses
are standard simple protection as used in traditional systems.
Figure A 11.1: A Typical SWER Configuration
Single-phaseTransformer
12.7kV/240/0/240
Redoser Surge
Arrester
Drop Out
Fuse Switch
Surge
Arrester
Drop Out
Fuse Switch
22/12.7 kV Isolator Transformer
22 kV
240
0
240
To Other Transformers
240
0
240
Separate HV and LV Earths Separate HV and LV Earths


The advantages of SWER are:
• Reduced capital cost;
• Design simplicity;
• Ease of construction;
• Reduced maintenance cost; and
• Reduced bush fire hazard.
Reduced Capital Cost
The reduced capital cost stems from the fact that there is only one conductor. As a consequence, there is less
pole top equipment (no cross arm and only one insulator). Very long spans can be achieved thus requiring
fewer poles, insulators and other materials resulting in lower labor and material costs. In New Zealand it is
not uncommon to have spans well in excess of 1 km in length spanning from hilltop to hilltop.
Design Simplicity
By its nature, the design is very simple and does not lend any complexities. It is simply a single-wire system
supported on basic poles and with basic electrical protection. The only issue of any major concern in the
design is ensuring that low-resistance earths are achieved both at the isolator transformer and the distribution
transformers.
Ease of Construction
With only one wire and simple basic pole supports, construction could not be easier. Sagging and separation
of conductors is not an issue. Many of the SWER lines in New Zealand and Australia have been erected by
farmers with no previous experience in erecting power lines.
3. Advantages of SWER
377

378
SUB-SAHARAN AFRICA: INTRODUCING LOW-COST METHODS IN ELECTRICITY DISTRIBUTION NETWORKS
Reduced Maintenance Costs
SWER has less components than traditional systems and, hence, less things to go wrong. In addition, because
there is only one wire, there are no problems with line clashing and tree and vegetation management
problems are minimal. The only significant maintenance issue is the testing of earths. Isolator transformer
earths should be checked annually and distribution transformer earths on a three-year cycle basis. Experience,
especially in benign earthing conditions as found in New Zealand and non-desert areas of Australia, shows
that earth test results are seldom a concern.
Reduced Bush Fire Hazard
Most bush fires are caused through sparking as a result of conductor clashing. With only one conductor, this
does not occur. As described elsewhere, however, poor earthing conditions in semi-desert areas of Australia
have caused some pole fires at isolator transformers but this is much less likely to be cause for bush fires
than conductor clashing and, in fact, in bush fire prone places in Australia, SWER is a safer option than
two- or three-wire options.

379
The following factors were the prime motivators for the introduction of RE programs and the consequent
adoption of SWER in New Zealand and Australia.
• A significant rural sector without electrification and with low population and load densities;
• Consumer preparedness to electrify;
• A need to support population and industry decentralization;
• A need to support primary agricultural production;
• Political direction;
• Tight monetary policy within the power utility driving the need to minimize capital outlay and realize an
appropriate return on outlay;
• Capacity within the community to pay for rural development;
• Technical knowledge, manpower and plant capability to support RE policy and marketing initiatives;
and
• Positive rural load projections for initial load coupled with manageable load projections.
The above factors would apply anywhere where SWER is being considered as an option for low-cost RE.
4. Influencing Factors for SWER inNew Zealand and Australia


381
The SWER system was first invented by a New Zealander, Lloyd Mandeno, in 1925. Mr Mandeno was an
early pioneer in engineering power generation and transmission in New Zealand, and, at a time when most
others believed that because of the high costs, power distribution would be restricted to relatively densely
populated areas, he recognized the need to extend to remote, sparsely populated rural regions. His invention
of a power distribution system, isolated from the main supply by an isolator transformer (he called it an
insulating transformer) and operating through a single wire conductor with a return earth path, was an
enabler. At the time, he called it “Earth Working Single Wire Lines” and because it only had one wire, it got
nicknamed by the people as “Mandeno’s Clothesline”. The design of this system has remained virtually
unchanged since that time and the system is now known as SWER.
5. SWER Invention

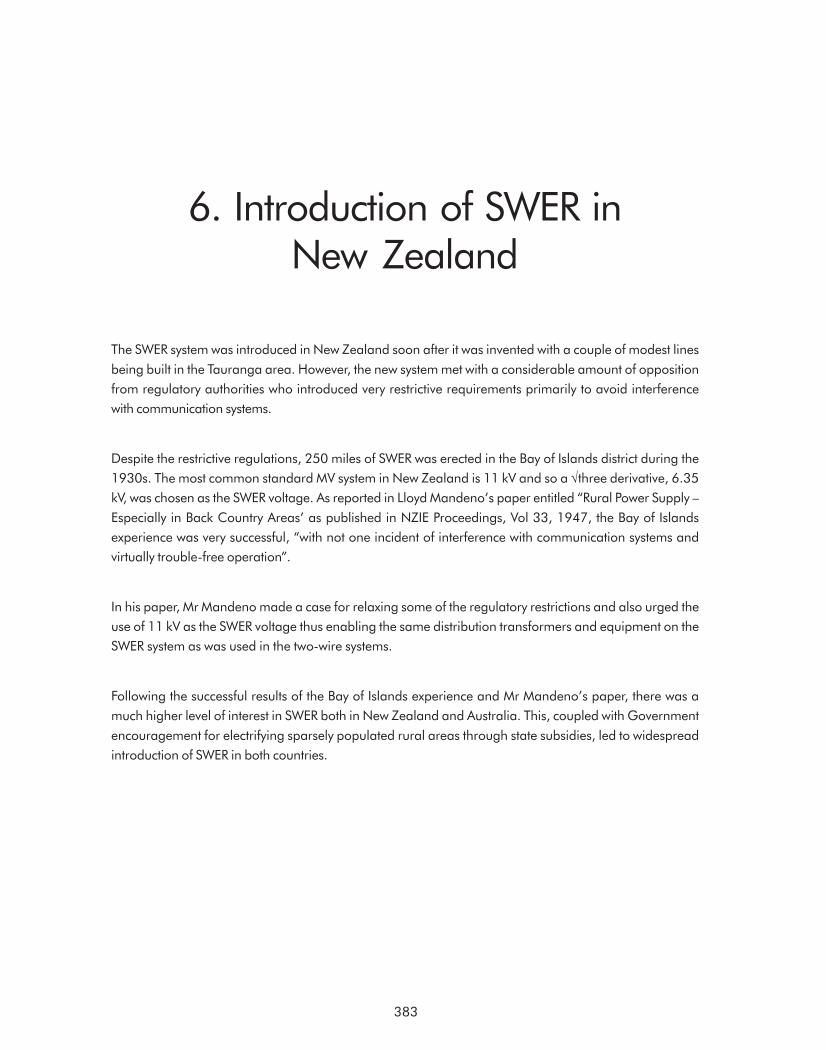
The SWER system was introduced in New Zealand soon after it was invented with a couple of modest lines
being built in the Tauranga area. However, the new system met with a considerable amount of opposition
from regulatory authorities who introduced very restrictive requirements primarily to avoid interference
with communication systems.
Despite the restrictive regulations, 250 miles of SWER was erected in the Bay of Islands district during the
1930s. The most common standard MV system in New Zealand is 11 kV and so a √three derivative, 6.35
kV, was chosen as the SWER voltage. As reported in Lloyd Mandeno’s paper entitled “Rural Power Supply –
Especially in Back Country Areas’ as published in NZIE Proceedings, Vol 33, 1947, the Bay of Islands
experience was very successful, “with not one incident of interference with communication systems and
virtually trouble-free operation”.
In his paper, Mr Mandeno made a case for relaxing some of the regulatory restrictions and also urged the
use of 11 kV as the SWER voltage thus enabling the same distribution transformers and equipment on the
SWER system as was used in the two-wire systems.
Following the successful results of the Bay of Islands experience and Mr Mandeno’s paper, there was a
much higher level of interest in SWER both in New Zealand and Australia. This, coupled with Government
encouragement for electrifying sparsely populated rural areas through state subsidies, led to widespread
introduction of SWER in both countries.
6. Introduction of SWER inNew Zealand
383


385
Most of the SWER reticulation in New Zealand is in high country sheep, beef and forestry farming areas and
electricity is used for shearing machines, pumping water, saw milling, welding, heating, lighting and household
and farming appliances. It also serves other small supporting industries and workshops in settlements
surrounded by the farms. The farming techniques are very mechanized and so a good and reliable electricity
supply is essential.
The terrain is generally hilly and rugged and, therefore, the SWER lines tend to traverse from hilltop to
hilltop with very long spans, many of them in excess of 1 km in length.
The lines generally follow the best topographical route for direct access with maximum span lengths and,
therefore, cross open farmland and may be quite distant from road access for maintenance purposes.
Again, this could well be a problem for two- or three-wire systems but because of the much lower maintenance
requirement, is of lesser concern for the single-wire system.
Many of the lines were actually erected by the farmers who would benefit from the supply. The power utility
provided the materials including poles, insulators and conductor, transported them to the general area and
advised where the poles were to be planted. Construction techniques are simple and the farmers had no
trouble erecting these lines. The power utilities then erected the isolator and distribution transformers,
installed the earthing and protection systems and commissioned the lines.
Generally, there is quite a high rainfall level in the New Zealand high country and, therefore, moist ground
conditions provide good earthing conditions, although this can sometimes be offset by rocky conditions just
below the ground level in some areas.
The rainfall and fertile soil conditions encourage rapid and dense tree and vegetation growth in many of the
SWER areas in New Zealand. This, coupled with difficult access, would prove to be a much bigger maintenance
problem for two-wire or three-wire systems than it is for the single-wire system.
7. Application of SWER inNew Zealand

386
SUB-SAHARAN AFRICA: INTRODUCING LOW-COST METHODS IN ELECTRICITY DISTRIBUTION NETWORKS
A range of different pole types have been used by different power utilities at different times and these
include railway iron, reinforced concrete, hardwood and treated softwood. The more recent installations
are treated softwood.
Initially, 3/12 steel conductor was commonly used. The strength of this conductor enabled long spans but it
does not have as good a conductivity as aluminum. Currently, the ACSR conductor is more commonly used.
This combines both strength and good conductivity. One of the more common conductors being used on
New Zealand SWER lines today is “Flounder” which is a smooth-bodied ACSR. “Magpie” and “Ferret” are
also commonly used conductors.
Initially, the voltage adopted for SWER lines was 6.35 kV which is a √three derivative of the 11 kV three-
phase MV system commonly used by New Zealand power utilities. Many of these still exist and it is the
preferred voltage where underground cables are required. Single core 11 kV insulated cables are then
used for the 6.35 kV SWER system. Currently, the more common SWER voltage in New Zealand is 11 kV
which is derived by interfacing the three-phase 11 kV system with an isolator transformer rated for 11kV
phase to phase on the primary side and 11 kV phase-to-ground on the SWER side. The adoption of 11 kV
as the SWER voltage means that the only non-standard items required are isolator transformers. Distribution
transformers, insulation and protection are all identical to the remainder of the traditional 11 kV system
employed by the power utility; 15 kV surge arresters are usually specified.
Porcelain and glass-type pin and disc insulators are commonly employed on New Zealand SWER systems,
but more recent installations have been with synthetic post-type insulators. The latter is the current main
preference. It is reported that some of the lower quality 11 kV porcelain insulators are starting to fail after
50 years of service although this has not been experienced with higher quality such as NGK insulators.
Although some of the SWER systems are strictly radial, most of them are radially inter-connectable. That is
they are able to be fed from both ends and have strategically located break points enabling sections to be
kept live whilst other sections are made dead for repairs.
Electrification of remote sparsely populated regions was virtually completed throughout New Zealand in the
1980s and there has been very little new SWER construction since then other than additional spurs to new
consumer premises.

387
8. The SWER Experience inNew Zealand
Overall, the SWER experience in New Zealand can be rated as a success. It has achieved what it set out to
do, i.e., provide a safe and reliable low-cost power supply to remote, sparsely populated rural areas. It has
been an enabler for modernizing farming and rural industries to make them economically viable despite
their remote locations. Today, these communities are thriving without any form of Government assistance or
subsidization and, in fact are significant contributors to the overall economy of the country.
Safety
Over the years, the SWER system has proved to be equally as safe as the traditional systems. There are no
reported accidents specific to SWER. To some extent, this has to be attributed to the extra care taken in
establishing the earthing systems so as to avoid dangerous step voltages.
Reliability
The reported overall reliability of the SWER systems in New Zealand is very high and, in fact, better than that
of the traditional systems despite their remoteness. This overall reliability is attributed to the simplicity of the
system with fewer parts. The advent of one-wire eliminates the clashing of conductors or foreign materials
such as tree branches, birds or animals bridging conductors with resultant shorting or mechanical strain.
Some problems with failure of poor quality insulators, after 50 years of service, have been reported. The
radially interconnected systems with strategically located break points, minimizes the number of consumers
affected by maintenance or fault repair works.
Earthing
All power utilities in New Zealand have been quite meticulous in conducting regular earth testing. Results
outside of specified limits are seldom found. Generally, this is attributed to the conservative approach taken
in initially establishing the earth banks with earth rods driven deeper than design criteria would require. Any
failures are generally attributable to the use of bolted connections (now an abandoned practice) or poor

388
SUB-SAHARAN AFRICA: INTRODUCING LOW-COST METHODS IN ELECTRICITY DISTRIBUTION NETWORKS
exothermic welding (often due to moisture content in the moulds). Most power utilities are now finding that
compression connections provide the best results.
Interference to Communications
Over the past 10 years, there have been no reported problems of interference from SWER to communications
systems in New Zealand. It is probable that there were no reported problems since well before then. This is
attributable to abidance to regulations which require SWER currents to be restricted to 8 Amps or less in the
vicinity of open wire communication circuits, but many power utility engineers believe that this regulation is
far more restrictive than it needs to be and should be reviewed. The advent of fiber optics cabling and radio
communication in favor of open wire systems means that interference with communication is not a major
consideration in the modern world.
Load Capacity
Design load capacity of 20 Amps is the norm in New Zealand except in the vicinity of open wire communication
circuits as mentioned above. Although the communities served by SWER in New Zealand are generally
thriving, there has not been much in the way of significant demand to upgrade to two- or three-wire.
Consumers have generally been happy to remain with single-phase motors and these do not pose major
problems with modern electronic starting circuits. There have been a few examples where consumers have
installed three-phase converters.
Capital Costs
Power utilities in New Zealand report that there is approximately 70 percent saving in capital costs by
building SWER lines rather than traditional three-wire, three-phase construction.
The capital cost saving is in the order of 50 percent when comparing SWER with two-wire, single-phase
construction.
Maintenance Costs
Although no formal records are kept, it is estimated by power utility engineers, spoken to in New Zealand,
that maintenance costs for SWER systems is approximately 50 percent of that required for traditional systems.

389
9. Application of SWER in Australia
Australia’s SWER systems generally supply dry farming areas where grazing and crop growing predominate
but also includes other energy-intensive agricultural activities such as dairying, fruit growing, poultry and pig
production.
Some of the terrain is good productive farmland whilst others are semi-desert.
Consumer densities are quite low and even in Victoria where densities are generally higher than in other
states, they average 1.3/route km in the predominantly dry farming areas and 1.7/route km for all types of
SWER areas. Energy sales average 6.3 MWHr/consumer/annum in the dry farming areas which is equivalent
to 8.1MWHr/km/annum. Energy sales for all types of SWER areas average 6.9 MWHr/consumer/annum
which is equivalent to 12 MWHr/km/annum.
The maximum demand on SWER systems supplying predominantly dry farming areas has grown at an
average of 4.3 percent per annum. This rate of growth has not necessitated a requirement for upgrade
from SWER to two- or three- wire systems. However, in areas where the land use has altered significantly
from traditional grazing and crop growing to vineyards, fruit growing or the intensive farming of poultry and
pigs, load growth has necessitated such conversion and some of this has occurred as early as 10 years after
the SWER was commissioned. When voltage control or overloading difficulties arise on SWER systems, the
usual practice is to erect a new three-phase distribution backbone through the affected area and divide the
SWER system up into a number of smaller SWER systems.
In general, SWER systems are installed when the rural area under consideration has both an initial loading
and an estimated loading for the next 10 years of less than 100 kVA.
As distinct from New Zealand, the terrain is generally flat to gently rolling and does not lend itself to hilltop
to hilltop spans. To obtain long spans, it is necessary to use high strength conductors and the normal practice
is to use 3/4/2.5 ACSR for the scheme “backbone” with 3/2.75 SC /GZ (galvanized steel) for tee offs and
lightly loaded sections. Spans of 300 m are common.

390
SUB-SAHARAN AFRICA: INTRODUCING LOW-COST METHODS IN ELECTRICITY DISTRIBUTION NETWORKS
A typical 19 kV SWER scheme has a 150 kVA isolator transformer with up to 80 10 kVA SWER distribution
transformers connected by 400 km of conductor. The most remote consumers may be 150 km from the
isolator transformer. The total impedance to the far end of a feeder may be of the order of 1,000 ohms.
The Electricity Supply Association of Australia (ESAA) recommends 12.7 kV as the standard operating
voltage for SWER systems in Australia, but 19 kV is also commonly used and in some places such as Central
Queensland there has been a policy to phase-out the 12.7 kV in favor of 19 kV to provide a better ratio of
fault-to-load current.
The large reduction in components required for SWER systems compared with two-wire single-phase systems
is reflected in reduced maintenance costs. Because of the danger of bush fires, a major maintenance cost
in Australia is the strict requirements for tree and vegetation clearance. The 25 percent reduction in line
easement widths possible with SWER construction reduces bush fire mitigation costs considerably.
Ensuring good earthing conditions is a major consideration in Australia. In most places, where SWER has
been installed, the climatic conditions are far from benign. Typically, the rainfall occurs over a relatively
short part of the year with dry conditions predominating for the remainder. Droughts may occur with below
average rainfall for many years. Ten-year droughts are not uncommon. Evaporation rates can be very high
and, in some areas, can be in the order of 40 to 100 mm per week for three to five months of the year.
Consequently, soil conditions are alternatively wet and then thoroughly dried out. Weather conditions are
often dry before and during the peak load periods. These conditions are not ideal for good, consistent
earthing and have created some problems, particularly with regard to pole fires at isolator transformers.
Generally, hardwood poles have been used on SWER systems in Australia, although more recently a shortage
of suitable timber poles, changes in the relative prices of timber and concrete poles and environmental
factors have led to a broader use of steel-reinforced spun concrete poles. The use of concrete poles on
SWER lines is usually restricted to line poles downstream of an automatic circuit recloser to ensure that any
faults occurring on these conducting structures are reliably and quickly disconnected.
The dry ground conditions can result in high impedance earth faults which are difficult to detect on SWER
systems as they are often seen by protective devices as an increase in load current. For this reason,
extensive use is made of fuses on the SWER distribution systems. Each distribution transformer and each
SWER tee off or SWER spur line is fused using a sparkless fuse link in an Expulsion Drop Out style fuse
mount fitted with an anti-fire device.
High incidence of lightning can also be a problem in Australia, therefore, silicon carbide-type surge diverters
with pressure relief and earth-lead disconnect device are mounted as near as possible to the distribution
transformer HV bushing.

391
Standard 22 kV and 33 kV disc and post type insulators are used on the 12.7 kV and 19 kV SWER systems
respectively.
SWER systems in Australia are almost exclusively radial in nature and, thus, supply interruptions tend to
affect large numbers of consumers for protracted periods of time due to the long line distances and isolated
locations. As the majority of faults are transient in nature, use of automatic circuit reclosers and line sectionalizers
is a common practice thereby minimizing the duration of outage and restricting the number of consumers
affected.
Electrification of remote areas in Australia within the reach of the power grids via SWER systems was
virtually completed in the 1980’s and there has been very little new SWER construction since then.
ANNEX 11: APPLICATION OF SWER IN AUSTRALIA


Overall the SWER experience in Australia can be rated as a success and has enabled the provision of a safe
and reliable low-cost power supply to sparsely populated outback areas many hundreds of miles from
populated towns. The significant differences in the Australian experience, as compared to New Zealand
relate mainly to the much drier conditions with the consequent earthing problems, the much greater distances
to be traversed and the much flatter terrain.
All the problems associated with the above differences have been adequately addressed and implemented
by the power utility engineers resulting in safe, reliable and economic SWER systems throughout the outback
areas of Australia.
Earthing
Earthing problems relating to dry ground conditions for extended periods of time have been cause for
concern in Australia. The immediate problem was isolator transformer pole burndown. From investigations
of failure sites and review of basic earthing requirements and technologies, an understanding of the problem
readily emerged. The solution was to always keep the earthing system moist, of adequate dimension and
constructed of durable materials designed to carry the continuous required load current. The solution, in
such locations, was to:
• Drill a vertical hole with a diameter of approximately 100 mm into the ground until a substantial band
of moist soil was encountered;
• Drill into this moist band for 6 m;
• Lower a copper electrode (32 mm x 3 mm flat copper strap) into the hole; and
• Fill with a mixture of betonite and gypsum.
It should be noted that this is only required at isolator transformer locations where other methods of earthing
cannot obtain the low resistance of 1 ohm required.
10. SWER Experience in Australia
393

394
SUB-SAHARAN AFRICA: INTRODUCING LOW-COST METHODS IN ELECTRICITY DISTRIBUTION NETWORKS
It was also found that bolted earth at distribution transformers needed to be replaced with compression
joints.
Safety
As in New Zealand, the SWER systems in Australia have proved to be equally safe as the traditional systems.
In some of the areas, poor earthing conditions, have in the past led to initiate steps proving to be a potential
danger to livestock. However, this has been addressed by measures such as deep-drilled electrodes as
mentioned above.
Reliability
Apart from some earthing problems as outlined above, the reported overall reliability of the SWER systems
in Australia is as good as New Zealand and better than that of the traditional systems. Initially, a high
incidence of lightning strikes was reported, but this was overcome by installing surge arresters at each
distribution transformer. The Australian systems are radial and very long in length and, therefore,
auto-reclosers and section isolators are used to minimize the magnitude and duration of outages. Many of
the faults were found to be transient and full power was restored after the operation of the auto-reclosers.
Interference to Communication
As with New Zealand, communication interference has not emerged as a major problem.
Load Capacity
In Australia, the maximum 8 Amp load requirement to avoid communications interference has been widely
adhered to although there is good reason to doubt the need for such restriction in the modern communication
era. With the 8 Amp restriction, the following loadings are achieved using 3/12 steel wire conductor.
Item 12.7 kV 19.0 kV
Load Capacity (kW miles) 440 900
kVA Loading 102 152
This has proved satisfactory in the Australian context of serving the outback regions.

395
Capital Costs
Power utilities in Australia report that there is approximately 50 percent saving in capital costs by building
SWER lines rather than traditional two-wire, single-phase construction.
This is comparable with the reported New Zealand savings.
Maintenance Costs
There do not appear to be any confirmed records of maintenance costs for SWER systems in Australia, but
power utility engineers confirm that SWER maintenance costs are substantially lower than that of traditional
construction.
ANNEX 11: SWER EXPERIENCE IN AUSTRALIA


397
With over 70 years of experience in New Zealand and Australia, the SWER system has been well proven.
It can justly be regarded as the “economic enabler” for full-scale electrification of remote, sparsely populated
rural areas.
SWER is basically a single wire system using the ground as a return conductor.
The advantages of SWER are its low initial capital cost, design simplicity, ease of construction, excellent level
of reliability and low maintenance costs. Long spans can be achieved reducing the quantities of poles,
insulators and other materials required. As a consequence, both labor and material costs are considerably
lower than that of traditional systems. It is an economical solution for extending power supply into more
sparsely populated, low-load density areas.
In Australia, it has proven to be less of a bush fire hazard than the traditional two-wire and three-wire
systems because clashing of conductors is not possible.
Most of the SWER reticulation in New Zealand is in high country sheep, beef and forestry farming areas and
electricity is used for pumping water, shearing machines, saw milling, welding, heating, lighting and household
and farming appliances. It also serves other small supporting industries and workshops in settlements
surrounded by the farms.
Australia’s SWER systems generally supply dry farming areas where grazing and crop growing predominate,
but also includes other energy-intensive agricultural activities such as dairying, fruit growing, poultry and pig
production. Some of the terrain is good productive farmland whilst others are semi-desert.
Maintenance of consistent low-resistance earthing systems is an important requirement for SWER systems
both in terms of performance and safety.
Generally, there is quite a high rainfall level in the New Zealand high country and, therefore, moist ground
conditions provide good earthing conditions although this can sometimes be offset by rocky conditions just
11. Summary

398
SUB-SAHARAN AFRICA: INTRODUCING LOW-COST METHODS IN ELECTRICITY DISTRIBUTION NETWORKS
below ground level in some areas. Earthing problems have not featured as a significant issue in the New
Zealand experience. However, a conservative approach has been taken and it has been a general practice
to drive earth electrode rods deeper than design considerations would require so as to ensure that
future-drying-out and-consequent-failure-mode does not occur.
Earthing problems relating to dry ground conditions for extended periods of time have been cause for
concern in Australia. In some cases, high impedance earthing conditions at isolator transformers has led to
pole burndown. From investigations of failure sites and review of basic earthing requirements and
technologies, an understanding of the problem readily emerged. The solution was to always keep the
earthing system moist through deep drilling and to specify earth electrodes of adequate dimensions and
constructed of durable materials designed to carry the continuous required load current. It was also found
that bolted earths at distribution transformers needed to be replaced with compression joints.
Electrification of remote sparsely populated regions using SWER was virtually completed throughout New
Zealand and Australia in 1980 and there has been very little new SWER construction since then other than
additional spurs to new consumer premises.
Overall, the SWER experience in New Zealand and Australia can be rated as a great success. It has
achieved what it set out to do i.e., provide a safe and reliable low-cost power supply to remote, sparsely
populated rural areas. It has been an enabler for modernizing farming and rural industries to make them
economically viable despite their remote locations.
Over the years, the SWER system has proved to be equally safe as the traditional systems.
The reported overall reliability of the SWER systems is very high and, in fact, better than that of the traditional
two-wire or three-wire systems despite their remoteness.
Interference to communication systems has not proven to be a significant problem in New Zealand or
Australia, but this is probably attributable to abidance to regulations which require SWER currents to be
restricted to 8 Amps or less in the vicinity of open wire communication circuits. Today, many power utility
engineers believe that this regulation is far more restrictive than it needs to be and should be reviewed. The
advent of fiber optics cabling and radio communication in favor of open wire systems means that interference
with communication is not a major consideration in the modern world.
The New Zealand and Australian experience shows that capital costs for construction of SWER systems are
approximately 30 percent of the traditional three-wire, three-phase construction and 50 percent of
two-wire single-phase construction.
The New Zealand and Australian experience also shows that maintenance costs for SWER systems are
estimated to be approximately 50 percent of those required for the traditional systems.

399
1. Drew, N.P. and Postlethwaite, D.J.: Single Wire Earth Return Distribution Systems – Economic Rural
Electrification.
2. Taylor, J. and Effeny, T.: Service Experiences with Single Wire Earth Return Distribution in Central
Queensland. 7th CEPSI 1988 Paper 3-64.
3. Harvey, J.L.W., Richardson, H.K. and Montgomery, I.B.: Single Wire Earth Return High Voltage
Distribution for Victorian Rural Areas.
4. Horsley, H.G.: High Voltage Earth Return System – A study of Economic Factors. MIE Aust.
5. Hoffman, B., Chief Engineer, Capricornia Electricity Board, Rockhampton, Australia: Rural Industry –
Technology in Developed and Developing Countries. “Rural Electrification in Australia – Queensland
in Particular”. May 3, 1988.
6. Mandeno Lloyd, B.E., MIEE: Rural Power Supply – Especially in Back Country Areas. NZIE Published
Proceedings , Vol 33, 1947.
7. Blackburn, R.F.: Medium Voltage Earth Return Distribution for Rural Electrification. Design Report to
PLN Nov 1993.
8. High Voltage Earth Return Distribution for Rural Areas. Fourth Edition. Issued by the Electricity Authority
of New South Wales – revised 1978.
9. Code of Practice for Earth Return High Voltage Power Lines, ESAA Issue 2 1977.
10. The Current-Loading Capacity of Earth Electrodes. IEE, Vol.77, 1935.
12. References


List of Technical Paper Series
Region/Country Activity/Report Title Date Number
SUB-SAHARAN AFRICA (AFR)
Africa Power Trade in Nile Basin Initiative Phase II (CD Only): 04/05 067/05Part I: Minutes of the High-level Power ExpertsMeeting; and Part II: Minutes of the First Meeting of the NileBasin Ministers Responsible for Electricity
Cameroon Decentralized Rural Electrification Project in Cameroon 01/05 087/05Chad Revenue Management Seminar. Oslo, June 25-26, 2003. (CD Only) 06/05 075/05Côte d’Ivoire Workshop on Rural Energy and Sustainable Development, 04/05 068/05
January 30-31, 2002. (French Only)Ethiopia Phase-Out of Leaded Gasoline in Oil Importing Countries of 12/03 038/03
Sub-Saharan Africa: The Case of Ethiopia - Action Plan.Sub-Saharan Petroleum Products Transportation Corridor: Analysis 03/03 033/03and Case StudiesPhase-Out of Leaded Gasoline in Sub-Saharan Africa 04/02 028/02Energy and Poverty: How can Modern Energy ServicesContribute to Poverty Reduction 03/03 032/03
East Africa Sub-Regional Conference on the Phase-Out Leaded Gasoline in 11/03 044/03East Africa. June 5-7, 2002.
Ghana Poverty and Social Impact Analysis of Electricity Tariffs 12/05 088/05Women Enterprise Study: Developing a Model for Mainstreaming 03/06 096/06Gender into Modern Energy Service DeliveryGhana: Sector Reform and the Pattern of the Poor 03/06 097/06Energy Use and Supply
Kenya Field Performance Evaluation of Amorphous Silicon (a-Si)Photovoltaic Systems in Kenya: Methods and Measurementin Support of a Sustainable Commercial Solar Energy Industry 08/00 005/00The Kenya Portable Battery Pack Experience: TestMarketing an Alternative for Low-Income Rural HouseholdElectrification 12/01 05/01
Malawi Rural Energy and Institutional Development 04/05 069/05Mali Phase-Out of Leaded Gasoline in Oil Importing Countries of 12/03 041/03
Sub-Saharan Africa: The Case of Mali - Action Plan. (French)Mauritania Phase-Out of Leaded Gasoline in Oil Importing Countries of 12/03 040/03
Sub-Saharan Africa: The Case of Mauritania - Action Plan. (French)Nigeria Phase-Out of Leaded Gasoline in Nigeria 11/02 029/02
Nigerian LP Gas Sector Improvement Study 03/04 056/04Taxation and State Participation in Nigeria’s Oil and Gas Sector 08/04 057/04
Regional Second Steering Committee: The Road Ahead. Clean Air Initiativein Sub-Saharan African Cities. Paris, March 13-14, 2003 12/03 045/03
401

402
SUB-SAHARAN AFRICA: INTRODUCING LOW-COST METHODS IN ELECTRICITY DISTRIBUTION NETWORKS
Regional Lead Elimination from Gasoline in Sub-Saharan Africa. Sub-RegionalConference of the West-Africa Group. Dakar, SenegalMarch 26-27, 2002. (French Only) 12/03 046/031998-2002 Progress Report. The World Bank Clean Air Initiative 02/02 048/04in Sub-Saharan African Cities. Working Paper #10(Clean Air Initiative/ESMAP)Landfill Gas Capture Opportunity in Sub-Saharan Africa 06/05 074/05The Evolution of Enterprise Reform in Africa: From 11/05 084/05State-owned Enterprises to Private Participation in Infrastructure— and Back?
Senegal Regional Conference on the Phase-Out of Leaded Gasoline inSub-Saharan Africa 03/02 022/02Elimination du Plomb dans I’Essence en Afrique Sub-SaharienneConference Sous Regionales du Groupe Afrique de I’Quest. Dakar,Senegal. March 26-27, 2002. 12/03 046/03Alleviating Fuel Adulteration Practices in the DownstreamOil Sector in Senegal 09/05 079/05
South Africa South Africa Workshop: People’s Power Workshop 12/04 064/04Swaziland Solar Electrification Program 2001-2010: Phase 1: 2001-2002
(Solar Energy in the Pilot Area) 12/01 019/01Tanzania Mini Hydropower Development Case Studies on the Malagarasi,
Muhuwesi, and Kikuletwa Rivers Volumes I, II, and III 04/02 024/02Phase-Out of Leaded Gasoline in Oil Importing Countries of 12/03 039/03Sub-Saharan Africa: The Case of Tanzania — Action Plan.
Uganda Report on the Uganda Power Sector Reform and RegulationStrategy Workshop 08/00 004/00
WEST AFRICA (AFR)Regional Market Development 12/01 017/01
EAST ASIA AND PACIFIC (EAP)
Cambodia Efficiency Improvement for Commercialization of the PowerSector 10/02 031/02TA For Capacity Building of the Electricity Authority 09/05 076/05
China Assessing Markets for Renewable Energy in Rural Areas ofNorthwestern China 08/00 003/00Technology Assessment of Clean Coal Technologies for ChinaVolume I — Electric Power Production 05/01 011/01Technology Assessment of Clean Coal Technologies for ChinaVolume II — Environmental and Energy Efficiency Improvementsfor Non-Power uses of Coal 05/01 011/01Technology Assessment of Clean Coal Technologies for ChinaVolume III — Environmental Compliance in the Energy Sector:Methodological Approach and Least-Cost Strategies 12/01 011/01Shanghai: Developing a Green Electricity Scheme 09/06 105/06
Philippines Rural Electrification Regulation Framework. (CD Only) 10/05 080/05Thailand DSM in Thailand: A Case Study 10/00 008/00
Development of a Regional Power Market in the Greater MekongSub-Region (GMS) 12/01 015/01
Vietnam Options for Renewable Energy in Vietnam 07/00 001/00Renewable Energy Action Plan 03/02 021/02Vietnam’s Petroleum Sector: Technical Assistance for the Revision 03/04 053/04of the Existing Legal and Regulatory Framework
Region/Country Activity/Report Title Date Number

403
SOUTH ASIA (SAS)
Bangladesh Workshop on Bangladesh Power Sector Reform 12/01 018/01Integrating Gender in Energy Provision: The Case of Bangladesh 04/04 054/04Opportunities for Women in Renewable Energy Technology Use 04/04 055/04in Bangladesh, Phase I
EUROPE AND CENTRAL ASIA (ECA)
Russia Russia Pipeline Oil Spill Study 03/03 034/03Uzbekistan Energy Efficiency in Urban Water Utilities in Central Asia 10/05 082/05
MIDDLE EASTERN AND NORTH AFRICA REGION (MENA)
Regional Roundtable on Opportunities and Challenges in the Water, Sanitation 02/04 049/04and Power Sectors in the Middle East and North Africa RegionSummary Proceedings, May 26-28, 2003. Beit Mary, Lebanon. (CD)
Morocco Amélioration de d´Efficacité Energie: Environnement de la ZoneIndustrielle de Sidi Bernoussi, Casablanca 12/05 085/05
LATIN AMERICA AND THE CARIBBEAN REGION (LCR)
Brazil Background Study for a National Rural Electrification Strategy: 03/05 066/05Aiming for Universal AccessHow do Peri-Urban Poor meet their Energy Needs: A Case Studyof Caju Shantytown, Rio de Janeiro 02/06 094/06
Bolivia Country Program Phase II: Rural Energy and Energy Efficiency 05/05 072/05Report on Operational Activities
Chile Desafíos de la Electrificación Rural 10/05 082/05Ecuador Programa de Entrenamiento a Representantes de Nacionalidades
Amazónicas en Temas Hidrocarburíferos 08/02 025/02Stimulating the Picohydropower Market for Low-IncomeHouseholds in Ecuador 12/05 090/05
Guatemala Evaluation of Improved Stove Programs: Final Report of Project 12/04 060/04Case Studies
Honduras Remote Energy Systems and Rural Connectivity: TechnicalAssistance to the Aldeas Solares Program of Honduras 12/05 092/05
Mexico Energy Policies and the Mexican Economy 01/04 047/04Technical Assistance for Long-Term Program for RenewableEnergy Development 02/06 093/06
Nicaragua Aid-Memoir from the Rural Electrification Workshop (Spanish Only) 03/03 030/04Sustainable Charcoal Production in the Chinandega Region 04/05 071/05
Regional Regional Electricity Markets Interconnections — Phase IIdentification of Issues for the Development of RegionalPower Markets in South America 12/01 016/01Regional Electricity Markets Interconnections — Phase IIProposals to Facilitate Increased Energy Exchanges in SouthAmerica 04/02 016/01Population, Energy and Environment Program (PEA)Comparative Analysis on the Distribution of Oil Rents(English and Spanish) 02/02 020/02Estudio Comparativo sobre la Distribución de la Renta PetroleraEstudio de Casos: Bolivia, Colombia, Ecuador y Perú 03/02 023/02Latin American and Caribbean Refinery Sector DevelopmentReport – Volumes I and II 08/02 026/02The Population, Energy and Environmental Program (EAP)
Region/Country Activity/Report Title Date Number
LIST OF TECHNICAL PAPER SERIES

(English and Spanish) 08/02 027/02Regional Bank Experience in Non-Energy Projects with Rural Electrification 02/04 052/04
Components: A Review of Integration Issues in LCRSupporting Gender and Sustainable Energy Initiatives in 12/04 061/04Central AmericaEnergy from Landfill Gas for the LCR Region: Best Practice and 01/05 065/05Social Issues. (CD Only)Study on Investment and Private Sector Participation in Power 12/05 089/05Distribution in Latin America and the Caribbean Region
GLOBAL
Impact of Power Sector Reform on the Poor: A Review of Issuesand the Literature 07/00 002/00Best Practices for Sustainable Development of Micro HydroPower in Developing Countries 08/00 006/00Mini-Grid Design Manual 09/00 007/00Photovoltaic Applications in Rural Areas of the Developing World 11/00 009/00Subsidies and Sustainable Rural Energy Services: Can we CreateIncentives without Distorting Markets? 12/00 010/00Sustainable Woodfuel Supplies from the Dry Tropical Woodlands 06/01 013/01Key Factors for Private Sector Investment in Power Distribution 08/01 014/01Cross-Border Oil and Gas Pipelines: Problems and Prospects 06/03 035/03Monitoring and Evaluation in Rural Electrification Projects: 07/03 037/03A Demand-Oriented ApproachHousehold Energy Use in Developing Countries: A Multicountry Study 10/03 042/03Knowledge Exchange: Online Consultation and Project Profile 12/03 043/03from South Asia Practitioners Workshop. Colombo, Sri Lanka,June 2-4, 2003Energy & Environmental Health: A Literature Review and 03/04 050/04RecommendationsPetroleum Revenue Management Workshop 03/04 051/04Operating Utility DSM Programs in a Restructuring Electricity Sector 12/05 058/04Evaluation of ESMAP Regional Power Trade Portfolio (TAG Report) 12/04 059/04Gender in Sustainable Energy Regional Workshop Series: 12/04 062/04Meso-American Network on Gender in Sustainable Energy(GENES) Winrock and ESMAPWomen in Mining Voices for a Change Conference. (CD Only) 12/04 063/04Renewable Energy Potential in Selected Countries: Volume I: 04/05 070/05North Africa, Central Europe, and the Former Soviet Union,Volume II: Latin AmericaRenewable Energy Toolkit Needs Assessment 08/05 077/05Portable Solar Photovoltaic Lanterns: Performance and 08/05 078/05Certification Specification and Type ApprovalCrude Oil Prices Differentials and Differences in Oil Qualities:A Statistical Analysis 10/05 081/05Operating Utility DSM Programs in a Restructuring Electricity Sector 12/05 086/05Sector Reform and the Poor: Energy Use and Supply in Four 03/06 095/06Countries: Botswana, Ghana, Honduras, and Senegal
Region/Country Activity/Report Title Date Number
404
SUB-SAHARAN AFRICA: INTRODUCING LOW-COST METHODS IN ELECTRICITY DISTRIBUTION NETWORKS


Energy Sector Management Assistance Program (ESMAP)1818 H Street, NWWashington, DC 20433 USATel: 1.202.458.2321Fax: 1.202.522.3018Internet: www.worldbank.org/esmapE-mail: [email protected]
Energy Sector Management Assistance Program
Sub-Saharan Africa:Introducing Low-cost Methods inElectricity Distribution Networks
ESMAP Technical Paper 104/06October 2006
Sub-S
ahara
n A
frica: In
troducin
g Lo
w-co
st Meth
ods in
Ele
ctricity D
istributio
n N
etw
ork
sTe
chnica
l Paper 1
04/0
6