studying different scenarios of operating air …
TRANSCRIPT

El-Helw, M., et al.: Studying Different Scenarios of Operating Air Conditioning ... THERMAL SCIENCE: Year 2018, Vol. 22, No. 6B, pp. 2973-2986 2973
STUDYING DIFFERENT SCENARIOS OF OPERATING AIR CONDITIONING SYSTEM IN SMOKE MANAGEMENT USING
COMPUTATIONAL FLUID DYNAMIC IN NAVAL SHIPS
by
Mohamed El-HELW a*, Mohamed FAYED a,b, and Adel El-SHOBAKY a
a Mechanical Engineering Department, Faculty of Engineering, Alexandria University, Alexandria, Egypt
b Mechanical Department, College of Engineering and Technology, American University of the Middle East, Eqaila, Kuwait
Original scientific paper https://doi.org/10.2298/TSCI170211123E
Since the dawn of history maritime transport was an essential part of human com-munication and development which mandates the rapid development of the ship industry. It was accompanied by disasters caused by several factors among them fire played an important role. Fire can cause structural damage which affects ship safety and smoke which is life threating to passengers and ship crow. Trapped smoke in ship compartments if not ventilated or released can reach higher tempera-tures leading to flashover situation which enable fire propagation. The FLUENT CFD calculations were performed to analyze smoke generation and propagation in closed ship compartments. The time to reach flashover is also calculated. Based on how sealed and tight the compartment is three different scenarios where studied in this analysis: running air-condition while compartment door is open, stopped air-condition while compartment door is closed, and finally running air-condition while compartment door is closed. The calculations show that, the last scenario which incorporates modified running air-condition scheme to mitigate smoke was the best scenario.Key words: CFD, smoke management, pressurization, HVAC
Introduction
Many ships were lost by fire [1-3]. Fleet loss experience indicates that, fire caused more damage than grounding, commission or flooding. In shipboard fires, smoke often flows to locations remote from the fire, threatening life and damaging property. Smoke is also blocking evacuation routes and inhibiting rescues and firefighting. Experience indicated that steel ships might become floating furnaces fed by combustible material carried on board. Some ships be-came blazing infernos, which had to be abandoned and later sunk by their own forces because fires grew out of control [4]. Smoke is a visible product of fire that adds to the problem of breathing, it is made up of carbon and other unburned substances in the form of suspended particles. It also carries the water vapor, acids and other chemicals, which may be poisonous or irritating when inhaled. Smoke is defined referring to NFPA 29 A definition, as (smoke consists of the airborne solid liquid particulate and gases evolved when a material undergoes pyrolysis combustion, together with the quantity of air that is entrained or otherwise mixed into the
* Corresponding author, e-mail: [email protected]

El-Helw, M., et al.: Studying Different Scenarios of Operating Air Conditioning ... 2974 THERMAL SCIENCE: Year 2018, Vol. 22, No. 6B, pp. 2973-2986
mass). The products of combustion usually include particulate, unburned fuel, water vapor, CO2, CO, and some other toxic and corrosive gases [5]. Exposure to toxic gases and elevated temperature is a direct hazard to life, but reduced visibility due to smoke obscuration can be a significant indirect hazard. Frequently, people become disoriented in fire situation because they cannot through heavy smoke. If they remain in the ship too long, they will fall victims to expo-sure to toxic gases or elevated temperature. Smoke is not only recognized as the major killer in fire situation, but also could cause the ship to sink, when it is impossible for fire fighters to reach the seat of the due to heavy smoke. So they direct the water hose steams onto the other parts of a ship at which smoke is coming out, the water will affect the stability of the ship and eventual-ly sink if not stopped. Historically, fire safety professionals have considered the HVAC system as potentially dangerous penetration of ship structural membranes (decks, bulkheads and so firth) that can readily transport smoke and fire [6]. In addition, the recalculating fans spread smoke and hot gasses to uncontaminated spaces, confusing the firefighters while searching the origin of the fire, which delaying fire extinguish process which contributes to the fire getting out of control which endangers the ship and lives of those on board. The fire prevention engineer knows little about the design and operation of air conditioning (A/C) system. However, with the people design and planning, the potential fire hazard associated with A/C could be minimized and extensively eliminated such that loss of life caused by smoke propagation could be prevent-ed. In the early stages of a fire, the HVAC system can aid in fire detection, when a fire starts in an unoccupied portion of a ship, the system can transport the smoke to a space where crew members can smell it and be alerted to the fire. However, as the fire progresses, the HVAC sys-tem transports smoke to every area it serves, thus endangering life in all those spaces. The HVAC system also supplies air to the fire space, which aids combustion. Although securing the HVAC system prevents it from supplying air to the fire, it does not prevent smoke movement through, supply and return ducts and hatch openings due to stack effect or buoyancy. Also the air tightness of air conditioned ships, the smoke has no way to go except rises toward high parts of the ship which may cause an explosion if not vented or released. Smoke management sys-tems are defined as engineered systems that include all methods that can be used singly or in combination to reduce smoke production or to modify smoke movement for the benefit of oc-cupants or firefighters or for the reduction of the property damage [7]. Smoke control has been a concern of humans since fire was discovered and brought inside for warmth and cooking. Using trial and error, chimneys, flues, and fireplaces were invented to control smoke. Concerns about smoke in building fires did not get much additional attention until a series of high-rise fires in the 1960. A significant issue was the spread of smoke caused by stack effect and by HVAC system operation. Tamura [8] published the significant paper (computer analysis of smoke movement in tall building) which changed the subject of smoke movement in buildings from an art to a science. This work became a cornerstone in the development of smoke control for buildings in the next 25 years (1969-1994). Rhodes [9] reviewed the mathematical and physical basic of filed models used for fire and smoke movement prediction and their applica-tions to a number of experimental situations for which validation data were available. McCabe [10] covered the generic damper and fan component settings to establish the proper pressure, purge, or containment effect in and for the various fire conditions. Tamura and Macdonald [11], evaluated the performances of the mechanical smoke exhaust system, zoned smoke control, and pressurized building method of smoke control under non-fire conditions. Over time large vol-ume spaces such as shopping malls and atria became popular, requiring additional smoke man-agement considerations. High rise and atrium buildings have emphasized the need for sophisti-cated methods of smoke control or smoke management. Borresen and Madsen [12],

El-Helw, M., et al.: Studying Different Scenarios of Operating Air Conditioning ... THERMAL SCIENCE: Year 2018, Vol. 22, No. 6B, pp. 2973-2986 2975
demonstrated aspects of the plume model and how it was modified to take account of high rack storage. A very interesting aspect was how the smoke layer temperature affects the smoke vent size, which simplified the vent design. Webb [13] introduced more current work concerning atria and other large spaces, including covered malls. Clark and Buckley [14] applied both physical and numerical modeling techniques to atrium smoke exhaust systems to investigate the effectiveness of such systems and to develop guidelines for their design. The NFPA92B added a predictive correlation that generated a smoke layer interface position at any given time. Co-meau [15] described and analyzed the fire, which occurred in English channel tunnel. Silas and Kennedy [16] analyzed the ventilation performance in stations of the Buenos Aires motor sub-way system, by using CFD method. Xie [17] investigated and studied the heavy compressed air foam truck has advantages in the high-rise building’s firefighting and fire services department has devoted major efforts to increase the numbers of this fire truck. This thesis tries to contrib-ute to the laying down of combat formation and achieving a perfection combination of person-nel and equipment so as to provide certain scientific basis for decision-making in the smooth operation of fire-fighting, fire-rescuing, and disposal work. Besides, it can contribute to the improvement of the ability to put out fire in high-rise building. Shu-Chao et al. [18] studied experimentally, an extended floor field model is proposed to simulate the pedestrian evacuation in a room by considering the smoke and fire effect under fire emergency. Through the numerical simulations, the influence of fire locations, type of burning materials, heat release rates, and exit width on evacuation are analyzed. The results show these factors have great effects on evacua-tion, which may be useful to understand the pedestrian evacuation under fire emergency. Meroney et al. [19] analyzed the ventilation performance and smoke movement in a large mil-itary firing range by using CFD method. Computations were performed for existing configura-tions of supply and exhaust vents, barriers and doors to compare with actual flow measurements made within the range. The numerical model was found to represent the existing flows quite well, so the model was then used to investigate alternate flow configurations. Apelian et al. [20] used probabilistic methods and computer simulation to analyze streamlines properties of turbu-lent flow for a class of random velocity fields in the plane. Also Zheng et al. [21] described a novel approach in simulating laminar to turbulent transition by using two-equation models.
In this paper, smoke problem and its propagation due to HVAC system operation will be first discussed. The smoke layers temperature and their effects on the fire compartment will be studied. Brief descriptions of smoke management systems (SMS) at different applications are addressed to explain the theory, design and determine the limitations for each application. Fires of naval ships and their quick spread due to hear and smoke propagation are our concern. Ship construction and its A/C systems are addressed to propose a new smoke management and suppression system on naval ships. Finally the proposed SMS will be compared with the con-ventional systems.
Numerical technique and case study
To assess the different scenarios of using A/C system of a ship in SMS, the smoke velocity and temperature need to be determined. The smoke flow developed is assumed to be compressible, turbulent and multi-component flow. The mathematical representation of the present problem follows the usual approach, in which the phenomenon is supposed to be de-scribed by the full conservation equations of continuity, momentum and energy together with the transport equations for the RNG k-ε that are required to close the system. The mathematical modeling and solution methodology of the present problem was done using the Airpack 3.0 approach [22]. No alterations to the original code, including the values of all coefficients, were

El-Helw, M., et al.: Studying Different Scenarios of Operating Air Conditioning ... 2976 THERMAL SCIENCE: Year 2018, Vol. 22, No. 6B, pp. 2973-2986
made. Preprocessing includes a clear definition of the physical problem that requires a solution, the selection of suitable flow domain geometry, optimum mesh generation, and the setting up of appropriate boundary conditions.
The case study is selected at one of the naval ships which consist of a sector scaled sectors interconnected with scaled doors (bulkhead hatches) each sector has three levels under the main deck. The fire is ignited on the second level at the sealed sector, Which is considered the worst condition of fire, because it exposes the trapped crew in the lower level to a certainly death, also firefighting team faces many troubles to reach the seat of the fire. Figure 1 illustrates the layout of the A/C system at one of the sealed sectors on naval ship.
Chiller water piping
Chiller Return duct
Supply duct
12 m
2.25 m
Fire compartment
Air handlingunit
Main deck
1 platformst
2 platformnd
Keel
9 m
Figure 1. Naval ship sealed sectors
Input data
Several input data must include to the model: – description of the fire compartment, fire room area, Afr, room height, Hfc, leakage area, AL,
and duct area, Ad – normal rooms (compartments) temperature before fire, Tr
– fire growth time due to fire status, tg, which defined as the interval between the time of effec-tive ignition and the time when the heat release rate of the fire reaches 1000 kw, and
– time after effective ignition, tai, which is period of time from the beginning of flammable fire.The ship is simulated by a number of parallel sealed sectors interconnected by the
several bulkhead hatches (openings). Each sealed sector is supplied with separate air – handling unit, so it is at a uniform pressure and temperature, the fire sector is subdivided into three levels each has many compartments, the fire compartment is assumed to be in the second level. The following assumptions and limitations have been considered: – each compartment is considered to be at a uniform pressure and temperature, – fire is ignited at a certain compartment of the first platform the fire is considered medium,
i. e., the growth time will be 300 seconds to reach 1000 kW heat release rate [5], – the density of gas (air and smoke) is assumed constant for all space except for the fire com-
partment, and – flashover temperature (which is the period of transition from the growth stage to the fully
developed fire stage) is 600 °C [1].The sealed sector is 12 m long, 9 m wide, and consists of three each has 2.25 m height,
Hfc, the fire compartment area, Afc, is 28 m2, and the leakage area through walls and doors, AL, is 0.01m2.
The selected ship uses air handing unit with chilled water cooling coil electric heating in spaces, with low to medium size sensible heat loads, per unit area of space requirement to maintain the room temperature, Tr, at 25 °C. The air distribution in ships is difficult because of low ceiling heights and compact space arrangements. Air usually returns from individual small-
El-Helw, M., et al.: Studying Different Scenarios of Operating Air Conditioning ... THERMAL SCIENCE: Year 2018, Vol. 22, No. 6B, pp. 2973-2986 2977
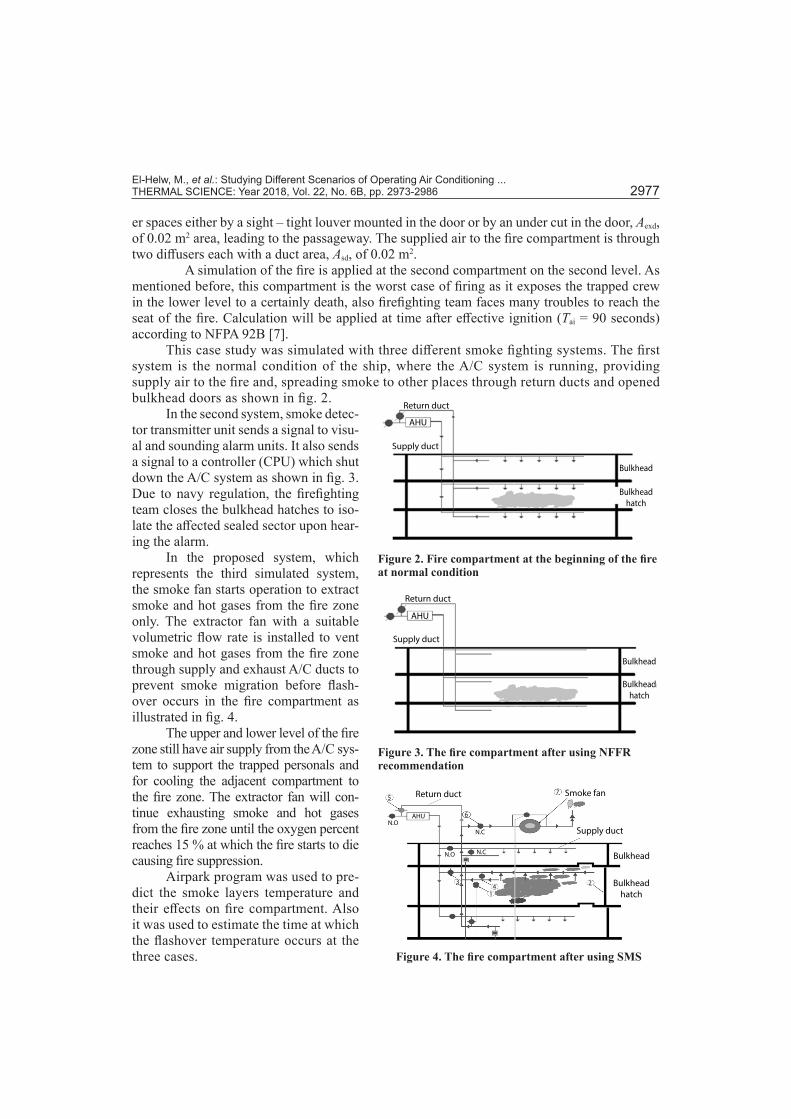
er spaces either by a sight – tight louver mounted in the door or by an under cut in the door, Aexd, of 0.02 m2 area, leading to the passageway. The supplied air to the fire compartment is through two diffusers each with a duct area, Asd, of 0.02 m2.
A simulation of the fire is applied at the second compartment on the second level. As mentioned before, this compartment is the worst case of firing as it exposes the trapped crew in the lower level to a certainly death, also firefighting team faces many troubles to reach the seat of the fire. Calculation will be applied at time after effective ignition (Tai = 90 seconds) according to NFPA 92B [7].
This case study was simulated with three different smoke fighting systems. The first system is the normal condition of the ship, where the A/C system is running, providing supply air to the fire and, spreading smoke to other places through return ducts and opened bulkhead doors as shown in fig. 2.
In the second system, smoke detec-tor transmitter unit sends a signal to visu-al and sounding alarm units. It also sends a signal to a controller (CPU) which shut down the A/C system as shown in fig. 3. Due to navy regulation, the firefighting team closes the bulkhead hatches to iso-late the affected sealed sector upon hear-ing the alarm.
In the proposed system, which represents the third simulated system, the smoke fan starts operation to extract smoke and hot gases from the fire zone only. The extractor fan with a suitable volumetric flow rate is installed to vent smoke and hot gases from the fire zone through supply and exhaust A/C ducts to prevent smoke migration before flash-over occurs in the fire compartment as illustrated in fig. 4.
The upper and lower level of the fire zone still have air supply from the A/C sys-tem to support the trapped personals and for cooling the adjacent compartment to the fire zone. The extractor fan will con-tinue exhausting smoke and hot gases from the fire zone until the oxygen percent reaches 15 % at which the fire starts to die causing fire suppression.
Airpark program was used to pre-dict the smoke layers temperature and their effects on fire compartment. Also it was used to estimate the time at which the flashover temperature occurs at the three cases.
Bulkhead
hatch
Bulkhead
Return duct
AHU
Supply duct
Figure 2. Fire compartment at the beginning of the fire at normal condition
Figure 3. The fire compartment after using NFFR recommendation
Figure 4. The fire compartment after using SMS
Return duct
Supply duct
AHU
Bulkhead
Bulkhead
hatch
75
AHUN.O
Return duct
6
Smoke fan7
Supply duct
Bulkhead
Bulkhead
hatch
2
14
3
N.O N.C
N.C

El-Helw, M., et al.: Studying Different Scenarios of Operating Air Conditioning ... 2978 THERMAL SCIENCE: Year 2018, Vol. 22, No. 6B, pp. 2973-2986
The solver code was validated with a full scale test of one room apartment [23]. A comparison between the results of simu-lation of a fire ignition with wood crib #5 in accordance with BS 6807 British stan-dard [24] and Guillaume et. al [23] results is shown in fig. 5. The comparison shows a very good agreement.
Numerical model for the problem
The fire room of dimensions (12 m × 2.25 m × 9 m) is considered which has the basic arrangement as shown in fig. 6. An X-Y-Z co-ordinate system is attached to the model with the origin located at the bottom left corner ofthe room. The fire is modeled as a prism source of fire at (X, Y, Z) = (4, 0, 1) to (X, Y, Z) = (8, 0.87, 8). Two supply fan are modeled as circular in X-Z plane cen-ter the first one at (X, Y, Z) = (4, 2.25, 6) with radius equal to 0.0564 the second at (X, Y, Z) = (8 m, 2.25 m, and 6 m) with radius equal to 0.0564. Two exhaust vent are modeled as circular in X-Z plane cen-ter the first one at (X, Y, Z) = (4, 2.25, 3) with radius equal to 0.0564 m the second at (X, Y, Z) = (8 m, 2.25 m, 3 m) with radius equal to 0.0564. The fire room door is also modeled as inclined partition start/angle, axis Y, (X, Y, Z) = (12, 0, 4.2), (X, Y, Z) = (0, 2, 0.8) all units in meter.
Numerical values of the boundary con- ditions used for the solution are listed in tab. 1.
Y
XZ
12 m
7 m
2.2
5 m
9 m
Door
0.0
8
Fan supply No.1
Vent exaust No.1
Fan supply No.2
Fire
Vent exaust No.2
4 m
Figure 6. Modeled room with fire
200
180
160
140
120
100
80
60
40
20
0
Tem
pe
ratu
re [
°C]
0:00:00 0:05:00 0:10:00 0:15:00 0:20:00 0:25:00 0:30:00
Time [h:mm:ss] Time [s]
Tem
pe
ratu
re [
°C]
190
180
170
160
150
140
130
120
110
100
90
80
70
60
50
40
30
20
10
0 200 400 600 800 1000 1200 1400 1600 1800 2000
2.40 m2.00 m1.90 m1.80 m1.70 m1.60 m1.50 m1.40 m1.10 m0.80 m
Hight = 0.8 m
Hight = 1.1 m
Hight = 1.4 m
Hight = 1.5 m
Hight = 1.6 m
Hight = 1.7 m
Hight = 1.8 m
Hight = 1.9 m
Hight = 2.0 m
Hight = 2.4 m
Figure 5. A comparison between [23] test and the present code (for color image see journal web site)
(a)
(b)
Re
sid
ua
l his
tory
612
614
616
618
620
6220 500000 1000000 1500000 2000000 2500000 3000000 3500000
Av
era
ge
ce
ll t
em
pe
ratu
re
Number of nodes
1e2
1e1
1e0
1e–1
1e–2
1e–3
1e–4
1e–5
1e–6
1e–70 200 400 600 800 1000 1200 1400 1600 1800 2000 2200
Iterations
Number of
iterations
Continuity
Y-velocity
X-velocityZ-velocity
Epsilon
k
Energy
Figure 7. (a) Grid independence study, (b) residual history

El-Helw, M., et al.: Studying Different Scenarios of Operating Air Conditioning ... THERMAL SCIENCE: Year 2018, Vol. 22, No. 6B, pp. 2973-2986 2979
Solver details
The coupled system of equations is solved together with its boundary conditions using a second order upwind scheme with suitable under-relaxation factor for all operating parame-ters utilizing Airpack (3.0). A grid independence study and the residual history were performed as shown in fig. 7.
A mesh of (5 cm × 5 cm × 5 cm), which equivalent to 2500000 nodes, seemed satis-factory. A narrower mesh beside the source of fire, inlet and exhaust diffuser are done as shown in figs. 8 and 9.
Results and discussions
Results are displayed for temperature. To investigate the thermal layer within the room the results are examined on the seven planes. The variation of results with door opening is also displayed tab. 2 show the different cases that were studied.
The studied cuts plan for the room studied is shown in fig. 10.
Table 1. Boundary conditions of the problem
Time after ignition
90 [s]
Case study at normal condition
Case study according to NFFR
Case study at SMS
Growth time [s] 300 300 300
Rate of heat release [kW] 90 90 90
Fire convective heat release rate [kW] 63 63 63
Fire limiting height [m] 0.873798 0.873798 0.873798
Fire room clear height [m] 0.93 0.93 0.93
Smoke mass-flow rate [kgs–1] 0.363728 0.363728 0.363728
Fan supply 1 [kgs–1] 0.0525 – –
Fan supply 2 [kgs–1] 0.0525 – –
Ventilation exhaust 1 [m3s–1] 0.001 – 1.05
Ventilation exhaust 2 [m3s–1] 0.001 – 1.05
Figure 8. Mesh cells on plane y-x in the modeled room
Figure 9. Mesh cells on plane y-z in the modeled room

El-Helw, M., et al.: Studying Different Scenarios of Operating Air Conditioning ... 2980 THERMAL SCIENCE: Year 2018, Vol. 22, No. 6B, pp. 2973-2986
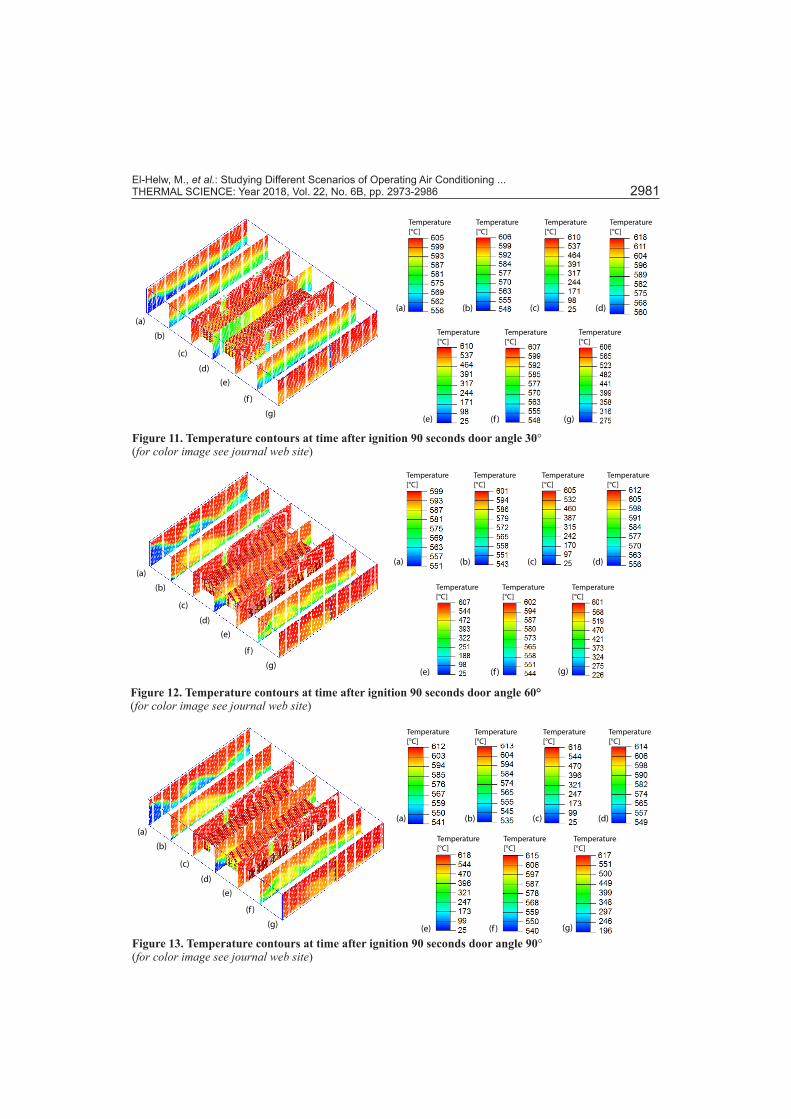
Temperature contours at 90 seconds after ignition and 30° door opened for normal conditioning
At the time after ignition 90 seconds, temperature of smoke within the fire room rises until it reaches the flash over stage tem-perature. High local temperatures exist in and around the source of fire and smoke from the fire forms a hot upper layer in the space as shown in fig. 11.
Temperature contours at 90 seconds after ignition and 60° door opened for normal conditioning
Temperature inside the room gradually decreases by gradual increasing the door an-gle as shown in fig. 12.
Temperature contours at 90 seconds after ignition and 90° door opened for normal conditioning
It was noticed that temperatures around the fire source are high and gradually less the closer the door to be 196 °C as shown in the lower layers of plane cut (g) and 617 °C in the upper layers of the same plane cut as shown in fig. 13.
Temperature contours at 120 seconds after ignition and 30° door opened for normal conditioning
The more time after the outbreak of the fire the greater the room temperature,
not only to the high temperature but also to a degree higher than the flash over temperature. Flash over occurs in a short period of time. Throughout the fire room the upper smoke layer temperature reaches to (1091-950 °C) this means that fully development stage had been occurred. At this stage, smoke rises and spread horizontally. High local-temperatures exist in and around the source of, low local-temperatures exit near the door of the room as shown in fig. 14.
Temperature contours at 120 seconds after ignition and 60° door opened for normal conditioning
It was noticed that temperatures around the fire source are high and gradually less the closer the door to be 404 °C at the lower layers of plane cut (g) and 1066 °C in the upper layers of the same plane cut as shown in fig. 15.
(a)
(b)
(c)
(d)
(e)
(f )
(g)
Y
XZ
Figure 10. Studied plan cuts in studied room configurations; (a) plane cut at (X, Y, Z) = (0, 0, 0), (b) plane cut at (X, Y, Z) = (2, 0, 0), (c) plane cut at (X, Y, Z) = (4, 0, 0), (d) plane cut at (X, Y, Z) = (6, 0, 0), (e) plane cut at (X, Y, Z) = (8, 0, 0,) (f) plane cut at (X, Y, Z) = (10, 0, 0), and (g) plane cut at (X, Y, Z) = (12,0,0)
Table 2. All cases that presented
At time after ignitionFire room status
90 secondsNormal condition
90°60°30°Door angle
90 secondsNFFR
0° and The A/C system secureDoor angle
90 secondsSMS
0° and SMS is onDoor angle
El-Helw, M., et al.: Studying Different Scenarios of Operating Air Conditioning ... THERMAL SCIENCE: Year 2018, Vol. 22, No. 6B, pp. 2973-2986 2981
(a)
(b)
(c)
(d)
(e)
(f )
(g)
(a) (b) (c) (d)
(e) (f ) (g)
Temperature
[°C]
Temperature
[°C]
Temperature
[°C]
Temperature
[°C]
Temperature
[°C]
Temperature
[°C]
Temperature
[°C]
Figure 11. Temperature contours at time after ignition 90 seconds door angle 30° (for color image see journal web site)
Figure 12. Temperature contours at time after ignition 90 seconds door angle 60° (for color image see journal web site)
Figure 13. Temperature contours at time after ignition 90 seconds door angle 90° (for color image see journal web site)
(a)
(b)
(c)
(d)
(e)
(f )
(g)
(a) (b) (c) (d)
(e) (f ) (g)
Temperature
[°C]
Temperature
[°C]
Temperature
[°C]
Temperature
[°C]
Temperature
[°C]
Temperature
[°C]
Temperature
[°C]
(a) (b) (c) (d)
(e) (f ) (g)
(a)
(b)
(c)
(d)
(e)
(f )
(g)
Temperature
[°C]
Temperature
[°C]
Temperature
[°C]
Temperature
[°C]
Temperature
[°C]
Temperature
[°C]
Temperature
[°C]

El-Helw, M., et al.: Studying Different Scenarios of Operating Air Conditioning ... 2982 THERMAL SCIENCE: Year 2018, Vol. 22, No. 6B, pp. 2973-2986
(a) (b) (c) (d)
(e) (f ) (g)
(a)
(b)
(c)
(d)
(e)
(f )
(g)
Temperature
[°C]
Temperature
[°C]
Temperature
[°C]
Temperature
[°C]
Temperature
[°C]
Temperature
[°C]
Temperature
[°C]
Figure 14. Temperature contours at time after ignition 120 seconds door angle 30° (for color image see journal web site)
Figure 15. Temperature contours at time after ignition 120 seconds door angle 60° (for color image see journal web site)
Figure 16. Temperature contours at time after ignition 120 seconds door angle 90° (for color image see journal web site)
(a) (b) (c) (d)
(e) (f ) (g)
(a)
(b)
(c)
(d)
(e)
(f )
(g)
Temperature
[°C]
Temperature
[°C]
Temperature
[°C]
Temperature
[°C]
Temperature
[°C]
Temperature
[°C]
Temperature
[°C]
(a) (b) (c) (d)
(e) (f ) (g)
(a)
(b)
(c)
(d)
(e)
(f )
(g)
Temperature
[°C]
Temperature
[°C]
Temperature
[°C]
Temperature
[°C]
Temperature
[°C]
Temperature
[°C]
Temperature
[°C]

El-Helw, M., et al.: Studying Different Scenarios of Operating Air Conditioning ... THERMAL SCIENCE: Year 2018, Vol. 22, No. 6B, pp. 2973-2986 2983
Temperature contours at 120 seconds after ignition and 90° door opened for normal conditioning
Temperature inside the room gradually decreases by gradual increasing the door angle as shown in fig. 16.
Temperature contours at 90 seconds after ignition and 0° at NFFR
Navy firefighting regulation (NFFR) causes high temperature zones of smoke to de-crease rapidly within the fire room but it is still unsatisfying on the upper portion of the room. This can be explained by the rate of smoke concentration increase on the upper portion of the room depending on smoke flow area (duct area, leakage area) and pressure difference due to buoyancy and smoke expansion on the fire room. Figure 17 illustrates the effect of navy smoke control system on smoke temperature at fire room.
Temperature contours at 120 seconds after ignition and 0° at NFFR
The NFFRN causes high temperature zones of smoke to decrease rapidly within the fire room but it is still unsatisfying as shown in fig. 18.
Temperature contours at 90 seconds after ignition and 0° at SMS
Throughout the fire room, the temperature on planes cut show clearly that tempera-tures inside the room fell satisfactory as a result of using extractor fan to vent smoke, hot gases through A/C duct system and bulkhead door should be closed after fire detection to prevent smoke migration. Figure 19 illustrates the effect of using on smoke temperature at fire room at the time after ignition 90 seconds.
Temperature contours at 120 seconds after ignition and 0° at SMS
Throughout the fire room, the temperature on planes cut show clearly that tempera-tures inside the room fell satisfactory as a result of using extractor fan to vent smoke, hot
Figure 17. Temperature contours at time after ignition 90 seconds door angle 0° and air condition secured (for color image see journal web site)
(a) (b) (c) (d)
(e) (f ) (g)
(a)
(b)
(c)
(d)
(e)
(f )
(g)
Temperature
[°C]
Temperature
[°C]
Temperature
[°C]
Temperature
[°C]
Temperature
[°C]
Temperature
[°C]
Temperature
[°C]

El-Helw, M., et al.: Studying Different Scenarios of Operating Air Conditioning ... 2984 THERMAL SCIENCE: Year 2018, Vol. 22, No. 6B, pp. 2973-2986
Figure 18. Temperature contours at time after ignition 120 seconds door angle 0° and air condition secured (for color image see journal web site)
Figure 19. Temperature contours at time after ignition 90 seconds at SMS (for color image see journal web site)
Figure 20. Temperature contours at time after ignition 120 seconds at SMS (for color image see journal web site)
(a) (b) (c) (d)
(e) (f ) (g)
(a)
(b)
(c)
(d)
(e)
(f )
(g)
Temperature
[°C]
Temperature
[°C]
Temperature
[°C]
Temperature
[°C]
Temperature
[°C]
Temperature
[°C]
Temperature
[°C]
(a) (b) (c) (d)
(e) (f ) (g)
(a)
(b)
(c)
(d)
(e)
(f )
(g)
Temperature
[°C]
Temperature
[°C]
Temperature
[°C]
Temperature
[°C]
Temperature
[°C]
Temperature
[°C]
Temperature
[°C]
(a) (b) (c) (d)
(e) (f ) (g)
(a)
(b)
(c)
(d)
(e)
(f )
(g)
Temperature
[°C]
Temperature
[°C]
Temperature
[°C]
Temperature
[°C]
Temperature
[°C]
Temperature
[°C]
Temperature
[°C]

El-Helw, M., et al.: Studying Different Scenarios of Operating Air Conditioning ... THERMAL SCIENCE: Year 2018, Vol. 22, No. 6B, pp. 2973-2986 2985
gases through A/C duct system and bulkhead door should be closed after fire detection to prevent smoke migration. Figure 20 illustrates the effect of using on smoke temperature at fire room at the time after ignition 120 seconds.
A comparison between the three differ-ent scenarios results is shown in fig. 21. From this figure, it can be observed that using navy regulation scenario will decrease the peak tem-perature by around 86%. While using the pro-posed SMS will decrease the peak temperature by 92%.
Conclusions
The theoretical results obtained from the models formulated for SMS of naval ship fire, can be summarized as follows.
y The CFD simulations of the effect of A/C induced flows on smoke detector response to achieve the rapid activation of the SMS in response to a growing fire.
y Using A/C system, for smoke management reduces the cost and effort for designing a new duct system of smoke management, throughout the compact size of the ship, more over re-duces the smoke fan temperature without affecting the A/C normal operation.
y Smoke control system by NFFR without smoke venting operation not only cannot stop smoke migration but also can cause fire conflagration because of the continuously increase of the accumulated smoke temperature.
y Better understanding of fire, smoke physics, A/C systems and ship construction are essential for improving SMS design on naval ship.
y One of the best ways to deal with smoke problems is to stop smoke production, to extent that a suppression system slows down the burning rate, which reduces smoke problems.
y The SMS overcomes the side effects of the traditional navy smoke control system on naval ships. If the smoke can be removed while it is still hot, a significant reduction in loss can be achieved.
Nomenclature
References[1] Soner, O., et al., Use of HFACS–FCM in Fire Prevention Modelling on Board Ships, Safety Science, 77
(2015), Aug., pp. 25-41[2] Chu, B., Chang, D., Effect of Full-Bore Natural Gas Release on Fire and Individual Risks: A Case Study
for an LNG-Fueled Ship, Journal of Natural Gas Science and Engineering, 37 (2017), Jan., pp. 234-247[3] Kang, H. J., et al., A Framework for Using Computational Fire Simulations in the Early Phases of Ship
Design, Ocean Engineering, 129 (2017), Jan., pp. 335-342
A – area, [m2] H – height, [m] T – temperature, [°C] t – time, [s]
Subscripts
ai – after ignition d – duct exd – exhaust duct fc – fire compartment fr – fire room
g – growth L – leakage sd – supply duct r – room
Abbreviations
AHU – air-handling unitSMS – smoke management systemNFPA – national fire protection associationNFFR – navy firefighting regulationA/C – air conditioning system
Pe
ak
tem
pe
ratu
re [
°C]
1200
1000
800
600
400
200
030° door
opened
60° door
opened
90° door
opened
Normal conditioning
Navy
regulationSmoke
management
After 90 s
After 120 s
1091
618 612 618
10861090
75.554.512592.5
Figure 21. Peak temperature comparison for the three different scenarios

El-Helw, M., et al.: Studying Different Scenarios of Operating Air Conditioning ... 2986 THERMAL SCIENCE: Year 2018, Vol. 22, No. 6B, pp. 2973-2986
[4] ***, NAVSEA, 1997, Surface Ship Firefighting, NSTM, Chapter – 555, Vol. 1, pp. 1-3[5] ***, Marine Fire Prevention, Fire Fighting and Fire Safety, National Maritimes Research Center, Mari-
time Administration, San Francisko, Cal., USA, 1993[6] ***, ASHIRAE Handbook of Application, Atlanta, Geo., USA, 1996, Chapter 48, S. Management[7] ***, NFPA 92 B, 2000 Edition, Quincy, Mass., USA, Guide for Smoke Management System in Malls,
Atria, and Large Areas[8] Tamura, G. T., Computer Analysis of Smoke Movement in Tall Building, ASHRAE Transaction, 78
(1969), Part II, pp. 81-92[9] Rhodes, N., Prediction of Smoke Movement: An over View of Field Models, ASHRAE Transaction, 95
(1989), Part 1, pp. 868- 877[10] McCabe, F. J, Smoke Management Damper Applications, ASHEAE Transaction, 97 (1991), Part 2, pp.
643-649[11] Tamura, G. T., Macdonald, R. A., Comparative Performances of Mechanical Smoke Exhaust System,
Zoned Smoke Control, and Pressurized Building Method of Smoke Control, ASHEAE Transactions, 99 (1990), 1, pp. 488-495
[12] Borresen, B. A., Madsen, C. N., Smoke Management in Large Spaces – Sizing Smoke Vents, Flow Rates, and Temperatures, ASHRAE Transactions, 96 (1990), Part 2, pp. 701-706
[13] Webb, W. A., Development of Smoke Management Systems, ASHRAE Transactions, 101 (1995), Part 1, pp. 995-1000
[14] Clark, J. A ., Buckley, J. S., The Evaluation of Pressurized Stairwells, ASHRAE Transactions, 101 (1995), Part 1, pp. 1001-1005
[15] Cameou, E. D., NFPA’s Chief Fire Investigator, English Channel Tunnel Fire Report, San Francisco, Cal., USA, Internet, 1996
[16] Silas K. L, Kennedy, W. D., A CFD Analysis of Station Fire Conditions in the Buenos Aires Sub Way System, ASHRAE Transaction, 101 (1999), Part 1, pp. 411
[17] Xie, H., Heavy Compressed Air Foam Truck Applied to High-Rise Building Fires, Procedia Engineering, 52 (2013), Mar., pp. 458-467
[18] Shu-Chao, C., et al., Simulation of Pedestrian Evacuation in a Room under Fire Emergency, Procedia Engineering, 71 (2014), May, pp. 403-409
[19] Meroney, N. R., et al., CFD Simulation of Ventilation and Smoke Movement in a Large Military Firing Range, Journal of Wind Engineering and Industrial Aerodynamics, 136 (2015), Jan., pp. 12-22
[20] Apelian, C., et al., A Turbulent Transport Model: Streamline Results for a Class of Random Velocity Fields in the Plane, Communications on Pure and Applied Mathematics, 50 (1997), 11, pp. 1053-1088
[21] Zheng, X., et al., Turbulent Transition Simulation Using the k-ε Model, International Journal for Numer-ical Methods in Engineering, 42 (1998), 5, pp. 907-926
[22] ***, Airpack 3.0 User’s Guide, Fluent, Inc., Lebanon, N. H., USA, 2007[23] Guillaume, E., et al., Real-Scale Fire Tests of one Bedroom Apartments with Regard to Tenability Assess-
ment, Fire Safety Journal, 70 (2014), Nov., pp. 81-97[24] ***, BS 6807, Methods of Test for Assessment of Ignitability of Mattresses, Upholstered Divans and
Upholstered Bed Bases with Flaming Types of Primary and Secondary Sources of Ignition, 2006
Paper submitted: February 11, 2017Paper revised: April 11, 2017Paper accepted: April 19, 2017
© 2018 Society of Thermal Engineers of SerbiaPublished by the Vinča Institute of Nuclear Sciences, Belgrade, Serbia.
This is an open access article distributed under the CC BY-NC-ND 4.0 terms and conditions