study to perform preliminary experiments to evaluate
TRANSCRIPT

NASA Contractor Report 3486
Study To Perform Preliminary Experiments To Evaluate Particle Generation and Characterization Techniques for Zero-Gravity Cloud Physics Experiments
Ulrich Katz
CONTRACT NASS-32313 JANUARY 1982

TECH LIBRARY KAFB. NM
NASA Contractor Report 3486
Study To Perform Preliminary Experiments To Evaluate Particle
1 Generation and C haracteriiation Techniques for Zero-Gravity Cloud Physics Experiments
Ulrich Katz Desert Research Institute Reno, Nevada
Prepared for George C. Marshall Space Flight Center under Contract NASS-323 13
National Aeronautics and Space Administration
Scientific and Technical Information Branch
1981


TABLE OF CONTENTS
Section Page
I. INTRODUCTION ............................................ 1
II.’ AEROSOL CHARACTERIZATION ................................ 4 . .
A. REQUIREMENTS....-- ................................... 4
B. REAL TIME METHODS FOR AEROSOL GENERATION ............ 5
1. Electrical Mobility Instruments ................. 5
a. Electrostatic Classifier .................... 6
(1) General Principle ...................... 6
(2) Specific Problems ...................... 11
(a) Uncertainties in Equilibrium ...... 11 Charge Distribution
(b) Establishing Charge Equilibrium .... 12
(c) Sensitivity and Resolution ........ 15
0 Size Resolution ................ 0 Absolute Size Calibration ...... :z 0 Number Sensitivity ............. 0 Multiple Charge Compensation ... 5
b. Electrical Aerosol Analyzer ................. 29
(1) Principle of Operation ................. 29
(2) Special Problems ....................... 31
2. Diffusion Batttery .............................. 36
C. "HARD COPY" SAMPLE ACQUISITION ...................... 45
1. Methods of Investigation ........................ 46
2. Preparation of Samples .......................... 48
a. Particle Sample Substrates .................. 48
b. Aerosol Precipitation Devices ............... 49
(1) Aerosol Centrifuges .................... 51
(2) Filters ................................ 51
(3) Thermal Precipitation .................. 54
(4) Electrostatic Precipitation ............ 56
(5) Concluding Remarks on Hard Copy . . . . . . . . 58 'Samolina
iii

Sect ion
III. AEROSOL GENERATION ......................................
A. PHOTOLYTIC AEROSOL GENERATOR (PAG) ..................
1. Design Considerations . ..........................
2. PAG Performance .................................
a. Output Variables .............................
b. Input Farameters ............................
(1) Light Intensity, Flow Rate .............
(2) so2, Water Vapor and O2 Concentration ...
C. Effects of Temperature on PAG Output ........
d. Size Distribution of the PAG Particles ......
e. Output Constancy ............................
3. Vapor Stripper ..................................
B. AEROSOL GENERATION BY ATOMIZATION ...................
1 : Selection of Suitable Candidate Atomizers ....... for Evaluation,
2. Evaluation of Pneumatic Atomizers as ACPL ....... Aerosol Generators
a.
b.
C.
Laboratory Set-up for Atomizer Evaluation . . .
Evaluation of the TSI-COA and Comparison . . . . with Selected other Atomizers
(1) Number Size Distributions . . . . . . . . . . . . . .
(2) Atomizer Output vs. Time . . . . . . . . . . . . . . .
Investigation of Output Instability and . . . . . D
P +&of Improved Constant Output Atomizer
(1) Information from Existing Atomizers . . . .
(2) Variable Geometry Atomizer (VGA) . . . . . . .
(3) Study of Output Fluctuations............
(4) Design of Improved Constant Output...... Atomizer (ICOA)
(5) Evaluation of GE-ACPL Atomizer . . . . . . . . .
C. GENERATION OF WATER INSOLUBLE AEROSOLS ..............
1. Atomization of Hydrosols ........................
a. General ....................................
b. Experiments with Hydrosols ..................
Page
60
60
62
70
70
72
72
77
79
82
82
87
90
90
91
92
97
100
111
116
116
123
126
134
144
151
151
151
153
iv
i

Sect i on Page
(1) Commercially Available Particles . . . . . . .
(2) I-;b;r';tory Prepared Hydrosol - AgI, . . . . 1'
2. Thermal Aerosol Generation . . . . . . . . . . . . . . . . . . . . . .
a. AgI .........................................
b. Paraffin Wax ................................
D. SHAPING OF SIZE DISTRIBUTIONS . . . . . . . . . . . . . . . . . . . . . .
1. ImDacti on . . . . . . . . . . . . . . . . . . . . . . . . . . . . . . . . . . . . . . .
2. Thermal Modification of Size Distributions . . . . . .
3. "Monodisperse" Aerosols from the Electrostatic... Classifier
IV. CONCLUSIONS AND RECOMMENDATIONS ......................... 180
A. AEROSOL CHARACTERIZATION ............................ 180
B. AEROSOL GENERATION .................................. 182
V. REFERENCES . . . . . . . . . . . . . . . . . . . . . . . . . . . . . . . . . . . . . . . . . . . . . . 186
153
154
161
161
164
166
166
172
173

I. INTRODUCTION
Cloud physics experiments originally planned for the zero-gravity
Atmospheric Cloud Physics Laboratory (ACPL) aboard the 'Space Shuttle
stipulated a need for cloud condensation nuclei (CCN) of specified
properties. The aim of the present investigation was to scrutinize
methods of particle generation and characterization with regard to their
applicability to the ACPL program. Subsequent to the initiation of this
program in December, 1976, the concept of an ACPL as a flight facility
was abandoned by NASA; however, the objective of this study remained
unchanged since the results would still be applicable to future low-g
flights.
While the absence of gravity unavoidably introduces constraints in
some-techniques of aerosol generation, at least as many difficulties in
the tasks of the present project can be traced to the stringent
specifications regarding the output of particle generators. The need to
achieve particularly high degrees of aerosol monodispersity, output
constancy, reproducibility, etc., previously not common in cloud physics
experimentation stems from the fact that the ACPL experiments were
specifically intended to be of great sensitivity in order to clearly
detect the effects unmasked by the low gravity environment.
At the outset of this study, most of the tasks outlined in the
proposal were assigned similar levels of effort; however, as work pro-
gressed, it became evident that priorities had to be established,leading
to a very inhomogeneous distribution of efforts. There were two reasons
for this development. First, pneumatic atomization of solutions, the
1

particle generation method favored on the basis of literature studies
(Anderson, 1977; Liu and Lee, 1975) was found to pose unexpected output
stability problems, and,secondly, numerous discussions between cognizant
NASA and DRI personnel indicated that on initial flights of the ACPL,
especially on the very first one, there would be less elaborate experi-
ments with simpler hardware and fewer accessories than originally plan-
ned. Thus it was possible and advisable to concentrate more on the
problems of the prime particle generator at the expense of less urgently
needed equipment.
These deviations from the original work plan will not be discussed
any further in this report since the DRI’s course of action was
communicated through monthly progress reports to and implicitly approved
by NASA.
Since the aerosol characterization is a prerequisite to assessing
performance of particle generation equipment, redundancy is avoided by
devoting the following section of this report to the evaluation of
techniques for characterizing aerosol particles.
The third section contains the discussion of aerosol generation
whereby the studies of atomizer and photolytic generators represent the
major portion, including subsections on preparation of hydrosols (used
with atomizers), and onthe evaluation of the flight version of the GE
atomizer. .
No separate sections were established for the discussion of the
joint workshops with the University of Wyoming and of the problem of
gaseous contamination of aerosol -particles. Pertinent information on
these topics is presented in the proper context in various other
subsections.
2

Conclusions and recommendations are summarized in the fourth and
.final section.
.
3
_-.-._ *. ._.__ .________ -1.

II. AEROSOL CHARACTERIZATION
A. REQUIREMENTS
Ideally, aerosol generators to be used in low-g should perform in
such a reproducible fashion that subsequent measurements of particle
size spectra would not be necessary; however, as will be seen in Section
III, the reliability of particle generators is not good enough to
guarantee a flawless performance as shown by terrestrial calibration
over a period of a flight duration. Thus, in order to ensure accurate
kpowledge of the characteristics of the aerosol used in each experiment,
it is necessary to obtain in-flight measurements of the particles
generated.
Due to the use of high purity substances from which to generate
particles, the chemical composition of the resulting aerosols is essen-
tially known (except for difficult to detect surface contamination as
discussed later). Therefore, aerosol characterization does not require
a chemical investigation, but can be limited to the determination of
size distribution and number concentration.
Two types of aerosol assessment have to be considered - real time
and "hard copy." While a real time characterization is essential,
allowing the investigator to take corrective steps if necessary, a "hard
copy" (an actual representative collection of particles) is equally
important because it permits detailed scrutiny with instrumentation not
available in flight (such as electron microscopes) which, in many cases,
provide a nearly-absolute determination of particle size and number.
4

B. REAL TIME METHODS FOR AEROSOL GENERATION
The most relevant factor in the selection of a suitable method for
onboard aerosol characterization is the particle size range. Since the
upper size limit of the primary range was specified as 100 nm, optical
particle counters/classifiers such as the familiar Royce 225 were ruled
out for this task. Although optical counters can, in principle,
contribute to the particle assessment if combined with a condensation
device that increases the particle size into the optical range, this
process involves the condensational behavior of the particles themselves
and thus, the procedure cannot be used for an independent characteriza-
tion of the aerosols in question.
Two well-researched, size-dependent properties of aerosol parti-
cles that lend themselves to middle and lower submicron range measure-
ment are electrical mobility and diffusivity. The last decade has
brought profound advances in the design and application of particle
measuring devices based on electrical mobility assessment. Two such
instruments have been used extensively in this investigation and will be
discussed below. Based on classical diffusion theory, "diffusion batter-
ies" consisting of considerable lengths of tubing were used initially to
determine aerosol size distributions. A modern, compact version origin-
ally scheduled to be part of the ACPL, and used a number of times on the
present project, was also evaluated.
1. Electrical Mobility Instruments
Recent literature treats most aspects of theory and design of this
type of particle analyzer (Knutson and Whitby, 1975a, b; Knutson, 1975;
Hoppel, 1978; Liu and Pui, 1974, to name a few).

For the purpose of the present investigation, only a brief des-
cription of the underlying principles of operation and a discussion of
problems pertaining to the ACPL application will be presented.
The two instruments used in this study are the Electrical Aerosol
Analyzer (EAA) by TSI (Model 30301,and the Electrostatic Classifier
(EC), also by TSI (Model 3071). In both instruments, the aerosol is
first electrically charged (differently for EC and EAA) and subsequently
passed through the electric field of a cylindrical high voltage conden-
ser where discrimination takes place according to charge vs. size
relationships; the third element in this sizing method is a device that
counts the particles of the selected size fractions.
a. Electrostatic Classifier
(1) General Principle
The essential features of this instrument are depicted in Figure
2-l. The central part of the device is the cylindrical analyzer section
in which a uniform clean air sheath flow (qsh) is maintained while the
aerosol is injected at a much slower rate (9,) through a peripher-
ally-located annular slot. For a given voltage applied between cylinder
wall and axial collector rod, particles of a certain mobility
Z w
= neC(Dp)/3nnD P
(where n number of elementary charges, e; C the Cunningham slip correc-
tion; T-I the viscosity of air; and D P
the particle diameter) reach the
axially located opening where a flow equal to the aerosol inlet flow is
withdrawn ("monodisperse aerosol outlet"). All particles with higher
mobility end up on the central rod while the ones with lower mobility
and the neutral particles are trapped in the filter at the exit end of
the cylinder.
6

- SHEATH AIR 20LITERS/MINUTE
1+1 FLMETER
wKr-85 BlPOLAfi CHARGER
emc
DIFFERENT-ML WOBILITY ANALYZER
HIGH EFF’EWEgCY CONTROL
m VALVE
.
EXCESS AIR. #)LJTERS/MNUTE
MONODISPERSED AEROSOL 2 LITERS/MINUTE
Figure 2-l. Schematic of air flow in TSI, Model 3071, Electrostatic Classifier (EC) [from Instrument Manual]. .
7
- -

Figure 2-2 depicts the relationship between electrical particle
mobility and the size of singly, doubly, and triply charged particles;
it also shows the voltage that needs to be applied to the condenser to
obtain singly charged particles of diameter D P
in the outlet under the
stated flow conditions and the particular geometry of this device.
Knutson and Whitby (1975a) have shown that mobility Z P'
the voltage V,
and the sheath flow q,h follows the relationship Z P
= G q,,,/v, where
the factor G incorporates dimensions of the condenser.
From the above expression for the mobility and Figure 2-2, it is
quite clear that the knowledge of the distribution of charges on the
particles is a determining factor for the usefulness of the device. For
the primary particle size range under consideration here, the method of
charge neutralization provides a convenient means of establishing a
relatively well-known charge distribution, the Boltzmann charge equil-
ibrium, achieved by letting the particles interact for a sufficient time
with highly concentrated bi-polar ions. The latter have been generated
in this study by radioactive Kr 85 in the TSI charge neutralizer (Model
3077 and/or 3012) through which the aerosol was passed prior to entering
the analyzer section of the EC.
Figure 2-3 illustrates what charge distributions can be expected
after passage through the charge neutralizer; shown are the fractions of
singly, doubly, and triply charged particles (of either sign) as a
function of particle size based on values tabulated by Pui and Liu
(1979). It is immediately evident that, in the size range of interest,
the singly charged particles become increasingly dominant over multiply
charged ones with decreasing size. This fact, which translates into pre-
8

I PARTICLE
-5 I I0 0.001
I I I lllll I 0.03 (
PARTICLE DIAMETER, Dp-pm
COLLECTOR ROD VOLTAGES AT STANDARD FLOW RATES
q, = 20 Ipm q, = qac6 Ipm
Figure 2-2. Electrical mobility of particles with one, two and three elementary charges as a function of particle diameter. EC collector rod voltage, of djameter D
V, to pass singly charged particles
tions. through the instrument at standard condi-
[AfterPInstrument Manual].

II -
I CC
II C
II -
-
. ;
;p
i -
-L C
Figure 2-3.
I , , ,I,,, I 0.03 (
PARTICLE DIAMETER, Dp -pm
Fractions of particles with one, two or three elementary charges (of either sign) as a function of. particle diameter (according to Pui and Liu, 1979). Dashed line tentatively according to DRI experiments.
10

dominant passage of one size of particles for a given set of voltage and
flow rates, makes the EC also a primary tool for generating monodisperse
aerosols in the lo-100 nm range (more about this aspect in Section
III.D.3). Figure 2-3 also indicates that, with decreasing diameter, the
fraction of singly charged particles becomes very small which, in
effect, reduces the sensitivity for particle number measurement.
The essential function (in size distribution measurement) of count-
ing the particles in the selected size fraction is not incorporated into
the EC, but has to be performed by an external instrument connected to
the "monodisperse aerosol" outlet of the EC. In this study, the TSI
Electrical Aerosol Detector (EAD), Model 3070, was used most of the.
time. The device uses an electrometer to measure the current produced
by the charges of the passing particles - requiring, once more, know-
ledge of the charge distribution.
In principle, any "total particle counter" could provide the
necessary information; even instruments based on size enhancement
through condensation are suitable since, at this stage, no size dis-
crimination is needed. However, peculiarities of the various available
counters (to be discussed later) made the EAD the preferred instrument.
(2) Specific Problems
(a) Uncertainties in Equilibrium Charge Distribution
While knowledge of the equilibrium charge distribution is con-
sidered sufficient for most practical applications, uncertainties exist
which become more pronounced with decreasing particle size. In the
course of establishing the droplet size distribution of some nebulizers
by measuring the size distribution of the dry residue particles, it was
11

noticed that, when nebulizing salt solutions of different concentra-
tions, a distinct deviation from the expected overlap of size distri-
bution curves occurred for particle sizes below about 15 nm if the
values for the singly charged fraction of the solid curve of Fig. 2-3
were applied. Based on these discrepancies, the dashed line in Figure
2-3 was tentatively established by empirical means and used in subse-
quent work with satisfactory results. However, the real depth and
difficulty of the problem can be seen from Fig. 2-4, taken from the
Knutson (1975) paper which should be consulted for further details. It
appears that the user of the EC will have to look out for future
development in this matter in order to achieve the most valid interpre-
tation of EC data.
(b) Establishing Charge Equilibrium
According to manufacturer's specifications, the charge neutralizer
(TSI Model 3077) built into the EC should,suffice to provide Boltzmann
equilibrium for aerosol flow rates up to the maximum recommended for the
EC (6 a min-'). With the intent to confirm this information, experi-
ments were performed by passing a nominally monodisperse latex aerosol
through the EC with and without an additional charge neutralizer (TSI
Model 3012). An example of this comparison is shown in Figure 2-5,
where the EC output is plotted in terms of charge counts (by EAD) versus
the EC voltage; as expected, the latex aerosol consisted of singlets,
doublets and higher multiplets with singly, doubly, etc. charged frac-
tions in each category. These show up as the peaks in Figure 2-5 and
can be identified with the aid of Figs. 2-2 and 2-3.
12

0,
20
DATA: ' dPOLLAK 8 METNIEKS ONOLAN & KENNEN
I OLIlJ & PUI
KEEFE, NOLAN, AND RICH THEORY
'RY THEORY
;
3 . ..L
- .*
XJ PARTICLE DIAMETER) pm
Figure 2-4. Theoretical and experimental values for fraction of singly charged particles at Boltzmann charge equilibrium as a function of diameter according to indicated authors (from Knutson, 1975).
13

14c .
SINGLE PARTICLE le
DOUBLE PARTICLE le
2cL, NOMINAL STANDARD DEVIATION (SD) FOR LATEX AEROSOL - THEORETICAL EC RESPONSE FOR MONODISPERSE AEROSOL
CALCULATED FROM TWO ABOVE
ACTUAL SD OF MEASURED PEAK I I - -
I 2 3 4 5 6
EC VOLTAGE- kV
Figure 2-5. EC voltage scan for 91 nm diameter monodisperse latex aerosol, with (X) and without (0) additional charge neutralizer.
14

Of principle interest here are the relative peak heights of the
singly and doubly charged singlets. Despite the difficult-to-assess
interference of doubly charged multiplets (e.g., doubly charged doublets
have approximately the same mobility as the singly charged singlets -
thus the two are superimposed on the main peak) the measurements show
that the addition of a second charge neutralizer causes the ratio of
doubly over singly charged particles to drop by about 50%. Since no
further significant change was observed when the additional 2 mCi
neutralizer was replaced with a more powerful 10 mCi unit (TSI Model
3054) it is assumed that the added 2 mCi ionizer does provide the
equilibrium charge distribution. All subsequent EC work was carried out
with an added neutralizer.
(c) Sensitivity and Resolution
It is important to determine whether and how these two essential
quantities can meet the requirements given by the ACPL task. Since the
principle of operation of the EC is to cut out of the total input
spectrum a narrow segment (ADPI, the particles of which are then count-
ed, it is obvious that the better the size resolution (i.e., the smaller
ADp) the worse the number sensitivity becomes (though somewhat dependent
on the type of particle counter).
0 Size Resolution
As shown by Knutson and Whitby (lg75a,b) in their rigorous 'math-
ematical treatment of the EC, the shape of the narrow ("monodisperse")
size distribution extracted by the instrument from a primary aerosol
with a flat size distribution is triangular if aerosol input and output
15

flow rates are equal, and provided the particle number is plotted
against a logarithmic EC voltage scale (rather than Dp). Thereby the
base width of the triangle represents a suitable measure of the size
resolution which can be expressed by D,/D2, the particle diameters
associated with V,, VP, the end points of the triangle base. Since the
particle mobility Z P
is approximately proportional to p v
-2 (see Fig.
2-2) in our range of interest,
and, following Knutson and Whitby (1975)
z2= qsh t qa
zl qsh - qa
Thus, for typical values of qsh = 20 R min and q, = 2 f min -1 or 6 R
min -' (maximum recommended for preservation of laminar flow), the volt-
age ratios V1/V2 become 1.22 and 1.86, respectively, which translates
for D1/D2 to approximately 1.10 and 1.36, respectively. These values
are not only important in the context of size resolution but even more
so for determining absolute number densities in the input aerosol since
one usually plots AN/A log Dp vs. D P
.
Experimental verification of these theoretical values for the EC's
resolution can, in principle, be obtained by passing a perfectly monodis-
perse aerosol through the device while varying the voltage. The result-
ing number vs. voltage relationship then provides an exact duplicate of
the aforementioned triangular size distribution passed by the EC at the
16.

fixed voltage corresponding to the size of the, monodisperse aerosol.
While truly monodisperse aerosols in the desired size range are general-
ly unavailable, commerical latex spheres with known standard deviation
(SD, 0) were. used as documented in Fig. 2-5. The bars at the base of
the main peak indicate 20 as the measure for the width of the size'
distributions inv,olved: 2uL. latex particles; 2oEC, the SD for theoreti-
cal response of the EC to a perfectly monodisperse input (above mention-
ed triangle); 2a exp.' represents the experimentally obtained peak; and
2uth signifies the theoretically expected EC response to the actual
latex distribution, calculated according to (log oth12 = (log oL12 '
-I- (log OEc)i.
As a second EC became briefly available late in this program, the
soluble salt output of one EC was used as "monodisperse" test aerosol
and passed through the second EC. This provided a two-fold improvement
for performance verification tests: (1) no interference from multiply-
charged multiplets, and (2) a narrower size distribution that has
inherently the same shape as the instrument's response to a truly
monodisperse aerosol. The theoretically expected particle number count
vs EC voltage is illustrated in Fig. 2-6 as the bell-shaped curve,*
while the triangle represents the input size distribution centered (in
this example) at about 58 nm. Results of an actual measurement are
shown in Fig. 2-7 (an excerpt from Fig. 3-70); the dashed triangle,
representing the most likely input distribution, was obtained from the
*Note that this should not be confused with the size distribution of the aerosol that emerges from the second EC at a given voltage setting. More on this in Chapter III.
17

10 EC VOLTAGE -V
I I I I I I I I 52 54 56 56 60 62 64’ 66
PARTICLE DIAMETER -nm
Figure 2-6. Theoretical response of EC (bell-shaped curve) to triangu- lar shaped input size distribution (which represents theo- retical output of another EC with an input having a flat size distribution).
18

0.012
0.010
Q, 0.008 I
s
i 2 0.006
El El
g F z: 0.004
d
0.002
0
58 nm singly charged
’ 1464 I
EC VOLTAGE - V
I I I I 40 50 60 70 .
PARTICLE DIAMETER- nm
16
Figure 2-7. Experimental counterpart to Fig. 2-6. The narrower tri- angle represents the theoretically expected input (based on flow rate ratios) while the wider triangle is the assumed actual input (i.e., output of other EC) based on Fig. 2-6. (Peak to left of figure is caused -by doubly charged parti- cles of same size).
19
-

measured curve according to the relationships developed for Fig. 2-6,
while the solid triangle corresponds to the theoretically expected
output size distribution of the first EC based on the flow rate ratio.
Data from both Fig. 2-5 and 2-7 are in agreement showing that the actual
peak widths obtained with the EC are about 20% larger than predicted.
Thus, the experimentally determined geometric standard deviation 0 !P
of
the triangular distributions (in terms of particle size), an appropriate
measure for the size resolution of the EC, is below 1.03 for a 2 R min -1
aerosol flow rate. Translated into terms of supersaturation for the
case of soluble CCN (according to the Kohler relationship) we obtain
agSS 2 1.04. This value indicates that the EC's size resolution is
more than adequate for proper characterization of test aerosols in ACPL
applications.
In the above discussion, it was tacitly assumed that the number
density of singly charged particles was size independent; however, this
is generally not the case because: (1) the singly charged fraction of
particles varies with size as shown in Fig. 2-3, and (2) the number size
distribution of the input aerosol usually has a distinct peak. Therefore
curves of the type shown in Fig. 2-6 may become somewhat distorted;
however, it appears that the previous considerations regarding the EC's
size resolution remain essentially valid.
@ Absolute Size Calibration
For satisfactory aerosol characterization in the context of ACPL
experimentation, absolute size information is as important as size
resolution. Obviously, the accurate size selection in the EC depends as
much on the rigorous control of air density and velocity in the
20

jnstrument as it does on the precise voltage control. While the latter
did not appear to be a problem, maintenance and measurement of the exact
aerodynamic conditions inside the EC required particular care and atten-
tion.
The calculated calibration curve
shown in Fig. 2-2 correlates voltage
furnished by the manufacturer and
and particle size for "standard
flow rates", 20 a min -1 sheath flow and up to 6 Q min -1 of aerosol
flow. These conditions were applied throughout our tests; however, at
times it was difficult to maintain all flows as steadily as desired, and
t5% deviations were not unusual, Therefore, the effects of flow on -
sizing were determined experimentally by inputting fixed size aerosols
and performing voltage scans at various flows. Fig. 2-8 illustrates the
effect of variations in aerosol flow (using the fixed output of another
EC); as discussed previously, the width of the resulting peaks increases.
predictably with increasing flow, but there is also a noticeable shift
towards higher voltages with increasing flow, corresponding to a 1 to 2
nm increase in particle diameter. Considering that (in this example)
the flow was more than doubled, no significant size shifts due to small
inadvertent aerosol flow changes have to be expected. However, since
the number concentration of the passing aerosol fraction is approximate-
ly proportional to the aerosol flow, changes in the latter could
noticeably distort a measured size distribution.
Figs. 2-9 and 2-10 show how the voltage associated with the peak
of a latex aerosol shifts as the sheath and/or excess flows through the
EC are varied. The relative changes in apparent particle size and flow
rate are about equal and, therefore, the effect of changing sheath flow
cannot be ignored. .
21

0.010
0 SAMPLE FLOW AT 4.75 LPM
0 SAMPLE 0 SAMPLE FLOW AT 2.2 LPM FLOW AT 2.2 LPM
0.008
a n I
0 -- - - 942 II75 I 1464 1826 2277 7 EC VOLTAGE - V EC VOLTAGE - V
60 70 PARTICLE DIAMETER - nm
Figure 2-8. Effect of sample flow variation on response of EC to fixed input (triangular size distribution).
.
22
-

360 -
T m
% y 350- 3 s L
2 5 340 - 5-J
z:
330 -
320 I I I I + 2600
I I I
1500 1600 1700 I800 2700 2800 2900 3000
EC VOLTAGE-V I I I I
67 71 90 94
PARTICLE DIAMETER - nm
Figure 2-9. Effect of sheath flow on position of response peak from a "monodisperse" latex input (85 nm).
23

24 + I I I
0 EXCESS FLOW, SHEATH FLOW CONSTANT AT 20 LPM
0 SHEATH FLOW, EXCESS FLOW CONSTANT AT 20 LPM
I I I 2000 2200 2400 2600
EC VOLTAGE - V
Figure 2-10. Effect of change of sheath or excess flow on output peak position; input: 91 nm latex.
24

In order to avoid the problems associated with flow inaccuracies
and variabilities, the thermal flow meters of the EC were frequently
recalibrated and, if necessary, their output recorded over the duration
of particularly sensitive experiments. Since the EC's flow meters
measure mass flow, it is important to perform calibrations at the pres-
sure regime used during experimentation.
A further reason for monitoring air pressure in the EC is the
pressure dependence of the mean free path of the gas molecules which
determines the Cunningham slip correction to which the mobility of the .
particles is directly proportional. While the curves in Fig. 2-2 are
based on standard pressure, calculations show. that, for DRI’s altitude
of 1500 m, particles would, for instance, measure 54 nm instead of 50 nm
for a voltage of 950 V, or 106 nm instead of 100 nm at 3400 V. This
correction did bring most of the latex sphere test results very close to
the calibration curve. However, for very accurate experiments, it will
be advantageous to take into account whether the EC is run in an
overpressure or underpressure mode.
Since even "monodisperse" diagnostic latex aerosols are not always
of the stated size, precision work requires true size calibration of the
EC with monodisperse aerosols (preferably generated with another EC)
which are suitable for transmission electron micrography without suscep-
tibility for size changes in vacuum and electron beam.
0 Number Sensitivity
As pointed out earlier, the -excellent size resolution of the EC
leads to a relatively small number output of the instrument, which is
further reduced due to the small fraction of singly charged particles
25

available for the classification process, diminishing especially rapidly
with decreasing size below about 50 nm. The effects of this problem are
illustrated in Fig. 2-11 which relates particle size to the minimum *
aerosol concentration required in the EC input to provide sufficient
particle numbers in the output for counting with either the EAD or the
TSI-CNC at 2 or 6 Q min-' aerosol flow rates. Low flow rate not only
narrows. the size interval (thereby reducing the output particle concen-
tration) but, in the case of the EAD, also diminishes the particle
(i.e., charge) flow rate, thus compounding the effect of low flow rate.
If a TSI-CNC** could be used to monitor the EC output, the sensitivity
could be increased considerably; the curves in Fig. 2-11 pertaining to
the CNC were calculated on the basis of a required concentration of 10
cm although the TSI-CNC per se could be used at one to two orders of
magnitude lower concentration, but counting statistics might be unsatis-
factory. Below 20 nm particle diameter this instrument's sensitivity
drops rapidly, thus the curves were not extended below that limit.
0 Multiole Charae Comoensation
While uncertainties in the exact value of the fraction f, of
singly charged particles (see Figs. 2-3 and 2-4) of sizes below about 30
nm may lead to questionable values in that low size range for size
distributions obtained with the EC, above the size of 30 nm interference
from multiply charged particles has to be taken into account; however,
* Note that the values of the ordinate are normalized to a diameter
interval of a decade. **
The TSI-CNC Model 3020 was put on the market too late to be used on this program. For zero-g applications, a substantial modification would be required.
26

9 a’
- \’
I -
IO6 -
105-
IO4 -
IO3 -
IO2 -
IO’;.
EAA
\\\\ ~ I I
IO 100 I PARTICLE DIAMETER, Dp - nm
Figure 2-11. Minimum required particle number density (AN/Alog Dp) ver- sus diameter for EC at different flow rates and with different particle sensors. Same for EAA at standard operating conditions (quarter-decade channel widt'h).
27
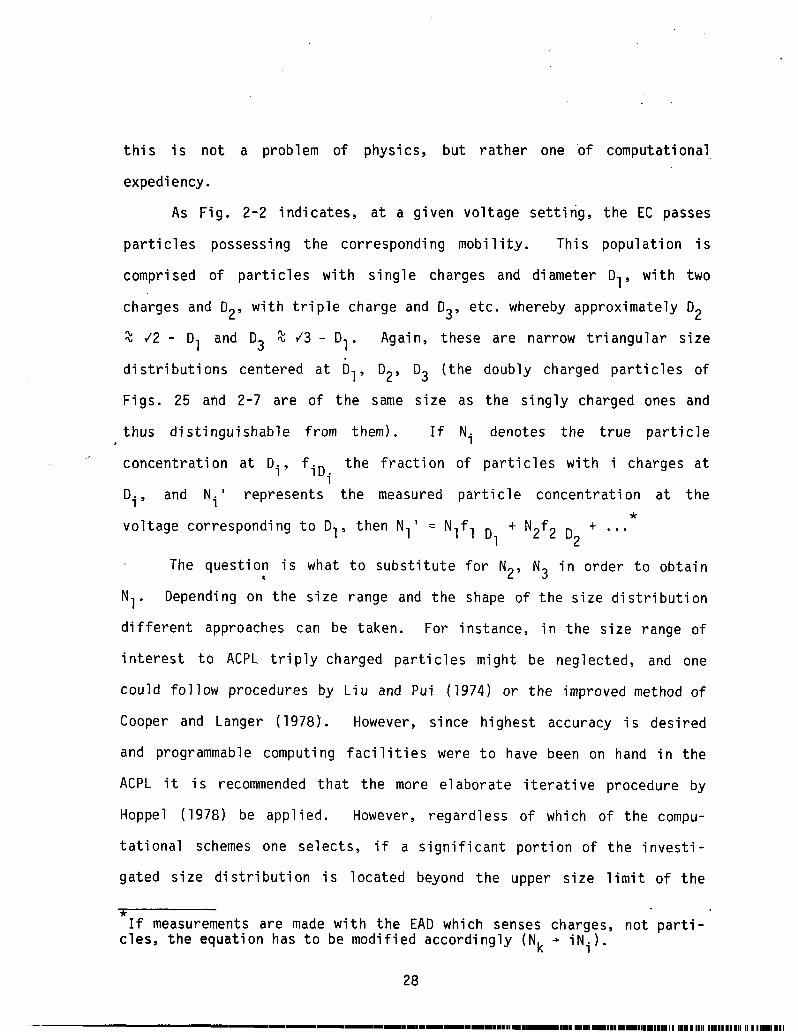
this is not a problem of physics, but rather one of computational.
expediency.
As Fig. 2-2 indicates, at a given voltage setting, the EC passes
particles possessing the corresponding mobility. This population is
comprised of particles with single charges and diameter D,, with two
charges and D2, with triple charge and D3, etc. whereby approximately D2
2 J2 - D, and D3 2 J3 - D,. Again, these are narrow triangular size
distributions centered at D,, D2, D3 (the doubly charged particles of
Figs. 25 and 2-7 are of the same size as the singly charged ones and
thus distinguishable from them). denotes the true particle . If Ni
concentration at Di, fiD the fraction of particles with i charges at i
Di 3 and Nil represents the measured particle concentration at the *
voltage corresponding to D,, then N,' = N,f, D + N2f2 D + . . . 1 2
The question is what to substitute for N2, N3 in order to obtain c
N1' Depending on the size range and the shape of the size distribution
different approaches can be taken. For instance, in the size range of
interest to ACPL triply charged particles might be neglected, and one
could follow procedures by Liu and Pui (1974) or the improved method of
Cooper and Langer (1978). However, since highest accuracy is desired
and programmable computing facilities were to have been on hand in the
ACPL it is recommended that the more elaborate iterative procedure by
Hoppel (1978) be applied. However, regardless of which of the compu-
tational schemes one selects, if a significant portion of the investi-
gated size distribution is located beyond the upper size limit of the
* If measurements are made with the EAD which senses charges, not parti-
cles, the equation has to be modified accordingly (Nk + iNi).
28

EC, N,, if near, but below that, limit cannot be calculated since N2',
N3' for DE, D3 are not available to approximate. N2, N3. For the
originally intended ACPL application, most size spectra of interest
would have existed within the EC's range (which, if necessary, could
have been extended upwards to some extent by reducing the flow rates).
b. Electrical Aerosol Analyzer
(1) Principle of Operation
The Electrical Aerosol Analyzer (EAA), another TSI product, Model
3030, uses essentially the same cylindrical high voltage condenser as
the EC to size discriminate by electrical mobility; however, it differs
from the EC in two important aspects:
e Aerosol particles are exposed to unipolar ions produced in a
corona discharge. This leads to a higher charge level and associated
increased number sensitivity,. especially for the larger particles (100
to 1000 nm); but no charge equilibrium is achieved, and, therefore, the
time of exposure to the charging region (and thus the flow rate) has to
be controlled very carefully.
e A built-in electrometer measures the number of those parti-
cles (i.e., their charges) which are not deposited at the center
electrode. Thus, a voltage scan produces a cumulative mobility spectrum
from which a differential size spectrum is derived in the evaluation
process. These features and associated air flows are shown schemati-
cally in Fig. 2-12. It is important to note that a charger sheath flow
keeps the aerosol at a distance from the ion source in order to prevent
formation of a wide charge distribution for a given particle size.
29

AEROSOL
AEROSOL FLOWYETER
AEROSOL FLOW
ADJUST
- SHEATH
AIR IN
- ABSOLUTE
FILTER
ANALYZER SHEATH
AIR
L
7
-. . . l
: ’
. . c-
.”
.a.
::
:,,
.I
:.
-1
. .
I
:
.
1.
*‘.
.
:
. .
‘,
,
:’ , -
I
-CHARGER
TOTAL FLOW ADJUST
r
FLOWMETER
5 ELECTROMETER ASSEMBLY WITH
ABSOLUTE FILTER
Figure 2-12. Schematic of TSI Model 3030 Electrical Aerosol Analyzer (EAA) [from Instrument Manual].
30

Detailed descriptions of the apparatus are given by the designers (Liu,
et al., 1974; Liu and Pui, 1975).
(2). Special Problems
In the process of evaluating the EAA a number of comparisons with
the EC provided the following information. With respect to the minimum
.particle concentration needed to obtain a signal, Fig. 2-11 shows that
the EAA has some advantage over the EC, especially for particle sizes
above about 100 nm. However, the values of Fig. 2-11 were obtained with
the assumption of four size steps per size decade since the standard
version is usually operated in that manner. Would one use, e.g., size
intervals of l/20 decade, as in the case of the EC at 2 L min -1 flow,
the EAA values of Fig. 2-11 would have to be moved up by a factor of 5,
narrowing the EAA's advantage over the EC considerably.
While the higher number sensitivity of the EAA is helpful in many
applications where particle concentrations are not very high, it also
contributes to the lack in resolution through large size intervals. In
order to determine the response of the EAA to a monodisperse aerosol, an
experiment was conducted where the EAA sampled an aerosol of 91 nm latex
spheres which had been passed through an EC for further narrowing of its
size distribution (which also reduced and narrowed the small portion of
doubly charged doublets - see III.D.3). Fig. 2-13 illustrates the input
into the EAA in the form of a singlet and a doublet peak (triangles) as
expected from the various.EC experiments, and the actual response from
the EAA. It clearly shows that the EAA cannot resolve a detailed
structure such as the two peaks, and it also indicates that considerable
broadening occurs. The same observation was reported by Vali et al.
31

“I E 0
a’
--- EXPECTED EC OUTPUT = EAA INPUT
- EAA OUTPUT
-T II II 11 1 I ’ I ’ I ’ I ’ I I .; ’ I I I ’ I ’ I ’ I I I 1 I ’ I I
I I 1 I I
l-id
4 I\
1 \ 1 \
I 1 \ \ I I I 1 ,,,I
0 1000
DIAMETER - nm
Figure 2-13. Response of EAA (solid line) to input with bimodal size distribution (dashed).
32

EAA DILUTOR
CNC-2
rl EAD
205 kPo
Figure'2-14. Flow diagram for EAA - EC/EAD comparison of polydisperse
NaCl aerosol (numbers indicate flow rates in cm s 3 -‘; 205
kPa refers to input air pressure; M = manometer).
33

(1978) regarding similar experiments during the DRI - Univ. of Wyoming
Workshop in Laramie. This effect probably stems from a rather broad
charge distribution generated in the charging section of the EAA. No
explicit data on how the charges are distributed for each particle size
could be found in the literature, only average charge vs. size for
various ion concentrations and residence times. While the EAA's resolu-
tion might be satisfactory for most applications involving polydisperse
aerosols in the atmosphere or industrial environments, it is not suffi-
cient for high precision work as proposed for ACPL.
Another drawback of the EAA regarding laboratory applications, and
especially ACPL, is the high sheath air and sample flow rate which is
twice the value needed for the EC.
In further comparative experiments during the joint DRI-Univ. of
Wyoming Workshops, the particle concentration aspect of the instrument
was examined. Two types of comparisons were made:
a Polydisperse salt aerosols were size-analyzed by the EAA and a
EC-EAD, and the measured size distributions compared; the experimental
set-up which also included a total particle counter (GE CNC-2) is shown
schematically in Fig. 2-14. The dilutor upstream of the EAA was
necessary because of the large .difference in sensitivity between the EAA
and the EC-EAD (see Fig. 210). Although the normalized size distribu-
tions coincided very well, the experiment had to be termed inconclusive
due to a large discrepancy in absolute number concentration (EAA much
lower) which had to be traced, in part, to unsatisfactory performance of
the dilutor, but which may also have been related to problems of the EC;
namely, to the uncertainty in the fraction of singly-charged particles
34

- 205 kPa
.
Figure 2-15. Flow diagram for EAA - EC/EAD - CNC-2 comparison with monodisperse NaCl aerosol (numbers indicate flow rate in
cm35-' ; 205 kPa refers to input air pressure; M = mano- meter).
35

or the width bDp of the passing fraction. It should be noted that
CNC-2 and EAD measurements agreed within 5 to 10% with each other.
@ The monodisperse output of an EC was measured by the EAD, a
GE CNC-2 and the EAA according to the flow diagram of Fig. 2-15 (not
sufficient flow could be generated to simultaneously feed the EAA and
the CNC-2).
Particle Diameter (nm) Particle Concentration (cmB3)
EC CNC-2 EAA
30 5,300 5,300 7,400
:"o 24,900 17,700 22,500 14,700 22,000 37,000
1;: 25,000 28,300 26,000 23,500 49,000 33,000
This represents a better test for the EAA as it is essentially a
comparison with the EAD (not the EC), a more basic measurement. As the
above table indicates, the relatively good agreement of EAD and CNC-2
(which was checked periodically with a Pollak counter) suggests that the
EAA did overcount by at least 50% over most of its range. Further
comparisons are presented by Vali et al. (1978) which essentially led to
the same conclusion.
2. Diffusion Batterv
Characterization of aerosol size distributions is a special prob-
lem since: (1) typical aerosol size spectra span four to five orders of
magnitude; (2) the best optical methods cover only the largest two of
these decades; and (3) aerosol systems are dynam.ic in character, con-
stantly evolving in response to events such as Brownian diffusion and
coagulation. Since the 1940's when the first reliable aerosol counters .
,
36

I\
were developed, workers have been aware of the magnitude of this
problem, as well as some possible solutions.
One of the earliest approaches to size spectra characterization is
still one of the most reliable. Early workers in aerosol science were
acquainted with the results of molecular physics and kinetic theory
derived in the early part of the century (principally by Einstein);
these give the inverse relationships between the size of a particle and
its mobility while 'undergoing Brownian diffusion for particle sizes of
order one mean free path or smaller. Therefore, by suitable data
inversion techniques, one can infer particle size distributions by
looking at the way in which the total aerosol count (measured by an
Aitken counter) is decreased when the sample is forced to pass through
some kind of duct or tube. Physically what takes place is that, due to
the inverse relationship between size and mobility, the smallest parti-
cles in the distribution diffuse most quickly to the walls of the duct.
While the mechanisms of adhesion of aerosol particles to surfaces are
not very well understood, careful experiments have shown that detachment
almost never occurs. Therefore, it is a relatively straightforward
manner to incorporate the theory of diffusion mobilities and the bound-
ary conditions or geometry of the duct into a partial differential
equation, the solution of which allows prediction of the decrease in
aerosoJ. caused by diffusion to the boundaries.
It is now possible to obtain commercial "diffusion batteries"
which basically provide the duct mentioned above, and aerosol sampling
ports. When such a device is used together with a detector of the total
count of the aerosol which has survived the diffusion process, the
37

resulting data can be inverted to give back the original size dis-
tribution of the aerosol ,particles. The DRI program has utilized the
TSI 3040 Diffusion Battery, basically the same model intended for use in
ACPL, together with a standard Pollak (Aitken particle) counter for
aerosol counting. While use of this method is laborious (since up to 20
measurements must be taken to characterize one aerosol sample) other
methods are relatively indirect and unproven. In addition, a diffusion
battery which utilizes a Pollak counter as detector is probably more
reliable than commercial differential mobility analyzers (e.g., the TSI
Electrical Aerosol Analyzer) at small aerosol diameters (around 0.01 pm).
The diffusion battery, the DRI CFD chamber, and the University of
Wyoming Electrical Aerosol Analyzer (EAA) were compared in a series of
experiments-.during the University of Wyoming/DRI Workshop of September,
1977. Figures 2-16 through 2-20 show the results of five of these
experiments, using bagged NaCl, H2SO4, and AgI aerosols (a sixth experi-
ment is discussed in the section on the Photolytic Aerosol Generator).
At least for the (very soluble) NaCl and H2S04 aerosols, one would
expect good agreement between the diffusion battery and CFD chamber;
this is reflected in the results. The EAA, as expected, tends to come
into agreement with the other two devices as size increases. It is
noteworthy that this type ,of EAA-diffusion battery discrepancy has
frequently been observed in sampling of ambient atmospheric aerosols,
carried out by this laboratory in various field operations.
In general, the three devices related consistently to one another
with the CFD chamber giving the lowest or nearly the lowest count at a
,38

A
A
2 I0 IO
I I I”1111 I I I ‘I’ll
100 1000 PARTICLE DIAMETER - nm
Figure 2-16. Cumulative number size distribution of bagged NaCl aerosol as measured with diffusion battery (DRI), EAA (Wyoming) and CFD chamber (DRI). expt. 2.
Univ. Wyoming-DRI Workshop 1977, . .
39
- -.-.._-_..- ..__. ---- _.--... ..--

I6 w z
E 6 Al
? [ E 0
ii I z
IO3
IO2 IO
0 A
-b
PARTICLE DIAMETER - nm
Figure 2-17. Cumulative number size distribution of bagged NaCl aerosol as measured with diffusion battery (DRI), EAA (Woming) and CFD chamber (DRI). Univ. Wyoming-DRI Workshop 1977, expt. 3.
40

I
A A*A
0 0
+
OA OA + + 0 0
A
I lo:0 I I I I ““1 I I I I I'll 100 1000
PARTICLE DIAMETER - nm
I ‘I ‘11’1 ‘11’1 I I I .I I I ‘IL
+ CFD + CFD
A WYOMING EAA A WYOMING EAA
0 DIFFUSION BATTERY 0 DIFFUSION BATTERY -
A
A
Figure 2-18. Cumulative number size distribution of bagged NaCl aerosol as measured with diffusion battery (DRI), EAA (Wyoming) and CFD chamber (DRI). Univ. Wyoming-DRI Workshop 1977, expt. 5.

104C I I I IllIll I I ‘I l I l’q
A A 1
A WYOMING EAA 3
n A
A 0
0 0
0
0 DIFFUSION BATTERY 1
A
a
I (O'lO
I I I I "'lI I I I ""'I
100 1000
PARTICLE DIAMETER- nm
Figure 2-19. Cumulative number size distribution of bagged AgI-NH41
complex aerosol as measured with diffusion battery (DRI) and EAA (Wyoming). 9.
Univ. Wyoming-DRI Workshop 1977, expt.
42

I I l’l’l~ I I I 'III
A
A
0
0 +
+
I
+ CFD
A WYOMING EAA
0 DIFFUSION BATTER
A
0
A
+
I I I l”‘ll I I I Ill’ 100
PARTICLE DIAMETER - nm
Y
Figure 2-20: Cumulative number size distributions of bagged H2S04
aerosol as measured with diffusion battery (DRI), EAA (Wyoming) and CFD chamber (DRI). Univ. Wyoming-DRI Work- shop 1977, expt. 15.
43

given size, the diffusion battery reading about the same or slightly
higher; and the EAA usually reading highest.
The TSI 3040 Diffusion Battery was found to suffer some disad-
vantages which probably prevent the user from realizing the full accur-
acy inherent in the diffusion battery .method. The 3040 is an array of
randomly-oriented screens, the mesh of which measures about 20 pm per
side. This geometry is understandably resistant to description by an
analytical model; the commercial devices were actually calibrated by
experiment using monodisperse aerosols (Sinclair, et al., 1979). One may
either use aerosol penetration nomograms, provided with the 3040, or a
computer program (Sinclair, et al., 1977) for reduction of the data from
the Model 3040, but in either case the technique is a sequential,
"graphical stripping" process when one starts with a data point at the
largest size and proceeds point-by-point to the smallest size. The
actual penetration data are compared to the manufacturer-supplied .cali-
bration data at each point; note that a new calibration is required for
each flow rate to be used. Each derived data point depends upon the
results of the previous (next largest size) data point, so considerable
opportunity exists for cumulative error to develop by the time the
small-size data are finally extracted.
The reader may refer to Twomey (1975) for a qualitative descrip-
tion of the resolution and accuracy of a diffusion battery consisting of
an array of cylindrical holes, a considerably more ideal situation than
the Model 3040, and one amenable to analytical modeling. Twomey (op.
cit.) has presented an inversion algorithm which is not subject to the
cumulative error described above, but which may strictly only be applied
44

I
to diffusion battery geometries which may be analytically described.
Very recently, Remiarz, et al. (1980) have modified this algorithm in
order to apply it to the Model 3040. The result should be a significant
improvement in this device - e.g., in its ability to resolve two
monodisperse aerosols closely spaced in peak radius.
The basic accuracy specification of the Model 3040 is probably
much worse than if the same device is used with Twomey's inversion
scheme, or if a more ideal geometry is used with Twomey's method. In a
brief computational experiment with data from the Model 3040, it was
estimated that simple cumulative errors in the graphical stripping
method could be as high as +25% (of the number concentration assigned to -
the smallest-size end of the inferred distribution). In the data shown
in Figs. 2-16 through 2-20, every effort was made to keep such error to
a minimum.
C. "HARD COPY" SAMPLE ACQUISITION
There are several reasons for acquiring actual physical samples of
aerosol particles. Hard copy samples, first of all, serve as back-up in
case of malfunction of real-time, on-board aerosol characterization
equipment. However, as pointed out in Section 1I.B (Absolute Size
Calibration), size verification is of utmost importance in order to
assure validity of in-flight experimental results, even if pre- and
post-flight terrestrial calibrations are carried out. Furthermore, it
may be very advantageous to be able to retrieve additional information
from particle deposits not otherwise available, e.g., particle shape
which could be important in various respects; also chemical information
or indications of particle generator problems could be obtained.
45

1. Methods of Investigation
The size of particles in question rules out any other method but
electron microscopy and related investigative tools such as energy
dispersive X-ray emission analysis. Most basic information needed for
the ACPL experiments, e.g., size, number and morphology of particles can
be obtained from straightforward electron micrographs. The two basic
choices are scanning (SEMI or transmission electron microscopy (TEM).
The SEM offers the advantages of a pseudo three-dimensional appear-
ance of the sample with great depth of focus and no particular require-
ments with regard to sample substrate. On the negative side, there is
insufficient resolution for most of the CCN particle size range of
interest to ACPL. Depending on the particular instrument, the reso-
lution is on the order of 10 nm or somewhat better; thus for particles
about 50 nm and larger, a SEM analysis may be of value. Fig. 2-21
illustrates a case of that type where 75 nm NaCl particles (nominal
diameter from the EC) were deposited on a 200 nm pore nuclepore filter.
While it seems quite possible to achieve a sizing accuracy (on well-
focused micrograph) on individual particles of t5% an additional problem -
is caused by the gold coating applied to prevent charge build-up under
the electron beam. This coating typically adds 10 to 20 nm to the
diameters of the particles but, on this program, it was not possible to
determine how reproducible in thickness this coat can be applied from
sample to sample - 10% is an estimate based on the limited number of
samples taken during the course of this project.
The major advantage of examining CCN by TEM lies in its much
better resolution - about an order of magnitude higher than the SEM. On
46
I I I 11111 I

Figure 2-21. Scanning electron micrograph. of 75 nm diameter (nominal NaCl aerosol sample on 200 nm pore nuclepore filter. (Many larger, multiply charged particles are present while the majority of 75 nm particles are trapped insid pores).
47

the other hand, the TEM method only produces what amounts to shadow-
graphs, and any information on the third dimension has to be obtained by
oblique shadowing.. A further difficulty stems from the need for a very
thin (electron transparent) substrate that is not only mechanical-ly
'weak, but also is often unable to remove the heat generated by the
electron beam fast enough to prevent damage to the sample. Preparation
of samples for TEM also requires more delicate handling and often
tedious procedures to achieve the most informative shadowing. However,
the amount of material deposited in the shadowing process generally does
not add significantly to the size of the deposited particles; otherwise,
an estimate of the size increase can be obtained through careful
exanlination of the micrographs.
Since the study of particle samples by SEM and TEM has become
mostly a routine operation by specialized laboratories, only a low
priority was assigned to generating electron micrographs. In those
instances during the present investigation where particle samples had to
be examined at high magnification, an IS1 Miniscan III SEM accessible to
the DRI investigators was used.
2. Preparation of Samples
The above discussion on electron microscopy implied that it would
be most advantageous to prepare aerosol samples such that they could be
investigated with either instrument, SEM and/or TEM. It was therefore
necessary to review methods of sample preparation with this objective in
mind.
a. Particle Sample Substrates
Sample preparation consists, in principle, of bringing a repre-
sentative population of particles in sufficient numbers onto a surface
48

suitable to support the sample during investigative procedures. While
such a substrate has the primary function to hold the particles in
place, which mainly requires a material not reactive with the sample, it
also has to be compatible with the conditions in the SEM or TEM
(preferably both). Ideally, a substrate would also serve as the sampl-
ing surface which would greatly facilitate sample preparation and reduce
the risk of sample alteration by loss or contamination during transfer
onto the substrate.
For work with TEM, only thin films of carbon, silicon monoxide or
similar materials mounted on standard 3 mm specimen screens can be used,
whereas SEM accept most anything as long as the surface can be made
conductive. For the limited amount of SEM work performed on this
project,.. Nuclepore filters were used which have a particularly smooth
surface, very low background contamination and could also serve as
aerosol samplers.
b. Aerosol Precipitation Devices
Methods suitable to remove aerosol particles in the 10 to 100 nm
size range from the suspended state onto a collection surface are based
on Coulomb, th'ermophoretic and inertial forces. Instruments using these
forces to collect aerosol samples - electrostatic precipitators, thermal
precipitators, centrifuges and filters - were taken into consideration
for obtaining ,hard copy aerosol samples on the ACPL.
In addition to the obvious criterion of providing representative
samples, the selection of the most suitable sampling device has to be
based on several other conditions. Due to the multitude of instruments
sampling from a relatively limited aerosol source, it is important that
49

the sample can be acquired efficiently with little waste. In principle,
from a statistical viewpoint, a 'sample containing as few as lo4 parti-
cles could be acceptable. However, in order to study it by SEM or TEM,
there should be at least a minimum particle concentration on the
substrate of 1 pm -2. , this would concentrate the total sample to an area
of only 100 x 100 urn2 which is of the order of one mesh of a TEM speci-
men grid. This clearly illustrates that a much larger sample is re-
quired to reduce the risk of loosing the sample through substrate break-
age or accidental local contamination; also, it would be difficult to
concentrate a sample on an area that small (except with jet impactors
which are unsuited for our size range).
Thus, it appears that the area represented by a TEM specimen grid
(0.3 cm diameter) is the smallest practically acceptable sample. Com-
bined with the postulated minimum particle number density on the sub-
strate, this translates into a sample requirement of lo7 particles.
Assuming that aerosol of the final dilution* is to be sampled (i.e., 100
to 1000 cm -3), at least lo4 to lo5 cm3 (10 to 100 a) aerosol would have
to be ingested by the part
normal experiment duration
dilution can be justified.
*
llector in a time period not to exceed icle co
(~1000 set), unless sampling *prior to final
Since it is anticipated that test aerosols in the ACPL are diluted in two stages from the original high concentration off the generator to a final particle concentration in the range of 100 to 1000 cm-3 for use in cloud chambers, a choice exists as to where (i.e., at what concentra- tion) hard copy samples should be withdrawn. Obviously, one should aim , for sampling on the final dilution rather than to assume a high concentration sample to be representative; nevertheless, the need to obtain samples from high concentration aerosol may arise under certain conditions.
50

In order to determine whether the above mentioned candidate col-
lectors are compatible with the sampling requirements just developed, it
is necessary to briefly examine the collection characteristics of these
devices.
(1) Aerosol Centrifuges
In concept, aerosol centrifuges consist of an annular or helical
channel through which the aerosol is passed in a slow laminar flow while
the whole annulus or helix rotates about its axis at several thousand
rpm; thus, by design, particles settle along the whole channel length at
positions governed by their size, density and initial position at the
inlet. This spectrometric feature is particularly advantageous where
evaluation is not performed by EM study of individual particles and
where copious amounts of aerosol are available. However, in the present
application, it would be very difficult to achieve a particle coverage
suitable for SEM or TEM work considering that tens of square centimeters
of deposition surface are available. A large number of specimen grids
would have to be placed at intervals on the deposition surface, but with
risks of missing an important deposit in between grids. Therefore, it
was felt that current designs of centrifuges would not be suitable for
tasks on ACPL.
(2) Filters
Two types of filters were considered which had been used by other
investigators in conjunction with electron microscopy. Nuclepore filters
(NF) consist of a polycarbonate foil of 10 pm thickness that contains
randomly distributed cylindrical holes of fairly uniform size (with a
wide range of hole sizes to choose from: 50 nm to 10 urn). The membrane
51

filters (MF) on the other hand, are composed of a fiber-iike cellulosic
matrix about 150 pm thick; they also are available in a range of nominal
pore sizes although the pore dimensions are not as well defined as in
the NF case. Both filter types have similar flow resistance (depending
on pore size), but the main differences between the two types from the
user's standpoint are the surface characteristics, the retentivity and
the mechanical strength. NF have a very smooth surface most suitable as
a substrate for SEM work whereas the network structure of the MF
seriously impedes detection and assessment of deposits. A further
advantage of NF is their superior mechanical strength (tear resistance)
over MF. With regard to particle retention (a most important parameter)
however, NF does not perform as well as MF, especially in the particle
size range of interest to ACPL (see the detailed study by Spurny, et
al., 1969).
Before going into further details, the sampling conditions and
requirements as they apply to the filters have to be examined. In order
to be able to handle the filter and to transfer the sample onto a TEM
specimen grid, a filter area somewhat larger than the grid should be
available - typically on the order of 0.5 cm2. Recalling that we need
at least 1 particle/pm2, ,_'
the necessary sample volume containing 5~10~
particles would be 50 to 500 R for aerosol concentrations of 1000 or
100 cmw3, respectively. If one postulates that sample acquisition
should not last longer than about 1000 seconds, the required filter face
-1 velocities would be 100 or 1000 cm s , respectively.
Consulting the diagrams of Spurny, et al. (19691, one finds that
these flow requirements can, at best, only be fulfilled marginally by NF
52

for the case of the higher particle concentration. If the pores are
large enough to allow a high flow rate, the particlesed not diffuse to
the filter surfaces in the short time available, whereas pores small
enough for diffusive capture of CCN-size particles would prevent the air
flow from reaching the needed rate. For instance, the sample exhibited
in Fig. 2-21 was collected by using a 4 cm s -1 face velocity which, as
our measurements showed, provided total retention in the NF, though only
to a small degree on the filter face, but mostly inside the 200 nm pores
(the good surface coverage was possible only because of a. particle
concentration of over 105cm -3 in the aerosol). Operation of the filter
at more than 20 times higher speeds would have caused passage of
possibly half the particles.
MF, on the other hand, offer a more efficient way to capture
particles as they are more than ten times thicker than NF; also, the air
takes a more tortuous path through MF giving the particles a better
chance to diffuse to the fiber surfaces even at face velocities that
would meet our sampling requirements.
Thus it appears that there are two non-ideal possibilities for
employing filters for hard copy aerosol samples:
(1) NF could be used only for sampling undiluted aerosol, and
even then part of the sample would most likely deposit inside the holes
such that a direct evaluation by SEM would not yield a representative
picture. Therefore, the sample would have to be transferred to a dif-
ferent substrate, preferably a TEM grid, by slowly dissolving the NF on
top of the new substrate in chloroform vapor according to tried recipes
(e.g., Frank, et al., 1970; Chatfield, et al., 1978). This procedure
53

removes one major reason for using NF, its capability to act as both
collector and viewing substrate. A further disadvantage, as.Frank, et
al. (1970) point out, stems from the fact that particles trapped in the
filter's holes (which are much longer than wide) in the three-dimension-
al arrangement will be projected onto the new substrate in two dimen-
le density at the hole loca- sions, forming spots of very high partic
tions; this agglomeration may cause difficu
(2) By using MF of proper porosity,
lties in the evaluation.
one could obtain specimens of
the dilute aerosol; however, caution has to be applied when interpreting
the transferred sample: motion of the particles during dissolution of
the 150 pm thick filters may lead to some coagulation depending on the
number densities involved. Chatfield, et al. (1978) indicate that when
using identical transfer procedures NF did not cause this problem while
MF .had to be rejected because the sample was too much "rearranged" after
the transfer. Although, their case was somewhat different as they
studied fibers which did not enter the pores of the NF.
Weighing the two possibilities (partly based on literature, partly
on our own experiments), it seems at this point that the MF would be the
better sampling medium although, in the course of this project, only NF
were used for their convenience in SEM work. A final decision would
require a series of additional experiments which could not be performed
in the framework of the present program.
(3). Thermal Precipitation
Thermophoresis, the motion of particles in a gas in the direction
opposite to a temperature gradient depends on particle size and mater-
ial, carrier gas and temperature gradient. Theory and utilization of
54

this effect have been described in the literature (see, e.g:, Fuchs,
1964). While there are still numerous discrepancies between theory and
observation, for the present discussion it is sufficient to indicate
that the thermophoretic velocity, vT decreases only about 20% with an
increase 'in particle size from 10 to 100 nm. As a guideline, we select
as an average value vT = 0.2 cm's -' for a temperature gradient of
1QOO"C cm-'. Since vT is proportional to the temperature gradient, it
would seem simple to obtain .a high velocity by merely increasing the
temperature difference between the cold collection plate and the heated
area on the opposite side of the sample air stream. However, the
limitations are (1) for the cold collection plate that its temperature
be high enough to prevent particles from deliquescing and (2) for the
hot area that it would not thermally alter the collected particles
(e.g., decomposition, evaporation). This immediately suggests a further
constraint, the dependence on the substance the particles consist of.
Another limitation for the hot area is given by the condition that the
cold plate should not be warmed by radiation from the heate! parts.
Increase of the temperature gradient can also be achieved by narrowing
the gap between hot and cold plate; however, practical considerations
put the limit in the vicinity of 0.05 cm.
By selecting a hot plate temperature of a moderate 150°C in order
not to damage thermally delicate CCN, such as (NH4J2S04, a temperature
gradient of about 2000°C cm -1 can be established which results in v s T
0.5 cm s -1 . Since the sample air flow can only be parallel to the cold
collection plate vT essentially determines the density of the deposit,
while the sample flow rate mainly governs the area covered by the
55

sample, although its magnitude does have some secondary effects on the
deposit density. As a result, it is evident that, vT being one to two
orders of.magnitude less than the face velocity of the above discussed
filters, the thermal precipitator cannot compete in the sampling of .
diluted aerosol. Thus it could play a role in the ACPL only where
particle densities are of the order of 105cmm3 or more.
One advantage' of the thermal precipitator is its potential to
produce a deposit of very small dimensions with correspondingly small
flow rate. For instance, Binek (1965) designed a thermal precipitator
for exposure of just one TEM grid with a flow rate of only 0.1 cm3 s-'.
On the other hand, this does raise questions regarding diffusional
losses in sampling lines.
. 4. Electrostatic Precipitation
Basically, all electrostatic precipitators (EP) operate on the
same principle of charging the particles in order to cause them to move
in an electric field towards a collection surface. In some designs, the
same field is used to charge the particles and precipitate them (e.g.,
Morrow an: Mercer, 19641, while other models have separate charg ing and
precipitating fields. It is essentially the same procedure used in the
EAA to size discriminate particles, a fact that already point ;s to a
potential problem of the EP: since the sample air flow has to be more
or less parallel to the collection surface, i.e., perpendicular to the
electric field, particles of different size are precipitated at differ-
ent locations on the collection surface. In order to achieve a uniform
representative aerosol particle sample distribution on a TEM grid,
special design efforts had to be applied. An example.of such an
56

advanced sampler was described by Liu, et al. (1967) while the commerc-
ial version of the device, TSI model 3100, was used in the course of
this project. The essential novel idea of the designers was to pulse
the preci,pitating field such that it is off for three seconds and on for
1.5 seconds; the effect is that the particles (which were being charged
prior to entering the precipitating field) fill the whole area of the
field in the off period and precipitate everywhere in the field area
while the voltage is on. Sample flow velocity (~10 cm s-'1, length of
precipitating area (17 cm), voltage (4200 V) and gap between electrodes
(0.8 cm) were matched to achieve best results. The designers determined
experimentally that the somewhat size dependent collection efficiency
(e) ranged from about 0.5 for 10 nm (extrapolated) to 0.8 for 3 pm
particles, the losses occurring mainly in the charger and partly due to
uncharged particles.
Again, we need to know the density of the particle deposit (N,) as
a function of sampling duration (t) and aerosol density (N,). Since
during the voltage pulse all particles between the electrodes (distance
h) are precipitated, the density due to one pulse Ns' = N,*h*.e and Ns=
N,.h.e.f, where f denotes the frequency of voltage pulses (0.22
s-l). For Na = 1000 cms3 (final dilution) and 1000 seconds of sampling
NS 2. 105cm -2 or three orders of magnitude short of the required 1 pm -2
- a result very similar to what thermal precipitation offers which is
quite plausible since the deposition velocity in the EP is also only of
-1 the order of 1 cm s , a value that could not be changed drastically by
a different design. This clearly means that the electrostatic precipita-
tor, as its thermal counterpart, could be used on the ACPL only for
57

sampling undiluted aerosol.
5. Concluding Remarks on Hard Copy Sampling
In the above review of sampling devices, the question was mainly
whether a particular technique could furnish a sample in the allotted
time, and it has become quite clear that the membrane filter method has
to be given first preference on that account alone - the other devices
could only be used to sample aerosols prior to final dilution.
There are, however, other points to be considered, as, e.g.,
handling, risk of contamination, and weight.
With respect to handling, it is again the filter that ranks high-
est if in-flight procedures are the decisive factor since it is possible
to package each filter in a holder that can be connected very easily to
sampling lines. The other sampling methods all require insertion and
retrieval of TEM grids into and from the devices for each experiment, an
operation requiring great care and concentration. Post-flight handling
of the filters, of course, would also involve TEM grids, but a terres-
trial laboratory offers many advantages that contribute to reducing the
risk of failure.
The probability of contaminating filters enclosed in individual
holders is negligible during flight and experimentation. TEM grids, on
the other hand, could suffer from contamination while being handled in
flight. The one advantage, however, that TEM grids have over filters is
the possibility to inspect and preshadow them before flight. In
contrast, filters, especially MF, can only be examined for flaws on the
surface while the inner structure can only be appraised destructively on
a spot-check per batch basis. The transfer of sample from filter to TEM
58

grid also provides a chance for contamination, though in the terrestrial
laboratory it is easier to devise precautionary measures.
With respect to weight limitations, the filter system would have
an advantage, though the weight would be proportional to the number of
anticipated samples. If carefully engineered, thermal and electrostatic.
precipitators designed according to Binek's (1965) miniaturized versions
could possibly be kept quite light.
The discussion on hard copy sampling so far implied that only
solid aerosols were to be used, and our experiments concentrated on this
type of aerosols. However, it had always been planned for the ACPL to
conduct experiments with H2S04 aerosols, the particles of which remain
liquid even at low humidity. Since the size of these sulfuric acid
droplets depends on humidity, preservation of samples is considerably
more difficult, especially if preparation for electron microscopy is
involved. One should contemplate use of encapsulation schemes such as
the one applied by Phalen, et al. (19751, on cigarette smoke, and Ho, et
al. (1979) on NaCl solution droplets. The question is whether an
encapsulating (or fixing) agent can be found that is compatible with
H2S04 and meets toxicity standards set for ACPL by NASA. This leads to
the question of whether the encapsulation could be carried out after
sampling on filters or TEM grids. Due to the preliminary nature of the
present investigation, it was not possible to perform any experiments on
this topic.
59

III. AEROSOL GENERATION
In order to cover a broad range of conditions in ACPL tests of
cloud condensation models, CCN of a wide variety of properties were
deemed necessary. Soluble, insoluble and hydrophobic particles were the
main categories as defined by their interaction with water substance.
As representatives of the water soluble CCN, NaCl, (NH4),S04 and H2S04
were specified while, for the two other types, no particular substances
had been decided on at the outset of this program.
Aerosol generation techniques and associated problems are very
much dependent on and tied to the materials being used to form the
particles. The following chapters describe evaluative experimentation
with the various generation methods judged suitable or promising for
application with the particular types of CCN on the ACPL. The first
case is the photolytic system for producing H2S04 aerosol via gas-to-
particle reactions. This scheme represents an interesting alternative
to aerosolization by pneumatic atomization which is the subject of the
second chapter. Subsequent chapters are devoted to the formation of,
and experiments with, hydrosols of water insoluble particles (which,
again are aerosolized by atomization), and to the application of thermal
methods for generating certain insoluble and hydrophobic aerosols. The
fifth chapter deals with techniques for shaping size distributions,
mainly to achieve a high degree of monodispersity.
A. PHOTOLYTIC AEROSOL GENERATOR (PAG)
When this project was initiated, the PAG was a prime contender for
ACPL particle generation due to the conceptual simplicity of photolytic
60
production of H2S04 and. the potential that sulfuric acid aerosols
generated in that manner could best simulate anthropogenic aerosol.
However, as indicated in the introduction, it became necessary, as the
program progressed, to redistribute the levels of effort in favor of the
atomizer. Thus, the originally intended extensive study of all perti-
nent parameters had to be reduced to an investigation of a rather
exploratory character yielding mainly qualitative results.
While it never was a goal of this study to contribute to the
elucidation of the mechanisms leading to the formation of sulfuric acid
aerosol, existing concepts served as a guide in interpreting some of the
results obtained in the present investigation.
Considerable work carried out under other sponsorship* (see Lamb,
1978 and 1979) contributed to this study, mainly in the form of a gas
and humidity delivery system (which controls the.input into the PAG) and
experience gained in related experimentation with longer wavelength UV
(A>300 nm) . While that gas delivery system will not be described here,
the PAG input values will be discussed.
In conformance with this contract,the final PAG model developed in
this study (Model D) represents the deliverable item. The first section
below describes how this final version evolved from the original model
and points to the rationale for the various changes'in design. In order
to facilitate comparisons, performance data of.all versions are present-
ed and discussed in Section III.A.2. A brief description of the SO2
stripper, Section III.C, has been incorporated in this chapter since
this device is mainly thought of as an accessory to the PAG.
"Southern California Edison Company.
61
I -

1. Design Considerations
In order to arrive at an initial "baseline" design, the following
factors were taken into consideration. Simplicity and an obvious aim
for compactness and light weight called for restriction to SO2 as the
only ingredient in addition to readily available air (including water
vapor).
Previous experience had indicated that copious aerosol production .
in such a system required the use of short wavelength UV radiation
(xc300 nm). Thus, the availability o/f small germicidal lamps (G.E. No.
G8T5, 1.5 cm diameter and 26.6 cm active length) tentatively determined
the approximate dimensions of the initial PAG model. Off-the-shelf lamp
and reflector assembly suggested a configuration of four lamps clustered .
around a cylindrical reaction chamber of about 10 cm in diameter and 30
cm in length (see Figures 3-l and 3-2). Due to its excellent transmis-
sivity in the short UV (see Figure 3-31, quartz was used as chamber
material and conical ends with l/4 inch connector nipples were affixed
to the 10 cm diameter quartz tube.
This one-piece, all-quartz design of the PAG chamber was used for
many of the measurements which will be discussed in the next section.
The advantage of this version (Model A) was its freedom from leaks and
from contamination by other materials. However, its main disadvantage
was the impracticability of altering the geometry. For instance, it was
suspected that turbulence inside the quartz chamber was the source of
output instabilities, and thus, based on auxiliary tests, a flow
straightener was to be installed. Since this was not possible in the
original one-piece construction, an alternate design had to be sought
62

QUARTZ TUBE
‘BALLAST BOX
Figure 3-l. Cross-section of photolytic particle generator (Models A,D).
63

Figure 3-2. Photograph of photolytic aerosol generator (Model A). One of the four lamps was removed to show the horizontal quartz irradiation chamber.
64

I \ , i, ! i; :i ‘I
IO -
I-
4 IL 1 I
GERMICIDAL LAMP
/------ - _---- ‘K TRANSMISSIVITY OF QUARTZ
f
0 A, nm
Figure 3-3. Spectrum of light output of GE germicidal lamp.
.65

.
ABSORPTION SPECTRUM FOR “TEFLON” FEP FILM
+.+ t.-.; - , : - 1 . ! : : / ; 1 .I0
: ! 1 -.. ” “’ . .I I-. 1
-“TEFLON” FEP, 1 MI1 I
.’ Ii, ARC SOURCE, STRAIGHT LINE TRANS.
. H, ARC SOURCE, DIFFUSE LINE TRANS CI TUNGSTEN FILAMENT, STRAIGHT LINE TRANS. o TUNGSTEN, IR, SOURCE, STRAIGHT LINE TRANS.
.-I- j I-.. j--i I i /
- “TEFLON” FEP, 5 MILS 1
1:: :. *.- ;., .:. :..;- . . . ._.- .- . . _.- ..-. L’.
i#o I 4 I .I. I
INt-RA RED I I : I
0.8 1.0 1.2 - 1.4 1.6 1.8 2.0 2.2 24 WAVELENGTH (MICRONS)“”
0 0.2 0.4 0.6
Figure 3-4. Absorption spectrum for Teflon FEP film, suggesting con- siderable transmissivity between 200 and 300 nm.. [From DuPont, Bulletin T-5AJ.
66

.
which would also allow one to change length or diameter of the chamber.
This led to experiments with a modular concept whereby the chamber
end caps (which take on the role of adapters between tubing of s.6 cm
diameter and the 10 cm diameter chamber) consisted ,of ceramic Btchner
funnels while the cylindrica.1 portion was made from 1 mil FEP Teflon
foil stretched between and clamped to the rigid ends. This design
(Model B) also allowed for convenient installation of a stainless steel
felt-metal disc acting as flow straightener at the upstream end of the
chamber. The FEP Teflon foil chamber would, in addition, have provided
a considerable weight savings in case the need for a larger chamber had
arisen.
Prior to deciding on this type of design, the available specifica-
tions on the Teflon foil's transmittance were consulted (Figure 3-4)
which indicated that, between 200 and 300 nm, a value of 60-80% could be
expected. However, actual tests with the 'prototype revealed that
practically no particles were generated under conditions otherwise iden-
tical to the ones with Model A.
Thus it was necessary to resume work with quartz as a chamber wall
material, though without abandoning the modular concept. In this Model
C, the ceramic end caps were joined to a quartz cylinder with silicone
RTV sealant. While this PAG version was again able to produce large
numbers of particles, initial tests immediately showed that the latter
were present in the chamber outflow even when the SO2 flow was turned .
off. Since this behavior suggested that SO2 was being held up in the
silicone rubber and later released, it was necessary to design a new
version (Model D) in which the three main parts were connected by
67

reversible mechanical means under avoidance of problematic glue-like
material. .
Figure 3-5 depicts a partial cross-section of an end cap and its
connection with the quartz tube. Basically, the end cap fits over the
end of the quartz tube, and an O-ring is squeezed against the cap and
the quartz tube by a compression ring that screws onto the cap. This not
only provides a gas-tight seal, but also a strong mechanical connec-,
tion. Due to the fact that the quartz tube is thin-walled, fragile,
slightly out of round and has a dimpled surface, it is necessary that
the O-ring be of a relatively soft material and of considerable width to
properly contact the uneven surfaces without exerting too much pressure
on the quartz tube. Thus, the original design calling for Teflon as
O-ring material had to be changed to Viton. This, in turn, required the
addition of a Teflon ring between the compression ring and the Viton
O-ring to reduce friction during tightening of the compression ring.
As Figure 3-5 indicates, the stainless steel end caps are not
machined from one piece, but rather three pieces to provide a convenient
method of installing and clamping in place the stainless steel filter
which serves as a flow straightener; the downstream end cap is identical
to the inlet one except that the flow straightneer has been deleted.
Connections to the Teflon or stainless steel l/4" gas lines are made via
Swagelok fittings which have on one end a male l/4" NPT (the latter
shown in Figure 3-5) screwed into the end caps.
The UV lights on this last model PAG are arranged as in Model A
shown in cross-section in Figure 3-l. A photographic view' of Model D in
vertical configuration with the inlet at the bottom is provided in
Figure 3-6.
68

DELRIN OR TEFLON
&RING 2-347
S.S. FILTER
t FC Tl I’
IO/INCH
I2 8-32
-m-- - - --
O-RING 2-244
Figure 3-5. Axial cross-section of stainless steel end cap for quartz tube (Model D) [all dimensions in inches].
69

Obviously, this last model does not offer great flexibility with
regard to its geometry - only the chamber length could easily be changed
by using different lengths of quartz tube - but, while work on this
design was in progress,
flight model would be
beyond the ones in the
for constructing larger
20 cm diameter.
it became apparent that size limitations for the
imposed which would not allow dimensions to go
present model. Thus, no preparations were made
end caps to accommodate quartz tubes of, e.g.,
2. PAG Performance
a. Output Variables
Three output parameters were used to assess performance of the PAG:
0 The total particle number concentration detected at the exit of
the generator by an Aitken counter (E-l or TSI-CNC) was monitored during
all experiments. The goal was to obtain typical particle concentrations
of the order of 105cm -3 which would allow shaping of the size distribu-
tion by coagulation or passage through an electrostatic classifier while
still preserving a concentration sufficient for cloud chamber experimen-
tation.
0 Particle size was monitored in some experiments by diffusion
battery, electrical aerosol analyzer, or indirectly by continuous flow
diffusion (CFD) chamber. As in the case of the other particle genera-
tors, the desired size range of the final product was 10 to 100 nm
radius.
0 The constancy of the particle concentration was of particular
concern and was monitored by continuous recording (on stripchart) of the
Aitken counter output signal. Using the same procedure as in the
70

Figure 3-6. Photograph of photolytic aerosol generator (Model D) in vertical position. Cylinder on right side is the SO2 vapor stripper.
71
-.

atomizer study, the output fluctuations of the PAG were measured as 200%
(Max-Min)/(Max+Min) for a given time interval. Where comparisons between
different operational modes were of interest, it was not necessary to
calculate standard deviations.
b. Input Parameters
Two types of input variables were taken into consideration. The
first kind pertained to the geometry of the generator chamber which, in
this case, is described by model designation. Specifically, valid
measurements were carried out only with either Model A (one-piece
quartz) or Model D (straight quartz tube with stainless steel ends and
flow straightener). The other input parameters are a measure of the
intensities of the various ingredients entered into the chamber, namely,
SO2 concentration, O2 concentration, humidity, temperature, flow rate of
gas mixture through chamber, and light intensity. Effects of most of
these variables on the output were investigated only in one of the two
chamber models (either A or D), since Model D was not drastically
different from A, but rather a refinement mainly intended to increase
output stability.
(1) Light Intensity, Flow Rate
An example of how these two variables affect the output of the
generator is shown in Figure 3-7, an excerpt from a stripchart. The
light intensity was varied by activating either two or all four lights.
The tests were carried out with Model A at the flow rates of 15 and 30
cm3s-' . For both variables, the results as depicted appear at first
glance to be paradoxical - increased output with less light and faster
passage through the irradiation zone. However, if one considers the
72

.
LEGEND
7 LINE 1977
so* = 5oppm
A FULL LIGHT WTENSJTY, 79sec RESKIEMCE
B WLF LIGHT NTENSITY, 79 sac RESOENCE
C HALF LIGHT NTENSITY, 157 sac ESUIt$CE
D ML LffiHT NTENSITY, 157 mc RESCEME
-Fm PARTKLE CCNCENTFiATlON --.,--r&n&, PLII..csrO A- N l3E~~1r.m u--n
+I I+ “Incubgtlon” Period
;j=95Xlo-3pm
RANGE q
(5 x o-3pl, 2 x l@2pll)
c ii= 2.8 x lo-2pln
RANGE = (I 3 x KT2pm, 5 5 x lo-2pnl
d=2.3X 10⁻²pm
RAKiE= (12 x D-2pl, 4.5 x io-2pn)
I L 1 I L 11 1 11 I 11 1 I1 L 11 11 1 t 11 1
IO 20 30 40 50 60 70 80 90 IO0 110 120 130 140 I50 160 170 I80 I90 200 il0 220 230 240 250 260 270 280
TIME, MCIUTES
Figure 3-7. Particle output of PAG versus time indicating effect of four different operational regimes. Inset showing likely particle density versus position in reaction chamber (see text for de- tails).

particle concentration versus time (or position in the chamber) as
indicated in the figure inset, it appears plausible that slower flow
provides more time for coagulation, thus fewer but larger particles;
conversely, lesser light means slower particle build-up and later onset
of significant coagulation which results in a higher particle number but
smaller size at the chamber exit. The .latter situation is also
confirmed by the data on Figure 3-8 which were obtained by analyzing the
generator output in CFD chambers where sizes are determined via super-
saturation using the Kiihler relationship.
While there is little doubt that the data displayed in Figure 3-7
are at least qualitatively descriptive of the end result of the process-
es occurring in the PAG, the above mechanistic reasoning has to be
regarded as just one hypothesis which could not be further pursued in
the framework of this program. In subsequent research under different
sponsorship, it became quite clear that systems such as the PAG are much
more complex and difficult to interpret than originally assumed.
For further tests, the light and flow conditions selected were:
all four lamps on and a-flow rate of 2 a min -1 . In this context, it
is interesting to note in Figure 3-9 the drastic effect of a 1 mil FEP
Teflon foil (as used on Model B) positioned between the lights and the
quartz tube: no observable particle generation when foil- is in place
(left side of figure), but immediate onset of aerosol formation as soon
as Teflon foil is removed. This clearly demonstrates that lack of
transmissivity below 300 nm was the reason for Model B to fail, despite
the misleading data of Figure 3-4.
74

lo*- 0.001
LEGENO
14 JUNE 1977
CFD COWTS
SO2 CONCENTRATKIN = 5ppm
\ -= FULL LIGHT INTENSITY \ \ \
\
-- - * HALF LIGHT INTENSITY
\
\
\ -ii = .007~m
\ \ \ d = .Ol pm 4 \
I
.Ol ’ IL 3.38% . *o I I 0.1 DRY RADIUS, pm
.70% 38% CRITICAL SUPERSATUPATION
Figure 3-8. Cumulative PAG particle size distributions for two dif- ferent light intensities as obtained by continuous flow diffusion chamber measurements.
75

Y
I L -:
-~-_
_-._.
114 -
I .._ .-.-. I/ fir
Figure 3-9. Stripchart showing PAG particle output versus time. The drastic effect of 1 mil FEP Teflon foil (the type used in Model B), between lights and quartz tube - no particles generated - is seen on left side. Removal of the Tefl n film brings the particle output immediately to over 106cm' s .
76

(2.) so*, Water Vapor and O2 Concentration
Initially, the experimental set-up did not include humidity con-
trol or measurement. Thus, measurements such as the ones of the SO2
concentration effect on the particle number as shown in Figure 3-10 are
difficult to compare with later measurements; however, this figure
points to two observations: within the range 1 to 10 ppm SO*, the
resulting particle number appears to be approximately proportional to
the SO2 concentration and, more importantly, the resulting average
particle size does not depend strongly on the SO2 concentration as
determined by diffusion battery methods (note the mean diameters indi-
cated on the graph).
After adding a humidifier-and a dewpoint temperature controller to
the gas-handling equipment, the data of Figures 3-11 and 3-12 were
obtained. Figure 3-11 shows the particle number output as a function of
humidity (as expressed by the dewpoint temperature, TD) for three
different SO2 concentrations. While these measurements were carried out
with the Model A chamber and O2 as carrier gas, the data set of Figure
3-12 was generated with the Model D PAG and air as carrier. The plot
shows that the SO2 concentration was varied over a wide range (0.03 to
10 ppm) for three different humidity values.
Both figures indicate the same trend for the effect of SO2 concen-
tration on particle output: a strong increase in particle concentration
with increasing SO2 concentration at low SOP values, but becoming weaker
or zero for higher SO2 concentrations and higher humidities. Similarly,
increasing humidity caused sharp increases in particle production - more
pronounced at low humidity and low SO2 concentration.
77

1.8 X IO’
1.6 X IO’
1.4 x lo’
E I.2 x 10:
s
8
i5 5 1.0 x10’
Ai
s t; p 8X10⁴ 0”
T 5
z j 6X10⁴ i=
3
4X10⁴
2 X10⁴
0
RANGE q (8 X lo’3pm, 2.7 i$ IO-*pm]
RANGE = (8 X 10s3pm, 2.7 X IO-*pm)
RANGE = (8 X IOm3pm, 2.0 X 10⁻²pm)
RANGE = (5 X 10m3 pm, 1.7 X IO-*pm)
0 2.0 4.0 6.0 8.0 10.0 12.0
SO2 CONCENTRATION, WRTS PER MILLION
Figure 3-10. PAG (Model A) particle output as a function of SO2 con- centration. Indicated particle size values are based on diffusion battery measurements.
78

Besides not having completely overlapping ranges in SO2 and hu-
midity, the two sets of measurements differ mainly in absolute particle
concentration for identical pairs of [SO,] and TD, whereby the values of
Figure 3-12 are more than an order of magnitude lower than those of
Figure 3-11. To a considerable extent, this has to be attributed to the
difference in carrier gas - higher O2 concentration leading to increased
aerosol formation.
C. Effects of Temperature on PAG Output
While the temperature dependence of the particle output is of
general interest, it is of particular importance in the present case
because an ACPL version of the PAG would require an enclosure which
would need to be cooled to remove the heat generated by the lamps.
For the present experiment, the PAG was fitted with an insulating
jacket of glass wool which caused the chamber temperature to increase
gradually from the normal ~35°C to nearly 50°C under the influence of
the four UV lamps. The temperature was measured by a thermistor taped
to the outside surface of the quartz tube. Using air at a dewpoint of
10°C with 0.03 ppm of S02, the particle output dropped to approximately
l/8 of the original value for a 15°C increase in temperature.
While higher temperatures in the reaction chamber may indeed
reduce the particle formation rate, it is quite likely that, in part,
the heat-related reduction in light output was responsible for the
observed effect. The two possible causes were not investigated separ-
ately.
79

II I I I . II I I-. _.--. -_-..-. ---- -
IO’
CARRIER: 0,
X > 200nm S = 300% c -
1 I so2 0 2.5 .10m2 ppm + IO" 0 2.5 *IO"
-15 -10 -5 0 5 IO I
DEW POINT TEMPERATURE TD ,OC
Figure 3-11. Influence of humidity on the PAG output for three differ- ent SO2 concentrations. Data obtained with PAG Model A.
80

I I I Illlll .3 1.0
SO2 CONCENTRATION ppm
Figure 3-12. PAG (Model D) output as a function of SO2 concentra- tion for three different humidities (carrier gas: air).
81

d. Size Distribution of the PAG Particles
It was previously mentioned that the sizes of the particles gene-
rated in the PAG were of the order of 10 nm. Size distributions as
obtained indirectly by feeding the output to several CFD chambers
operating in parallel and set at different supersaturations are depicted
in Figure 3-8 where supersaturation values were translated into particle
sizes according to .the K6hler relationship. ,It is evident that the
majority of particles were smaller than the lower limit of the primary
range specified for the ACPL. This was reconfirmed while acquiring. the
data of Figure 3-12 where one CFD chamber provided some values for 1%
supersaturation; on the average, only about 5% of total particles were
activated at that supersaturation. ‘
An example of an aged PAG aerosol (generated at the occasion of
the first DRI-University of Wyoming Workshop) is shown in Figure 3-13.
A 'storage bag was filled with the PAG output in order to be able to
measure the size distributions with three different instruments of which
the combined sample flow rate was far greater than the PAG flow rate.
It is easy to see (from the differing steepness of the curves) that the
spectrum of Figure 3-8 is, as expected, much narrower than the ones of
Figure 3-13. The latter diagram also demonstrates the typical quality
of agreement between such diverse instruments as the Electrical Aerosol
Analyzer, the CFD chambers, and the Diffusion Battery.
e. Output Constancy
Early in this investigation, it became evident that it would be
difficult to meet the specifications for constancy of the PAG output.
Fifteen to twenty percent fluctuations over a 1000 set period were not
82

H2 s”4. AEROSOL
from PHOTOLYTIC GENERATOR
[ 1 so2 = IOppm T = 2.7 min
- - -A- - - ELECTRICAL MOBILITY ANALYZER -- + --- CFD CHAMBERS
-m-- DlFFUSlON BATTERY
T I to-3 10-2
\ : \ :,
: A ,
I :, I ’
4 I
PARTICLE DIAMETER. (pm)
Figure 3-13. Cumulative si,ze di stri buti on of PAG (Model A) particle output stored in Mylar bag (for ~103 set) ai measured by the i ndi cated instruments.
83

unusual and a. 50% drift
observed. A particular
over one-hour intervals could frequently be
ly large number .of time-consum ing tests were
devoted to this problem. All parameters previously discussed were
scrutinized for their potential influence on output fluctuations.
Prior to installation of the humidity control system in the gas-
handling portion of the experimental set-up, it appeared, based on flow
tests with smoke, that unsteadiness of the flow was caused at the
transition from the thin inlet line to the 10 cm diameter chamber. This
prompted the installation of a stainless steel filter as a flow straight-
ener at the inlet side of the irradiation chamber. Figure 3-14 shows
the modest improvement that was achieved by this alteration of the flow
in the chamber: (a) represents a somewhat better than average output
recording of the Model A, while (b) was obtained with Model D under
slightly less favorable conditions (less SO2); the fluctuations were
down to ~8% from ~15% in (a).
Humidification and strict control of the dewpoint temperature led
to considerable improvement of the output quality. Output drift over
longer periods was reduced substantially while short-term fluctuations
could be counteracted by increasing the humidity. Figure 3-15 demon-
strates this effect as well as the influence of SO 2 concentration on
output steadiness. The seven-minute excerpts from stripcharts are
arranged according to SO2 concentration (from left to right, 0.1, 1.0,
10 ppm) and dewpoint temperature, TD (from top to bottom 10, 5 and 0°C).
It is unquestionable that increases in each of the two parameters
resulted in improved constancy of the output (less than 5% fluctuations)
with respect to fluctuations with frequencies higher than about 0.2
-1 min .
84

* . . c , . -....o-c ” - ’ 0 .^,
(a!
( :j ;
Figure 3-14. Stripchart samples of PAG output. Comparison of output fluctuation: (a) Model A and (b) Model D, showing im- provement by about a factor of 2.
I--
85

0
0.1 1 10 (SO2 Cont. - ppm)
Figure 3-15. Seven-minute stripchart segments demonstrating depend- ence of PAG output fluctuations on SO? concentration (increase from left to right) and humidity (increase from bottom to top).
86

While long-term (30-60 min) fluctuations and drifts could be
reduced considerably by improved control of the pertinent variables,
especially humidity, it is still to be expected that output changes on
the order of 10% occasionally occur. Output differences before and
after periods of shut-down were found to be even larger, but difficult
to quantify since there is not a sufficient number of comparable
observations due to the multitude of variables involved. For the same
reason, it has not yet been possible to determine with certainty what
causes the lack of reproducibility.
3. Vapor Stripper
Although not an integral part of the PAG, a device to remove
excess SO2 downstream of the PAG would have been an .absolute necessity
for ACPL operations and, therefore, it is appropriate to briefly discuss
that device (stripper) in this chapter.
The essential design goal for the stripper was high retention of
the SO2 component in the passing gas mixture combined with a small loss
of aerosol particles. Since the latter condition could not be met in a
conventional activated charcoal bed (which acts much like a particle
filter, too), a design was chosen that is very similar to the diffusion
dryer (TSI Model 3062) used in conjunction with atomizers (see Section
111.3.a). Thereby, unimpeded passage for particles is provided by a
tube made from fine wire mesh which is surrounded by the charcoal bed.
Since the SO2 has to diffuse through the wire mesh to be adsorbed to the
charcoal, it is plausible that more SO2 penetrates this device than
would pass through a regular, complete bed of charcoal granules.
87

In approximate analogy to the above-mentioned diffusion dryer, the
dimensions of the DRI stripper were selected as follows: wire mesh.tube,
50 cm long and 1 cm diameter, axially located inside a 12 cm diameter
capped plastic cylinder filled with 6-14 mesh coconut charcoal granules.
The device appears in Figure 3-6 to the right of the PAG.
Figure 3-16 depicts the results of preliminary performance tests.
The upper diagram shows the flow rate dependence of the percentage of
SO2 that passes through the device. At a flow of 2 k/min -1 used in most
PAG experiments about 15% SO2 would penetrate the stripper (in its
present configuration). The lower curve relates the particle loss in
the stripper to the SO2 concentration which, in turn, influences the
particle size - thus the dependence of the particle loss on SO2
concentration (due to smaller diffusivity of larger particles). Since
the findings in the previous section mandate the use of a high SO2
concentration (11 ppm), the particle loss would be of the order of 2% -
a tolerable value.
Considering that no attempt had been made in the design of this
first model to optimize the geometry to achieve simultaneously low SO2
penetration and low particle loss, the present results are quite encour-
aging. The simplest approach towards reduction of the SO2 penetration
would be to increase the length of the unit, e.g., by doubling the
length the penetration could be lowered to less than 2.5% while the
particle loss would merely double to 4%.
However, proper optimization of the device would require a more
extensive study of the various properties of the stripper; also, e.g.,
the minimum required diameter of the charcoal cylinder around the wire
88

100
100 FLOWRATE THROUGH STRIPPER - cm3 s-I
1 I .Ol .03 .I .3 I
Sop CONCENTRATION - ppm
Figure 3-16. Performance of SO2 stripper: (top) SO penetration ver- sus flow rate, and (bottom) particle ?oss in stripper versus SO2 concentration (which dictates particle size).

mesh tube would have to be determined on the basis of SO2 consumption
and flight duration.
In summary, then, it can be stated that the concept of a stripper
to drastically reduce the SO2 content in the effluent of an aerosol
generator is feasible. Further development work is required to deter-
mine the best compromise between SO2 retention and particle loss.
B. AEROSOL GENERATION BY ATOMIZATION
1. Selection of Suitable Candidate Atomizers for Evaluation
Atomization (or nebulization) of liquids - breaking up of the bulk
substance into a large number of very small droplets - can be achieved
in several ways, all of which require energy to generate the large
amount of new surface. Regardless of the method applied, the primary
aerosol emerging from an atomizer consists of liquid droplets. To obtain
an aerosol of solid particles, .the solid material either has to be
dissolved, the solution atomized and the solvent evaporated, or the
solid material can be hydrosolized first, the hydrosol atomized and the
liquid evaporated; a third method consists of operating an atomizer
above the melting point of the solid material and subsequent solidifica-
tion of the droplets.
The most frequently used method is pneumatic atomization whereby
liquid is injected into and broken up by a jet of air (or other gas).
Another technique, ultrasonic atomization, consists of imparting ultra-
sonic vibrations to the liquid which may be dispersed if certain con-
ditions are met. A third method uses hydraulic pressure of the liquid
alone to cause breakup after passage through an appropriately designed
nozzle. In addition, there are hybrid systems such as vibrating orifice
90

droplet generators in which the vibration forces the liquid to break up
into segments of equal size, leading to high monodispersity.
From the beginning of this program, the pneumatic atomizer was
given preference over the other liquid-dispersing methods for the fol-
lowing reasons.
Due to their basic simplicity and versatility, pneumatic atomizers
have for years ,proven to be extremely useful aerosol generators as
documented in the literature (e.g., Liu and Lee, 1975, or review by
Raabe, 1975). Furthermore, the present investigators' previous experi-
ence has shown that ultrasonic and hydraulic atomizers have serious
shortcomings. The performance of ultrasonic atomizers (which have the
advantage of not requiring compressed air) seems to be more sensitive to
the physical characteristics of the liquid to be dispersed than the
pneumatic type - e.g., the ability to atomize salt solutions may rapidly
decrease with increasing, but still moderate, salt concentration.
Hydraulic atomizers require very high pressures to achieve satisfactory
dispersal of liquid with high surface tension (such as water). The
vibrating orifice type drop?et generators produce droplets too large to
be useful for CCN production of the ACPL specified size range. Late in
the project period, a hybrid device became available for testing which
consists of a pneumatic atomizer, but incorporates a nozzle design that
generates acoustic waves which assist in the dispersion (manufacturer's
claim).
2. Evaluation of Pneumatic Atomizers as ACPL Aerosol Generators
While the above considerations, supported by the findings of
Anderson (1977) led to the conclusion that penumatic atomizers were the
91
best choice as primary aerosol generators for ACPL, the description by
Liu and Lee (1975) on the TSI Model 3076 "Constant Output Atomizer"
(COA) suggested that this particular device would indeed fulfill the
requirements set forth by NASA except for some necessary low-gravity
adaptations. Thus, the atomizer evaluation effort was initially focused
entirely on the COA.
a. Laboratory Set-up for Atomizer Evaluation
The evaluation of the COA as well as of other atomizers was to
elucidate the following points with regard to their suitability or
applicability to ACPL: output number size. distribution, required air
pressure for the nozzle, liquid flow characteristics and, most impor-
tant, output constancy and reproducibility.
Most measurements were carried out with the set-up shown schemati-
cally in Figure 3-17. The atomizer, shown on top left, is supplied with
dried, filtered and pressure-regulated air conveniently prepared with
the TSI Model 3074 auxiliary air supply depicted in the sketch of Figure
3-18. The air flow rate through the atomizer is adjusted to the desired
value by pressure regulation; thereby, the flow-pressure relationship
depends on the atomizer model - to a lesser extent even on the
individual device. With regard to liquid supply, some atomizers such as
the COA can be operated in two different configurations: (1) In the
recirculating mode (not shown on figure) the liquid is aspirated by the
venturi effect of the air jet, and the excess liquid (impacted large
drops) is returned by gravity to the reservoir (in most atomizers an
integral part, in some such as the COA, a separate container); and (2)
in the non-recirculating mode, the liquid is pumped - as indicated on
92

EXCESS EXCESS SAMPLE AIR
..--*. .--- __ - _ _. NT I
I oi’d;:To” ;f;
SHEATH 340 cm3 8-I
- I ’ POLYiiii&E
TW-1 -
. . . MON
EL. AEROSOL NEBULIZER MONODISPERSE CLASSIFIER
I (EC) (EC)
I I I 4 I Ifj
& EL. AEROSOL DETECTOR
RECORDER (EAD)
METERING PUMP 0
P
5 LIQUID
RESERVOIR
- COMPRESSED x/ AIR SUPPLY
ABSOLUTE DRIER PRESSURE FILTER REGULATOR
Figure 3-17. Schematic of test set-up for evaluation of atomizers.
93

CLEAN, DRY AIR .\
ABSOLUTE FILTER AIR DRIER ‘.
COMPRESSED I \ ..k . AIR
SUPPLY
PRESSURE REGULATOR1
AUXILIARY AIR SUPPLY SYS’FEM
(MODEL 3074) -y.._ ‘..
\ \
POWDISPERSED AEROSOL
__--- ATOMIZER ASSEMBLY
WASTE LIQUID COLLECTING CUP
E LIQUID DRAIN
Figure 3-18. Sketch of TSI-Constant Output Atomizer with air supply system and syringe pump (from TSI Manual).
94

the schematic (Figure 3-17) - at a selectable but steady rate into the
jet, and the excess is discarded. (A discussion on the two modes will
ensue in the next subsection.)
1 Two versions of the fluid delivery system are shown in Figure
3-19; during the first year of the program, the syringe pump (Harvard
Apparatus*, Model 975), on the left in the photograph was used to pump
the liquid directly into the atomizer. Later on, addition of a flow-
meter (Matheson No. 610) between pump and atomizer indicated oscilla-
tions in the output; this defect and the limit on the experiment time
due to the small 50 or 100 ml syringe volume prompted a switch to the
FMI** metering pump Model RHOCKC visible in Figure 3-19 above the
reservoir bag. This final set-up permitted uninterrupted test runs of
many hours.
As the mist emerges from the atomizer, dry dilution air is added
to start the process of droplet evaporation which is completed in the
subsequent passage through the diffusion dryer (TSI Model 3062) con-
sisting of a wire mesh tube surrounded by a drying agent and a cylindri-
cal, airtight enclosure. The dry aerosol then undergoes charge neu-
tralization prior to entering the EC as discussed in Section II.B.(b).
Since the aerosol flow through the EC should be kept low (e.g., 2 a
min-'1 to achieve high resolution, and since the combined rate of ato-
mizer and dilution flows may be considerably higher, the excess sample
air is dumped just before entering the EC. The effluent of the EC and
* Harvard Apparatus, Millis, MA
** Fluid Metering, Inc., Oyster Bay, NY.
95

Figure 3-19. Photograph of fluid delivery system with syringe pump (left), FMI-RHOCKC metering pump (top), and collapsible fluid reservoir.
96

EAD were aspirated by a vacuum pump which provided most of the pressure
'drop through those two instruments. This resulted in low overpressure
on the downstream side of the atomizer which was advisable when compar-
ing performance at various jet nozzle pressure drops.
Initially, all connections shown in Figure 3-17 were made with
Tygon plastic tubing; however, aerosol carrying lines were later re-
placed with stainless steel tubing to prevent buildup of electric charg-
es which may drastically affect the loss rate of aerosol in transit.
b. Evaluation of the TSI-COA and Comparison with Selected other Atomizers
The TSI-COA shown in a cross-section in Figure 3-20 incorporates
essential elements of the typical Collison nebulizer* several modern
versions of which have been described by May (1973). Dimensions and
mutual positions of air jet nozzle and liquid feed orifice are practi-
cally unchanged from the original design. The novel features include an
exchangeable air jet nozzle in the form of a platinum disc (TEM
aperture), an external fluid reservoir that permits one-time use of the
liquid and, most importantly, a 1.2 cm diameter vertical cylindrical
cavity into which the jet is directed, perpendicular to the cylinder
axis so that the cylinder wall opposite the jet opening .serves as a
baffle where the large droplets impact and run off. An exterior view of
the device is seen in Figures 3-18 and 3-21 where the atomizer is
connected to a spent-liquid reservoir. The significance of these
features will be discussed as pertinent tests are described below.
* Atomizer and nebulizer. are treated here as synonyms.
97

k--- 3.8cm ,-d
AEROSOL OUT
0.0135 DIA. (NO. 80 DRILL) HOLE IN 318 DIA. DISK
COMPRESSED AIR IN
TO CLOSEO RESERVOIR
Figure 3-20. Cross-section of TSI-COA (from TSI Manual).
98

t
Figure -3-21. Photograph of TSI-COA.
99
L-

One can obviously determine, without tests, that the recirculating
mode. of the fluid feed would not be acceptable for zero-gravity since
separation of the recirculating liquid from the aerosolized fraction is
by gravity, whereas in the.,nonrecirculating mode the spent, but not
aerosolized, liquid can be ingested and retained by w-icking material. .A
further disadvantage of the recirculating mode stems from the fact that
the solution concentration gradually increases with time due to evapora-
tion. On the other hand, the nonrecirculating mode demands much larger
fluid reservoirs adding to the weight and volume problem.
(1) Number Size Distributions
Most testing of the COA was carried out at an operating pressure
of about 30 psi as this is generally considered the optimum range
judging from May's (1973) performance tables. The main effect of
increased air pressure is increased output number concentration, but not
a substantial change in size distribution. The latter can best be
manipulated by varying the salt concentration. Figure 3-22 demonstrates
the two effects by means of the two size distributions as indicated.
The solution strength differs by a factor of 40 and, as expected, the
size ratio i,s indeed in the vicinity of 3.4. As a consequence of the
pressures being 30 and 35 psi for the 0.025% and 1% solution, respective-
ly, the number concentration of the distribution on the right is nearly
twice the one generated with lower pressure. .
Although Figure 3-22 indicates that selection of the appropriate
solute concentration will provide CCN populations commensurate with ACPL
specifications, it is interesting to compare the COA with the perform-
ance of other nebulizers designed to produce submicrometer droplets
100

p :
DIAMETER
100 300 -nm
Figure 3-22. NaCl particle size distributions obtained with TSI-COA in recirculating mode at 30 psi with 0.025% solution (A), and at 35 psi with 1% solution ((3).
101

(even though these devices could not be used in the ACPL in their
present configuration).
The DeVilbiss Model 644* nebulizer, widely used for inhalation
therapy, is shown in Figure 3-23 with its hemispherical top (with out-
let) removed to make the nozzle and impaction surface visible. This
device was designed for low air pressure (manual compression of rubber
bulb) and was operated at 3 psi for measuring the size distribution
displayed in Figure 3-24. The modal size of this distribution is the
same,as the one of the COA (with the same 1% NaCl solution), but it is
more polydisperse (a = 2.2) than the COA's (U = 1.9). 9 9
One of the latest developments in inhalation nebulizers is the **
"Nano-Mist" , depicted in Figure 3-25. This instrument represents the
Dautrebande type atomizer where large droplets are eliminated not only
by impaction on a baffle, but also when the mist is forced to penetrate
a liquid curtain formed by the excess liquid on its return to the
reservoir. Another unusual feature of the Nano-Mist is the annular
liquid feed orifice concentric with the jet nozzle. Three size distribu-
tions obtained with this device at a pressure of 10 psi are plotted in
Figure 3-26 for NaCl solutions of 0.034, 2.16 and 33.7 g/l (the low and
high values being the practical concentration limits for use in atomiz-
ers). Had the same salt concentrations been used as in the case of the
COA, Figure 3-22, the two corresponding size distribution curves would
fall in between the three present curves; thus, it is evident that the
modal sizes of the Nano-Mist distributions are about one-third of those
* The DeVilbiss Company, Somerset, PA.
** by Eastfield Corp., Noroton, CT.
102

Figure 3-23. Photograph of DeVilbiss No. 644 Nebulizer (top with outlet removed).
103

.
I lo410
I I I I Illll I
30 100 300
DIAMETER - nm
Figure 3-24. NaCl particle size distribution obtained with DeVilbiss No. 644 at 3 psi and 1% solution.
104

Figure 3-25. Photograph of Nano-Mist nebulizer.
105
-- -

of the TSI-COA. For low concentration solutions, the dispersity of the
Nano-Mist output is similar to the COA's, but with increasing solute
concentration a "shoulder" on the large particle side of the distribu-
tion develops that causes the high concentration curve to be remarkably
flat (the existence of this feature was confirmed by several repeat
measurements carried out over a period of two years).
A device that became available near the completion of this project
is claimed to disperse the liquid by sonic waves generated in the nozzle
by the compressed air, as depicted in Figure 3-27. The Sonimist 600-l*
was briefly tested with the result displayed in Figure 3-28. The size
distribution is very similar to the one of the TSI-COA for the same salt
concentration. Considering that the liquid consumption is about twice
as high as in the COA, no advantage can be found at all in using the
Sonimist in the ACPL.
Although NaCl solutions have generally been used for these per-
formance tests, it had been planned to demonstrate the ability of the
atomizer to generate sulfuric acid aerosols as an alternative to the
photolytic method. Figure 3-29 shows the size distribution obtained
from 1% (by vol.) H2S04 atomized by the TSI-COA at 30 psi in the recir-
culating mode. As with salt solutions, appropriate further dilution
would shift this distribution towards smaller .sizes, though in this
case, the size is not only governed by the degree of dilution but also
by the relative humidity since H2S04 deliquesces even at very low hu-
midity in contrast to salt particles where deliquescence occurs at
fairly high values (i.e., 75% for NaCl). No specific measurement was
*by Heat Systems Ultrasonics, Inc., Plainview, NY.
106

0 2.16 g NoCI X 0.034 g NoCl
\ X
\ X
\
x\,
* \
PARTICLE DIAMETER, Dp - nm
Figure 3-26. NaCl particle size distributions obtained with Nano-Mist nebulizer ,at 10 psi and with solutions of indicated con- centrations.
107

,,. _..
ANNULAR RESONATOR LIQUID CAVITY
I,
COMPRESSED GAS
Sonic field is produced at orifice as gas reaches velocity’ of sound. Sound waves pass over annular cavity causing resonant vibrations. Liquid injected through opening is atomized by waves emanating f&m cavity.
Figure 3-27. Schematic of Sonimist 600-l Atomizer (from Sonimist speci- fication sheet).
108

DIAMETER - nm
Figure 3-28. NaCl particle size distribution from onimist 600-l atomi- zer (30 'psi air pressure, 2.2 ml min' 7 flowrate of 0.025% solution).
109

105’ I I I Illll I I I Ill1 I, IO 100
DIAMETER -
1000
nm
Figure 3-29. Sulfuric acid droplet size distribution obtained with the TSI-COA (1% diluted H2S04, 30 psi air pressure).
110

taken in the present case as the humidity after the dryer in our test
set up was always in the vicinity of 10%.
(2) Atomizer Output vs. Time
In the course of establishing size distributions from the COA with
the set up shown in Figure 3-17, it became apparent that the COA's out-
put was not always constant, but was showing large fluctuations (+lO% or -
more), sometimes deteriorating gradually, sometimes abruptly. The strip-
chart excerpts in Figure 3-30 illustrate (on top) an example of an
unstable output while the recording at the bottom represents the kind of
stable output expected from the COA and acceptable for ACPL purposes;
both measurements were taken with the EAD and the same EC settings with
a 0.01% NaCl solution. As no immediate cause for the atomizer's
behavior could be detected, the EC-EAD were suspected of producing an
artifact. This hypothesis was quickly rejected when the atomizer excess
output (between neutralizer and EC, Figure 3-17) was connected to either
the total particle counter (GE-CNC-2) or the EAA with the same result.
The latter case is documented in Figure 3-31 where the upper trace
represents the EAA reading (Channel 1, total number), and the trace
below indicates the EAD measured EC output set for 58 nm particles. In
addition to the perfect correlation, this Figure also shows a qu
periodic behavior observed at times, though usually much less
nounced, as in Fig. 3-32. This output recording appeared to be
typical of higher salt concentrations as opposed to the trace in Fi
3-30 obtained with a 100 times more dilute solution.
asi-
pro-
more
gure
Evidence that more and larger particles are produced during condi-
tions of output instability is presented in Figure 3-33; these data were
111
I -

1
t
i-
I:
Figure 3-30. Example of stable (bottom) and unstable (top) output of NaCl aerosol from the TSI-COA at 30 psi and with 0.01% solution.
112

Figure 3-31. Unstable TSI-COA aerosol output measured with EAA, Channel 1 (total particles), upper trace, and with EC-EAD set for 58 nm particles (lower trace).
113

1
I r”
I.
30 of
Figure 3-32. EC-EAD recording of unstable output from TSI-COA operated at psi with 1% NaCl solution (top) and stable output from use 0.01% solution (lower trace).

DIAMETER - nm
Figure 3-33. NaCl particle size distributions from TSI-COA for stable and unstable running mode (30 psi, 0.01% NaCl solution).
115

obtained with a dilute (0.01%) NaCl solution which, on the average, was
less frequently associated with instability problems than higher salt
concentrations.
Remedial measures in the form of a buffer vessel were considered;
however, as the results of such a trial show in Figure 3-34, the fluc-
tuations could not be suppressed sufficiently with the P-liter container
used.
In comparison, the DeVilbiss atomizer never gave a steady output
as illustrated in Figure 3-35, while the Nano-Mist device displayed a
consistently stable performance (see Figure 3-36) except for slow drifts
that could tentatively be linked to temperature changes in the atomizer
cavity. Tests with the Sonimist 600-l showed it to be unsatisfactory
with respect to output constancy; the stripchart (Figure 3-37) demon-
strates the typical behavior involving long-term drifts of the order of
1% min-' (the high frequency oscillations were caused by the liquid
pump).
It was concluded that of the various atomizers we evaluated the
TSI-COA gave the most constant output as long as it remained in its
stable mode. The following section pertains to the search for causes of
the unstable behavior.
C. Investigation of Output Instability and Design of Im- proved Constant Output Atomizer (ICOA)
(1) Information from Existing Atomizers
While atomizer output dependency on various input and design
parameters has been discussed by several authors (e.g. May, 1973;
Mercer, et al., 1968; Novak and Browner, 19801, output stability with
116

._,- -i 1. 1 4 /J -1-c I !
Figure 3-34. Unstable TSI-COA output undampened (A) and dampened by passage through 2 liter buffer vessel (B). Same time scale as in 3-31.
117

i ,‘I /

-r-l -2 -“--- -:_,I --
kzil& -- ____ -. --- 7 .--
A L.----l----I-~-LI.- I.-L-. --L----I
, t..--.-!--~.-.-,-------t--~-.--.-L-~
I , I
2 -L--C---.+ + ’ I ----l-+--t In-:
I I I ‘I -_ -_._-- L. / 4 1 -L------J
, ---E-+-,---+ ; , i ,. i
Figure 3-36. Example of generally steady output of Nano-Mist nebulizer.
119
I-

.._
~ __.. - ._ .-
-
.-..
- --
- _
--
- .
-
-
--
J> - 1
--. - ._.
i:- _ _
-+--
--i..---
--.-
__. -
-
--
-_
_--
--
-.--
-- .-
-.-_
--__
w
_.- . ._
.-
--
I
-1
----i
-'
-I
-1
-_ -I I
I
Figure 3-37. Output of Sonimist 600-l atomizer showing frequently occur- ring drift (small oscillations caused by fluid pump).
120

time has been the subject of only few investigations (Liu and Lee, 1975;
Collins, 19751, Results of the latter did not provide any assistance in
solving the present problem of atomizer output instability.
After concluding that the cause or causes of the atomizer's output
fluctuations were occurring inside the atomizer itself an extensive test
series was started with the aim to determine which parameter or mechan-
ism was responsible for the detrimental behavior of the COA.
One relatively delicate component of the device is the air nozzle,
a platinum disc with a 0.034 cm hole in the center. Removal and
cleaning of the nozzle occasionally had a beneficial effect, though
never long lasting. For further scrutiny of the small hole, SEM pic-
tures were taken after cleaning and also after 12 hours operation.
Output fluctuations became progressively worse with operation. The
result, shown in Fig. 3-38, indicated no changes due to erosion or
deposits. It was found, however, that the nozzle plate had some lateral
play in its mount which caused differences in output after each removal
and reinstallation, but could not explain the fluctuations.
It was noticed that drainage of excess liquid out of the COA body
often fluctuated in patterns similar to the ones of the output, but it
was not possible to quantify the result sufficiently to establish a
clear correlation.
Furthermore, at high salt concentration, it was observed that foam
was carried by the output airstream 10 to 20 cm beyond the COA's output
opening where it would gradually collapse and drain back into the
atomizer. However, the impossibility of actually observing the action
inside the COA pointed to the need for continuing the study with trans-
parent atomizers.
121

.:,I,
; :: _ . . -
Figure 3-38. Scanning electron micrograph of TSI-COA nozzle plate before use (left) and after 12 hours of operation with increasingly'un- stable output. (Hole diameter = 0.343 mm).

The previously discussed DeVilbiss and Nano-Mist units which are
molded from clear plastic were briefly used with the intent of visually
detecting phenomena in the nozzle area that would provide some clue to
the irregular behavior. In the DeVilbiss device, the impaction surface
(small sphere) is mounted very close to the nozzle which has the effect
that the whole atomizer cavity is filled with a turbulently,moving mist
impacting and accumulating on all surfaces and thus obstructing a clear
view of the nozzle area to be scrutinized. However, a few tentative
observations suggested that accumulated fluid .dripping from the impac-
tion sphere and fluid feed tube into the jet was at least contributing
to the output fluctuations. The Nano-Mist nebulizer, by its very
design, shrouds the nozzle and primary impaction area behind a curtain
of fluid, and thus was not useful for this aspect of the investigation.
(2) Variable Geometry Atomizer (VGA)
It
process
the qua
was des
nozzle*
order to improve the conditions for observing the atomization
and to detect the influence of various nozzle configurations on
ity of the aerosol output, a variable geometry atomizer (VGA)
gned and fabricated. This device consisted of a compressed air
at the end of a metal tube to which liquid feed tubes of
different sizes and shapes could be attached in different positions. The
basic type with open jet is shown in Figure 3-39 which illustrates how
the liquid feed tube can be shifted relative to the air nozzle. Figure
3-40 depicts the nozzle assembly installed in its cylindrical plexiglass
housing in which a baffle or impaction plate can be positioned at any
* During most of the investigation sapphire nozzles were used as GE, for
some time, considered their application in the final flight version of the ACPL atomizer.
123

LIQUID
Figure 3-39. Photograph and schematic of Variable Geometry Atomizer. OD of compressed air tube is 1.25 cm. Scale in schematic refers to positions used in Figure 3-46.
124

Figure 3-40. Photograph of VGA in one of its transparent housings.
125
L-

desired distance from the nozzle. A liquid feed arrangement with,ducted
air jet as in the TSI-COA or the GE-ACPL model is shown in Figure 3-41;
as the diagram indicates, the plexiglass part shown in the photograph
fits on the same air nozzle used in the open jet configuration. Typical
size distributions obtained with the open and the ducted jet version are
plotted in Figure 3-42 and 3-43, respectively.
(3) Study of Output Fluctuations
It was suspected that unstable behavior of the air jet was a prime
contributor to the output variations, and thus our first concern was to
observe, the motion of, the air jet. For this purpose, 'the nozzle
assembly was mounted such that a wall of the atomizer housing served as
impaction surface, on which the area of the jet as delineated by the
impinging spray droplets, could be scrutinized. Thus, it was found that
the VGA's output varied -monotonically with the apparent solid angle of
the jet. At times, the jet was not only expanding and contracting, but
also noticeably changing direction. Initially, the cause of these '
effects was thought to be located in the jet nozzle which was examined
repeatedly without detecting any irregularities.
Since it was noticed that the position of the liquid feed orifice
influenced the output of the VGA, this relationship was explored syste-
matically. Figure 3-44 summarizes the results with respect to the
output fluctuations; it is interesti'ng to note that the steadiest output
was obtained at a lateral misalignment of 0.5 mm between air jet and
liquid feed. Careful observation revealed that one contribution to the
output fluctuations originated as liquid accumulations (source to be
discussed later) on the liquid feed tube as shown in Figure 3-45 which,
126

r?Ex’GLAss AIR -
Icm LIQUID
FS:;ure 3-41. Schematic and photograph of ducted jet version of VGA.
127

DIAMETER - nm
Figure 3-42. NaCl particle size distribution generated by open jet VGA with 0.025% solution and 30 psi.
128

30 100
DlhAETER - nm
10
Figure 3-43. NaCl particle 'size distribution generated by ducted jet VGA with 0.025% solution and 30 psi.
129

LIQUID ORIFICE HORIZONTAL DISPLACEMENT ,. s
B
5 2 v
5 3 IL I- 3 a I-
- I I I .I .75 .50 25 O0
I mm I
I
A
3 0
COhkESSED & - AIR NOZZLE
t LIQUID FEED
----
L I
LIQUID ORIFICE VERTICAL DISPLACEMENT
/ I/ It \ \
5 0
OUTPUT FLUCTUATION %
l HORIZONTAL OR VERTICAL = 0, RESPECTIVELY 0 VERTICAL = 0.15 mm t AS l , BUT ROUGHENED LIQUID FEED TUBE
Figure 3-44. Aerosol output fluctuation as a function of liquid feed orifice position relative to jet axis.
130

LIQUID
Figure 3,-45. Schematic representation of one cause for output fluc- tuations: fluid accumulating on liquid feed tube entrained into jet once the drops are large enough.
131

when large enough, were entrained into the jet giving rise to an output
increase. In an attempt to correct the problem, the outside of the
liquid feed tube was made wettable by sandblasting its surface. As a
result, .the liquid would run off in a thin, layer and was much less
frequently entrained into the jet; thus, the output fluctuations were
reduced considerably as indicated by the dashed line in Figure 3-44.
An example of how the output size spectra vary with changing
vertical position of liquid feed orifice is plotted in Figure 3-46.
Essentially, the output decreases monotonically for all particle sizes
with increasing distance of the orifice from the jet axis. This is in
contrast to the behavior of the TSI-COA (see Section 1II.B.b) which
showed. higher output values in the fluctuating mode, indicating that
possibly different mechanisms were responsible for the two sets of
observations.
As quantitative experiments did not readily point to the causes of
output fluctuations, intensified visual and stereomicroscopic obser-
vation of the VGA in operation provided essential clues that led to an
understanding of the stability problem.
Thus it was possible to discern the formation of salt deposits on
the rim elf the liquid feed tube where the air jet first encounters the
liquid. As the salt gradually accumulated, the amplitude of the output
fluctuations continued to increase; conversely, removal of the salt
deposit from the top of the liquid feed tube immediately restored the
stability of the output. Apparently, the minute salt deposit alters the
flow pattern of the jet sufficiently to cause the liquid to be dispersed
different 1 Y- Since the salt deposits are more likely to form when
132

i,
+
+o
OA +oA
+ X
8 x r l
1 I
VERTICAL’ LQCATION 4 0 .50 mm 3 x .37 2~ .25 I 0 .I2
0 + .o
+ + +
+ +
+ 0 O 00 0
oa A 0 A
A
x x X X
l 0 X
0 X
0 X
+
O+ *0
a’ + 0
X A
X 6
0 x a
IO5 L I I I I1 I,, I IO 30 too 300
DIAMETER - nm
.
Figure 3-46. Particle size spectra from VGA output as a function of liquid feed tube position (cf. Fig. 3-39).
133

solutions of high concentration are atomized, it is obvious why concen-
trated salt solutions were leading more frequently to more severe output
fluctuations. .
In another experiment, the atomizer performances with two differ-
ent sizes (1 and 0.5 mm I.D.) of liquid feed tubes were compared. As
long as no salt deposits formed, the thinner tube produced a much
steadier output than the wider tube on which the liquid surface was
oscillating irregularly under the influence of the jet resulting in
liquid injection into the jet at irregular intervals.
Further attention was focussed on the previously mentioned case of
drops on the outside of the liquid feed tube which caused output
fluctuations due to quasi-periodic entrainment of these drops into the
jet. It was found that the fluid originated from the liquid orifice
except in those instances where spray from a too closely positioned
impaction surface deposited on the liquid feed tube (as on most other
internal surfaces).
Based on these findings,
tions could be eliminated if a
would prevent formation of sa
it seemed that atomizer
nozzle arrangement could
It deposits on the jet-l iquid interface,
output fluctua-
be devised that
and that would cause all liquid fed to the device to be atomized while
preventing any settling or impacting spray from accumulating in such a
manner that it re-enters the jet.
(4) Design of Improved Constant Output Atomizer-_J-ICOA)
Initially, in attempting to fulfill the above criteria, a variety
of simple modifications of the original liquid feed configuration were
tried, such as the ones depicted in Figure 3-47 which were, however,
134

I
i: n * t LIQUID
Figure 3-47. Two examples of liquid feed configurations which were tried out.
135
unsuccessful. In considerable deviation from those more conventional
nozzle geometries, experiments were run with an atomizer consisting of
the usual VGA air jet nozzle over which a disc of fine wire mesh (~0.1
mm openings) was placed and a liquid feed orifice positioned to contact
the wire mesh about 3 mm off the jet axis. In operation, the wire mesh
held the liquid pumped from the orifice by capillary action while the
jet penetrating the wire mesh atomized the liquid being sucked into its
path. In this arrangement where the liquid was flowing radially towards
the jet in the center, no salt deposits were formed and no liquid left
the main stream to be entrained later. This design provided an output
with much fewer fluctuations, but the wire mesh in the path of the jet
seemed to have a somewhat detrimental effect on reproducibility. Also
from the standpoint of decontamination and maintenance, the wire mesh
was impractical.
The next step in the evolution of the ICOA was the version illus-
trated schematically in Figure 3-48. The wire mesh was substituted by a
groove which ducted the fluid (again by capillary action) to the center
into the jet and, judging from the performance, the positive features of
the wire mesh model were retained while the disadvantages had been
eliminated. Output stability proved to be excellent, but the size
distributions (Figure 3-49) were too broad to be acceptable for ACPL;
also, the total particle output was rather low.
For this reason and to achieve better mechanical stability, a much
improved model schematically shown in Figure 3-50 was fabricated; this
model represents the final version of the DRI-ICOA built under this con-
tract. The liquid feed tube was changed to enter the groove from inside
136

t
t LlQUlD
Figure 3-48. atomizer. Schematic of earJy version of improved constant output
137

@ 0.1 % NaCl
a 0.01% NaCl
I I I I I I Ill I
30 100
DIAMETER - nm
IO
Figure 3-49. NaCl size distributions obtained with nozzle shown in Fig. 3-48 operated at 30 psi.
138

/ NO. 78 DRILL HOLE
LIQUID
NOZZLE
2 CHANNEL
Figure 3-50. Schematic of final version of ICOA, showing the coni- cal exit of the air nozzle and the liquid feed enter. ing the groove from "inside".
139

and the air nozzle was fitted with an exit cone. Instead of replaceable
nozzle plates as used in the TSI-COA, the GE-ACPLA and the VGA, the ICOA
nozzle assembly is machined in one piece from brass bar stock. The
former VGA housing was subsequently used as .an enclosure for the ICOA
whereby, in general, the impaction plate.was positioned 4 cm from the
nozzle.
Examples of the device's performance are presented in Figures 3-49
and 3-51. Size distributions for three different air pressures and
0.025% NaCl concentration shown in Figure 3-51 are a considerable
improvement over those of Figure 3-49 with respect to total output and
width of the distribution. Indications are that this improvement
resulted from the air nozzle exit cone and the reduced distance between
liquid feed and air nozzle.
The major accomplishment is demonstrated in Figure 3-52, showing
the beginning and end of a 6-hour run which is free of fluctuations
larger than +2% and having drifted only about 2% over that whole period. -
Equally satisfactory were stop-and-start sequences of which an example
is depicted in Figure 3-53. .
Use of several copies of the ICOA over a period of half a year
confirmed the initial findings that this design surpassed all other
atomizers tested at DRI with regard to output stability and reproduc-
ibility. Nevertheless, since there is still a possibility that a unit
might fail, it is suggested that the ICOA nozzle assembly be slightly
modified by incorporating the liquid feed into the same cylinder as the
air feed (two parallel bores) resulting in a nozzle assembly that.can
easily be plugged into the atomizer housing and removed for replacement.
140

-
A 90 psi 0 50 psi
DROP DIAMETER (pm)
1 I I I Illll I IO 20 50 100 200
PARTICLE DIAMETER (nm)
Figure 3-51. NaCl particle size distributions from ICOA at three indicated air pressures. Note the very slight de- crease in the mode diameter with increasing pressure (.5 ml/min flow of 0.025% solution).
141

Figure 3-52. Strip chart record of ICOA output as measured by EC-EAD for a six hour run; shown are first and last 20 minutes, demonstrat- ing good constancy over Jong periods.

Figure 3-53. Strip chart record of ICOA output during stop-restart event,, indicating good repeatability.

Flight hardware would include at least one pretested and precalibrated
stainless steel unit per scheduled experiment period.
(5) Evaluation of GE-ACPL Atomizer
The last task of this program was to laboratory test the actual
flight model of the GE-ACPL atomizer. In view of the experience with
all other atomizers, these tests concentrated on the unit's behavior
with respect to output constancy and reproducibility.
Figure 3-54 is an exterior view of the GE atomizer; the front
flange incorporates the feed-throughs for inputs of liquid (bottom) and
air (top), while the aerosol outlet can be seen on top of the canister.
The nozzle and impaction surface geometries are very similar to those of
the TSI-COA, except that the GE unit has no drain for the excess liquid
but instead utilizes most of the canister volume to retain the liquid by
capillarity in packed quartz fibers.
Operation of the unit was carried out according to GE specifica-
tions which, among other things, included use of high quality water
(such as J.T. Baker HPLC reagent grade), filtration and degassing of the
NaCl solution, concentration of which should preferably be O.l%, solu-
tion flow rate of 0.1 to 0.5 'ml min -1 , and compressed air with relative
humidity below 30% and .pressure regulated within +l%. Also, quite -
plausibly, the airflow had to be on a few minutes before and after the
liquid flow in order to protect the air nozzle from salt contamination.
The air flows through the EC were recorded as well as the exit
temperature of the aerosol on the same stripchart as the output measured
by EAD. The important parameter of solution flow was measured with a
144

.
Figure 3-54. Photograph of GE-ACPL Atomizer tested at DRI. Front flange is for liquid (small) and air (large) inlet. Aero- sol outlet on top.
145

rotameter and hand recorded - it never varied more than +0.5%. The -
experiments were run at an air pressure of 25 psi.
Figure 3-55 indicates that this atomizer is capable of producing a
relatively fine aerosol, but for certain experiments, it may be desir-
able to obtain higher concentrations for larger particles, i.e., use of
more concentrated solutions should be permissible with this device.
During the first six runs of about an hour each for testing output
stability, the performance was within specifications except that the
output dropped a few percent from run to run. With the seventh run,
shown in part on Figure 3-56, output fluctuations exceeded the specifica-
tions slightly, while no variations of the other recorded parameters
could be noticed.
After several more hours of operation, output variations resembled
those of the TSI-COA in its most unstable mode; examples are shown in
Figure 3-57. Subsequent atomizing of pure water for two hours nearly
restored the original output constancy for a short period as Figure 3-58
attests although at low fluid flow rates, the fluctuations still far
exceeded the specified limits. With continued use, the device again
deteriorated and had to be run for hours on pure water before it was
marginally usable.
Thus, one has to conclude that the GE-ACPL atomizer, due to its
lack of output constancy, is not suited for its intended use unless
appropriate design changes are put into effect.
146

El 0.1 % NaCl
0 0.025% NoCl
I
30. w IodQ DIAMETER - nm
10
Figure 3-55. Particle size distributions obtained from NaCl solutions with GE Atomizer at indicated concentrations and 25 psi air pressure.
147

Figure 3-56. Output of GE Atomizer showing initial constancy (25 psi, 0.1% NaCl solution).

Ii I.
- .
_.
I ; I(
41 !I i ‘,:
Figure 3-57. Deteriorated output constancy of GE Atomizer after several hours of operation (same time scale as 3-56).
149

Figure 3-58. Improvement in performance of GE Atomizer through prolong- ed flushing with distilled water. Note that fluctuations decrease with increasing solution flow.

C. GENERATION OF WATER INSOLUBLE AEROSOLS
Since pneumatic. atomization proved to be an excellent method for
particle generation from aqueous solutions, one could, of course, extend
the atomization technique to non-aqueous solutions with essentially the
same success. In terrestrial laboratories, such procedures are, indeed,
being applied; however, disposal of solvent vapors which are generally
toxic require facilities that would not have been available in the ACPL
for reasons of weight and volume and/or complexity.
Among alternate methods, the atomization of hydrosols appears
particularly attractive, mainly because of the possibility of using a
proven dispersal method for which the equipment would have already been
on hand in the ACPL, while the production of the particles (in hydrosol)
could be carried out in a suitably equipped terrestrial laboratory. Our
efforts pertaining to this approach are described in the following
subsection while the very limited experimentation on thermal aerosol
generation is discussed in Section 2, Thermal Aerosol Generation, which
follows. Based on previous experience of the investigators, dry disper-
sal of powders for obtaining aerosols in the specified primary size
range was given a very low probability of success, and therefore no
substantive work was performed.
1. Atomization of Hydrosols
a. General,
The performance of atomizers, when working with hydrosols, was
generally found to be equal or superior,to the case of salt solutions;
lesser output fluctuations were attributed to the fact that no salt
deposits formed from hydrosols.
151

One difficulty in working with atomized hydrosols is the much
lower number concentration that can be achieved since only a relatively
small number of droplets may contain a particle in order to avoid abun-
dance of multiplets. Doublets, for instance, are difficult to eliminate
later on even with an EC since doubly charged doublets differ very
little in mobility from the singly charged singlets (see Section D,
Shaping of the Size Distributions). Depending on the type of experiment
planned, one has to find the optimum balance between a high concentra-
tion of singlets and interference from multiplets.
A further potential problem may be caused by the presence of the
particles consisting.of the residue of "empty" droplets. Although these
undesired particles are very small, they are present in large numbers
and generally are water soluble if not hygroscopic. Thus careful
consideration has to be given to their possible influence on the planned
experiment. If their removal is deemed necessary, diffusive capture or
exclusion in the EC.are effective methods to use.
. The most serious problem, however, is posed by the residue from
the liquid which coats the insoluble particle. If left on the parti-
cles, it is likely to influence the particle behavior as CCN, while
removal may be a difficult task - mere heating may only drive off the
deposit temporarily while subsequent cooling may lead to recondensation
on any particles present. Detailed procedures have to be developed
separately for each individual case. Methods to clean the particles in
the hydrosol stage can be very complex and still leave considerable
.doubt as to their effectiveness as the vast literature on purification
of polymer latices attests (e.g., Wilkinson, et al., 1980).
152

It is nearly impossible to directly determine whether a residue is
left on the particles that would mask their intrinsic surface pro- '.
perties. An indirect procedure (which could not be tried out in the
framework of this Investigation) is suggested for further study. There-
by, experiments should not only be carried out with the insoluble parti-
cles, but also with residue particles of the same size which would be
obtained by atomizing a specially concentrated batch of the liquid
component of the hydrosol. Identical behavior of the two particle
populations would then support the contention that residue, was covering
the insoluble particl,es.
Despite the relatively dim outlook on clean-up of aerosols from
hydrosols, a limited exploratory effort was undertaken by experimenting
with a few specific substances.
b. Experiments with Hydrosols
(1) Commerciall,y Available Particles ---___
Early in this study, hydrosols of monodisperse polystyrene latex
particles of various sizes were frequently aerosolized for calibration
and test purposes (see, e.g., Figure 2-5). In the context of instrument
assessment, there was: no reason to be concerned about small amounts of
solute (surfactants, minerals, etc.). The only problems in atomizing
these hydrosols stemmed from irreversibility of particle agglomeration,
which were more severe for smaller sizes. However, due to their complex
nature, latex spheres were not considered desirable as CCN test mater-
ials. In contrast, Teflon as an extreme in hydrophobicity, and carbon
black as a constituent of the atmospheric aerosol were selected as they
were also commercially available.
153

Two batches of Teflon aqueous dispersion* (No. 3416) were procur-
ed. Unfortunately, attempts to atomize the dispersions were unsuccess-
ful as the Teflon accumulated on the baffle, clogging the atomizer in
just a minute running time. No particles (50-500 n: according to specs)
could be found downstream of the atomizer. Since this occurred even
before removing the stabilizing components of the liquid, further at-
tempts of transforming this product into an aerosol were terminated. **
Similarly, carbon black , of which several monodisperse batches
of different sizes were obtained, resisted incorporation into an aqueous
dispersion even when using an ultrasonic agitator and surfactants.
Atomization of the suspension showed insufficient de-agglomeration.
Thus, no further efforts were expended on this topic.
(2) Laboratory Prepared Hydrosol - AgI, Silica
Another candidate material, AgI, insoluble and hydrophobic in its
pure form, was not considered here for the hydrosol-atomization tech-
nique since Vali, et al. (1978) were in the process of studying this and
other AgI generation methods. For the very reason discussed above, a
hydrosol derived AgI aerosol is impure and hygroscopic, and thus not of
interest in the context of insoluble CCN.
There is a considerable amount of literature pertaining to the
preparation of hydrosols of inorganic compounds. For instance, silica
(Stb'ber, et al., 1968), magnetite (Sugimoto and Matijevic', 1980), fer-
ric oxide (Mati.jevic' and Scheiner, 1978), alumino silicates and gold
(Newton, et al., 1975), and aluminum hydroxide (Tentorio, et al., 1980);
* E.I. DuPont de nemours, Wilmington, Del.
** Particle Information Services, Inc., Grants Pass, OR.
154

all of these contributions describe formation of monodisperse submicron
particles. The work on silica was known,to the author and, since silica
is a constituent of the atmospheric aerosol, it was 'decided to evaluate
this hydrosol and its applicability to ACPL aerosol generation.
By carefully following the procedures described by StEber, et al.,
it was possible to prepare hydrosols of silica in a reproducible
fashion. Briefly, preparation involved dropwise addition of tetraethyl
silicate to a vigorously stirred aqueous solution of ethanol and ammoni-
um hydroxide. The make-up of the resulting particle populations depends
on the concentration ratios used. Figure 3-59 represents the size
distributions from aerosolized silica hydrosols obtained with three
different ammonium hydroxide concentrations. It is interesting to note
the increasing predominance of a. small size peak with increasing NH40H
concentration. At first, it was thought that the real silica particles
were only those at the 100 nm peak and that the small particles were
"empty" droplet residues. To test this, the aerosol was passed through a
tube oven where the volatile water, alcohol and ammonium hydroxide
evaporated while the fourth constituent, silicic acid, becomes silica
upon dehydration. The size distribution before and after the oven were
not significantly different. Both modes, therefore, have to be attribut-
ed to silica particles. Since the particle sizes of the two peaks were
a factor of five apart, it can be established that the larger particles
are not multiplets of the smaller particles.
In view of the intended ACPL application, the question of colloid-
al stability had to be addressed since in-flight preparation of the
hydrosol would be impossible as there is considerable release of heat
155
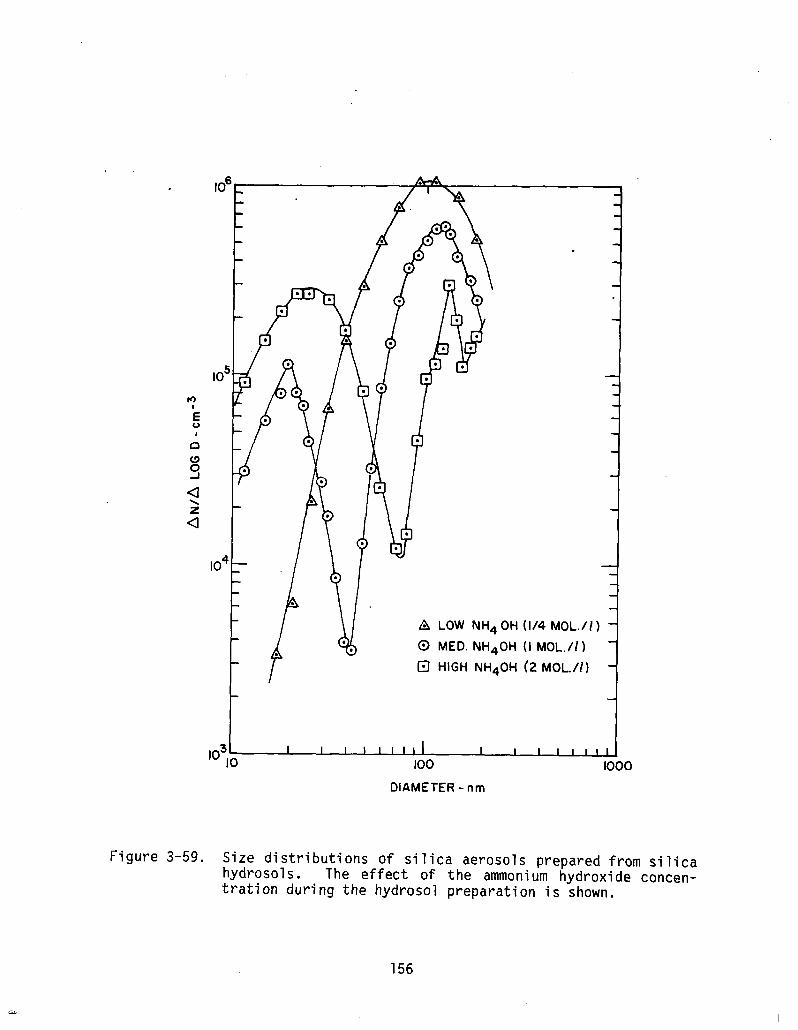
. k 91, . A LOW NH4 OH (l/4 MOL./I 1
0 MED. NH40H (I MOL./I)
a HIGH NH40H (2 MOL./l)
DIAMETER - nm
Figure 3-59. Size distributions of silica aerosols prepared from silica hydrosols. The effect of the ammonium hydroxide concen- tration during the hydrosol preparation is shown.
156

@ MEblUM NH40H
a 2 DAYS LATER
31 ‘O IO
I I I llllll I I I lllll
100 1000
DIAMETER - nm
Figure 3-60. Two silica aerosol size distributions showing the effect of aging of the hydrosol.
157
L

and vapor during some of the preparatory stages. Figure 3-60 indicates
that in the two-day period between the two measurements, some coagula-
tion may have caused a slight shift of the small particle'peak towards
larger sizes. However, the effect was definitely not large enough to im-
pair the usefulness of this hydrosol for ACPL type of experiments.
The influence of the tetraethylsilicate concentration on the size
distribution is shown in Figure 3-61 which indicates that a better
separation of the two modes can be achieved if a relatively low concen-
tration of tetraethyl silicate is used. This assumes that interference
from larger, doubly charged particles, after passage through one EC (see
3.41, can largely be avoided as long as multiplet formation can also be
prevented.
A SEM view of an amply exposed sample of the silica aerosol is
presented in Figure 3-62 which confirms that the particles are reason-
ably spherical.
Although the question of surface contamination by residues from
the liquid could not be pursued in depth, there is a reasonable
probability that a sufficient clean-up in the hydrosol stage can be
achieved to at least minimize the danger from toxic vapors during at-
omization in the ACPL; therefore, further study of this hydrosol/aerosol
is strongly indicated. The above mentioned ferric oxide hydrosol (the
literature on which came to our attention too late to allow experimenta-
tion with the substance) should also be investigated carefully as it may
be even more suitable for the ACPL application.
158

- I I El LOW CONCENTRATION 0 MEDIUM OF TETRAETHYL
SILICATE A HIGH
8 I
I .
5- I I I I I I I 30
DIAMETER - nm
I
-
d 30
Figure 3-61. Effect of the tetraethylsilicate concentration (in the process of hydrosol preparation) on the size distribution of silica aerosols generated from silica hydrosols.
159

Figure 3-62. Two different SEM views of a sample of electrostatically precipitated silica aerosol (gap in line represents 500 nm).

2. Thermal Aerosol Generation
Aerosol generation by thermal means was only considered for insol-
uble particles and only briefly explored as a less desirable alternative
to the hydrosol technique - less desirable because of additional heating
and gas supply requirements which might have been prohibitive for the
ACPL while, on the other hand, the atomizer was inten,ded to be a part of
the ACPL anyway.
a. MI
As mentioned previously, Vali,. et al. (1978) investigated and
compared various methods of AgI aerosol generation. They selected the
hydrosol atomization as the most satisfactory generation scheme. Since
their aim was to produce ice nuclei, the NH41 residue remaining on the
otherwise fairly pure AgI particles was not considered detrimental;
however, as discussed earlier, a purification method would have to be
devised before the attractive feature of AgI as a test CCN, namely, its
water insolubility would become evident.
Thus, a simple thermal generator was devised, a schematic of which
appears in Figure 3-63: a tantalum boat stretched between two copper
electrodes served as the low voltage electrical heat source which was
mounted inside a Pyrex flask; a stream of nitrogen was directed at the
hot AgI in a Ta-boat, presumably quenching the vapor to form the
aerosol. The use of N2 allowed heating up to 650°C without particles
being generated from the tantalum. This requirement, however, would
probably make this technique unacceptable for ACPL despite the relative-
ly good output constancy that was achieved with this setup. The size
distributions obtained at 500°C and 650°C are plotted in Figure 3-64
161

Agl
. c N2 (-8 I/min)
Ag I ON TA BOAT
STEP -DOWN TRANSFORMER
1
Figure 3-63. Schematic of thermal silver iodide aerosol generator.
162

IO8
IO’
*:
5 I
P L3 s
?
a’
IO6
IO’
- __ I
I I I llllll I I I III IO0
DIAMETER - nm IO
Figure 3-64. Size distributions of AgI aerosol, generated with-device of Fig. 3-63 at two different temperatures, 500°C ((3) and 650°C (A).
163

which indicates a considerable dependency on temperature that provided
the desired control over the particle size.
b. Paraffin Wax
Common paraffin wax or the more refined related waxy compounds .
such as eicosane are water insoluble, hydrophobic, have a relatively low
melting point and a high enough vapor pressure over the liquid to
generate particles by condensation. Generally, one would utilize a
different aerosol (such as NaCl) to nucleate the wax particles from the
vapor. In the present case, an attempt was made to produce the wax
aerosol homogeneously without the help of an auxiliary aerosol for two
reasons: (1) simultaneous operation of two particle generators would
add to complexity and (2) the presence of even a small number of partic-
les from the auxiliary aerosol that (for one reason or another) did not
participate as CN for the paraffin wax, could jeopardize the experiments.
The very simple apparatus depicted in Figure 3-65 produced paraf-
fin particles mainly in the 80 to 200 nm range (with a long tail of the
size distribution reaching into the optical range) at concentrations of
5 to 8x103cm -3 . Apparently the gas jet emanating from the capillary pro-
duced a high enough supersaturation to cause homogeneous nucleation from
the paraffin vapor. No tests with air in place of N2 were carried out,
nor were attempts made at optimizing the system to obtain outputs that
could be treated with the EC. The constancy of the output was
encouraging (+5%) but could probably be improved. -
ACPL adaptation would most likely have required a considerable
effort since a liquid is involved that needs to be contained. Also, the
164
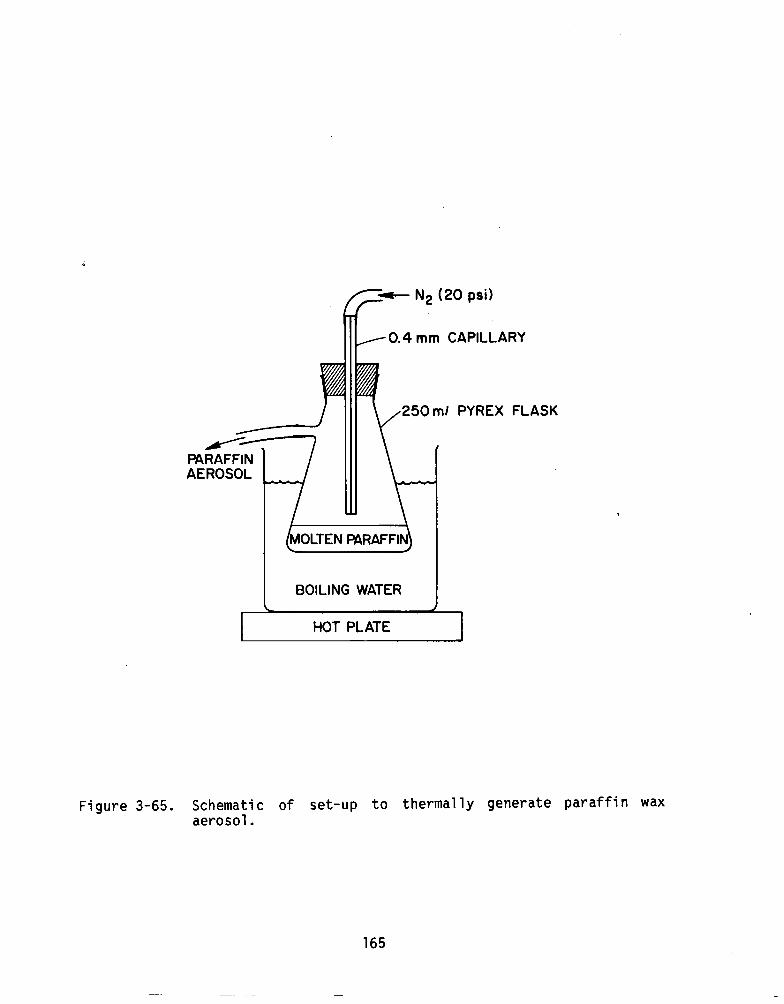
.
PAkAFFlN AEROSOL
r L
,- 0.4 mm CAPILLARY
25Om/ PYREX FLASK
@~LTEN PARAFFI$
BOILING WATER
HOT PLATE
Figure 3-65. Schematic of set-up to thermally generate paraffin wax aerosol.
165

large particles (>500 nm) would have to be eliminated, mainly to avoid
clogging of critical passage ways in the flow system.-
It is planned to use and improve this generator in conjunction
with the "complex aerosol" study.
D. SHAPING OF SIZE DISTRIBUTIONS
In the context of CCN experimentation, the purpose of manipulatina
the shape of aerosol size distributions is mainly to control the slope
of the resulting CCN supersaturation spectra in order to be able to
either simulate naturally occurring types of CCN populations, or to test
instrumentation or theoretical models.
Some control over the shape of particle size distributions can, to
some extent, already be exercized at the source of .the aerosol as has
become evident so far: the type of atomizer, the solution concen- .
tration, the temperature in thermal aerosol generators, or the size
distribution of hydrosol particles are just some of the available
means. However, there are limitations to these techniques in general
and, in particular, with respect to intended ACPL applications, only one
atomizer type was on hand. Thus, a few methods for shaping an already
existing size distribution are discussed below.
1. Impaction
Since the efficiency with which aerosol particles can be removed
from their suspended state by aerodynamic capture strongly increases
with increasing particle size, this technique mainly serves to reduce
the number of large particles in a given population. However, even
impacting the large particles in our size range of interest is relativ-
ely inefficient and, therefore, this method is best applied in conjunc-
166

.
.
\
.
.
m ORIGINAL SPECTRUM
A IMPACTOR ‘L’
0 IMPACTOR ‘S’
I I I I I III I 30 100 z
DIAMETER - nm
Figure 3-66. Size distributions of NaCl aerosols from VGA; m desig- nates the original spectrum, while the other curves demon- strate the effect of impactors for precipitating larger droplets at the atomizer exit.
167
-
tion with atomizers where the removal procedure can be applied to solu-
tion droplets prior to evaporation, i.e., about an order of magnitude
larger in size. Although most atomizers are already equipped to impact
the large droplets, further removal of large particles is still possible
as Figure 3-66 demonstrates. The original size spectrum obtained with a
DRI-VGA had a modal diameter of 100 nm; by forcing the atomizer output
through simple jet impactors with round nozzles of 1 mm (S) and 1.5 mm
(L), the size spectra were made to peak at 65 nm and 88 nm, respective-
ly, in addition to slightly steeper slopes (it is not clear why the
smaller impactor caused an increase in small particles).
Since jet impactors would probably have been unsuitable for ACPL
due to the considerable pressure their operation requires, a filtration
method was explored. The effect of passing the atomizer output through
a series of wire screens (mesh openings ~40 urn) is seen in Figure 3-67
which indicates that large particles were removed at about the same rate
as in the jet impactor, while the screens retained approximately half
the particles smaller than the mode diameter. Reducing the mesh size of
the screens only slightly accentuated the effect illustrated in Figure
3-67.
Although the size distributions were narrowed by only about 20%
(in terms of geometric standard deviation) with the array of screens in
these experiments, the system could be further optimized, especially by
adding a set of screens after the dryer to remove a substantial portion
of the smallest particles by diffusive capture. In view of the
simplicity of this technique its application in the ACPL should be
considered; however, since these devices tend to clog up during use, the
168

IO7
log
\
I I I Illll I -1 .^a me
IU 30 IUU 300
DIAMETER - nm
Figure 3-67. Effect of wire screens at atomizer exit on the size dis- tribution of the VGA aerosol output ((3 original, A passed by screens).
169

a 7
Figure 3-68. Schematic of laboratory set-up for experimenting with the recondensation scheme as narrowing method for particle size distributions.
170

- . l .
. .
.
‘\ .
/x DIAMETER - nm
X
, .
Figure 3-69. Two Dioctyl Phthalate aerosol size distributions as an example showing the effect of the recondensation techni- que. DOP aerosol from atomizer (XI, and after recondensa- tion (8).
171

design should provide that spare units in cartridge form can easily be
flipped into the flow path.
2. Thermal Modification of Size Distributions
This relatively well known technique is based on the fact that
evaporation of a particle generally leaves a residue of contaminants
which will act as condensation nucleus in subsequent rapid cooling and
recondensation. Applied to a polydisperse population of particles, this
means rapid condensation on polydisperse nuclei which yields nearly
monodisperse condensate particles.
A laboratory-built oven and cooler combination, schematically
shown in Figure 3-68 was used.to experiment with this concept. Since
the maximum oven temperature was insuffi.cient to evaporate NaCl par-
ticles, tests were performed with dioctyl phthalate (DOP) for which the
thermal treatment is routinely applied (TSI produces an oven-recondensa-
tion unit designed for this). Figure 3-69 illustrates the DOP droplet
size spectrum obtained directly with the Nano-Mist atomizer (bottom
curve, mode diameter larger than upper EC range limit), and the much
narrowed distribution evolving from the heat treatment. The geometric
standard deviation of about 1.5 is an excellent improvement over the
extremely broad original distribution, but in the case of the much less
viscous salt solutions, the original distribution may have a u 9
in the
vicinity of 2.10 compared to which the recondensed aerosol would not
constitute a significant enough improvement to warrant the additional
complication of an oven and cooler unit with the necessary controls.
172

3. "Monodisperse" Aerosols from the Electrostatic Classifier .--..__I. __l-
The ability to. produce extremely narrow ,("monodisperse") size
distributions is most important since this will improve the quality and
decisiveness of information obtained from experiments involving size
dependent properties.
In the previous discussion on the EC (in Section 1I.B.a.) it was
shown how well this instrument can extract particles of a very narrow
mobility range. The fact that this translates into a multitude of size
peaks due to the unavoidable presence of multiply charged particles
causes a complicat ion in using the EC as a sizing too 1 which can,
however, be dealt w ith mathematically. In contrast, if the output of an
EC should serve as a monodisperse aerosol the problem of addititional
though smaller modes in the size distribution (as shown in Figure 3-70,
an example where the EC was set for the size of 58 nm) is much more
difficult to solve. One successful approach, taken by Gerber, et al.
(19771, was to use an aerosol centrifuge as a filter by operating it
such that any particle larger than the desired size was precipitated
thus completely suppressing the modes originating from multiply charged
particles. While this solution is acceptable for a terrestrial labora-
tory, it would have added too much complication to the ACPL and is,
therefore, not recommended.
Having two EC's at our disposal, we explored the suitability of
their use in series to improve upon monodispersity. In order to better
visualize the partitioning the aerosol undergoes, one is referred to
Figure 3-71. On top, the aerosol treatment is represented in terms of
EC voltage (which is inversely proportional to the mobility), while the
173

Figure 3-70. Trimodal output of one EC as diagnosed with second EC t.058 llrn, singly charged; ,085 pm, doubly charged; 0.106 pm, triply charged).
174

4 ‘\ 1 I \ 1 \ -\ \ \ r’ :
\ 1 I \ I \ 4 I \
/Ii : I
1 \ \
I 2e / \ I I \ A 1’
\ :2e\
/ \(” \ 1’ 1,
!L
0 /I
/
1’
: I
i
I I I
I
vd, I “2d,
“2d,
“Id, “Id*
EC VOLTAGE “2d,
AN, -‘\ \ le \,
\
dl I
-FIRST EC
iN2 \
\ \ \ \ \ \ \
2e \
PARTICLE DIAMETER SECOND EC \ (SET AT “IdI1
Figure 3-71. Schematic representation of the utility to use two EC's for narrowing size distributions and reducing multiply charged particle interference. (--- input; - output; for details, see text).
175

bottom part shows the same procedure in terms of particle size. On the
left, the dashed line indicates a typical input into the first EC which
is set at a fixed voltage Vld which corresponds to particles with size 1
dl and one elementary charge. One recalls (cf. Fig. 2-2, Section
II.B.(c), Multiple Charge Compensation) that Vld 1
= V2d , meaning that a 2
certain d2 exists for which doubly charged particles have the same
mobility. Since Figure 2-3 indicates that triply charged particles are
very infrequent in our size range, we limit the present argument to
singly and doubly charged particles. The size distribution of the
output from the first EC (at bottom left) shows the two modes at dl and
d2' At this point one has to determine the number ratio of the two
populations nd /n 2 dl
= AN2*f2d2/AN1'fldl where ANi represents the total
number of particles in the output in the EC size range centered on di,
and f jd the fraction of particles with diameter di carrying j charges
(plotted in Figure 2-3). Depending on the type of experiment, the shape
of the input size distribution, and dl the ratio nd /n 2 dl
may be
satisfactorily small. If not, passage through a second EC can provide
the improvements shown on the right of Figure 3-71. One must remember
that the two different charge and size populations emerging from the
first EC are again neutralized prior to entering the second EC; thus,
there are now four different populations that concern us (the vast
majority of particles having become uncharged is lost for our purposes).
Depicted at the bottom right (solid lines) are the singly and double
charged dl particles and the singly and doubly charged d2 particles
whereby their number ratios are determined according to the data of
Figure 2-3. While the singly charged dl and the doubly charged d2
176
I

particles are again having the mobility associated with Vld (=V2d ) as 1 2
indicated at top right, the doubly charged dl' particles have twice the
mobility, i.e., they are extracted at V2d = Vld /2, and; similarly, the 1,
singly charged d2 particles can be found'at Vld .l
= 2 Vld . Thus, there 2. 1
are three choices of monodisperse outputs, and the selection has to
depend on the total number of particles available in each category, and
on the question whether the new ratio of doubly to singly charged
particles at Vld is acceptable, or whether one needs total lack of 1
contamination as featured by the two other peaks. A partial answer can
be obtained by considering the general expression for the available
particle numbers: 2
2 AN1'fldl for the main peak, and its contaminant,
AN2-f2d2 which show that the percentage of contamination with two EC's
is f2d2'fld, times the value for one EC. The peak at V2d provides 1
AN1 .fldl.f2d, particles, whereas the number of singly charged d2 parti-
cle amounts to AN2f2d2.fld2. Since 1 > fldl >> f2dl, one notices
immediately that the main peak at Vld contains much higher particle 1
concentrations than the two uncontaminated side modes - except when the
original size spectrum is such that aN1 << aN2 and dl >lOO nm, a
condition not very probable in the context of ACPL experiments.
An example showing how two EC's reduce the percentage of contami-
nating doubly charged particles can be found in Figure 3-72 in which the
assumptions for the original size spectrum were log-normality with mode
at 80 nm and 0 = 2. 9
Evidently it is mainly for small particles below
about 70 nm where the 2 EC method using the main peak is of great
advantage, whereas above 100 nm the doubly charged dl particles become
numerous enough to be useful (20% at 100 nm; 40% at 200 nm).
177

24
16
a?
12
0
. d .
IEC
70 90
DIAMETER - nm
150
Figure 3-72. Percentage of doubly charged particle interference with one EC and two EC's for the example of a log-normal distri- bution centered at 80 nm with ag = 2.
178

The 2 EC method not only provides less contaminated monodisperse
aerosols, but also a more monodisperse one than with single EC. This
fact is also illustrated in Figure 3-71 where the input into the second
EC is represented by the dashed triangular peaks which are reduced to
the narrower peaks (solid lines) delineated by segments of parabolas.
Based on the above considerations, it appears that a second EC
would have been very valuable for the ACPL program where experiments
with particularly well defined monodisperse aerosols were called for.
179
L

IV. CONCLUSIONS AND RECOMMENDATIONS
A. AEROSOL CHARACTERIZATION .
' The task of characterizing an aerosol in low-g consists of estab-
lishing the size distribution and should be provided in two forms. The
first involves obtaining real time information on the aerosol for. the
experimenter and for electronic processing/storage which would then
allow computerized post-flight evaluation. The second form consists of
acquiring representative collections of actual aerosol particles ("hard
copy") for post-flight examination, mainly by electron microscopy which
offers the best possible size calibration as well as morphological
insight.
Application of an electrical mobility method is currently the only
proven way for real time measurement of size distributions in the 10 to
100 nm size range. The two possible modes that were examined in the
form of commercial instruments were the TSI Electrical Aerosol Analyzer
(EAA) using unipolar charging and the TSI Electrostatic Classifier (EC)
working with aerosol in bipolar charge equilibrium. Despite its higher
particle number sensitivity, the EAA should not be used for a precision
size distribution analysis because of its insufficient resolution.
However, the EAA would be beneficial by providing a time history of the
operation of the aerosol generators.
An accurate aerosol size distribution measurement can be obtained
with the EC due to its excellent size resolution. A problem lies in the
choice of the particle detector. The Electric Aerosol Detector (EAD)
that is generally used requires rather high number concentrations, and a
180

switch to a different particle counter is recommended. The new TSI-CNC
would be nearly ideal if adapted to zero-g, and if the vapors of its
working fluid (butyl alcohol) can be contained in a manner compatible
with low-g operation; also, the device's detection limit of 20 nm has to
be kept in mind. One has to be aware that, even with improved particle
counting capabilities, the EC would have to sample at a point in the
system before final dilution of the aerosol.
If a monodisperse aerosol is generated by means of one or two
EC's, it is, of course, not necessary to re-analyze it with an addition- .
al EC - only a particle count is needed.
Acquisition of a hard copy sample, regardless of method used, is
accompanied by the difficulty of obtaining a sufficiently high particle
density on the substrate in the allotted time, especially since the
sample should be taken at the stage of final dilution near the point of
entry into the experiment area. This latter condition is very important
because this sample should be most representative, and thus not contain.
elements which may be lost further downstream (during dilution and
transport).
After reviewing the various sampling procedures, it is concluded
that collection on membrane filters would provide the highest yield and
most contamination safe in-flight handling; but this would also require
that the best procedure of post-flight sample transfer onto electron
microscope specimen grids be further studied experimentally. It is also
recommended that a back-up sample be taken at a point where particle
concentration is high such that direct deposition on grids by electro-
static precipitation can be accomplished. A special miniature sampler
181

would have to be designed according to guidelines found in the litera-
ture.
The collection and preservation of liquid aerosol samples (such as
H2S04) is considerably more difficult and was not explored as a part of
this study. It is suggested that encapsulation schemes described in the
literature be the subject of a further experimental study; even if
general feasibility can be demonstrated, the necessary volatile chemi-
cals may be excluded from an ACPL type of environment and other methods s
would have to be isolated.
B. AEROSOL GENERATION
The problem most common to all particle generation techniques
investigated on this project was temporal instability of the output.
Only in the case of the pneumatic atomizer was it possible to achieve a
satisfactory solution.
The photolytic aerosol generator, despite its apparent simplicity
could not be made to behave predictably enough for an ACPL type of task.
In the meantime, through work performed under other sponsorship, it has
become clear that the photochemical processes are too complicated to be
fully described at this time. More basic research rather than engineer-
ing is recommended to further elucidate the phenomena involved in the
particle formation mechanism - a necessary first step towards the goal
of closely controlling the output of the aerosol generator.
Close examination of pneumatic atomizer performance showed that
the only fault of this type of aerosol production was a tendency to flip
unpredictably from a stable to an unstable output mode. Close scrutiny
of the atomizing process during operation of specially designed variable
182

geometry atomizers allowed us to identify the following causes for the .
unstable behavior:
(1) Fluid accumulation of various amounts are periodically en-
trained into the air jet causing sudden increase in output. These
accumulations partly originate from relatively large droplets being
whirled around between nozzle and baffle, eventually impacting somewhere
- a situation that is aggravated when higher salt concentrations cause
foam formation. Depending on the liquid feed tube configuration, some
fluid may also migrate directly from the orifice to some other location
before being entrained by the jet.
(2) Salt deposits may gradually form on the rim of the liquid
orifice altering the air jet flow pattern sufficiently to cause differ-
ent atomization characteristics. The probability of growing salt de-
posits increases with solution strength.
Based on these findings, an improved constant output atomizer
(ICOA) was designed which avoids the above cited problems. Extensive
tests and routine use proved the validity of the design. For a flight
version a minor modification is recommended whereby both air and liquid
are fed through parallel bores within‘ the same nozzle cylinder. This
would enable the experimenter to quickly exchange atomizer heads and
thus, by having spares along, it would be possible to start .each
experiment with a clean, though pretested, atomizer head.
Most aerosol generation techniques produce rather broad size dis-
tributions (a 9
> 2) with the possible exception of atomized hydrosols.
In order to obtain narrower distributions as required for many low-g
experiments, three shaping methods were evaluated:
183

(1) Simple round jet impactors were able to reduce the large tail
end of the distribution (>200 nm) by an order of magnitude. This could .
make many otherwise unacceptable polydisperse aerosols suitable for
low-g experiments.
(2) One or two EC's are able to narrow down size distributions
better than other candidate methods. While one EC provides essentially
a bi- or tri-modal distribution with sharp individual peaks (U 9
% 1.05
for each), a second EC can reduce or totally suppress the secondary
peaks and further narrow the primary one. Unfortunately, this is
accomplished at the expense of particle number concentration.
(3) The recondensation method was briefly examined with the aid
of DOP aerosols and found to be of moderate effectiveness.
It is recommended that methods (1) and (2) be utilized in low-g
while (3) should only be considered if ovens and coolers are part of the
flight facility.
Since pneumatic atomizers can easily be used to generate aerosols
of water insoluble particles by dispersing hydrosols or colloidal sus-
pensions, efforts were undertaken to produce, as an example, silica
hydrosols following published procedures. The result was successful
with regard to the physical characteristics of the ensuing aerosol;
however, to what extent the non-aqueous components of the liquid can be
driven off, is a question that is very difficult to answer. In many
cases as in the present example, passage through a tube oven evaporates
the liquids, but disposal of the vapors remains a problem in a flight
situation where heating energy and weight and volume for activated
charcoal are at a premium - not to mention the toxicology of the vapors.
184

Furthermore, it is extremely difficult to ascertain that no residue
contaminates the particle surfaces.
It is suggested that future efforts in this area include the
search for procedures to clean the hydrosol 'prior to flight such that
. only modest in-flight vapor treatment is necessary. Also, methods for
testing the purity of particle surfaces should be established.
Brief experimentation with thermal generation of aerosols of the
hydrophobic substances AgI and paraffin wax proved moderately succcess-
ful, but even prior to designing low gravity adaptations these systems
require further study to optimize their performance in the terrestrial
configuration.
185

V. REFERENCES
Anderson, R.J., 1977: A literature review for aerosol generation and
characterization techniques suitable for use aboard the Atmospher-
ic Cloud Physics Laboratory. Calspan Report No. CK-6033-M-1,
Calspan Corp., Buffalo, NY.
Binek, B., 1965: Sampling finely dispersed aerosols for electron micro-
scopic particle analysis. Staub, 25, 13-19. ___ -
Chatfield, E.J., R.W. Glass and M.J. Dillon, 1978: Preparation of
water samples for asbestos fiber counting by electron microscopy.
U.S. EPA Report No. EPA-600/4-78-011, pp. 118.
Collins, G.F., 1975: Measurement of variation in output rate from
aerosol generators. J. Aerosol Sci., 6, 169-172. -
Cooper, G. and G. Langer, 1978: Limitations of commercial condensation
nucleus counters as absolute aerosol counters. J. Aerosol Sci.,
9, 65-75. -
Frank, E-R., K.R. Spurny, D.C. Sheesley and J.P. Lodge, Jr., 1970:
The use of Nuclepore filters in light and electron microscopy
of aerosols. J. Microscopic, 9, 735-740. -
Fuchs, N.A., 1964: The Mechanics of Aerosols, Pergamon Press, New
York, NY, pp. 408.
Gerber, H.E., W.A. Hoppel, and T.A. Wojciechowski, 1977: Experimental
verification of the theoretical relationship between size and
supersaturation of salt nuclei. J. Atmos. Sci., 34, 1836-1841. -
186

Ho, A.T., K.A. Bell, R.F. Phalen and A.F. Wilson, 1979: Fixation and
microscopic sizing of aqueous sodium chloride aerosols; J. Col-
loid Interface Sci., 72, 351-357. -
Hoppel, W.A., 1978: Determination of the aerosol size distribution
from the mobility distribution of the charged fraction of aero-
sols. J. Aerosol Sci., 9, 41-54. -
Kalmus, E.H., 1954: Preparation of aerosols for electron microscopy:.
J. Appl. Phys., 25, 87-89. -
Knutson, E.O. and K.T. Whitby, 1975a: Aerosol classification by elec-
tric mobility: apparatus, theory and applications. J. Aerosol -
Sci., 6, 443-451. - -
Knutson, E.O. and K.T. Whitby, 1975b: Accurate measurement of aerosol
electric mobility moments. J. Aerosol Sci., 6, 453-460. -
Knutson, E.O., 1975: Extended electric mobility method for measuring
aerosol particle size and concentration. Proceedings of a Sym-
posium on Fine Particles, Minneapolis, Minn., Ott 1975, B.Y.H.
Liu, Ed., Oct. 1975, 739-762, NTIS PB-249514.
Kremer, C.P., Jr. and M.O. Powers, 1978: Mist Generator, U.S. Pat.
No. 4,116,387.
Lamb, D. 1978: 'A laboratory investigation of the roles played by ox-
ides of sulfur and nitrogen in the formation of secondary par-
ticulates. Desert Research Insitute, 1977 Annual Report for South-
ern California Edison Company, Rosemead, CA.
Lamb, D., 1979: A laboratory investigation of the roles played by
oxides of sulfur and nitrogen in the formation of secondary par-
ticulates. Desert Research Institute, 1978 Annual Report to South-
ern California Edison Company, Rosemead, CA.
187

Liu, B.Y.H., K.T. Whitby, and H.Y..S. Yu, 1967: Electrostatic aerosol.
sampler for light and electronmicroscopy. Rev. Sci. Instr., 38, -
100-102.
Liu, B.Y.H. and D.Y.H. Pui, 1974: A submicron aerosol standard and
the primary, absolute calibration of the condensation nuclei count-
er. J. Colloid Interface, 47, 155-171. -
Liu, B.Y.H., K.T. Whitby, and D.Y.H. Pui, 1974: A portable electrical
analyzer for size distribution measurement of submicron aerosols.
J. Air Poll. Contr. Assoc., 24, 1067-1072. -
Liu, B.Y.H. and K.W. Lee, 1975: An aerosol generator of high stabil-
ity. Am. Ind. Hyg. Assn. J., 36, 861-865. -
Liu, B.Y.H. and D.Y.H. Pui, 1975: On the performance of the electri-
cal aerosol analyzer. J. Aerosol Sci., 6, 249-264. -
May, K.R., 1973: The Collison nebulizer: description, performance
and application. J. Aerosol Sci., 4, 235-243.
Mercer, T.T., R.F. Goddard and R.L. Flores, 1968: Operating character-
istics of some compressed air nebulizers. Amer. Ind. Hyg. Assoc.
J ., 29, 66-78. - -
Morrow, P.E., and T.T. Mercer, 1964: A point-to-plane electrostatic
precipitator for particle size sampling. Amer. Ind. Hyg. Assoc.
J ., 25, 8-14. - -
Newton, G.J., O.G. Raabe, R.L. Yarwood and G.M. Kanapilly, 1975: Gen-
eration of monodisperse aerosols of 67 Ga-labeled aluminosilicate
and 148 Au-labeled gold spheres. Proceedings of a Symposium on
Fine Particles, Minneapolis, Minn., May 1975. B.Y.H. Liu, Ed,,
Oct. 1975, 129-143, NTIS PB-249514.
188

Novak, J.W., Jr. and R.F. Browner, 1980: Characterization of droplet
sprays produced by pneumatic nebulizers. Anal. Chem., 52, 792- -
796.
Phalen, R.F., W.C. Cannon, and D. Espanza, 1975: Comparison of impact-
ion, centrifugal separation and electron microscopy for sizing
cigarette smoke. Proceedings of a Symposium on Fine Particles,
B.Y.H. Liu, Ed., Ott . Minneapolis, Minn., May, 1975.
737., NTIS PB-249514.
Pui, D.Y.H. and B.Y.H. Liu, 1979: E lectrical Aerosol Anal
1975,. 731-
yzer: Cali-
bration and Performance. Aerosol Measurement, D.A. Lundgren,
et al., Ed., U. Florida Press, Gainesville, FL, 384-399.
Raabe, O.G., 1975: The generation of aerosols of fine particles.
Proceedings of a Symposium on Fine Particles, Minneapolis, Minn.,
May, 1975. B.Y.H. Liu, Ed., Oct. 1975, pp. 57-108, NTIS PB-
249514.
Remiarz, R.J., G.J. Sem, J.K. Agarwal, and C.E. McManus, 1980: An
Automated Diffusion Battery Condensation Nucleus Counter System
for Sizing Submicron Aerosols. TSI Quarterly, 6, 5-12, a publica- -
tion of TSI Incorporated, St. Paul, MN.
Sinclair, D., D.A. Christy, and K. Snyder, 1977:
sol Size Distribution from Diffusion
puter Program for the Graph
surement, D.A. Lundgren, et
ville, FL., 615-631
ical "Str i
al., Eds .
Battery
pping"
, U. Fl
Calculation of Aero-
Measurement - A Com-
Method. Aerosol Mea- -
orida Press, Gaines-
189

Sinclair, D., R.J. Countess, B.Y.H. Liu, and D.Y.H. Pui, 1979: Automat-
ic Analysis of Submicron Aerosols. Aerosol Measurement, D.A.
Lundgren, et al., Eds., U. Florida Press, Gainesville, FL, 544~563.
Spurny, K.R., J.P. Lodge, Jr., E.R. Frank, and D.C. Sheesley, 1969a:
Aerosol filtration by means of Nuclepore filters, structural and ,
filtration properties. Environ. Sci. Technol., 3, 453-464. -
Spurny, K.R., J.P. Lodge, Jr., E.R. Frank, and D.C. Sheesley, 1969b:
Aerosol filtration by means of Nuclepore filters, aerosol sampling
and measurement. Environ. Sci. Technol., 3, 464-468. -
Stb'ber, W., A. Fink and E. Bohn, 1968: Controlled growth of monodis-
perse silica spheres in the micron size range. J. Colloid Inter.
Sci., 26, 62-69. --
Tillery, M.I., 1979: Aerosol Centrifuges. Aerosol Measurement, D.A.
Lundgren, et al., Ed. U. Florida Press, Gainesville, FL, 3-23.
Twomey, S., 1975: Comparison of constrained linear inversion and an
iterative nonlinear algorithm applied to the indirect estimation
of particle size distributions. J. Computational Phys., 13, 188- -
200.
Vali, G., D. Rogers, G. Gordon, C.P.R. Saunders, M. Reischel, and R.
Black, 1978: Aerosol and nucleation research in support of NASA
cloud physics experiments in space. University of Wyoming, Final
Report to NASA, Contract No. NAS8-32067.
Wilkinson, M.C., C. Pope, J. Hearn, and A.R. Goodall, 1980: Comments
on the purification of polymer latices by the dialysis technique.
J. Colloid Interface Sci., 77, 566-570. -
190 MS. GOVERNMENT PRINTING OFFICE: 1981 539-007/29 1-3
1. REPORT NO.
NASA CR-3486 4. TITLE AND SUBTITLE
I I I LC 2. GOVERNMENT ACCESSION NO. 3. RECIPIENT’S CATALOG NO.
STUDY TO PERFORM PRELIMINARY EXPERIMENTS TO EVALUATE 5. REPORT DATE
January 1982 PARTICLE GENERATION AND CHARACTERIZATION TECHNIQUES FOR ZERO-GRAVITY CLOUD PHYSICS EXPERIMENTS
7. AUTHOR(S)
Ulrich Katz
6. PERFORMING ORGANIZATION CODE
6. PERFORMING ORGANIZATION REPOR r
3. PERFORMING ORGANIZATION NAME AND ADDdESS
Desert Research Institute University of Nevada System Reno, Nevada
2. SPONSORING AGENCY NAME AN0 ADDRESS
lo. WORK UNIT, NO.
- M-368 11. CONTRACT OR GRANT NO.
NASP-32313 13. TYPE OF REPORT & PERIOD COVERE
Contractor Report National Aeronautics and Space Administration Washington, D.C. 20546
15. SUPPLEMENTARY NOTES
Marshall Technical Monitor: Robert E. Smith Final Report
16. ABSTRACT
14. SPONSORING AGENCY CODE
This report presents the results of an investigation of methods of particle generation and characterization with regard to their applicability for experiments requiring cloud condensation nuclei (CCN) of specified properties which were planned for a zero-gravity Atmospheric Cloud Physics Laboratory (ACPL) originally considered for flight aboard the Space Shuttle. The results of the study would be applicable to other low-g flights.
Since aerosol characterization is a prerequisite to assessing performance of particle generation equipment, one section of the report is devoted to the evaluation of techniques for characterizing aerosol particles. Another section contains a discussion of aerosol generation; the studies of atomizer and photolytic generators represent the major portion, including subsections on preparation of hydrosols (used with atomizers) and on the evaluation of a flight version of a GE atomizer. Conclusions and recommendations are summarized in the final section.
7: KEY WORDS 18. DISTRIBUTION STATEMENT
Particle generation' Unclassified - Unlimited Particle characterization Aerosols
Subject Category 47
9. SECURITY CLASSIF. (of thh -pat) 20. SECURITY CLASSI F. (of thh SNE.) 21. NO. OF PAGE.S 22. PRICE
Unclassified Unclassified 195 A09 .--- - .-.. .^ - . .-_-.
*‘orIll 3292 (KCV. lk?Cember 1912) For ula by Nathml Technical Information Sewice. Spri&~dd. vtia “lb’