study on thermal-fluid effect of thermal energy storage ...umpir.ump.edu.my/9260/1/study on...
TRANSCRIPT
Energy Procedia 68 ( 2015 ) 3 – 11
Available online at www.sciencedirect.com
ScienceDirect
1876-6102 © 2015 Published by Elsevier Ltd. This is an open access article under the CC BY-NC-ND license (http://creativecommons.org/licenses/by-nc-nd/4.0/).Peer-review under responsibility of Scientific Committee of ICSEEA 2014doi: 10.1016/j.egypro.2015.03.226
2nd International Conference on Sustainable Energy Engineering and Application, ICSEEA 2014
Study on thermal-fluid effect of thermal energy storage tank design in solar energy applications
Tanti Alia, Rosli Abu Bakara,*, Billy Anak Supa, Mohd Farid Zainudina, Gan Leong Minga
aFaculty of Mechanical Engineering, Universiti Malaysia Pahang. Pekan 26000, Malaysia
Abstract
The growth of technologies in energy storage has urged new proficiencies and application areas. Energy storage technologies can be varied from an electric battery to a flywheel that can results in deliverable power based on the application. These variat ions are a challenge to design a reliable and efficient energy storage system. The purpose of this paper is to study the thermal-fluid effect of thermal energy storage (TES) tank design. A three-dimensional modelling of TES tank was carried out using commercial computational fluid dynamics (CFD) code by differentiate the heat source temperature and heat transfer fluid (HTF) velocity. The results predict the thermal-fluid behaviour of TES tank. Since the HTF used is water, the expected outcome of the outlet temperature is in the range of 40 to 60°C.The outlet temperature of the TES tank is compared with the experimental data. It can conclude the TES tank thermal-fluid behaviour is affected by heat source temperature and velocity HTF. The results can be further used to design dependable TES system for green energy application © 2015 The Authors. Published by Elsevier B.V. Peer-review under responsibility of Scientific Committee of ICSEEA 2014.
Keywords: thermal energy storage; solar energy; thermal-fluid effect
1. Introduction
Energy sources can be divided into two categories; renewable energy and non-renewable. Since the fossil fuels world supply decreased, humans are keen towards green energy which is environmental friendly and affordable in
* Corresponding author. Tel.: +60-12-983 2631; fax: +60-9-424 2202.
E-mail address: [email protected]
© 2015 Published by Elsevier Ltd. This is an open access article under the CC BY-NC-ND license (http://creativecommons.org/licenses/by-nc-nd/4.0/).Peer-review under responsibility of Scientific Committee of ICSEEA 2014
4 Tanti Ali et al. / Energy Procedia 68 ( 2015 ) 3 – 11
order to meet growing energy demands. Also, to attain the satisfaction of clean energy supplies is a significant societal challenge [1]. Thermal storage system is an energy saving device for later usage. The system is usually in a special designed tank and employed when encounter the inconsistency of energy supply and demand [2]. In solar energy development, an energy storage system is at optimal capacity not only considered economic and safe but it also depends on the loads of nature expected on the process, the solar radiation availability expected time dependence, the process of reliability, the manner of additional energy is supplied, the size of the solar thermal power system or solar-electric generator and the allowable capital cost allocated to storage [3].
2. TES description
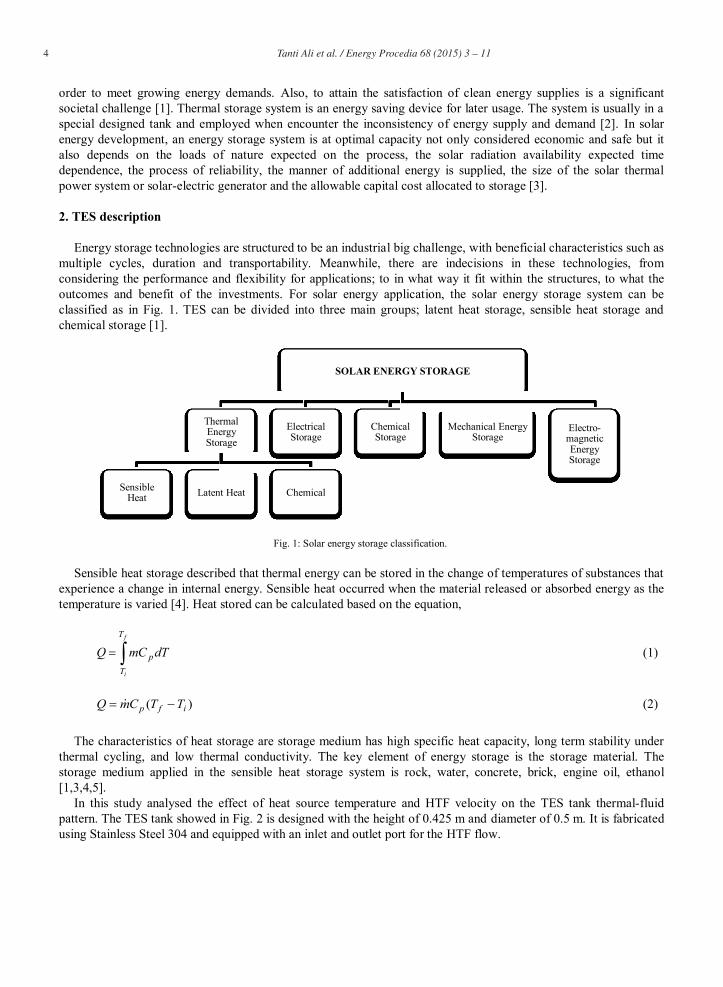
Energy storage technologies are structured to be an industrial big challenge, with beneficial characteristics such as multiple cycles, duration and transportability. Meanwhile, there are indecisions in these technologies, from considering the performance and flexibility for applications; to in what way it fit within the structures, to what the outcomes and benefit of the investments. For solar energy application, the solar energy storage system can be classified as in Fig. 1. TES can be divided into three main groups; latent heat storage, sensible heat storage and chemical storage [1].
Fig. 1: Solar energy storage classification.
Sensible heat storage described that thermal energy can be stored in the change of temperatures of substances that experience a change in internal energy. Sensible heat occurred when the material released or absorbed energy as the temperature is varied [4]. Heat stored can be calculated based on the equation,
dTmCQf
i
T
Tp (1)
)( ifp TTCmQ (2)
The characteristics of heat storage are storage medium has high specific heat capacity, long term stability under thermal cycling, and low thermal conductivity. The key element of energy storage is the storage material. The storage medium applied in the sensible heat storage system is rock, water, concrete, brick, engine oil, ethanol [1,3,4,5].
In this study analysed the effect of heat source temperature and HTF velocity on the TES tank thermal-fluid pattern. The TES tank showed in Fig. 2 is designed with the height of 0.425 m and diameter of 0.5 m. It is fabricated using Stainless Steel 304 and equipped with an inlet and outlet port for the HTF flow.
SOLAR ENERGY STORAGE
Thermal Energy Storage
Sensible Heat Latent Heat Chemical
Electrical Storage
Chemical Storage
Mechanical Energy Storage
Electro-magnetic Energy Storage

Tanti Ali et al. / Energy Procedia 68 ( 2015 ) 3 – 11 5
Fig. 2: TES tank in hybrid solar thermal energy storing system.
3. CFD simulation
For the flow simulation, a commercial available CFD package is used. This CFD package will solve the fluid flow geometries using three main equations which are the formulations of mass, momentum and energy conservation laws for fluid flows. The equations are supplemented by the fluid state equations, defining the conditions of the fluid and empirical laws for the dependency of viscosity and thermal conductivity on other flow parameters [6].
The conservation laws for mass, angular momentum and energy in Cartesian coordinate system rotating with angular velocity about an axis passing through the coordinate system’s origin can be written in the conservation forms as follows [6,7,8]:
0)( ii
uxt
(3)
3,2,1)()( iSxx
puuxt
ui
Rijij
jiji
j
i (4)
,))(( Hiij
iRiji
Rijijj
ji
i QuSxu
tpqu
xxHu
tH (5)
2
2uhH (6)
6 Tanti Ali et al. / Energy Procedia 68 ( 2015 ) 3 – 11
Following Newtonian fluids the viscous shear stress tensor is defined as:
k
kij
i
j
j
iij x
uxu
xu
u32 (7)
Following Bouss in eq. assumption, the Reynolds-stress tensor has the following from:
ijk
kij
i
j
j
it
Rij k
xu
xu
xu
u32
32 (8)
where
tl (9)
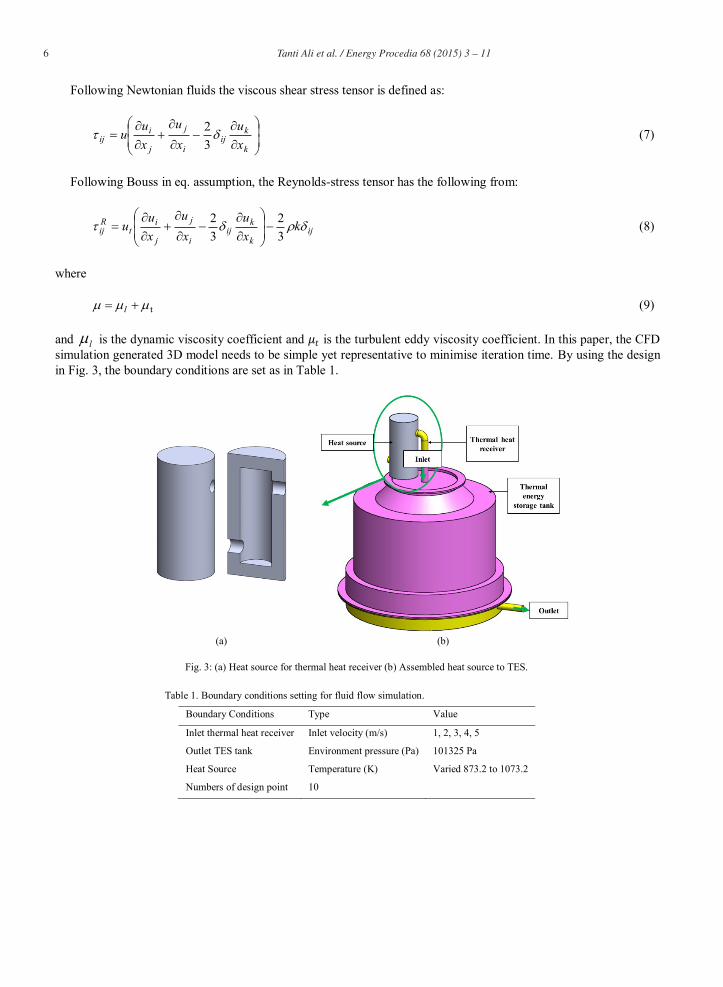
and l is the dynamic viscosity coefficient and is the turbulent eddy viscosity coefficient. In this paper, the CFD simulation generated 3D model needs to be simple yet representative to minimise iteration time. By using the design in Fig. 3, the boundary conditions are set as in Table 1.
(a) (b)
Fig. 3: (a) Heat source for thermal heat receiver (b) Assembled heat source to TES.
Table 1. Boundary conditions setting for fluid flow simulation.
Boundary Conditions Type Value
Inlet thermal heat receiver Inlet velocity (m/s) 1, 2, 3, 4, 5
Outlet TES tank Environment pressure (Pa) 101325 Pa
Heat Source Temperature (K) Varied 873.2 to 1073.2
Numbers of design point 10
Tanti Ali et al. / Energy Procedia 68 ( 2015 ) 3 – 11 7
Temperature (K)
0 100 200 300 400 500
Dyn
amic
vis
cosi
ty (P
a.s)
0
200
400
600
800
1000
1200
Den
sity
(kg/
m3 )
0.0000
0.0002
0.0004
0.0006
0.0008
0.0010
0.0012
0.0014
0.0016
0.0018
0.0020Density (kg/m3) Dynamic viscosity (Pa.s)
(a) Temperature (K)
0 100 200 300 400 500
The
rmal
con
duct
ivity
(W/(m
.K))
0
1000
2000
3000
4000
5000
6000
Spec
ific
heat
(J/(k
g.K
))
0.0
0.2
0.4
0.6
0.8Specific heat (J/(kg.K)) Thermal conductivity (W/(m.K))
(b)
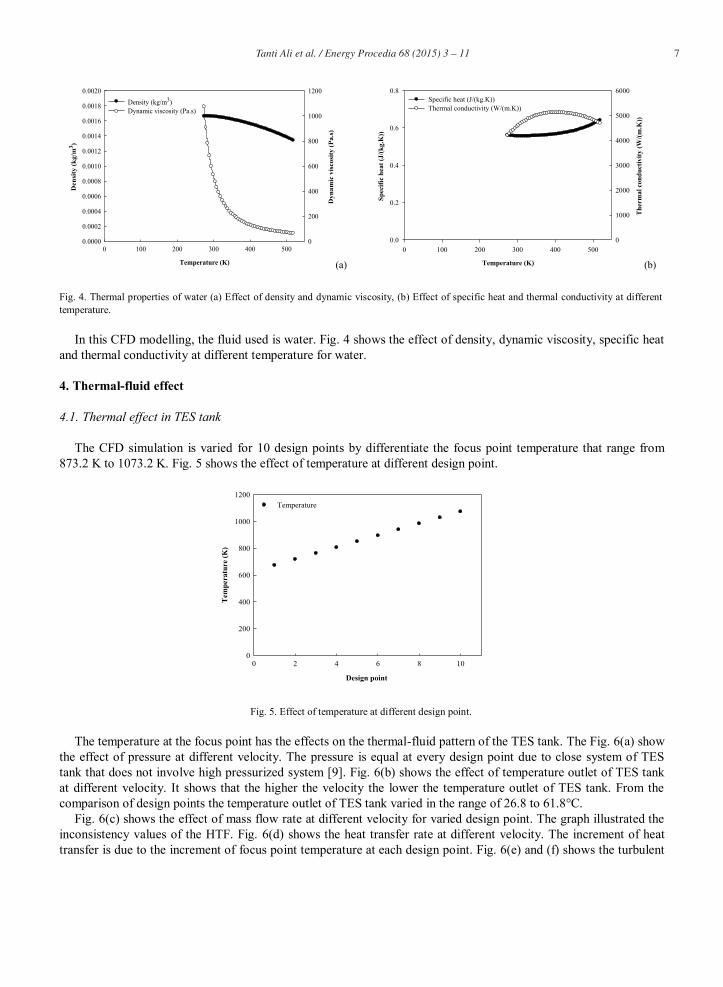
Fig. 4. Thermal properties of water (a) Effect of density and dynamic viscosity, (b) Effect of specific heat and thermal conductivity at different temperature.
In this CFD modelling, the fluid used is water. Fig. 4 shows the effect of density, dynamic viscosity, specific heat and thermal conductivity at different temperature for water.
4. Thermal-fluid effect
4.1. Thermal effect in TES tank
The CFD simulation is varied for 10 design points by differentiate the focus point temperature that range from 873.2 K to 1073.2 K. Fig. 5 shows the effect of temperature at different design point.
Design point
0 2 4 6 8 10
Tem
pera
ture
(K)
0
200
400
600
800
1000
1200Temperature
Fig. 5. Effect of temperature at different design point.
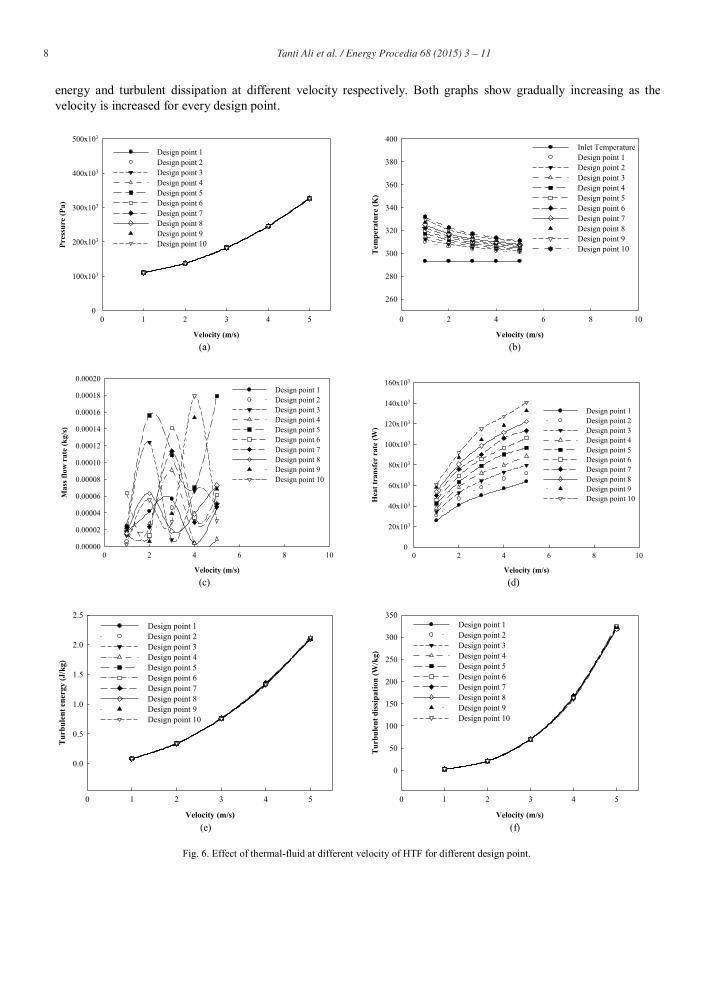
The temperature at the focus point has the effects on the thermal-fluid pattern of the TES tank. The Fig. 6(a) show the effect of pressure at different velocity. The pressure is equal at every design point due to close system of TES tank that does not involve high pressurized system [9]. Fig. 6(b) shows the effect of temperature outlet of TES tank at different velocity. It shows that the higher the velocity the lower the temperature outlet of TES tank. From the comparison of design points the temperature outlet of TES tank varied in the range of 26.8 to 61.8°C.
Fig. 6(c) shows the effect of mass flow rate at different velocity for varied design point. The graph illustrated the inconsistency values of the HTF. Fig. 6(d) shows the heat transfer rate at different velocity. The increment of heat transfer is due to the increment of focus point temperature at each design point. Fig. 6(e) and (f) shows the turbulent
8 Tanti Ali et al. / Energy Procedia 68 ( 2015 ) 3 – 11
energy and turbulent dissipation at different velocity respectively. Both graphs show gradually increasing as the velocity is increased for every design point.
Velocity (m/s)
0 1 2 3 4 5
Pres
sure
(Pa)
0
100x103
200x103
300x103
400x103
500x103
Design point 1 Design point 2 Design point 3 Design point 4 Design point 5 Design point 6 Design point 7 Design point 8 Design point 9 Design point 10
(a) Velocity (m/s)
0 2 4 6 8 10
Tem
pera
ture
(K)
260
280
300
320
340
360
380
400Inlet Temperature Design point 1 Design point 2 Design point 3 Design point 4 Design point 5 Design point 6 Design point 7 Design point 8 Design point 9 Design point 10
(b)
Velocity (m/s)
0 2 4 6 8 10
Mas
s flo
w r
ate
(kg/
s)
0.00000
0.00002
0.00004
0.00006
0.00008
0.00010
0.00012
0.00014
0.00016
0.00018
0.00020Design point 1 Design point 2 Design point 3 Design point 4 Design point 5 Design point 6 Design point 7 Design point 8 Design point 9 Design point 10
(c)
Velocity (m/s)
0 2 4 6 8 10
Hea
t tra
nsfe
r ra
te (W
)
0
20x103
40x103
60x103
80x103
100x103
120x103
140x103
160x103
Design point 1 Design point 2 Design point 3 Design point 4 Design point 5 Design point 6 Design point 7 Design point 8 Design point 9 Design point 10
(d)
Velocity (m/s)
0 1 2 3 4 5
Tur
bule
nt e
nerg
y (J
/kg)
0.0
0.5
1.0
1.5
2.0
2.5Design point 1 Design point 2 Design point 3 Design point 4 Design point 5 Design point 6 Design point 7 Design point 8 Design point 9 Design point 10
(e) Velocity (m/s)
0 1 2 3 4 5
Tur
bule
nt d
issi
patio
n (W
/kg)
0
50
100
150
200
250
300
350Design point 1 Design point 2 Design point 3 Design point 4 Design point 5 Design point 6 Design point 7 Design point 8 Design point 9 Design point 10
(f)
Fig. 6. Effect of thermal-fluid at different velocity of HTF for different design point.
Tanti Ali et al. / Energy Procedia 68 ( 2015 ) 3 – 11 9
4.2. Fluid flow effect in TES tank
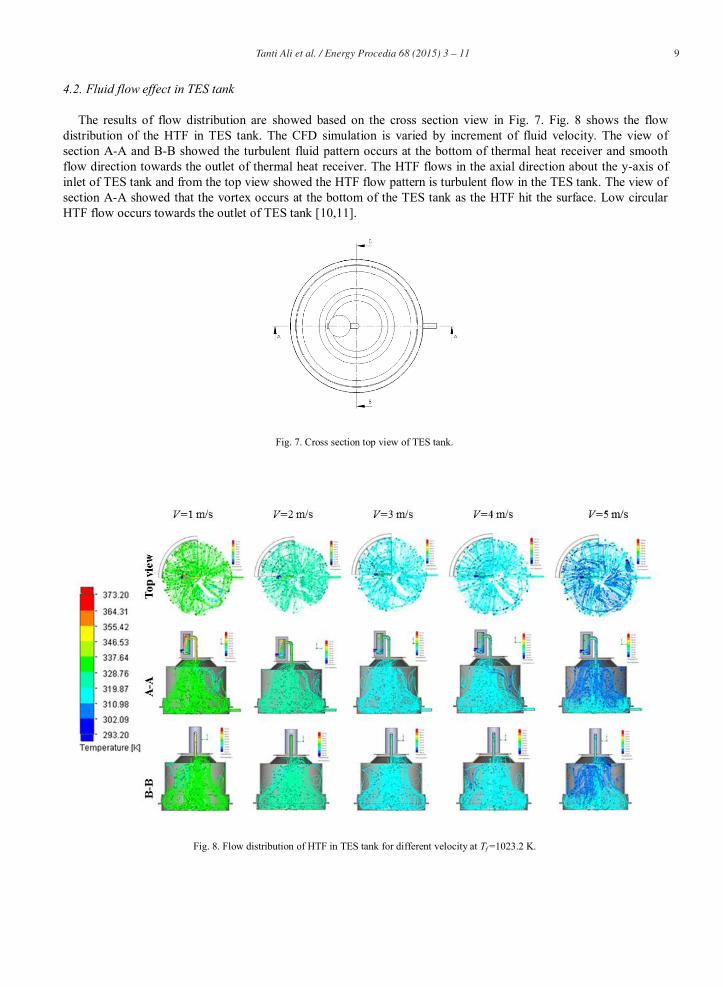
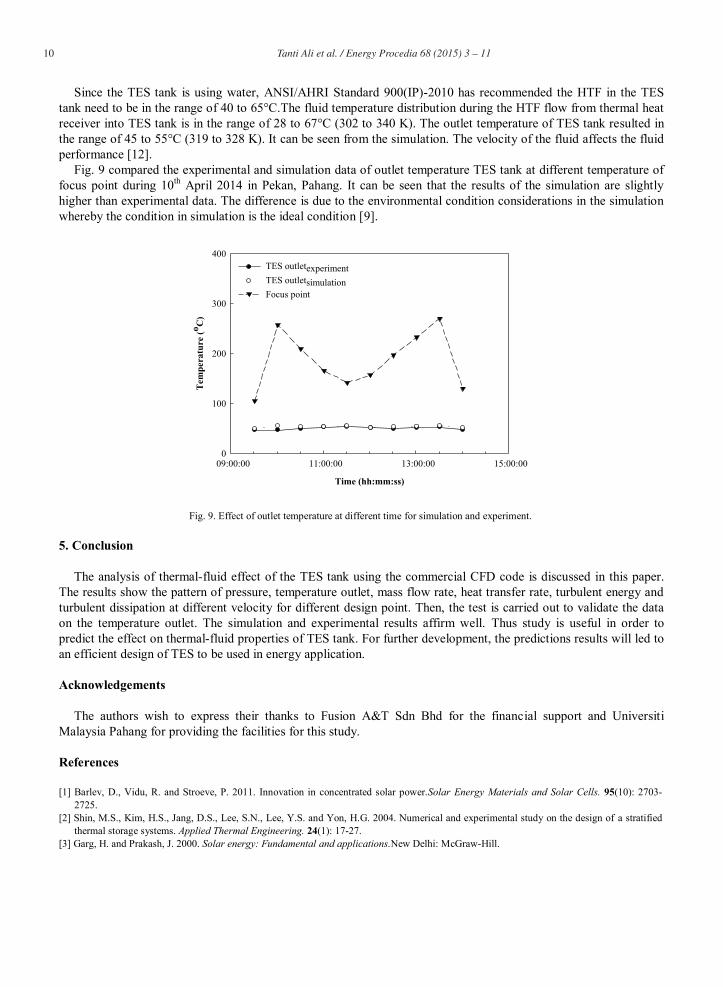
The results of flow distribution are showed based on the cross section view in Fig. 7. Fig. 8 shows the flow distribution of the HTF in TES tank. The CFD simulation is varied by increment of fluid velocity. The view of section A-A and B-B showed the turbulent fluid pattern occurs at the bottom of thermal heat receiver and smooth flow direction towards the outlet of thermal heat receiver. The HTF flows in the axial direction about the y-axis of inlet of TES tank and from the top view showed the HTF flow pattern is turbulent flow in the TES tank. The view of section A-A showed that the vortex occurs at the bottom of the TES tank as the HTF hit the surface. Low circular HTF flow occurs towards the outlet of TES tank [10,11].
Fig. 7. Cross section top view of TES tank.
Fig. 8. Flow distribution of HTF in TES tank for different velocity at Tf =1023.2 K.
10 Tanti Ali et al. / Energy Procedia 68 ( 2015 ) 3 – 11
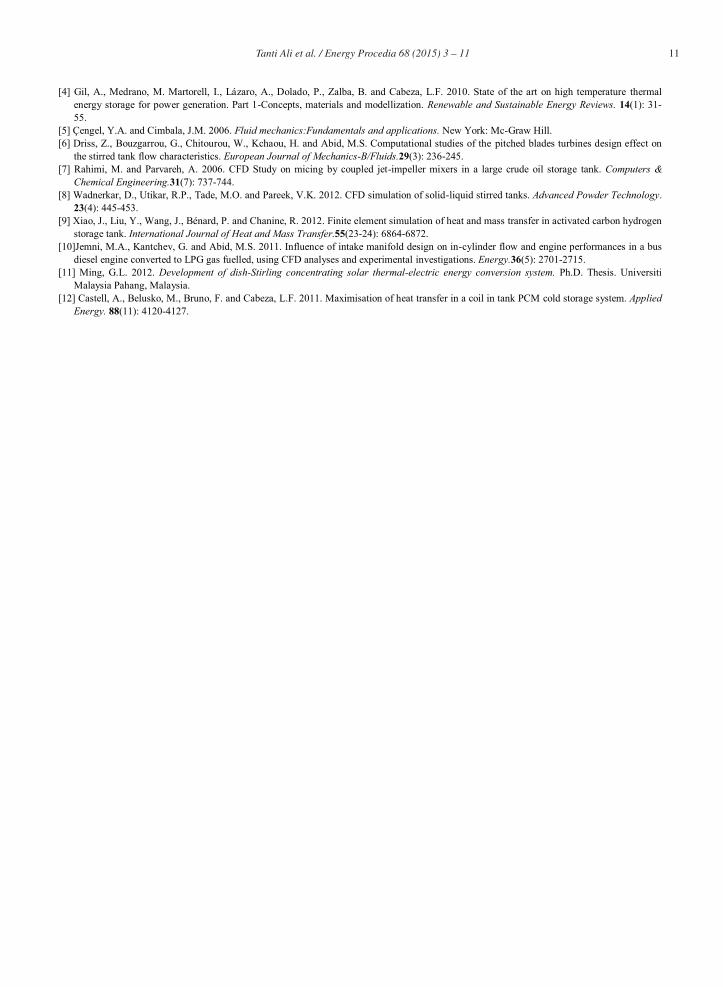
Since the TES tank is using water, ANSI/AHRI Standard 900(IP)-2010 has recommended the HTF in the TES tank need to be in the range of 40 to 65°C.The fluid temperature distribution during the HTF flow from thermal heat receiver into TES tank is in the range of 28 to 67°C (302 to 340 K). The outlet temperature of TES tank resulted in the range of 45 to 55°C (319 to 328 K). It can be seen from the simulation. The velocity of the fluid affects the fluid performance [12].
Fig. 9 compared the experimental and simulation data of outlet temperature TES tank at different temperature of focus point during 10th April 2014 in Pekan, Pahang. It can be seen that the results of the simulation are slightly higher than experimental data. The difference is due to the environmental condition considerations in the simulation whereby the condition in simulation is the ideal condition [9].
Time (hh:mm:ss)
09:00:00 11:00:00 13:00:00 15:00:00
Tem
pera
ture
(o C)
0
100
200
300
400TES outletexperimentTES outletsimulationFocus point
Fig. 9. Effect of outlet temperature at different time for simulation and experiment.
5. Conclusion
The analysis of thermal-fluid effect of the TES tank using the commercial CFD code is discussed in this paper. The results show the pattern of pressure, temperature outlet, mass flow rate, heat transfer rate, turbulent energy and turbulent dissipation at different velocity for different design point. Then, the test is carried out to validate the data on the temperature outlet. The simulation and experimental results affirm well. Thus study is useful in order to predict the effect on thermal-fluid properties of TES tank. For further development, the predictions results will led to an efficient design of TES to be used in energy application.
Acknowledgements
The authors wish to express their thanks to Fusion A&T Sdn Bhd for the financial support and Universiti Malaysia Pahang for providing the facilities for this study.
References
[1] Barlev, D., Vidu, R. and Stroeve, P. 2011. Innovation in concentrated solar power.Solar Energy Materials and Solar Cells. 95(10): 2703-2725.
[2] Shin, M.S., Kim, H.S., Jang, D.S., Lee, S.N., Lee, Y.S. and Yon, H.G. 2004. Numerical and experimental study on the design of a stratified thermal storage systems. Applied Thermal Engineering. 24(1): 17-27.
[3] Garg, H. and Prakash, J. 2000. Solar energy: Fundamental and applications.New Delhi: McGraw-Hill.
Tanti Ali et al. / Energy Procedia 68 ( 2015 ) 3 – 11 11
[4] Gil, A., Medrano, M. Martorell, I., Lázaro, A., Dolado, P., Zalba, B. and Cabeza, L.F. 2010. State of the art on high temperature thermal energy storage for power generation. Part 1-Concepts, materials and modellization. Renewable and Sustainable Energy Reviews. 14(1): 31-55.
[5] Çengel, Y.A. and Cimbala, J.M. 2006. Fluid mechanics:Fundamentals and applications. New York: Mc-Graw Hill. [6] Driss, Z., Bouzgarrou, G., Chitourou, W., Kchaou, H. and Abid, M.S. Computational studies of the pitched blades turbines design effect on
the stirred tank flow characteristics. European Journal of Mechanics-B/Fluids.29(3): 236-245. [7] Rahimi, M. and Parvareh, A. 2006. CFD Study on micing by coupled jet-impeller mixers in a large crude oil storage tank. Computers &
Chemical Engineering.31(7): 737-744. [8] Wadnerkar, D., Utikar, R.P., Tade, M.O. and Pareek, V.K. 2012. CFD simulation of solid-liquid stirred tanks. Advanced Powder Technology.
23(4): 445-453. [9] Xiao, J., Liu, Y., Wang, J., Bénard, P. and Chanine, R. 2012. Finite element simulation of heat and mass transfer in activated carbon hydrogen
storage tank. International Journal of Heat and Mass Transfer.55(23-24): 6864-6872. [10]Jemni, M.A., Kantchev, G. and Abid, M.S. 2011. Influence of intake manifold design on in-cylinder flow and engine performances in a bus
diesel engine converted to LPG gas fuelled, using CFD analyses and experimental investigations. Energy.36(5): 2701-2715. [11] Ming, G.L. 2012. Development of dish-Stirling concentrating solar thermal-electric energy conversion system. Ph.D. Thesis. Universiti
Malaysia Pahang, Malaysia. [12] Castell, A., Belusko, M., Bruno, F. and Cabeza, L.F. 2011. Maximisation of heat transfer in a coil in tank PCM cold storage system. Applied
Energy. 88(11): 4120-4127.