study on lean, quality implementation and waste management in textile mill
TRANSCRIPT
Quality Circle Project

• Universal Textile Mills / Jaipuria Silk Mills Pvt Ltd
44 Gudahhati Main Road, Neralur Post, Bengaluru 562107
• www.universaltextile.com
CONTENTS
• About The Company.
• Basic Processes.
• Existing problems.
• Problem Statement.
• Problem Definition,
Analysis &
Probable Solution.
• Future Course of Action

ABOUT THE COMPANY
• Jaipuria Silks has been associated with silks for around 40 years.
• Director: Abhay Jaipuria.
• Their product are silks and linen material. They do all processing in-house: printing, dyeing, washing, ironing.
• They are working with around 30 countries.
• Major part of their products are exported to Europe and US.
• Around 30% of raw material are produced in house while rest are imported from China.
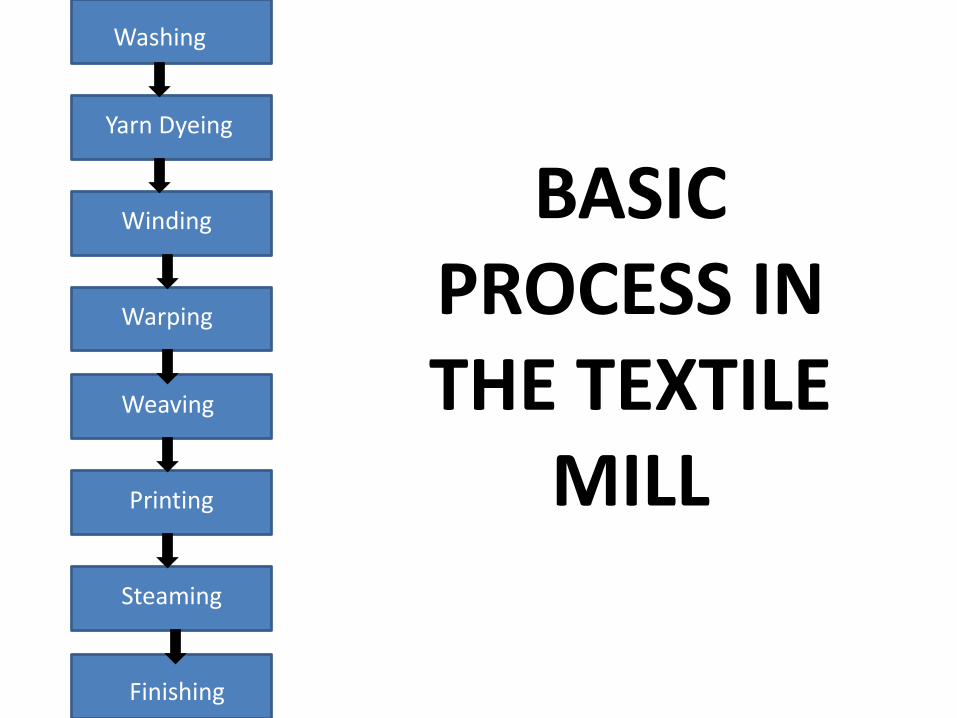
BASIC PROCESS IN THE TEXTILE
MILL
Washing
Yarn Dyeing
Winding
Warping
Weaving
Printing
Steaming
Finishing
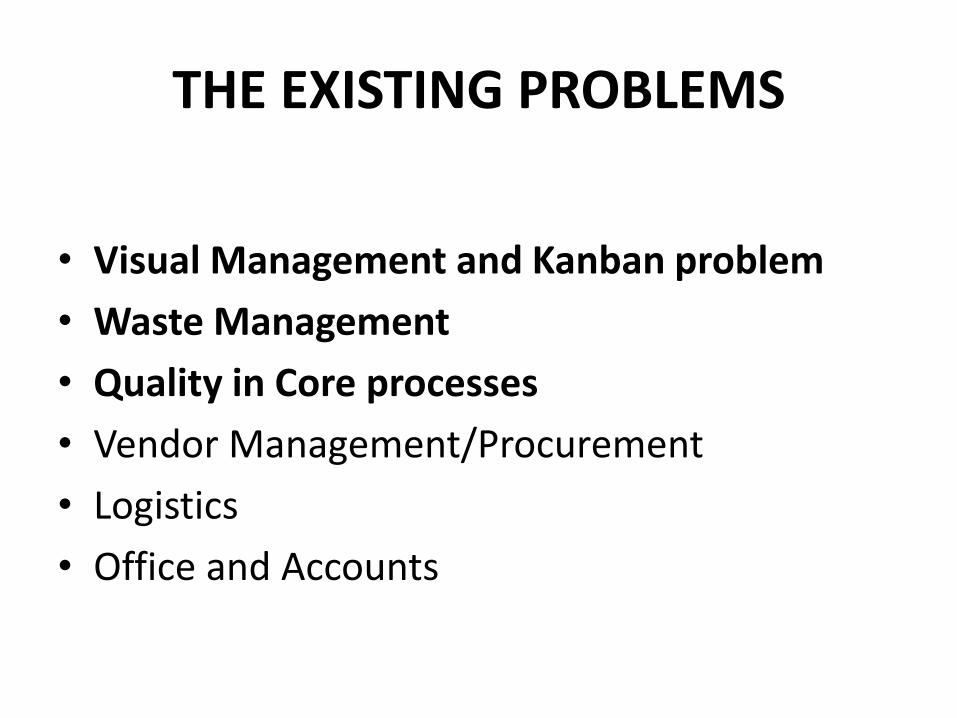
THE EXISTING PROBLEMS
• Visual Management and Kanban problem
• Waste Management
• Quality in Core processes
• Vendor Management/Procurement
• Logistics
• Office and Accounts
FACTORS CONSIDERED FOR FINAL SELECTION OF PROBLEM
• Cost involved
• Management’s Viewpoint on issues
• Time factor

PROBLEM STATEMENTUniversal Textile Mill is facing problems in the areas of
Visual Management, Waste Management and Quality Aspects ultimately resulting in increased costs
and reduced profits.

1. VISUAL MANAGEMENT

ISSUES
1. Absence of proper identification and storage of materials.


PROBABLE SOLUTIONS
• Employing location labeling for identification and storage.
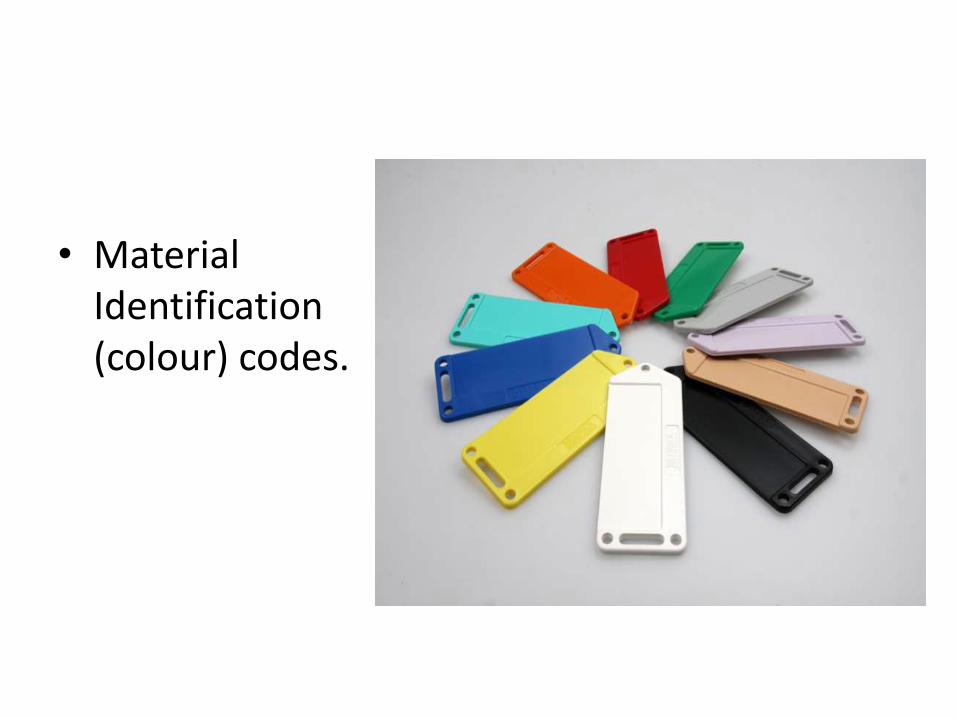
• Material Identification (colour) codes.

• Floor marking tapes showing walkways and restricted areas.
• Floor marking tapes showing specificstorage areas.
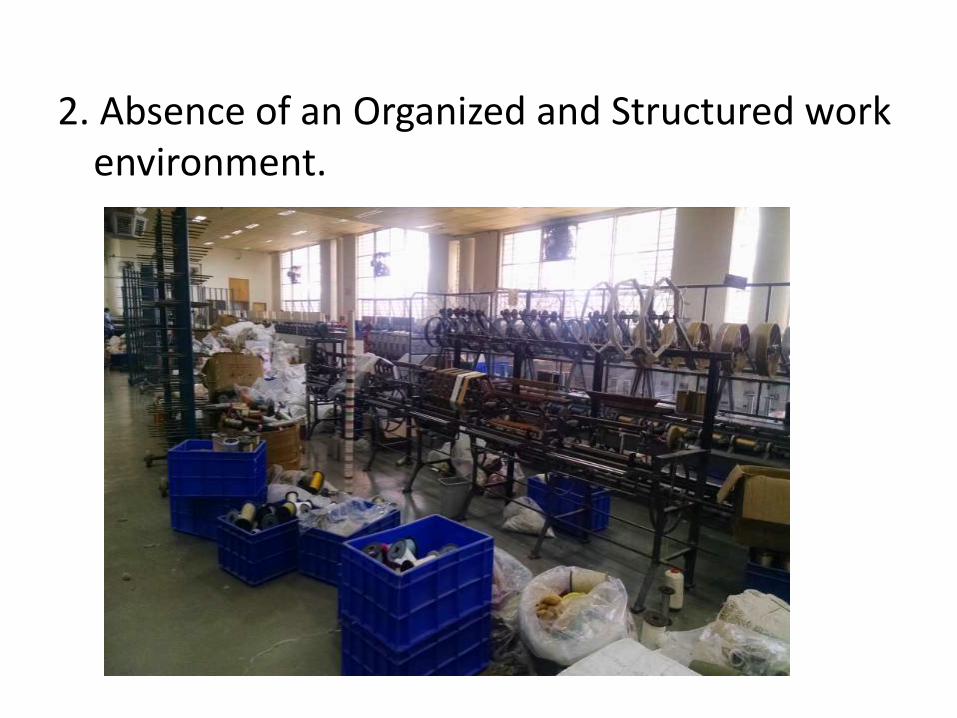
2. Absence of an Organized and Structured work environment.

PROBABLE SOLUTIONS
• Systematic Cleaning and Painting Schedule.
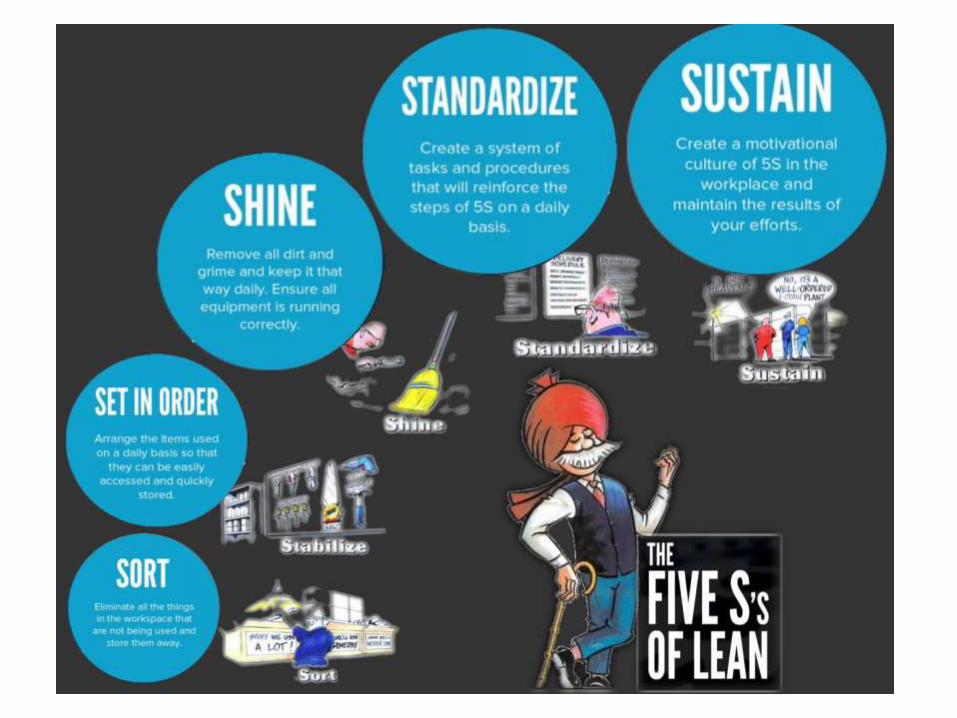
• Introduction of 5S.

IN ADDITION, THE FOLLOWING CAN BE CONSIDERED.
• Visual Displays:
– Recognizing performances of employees.

• CAPA for injuries.
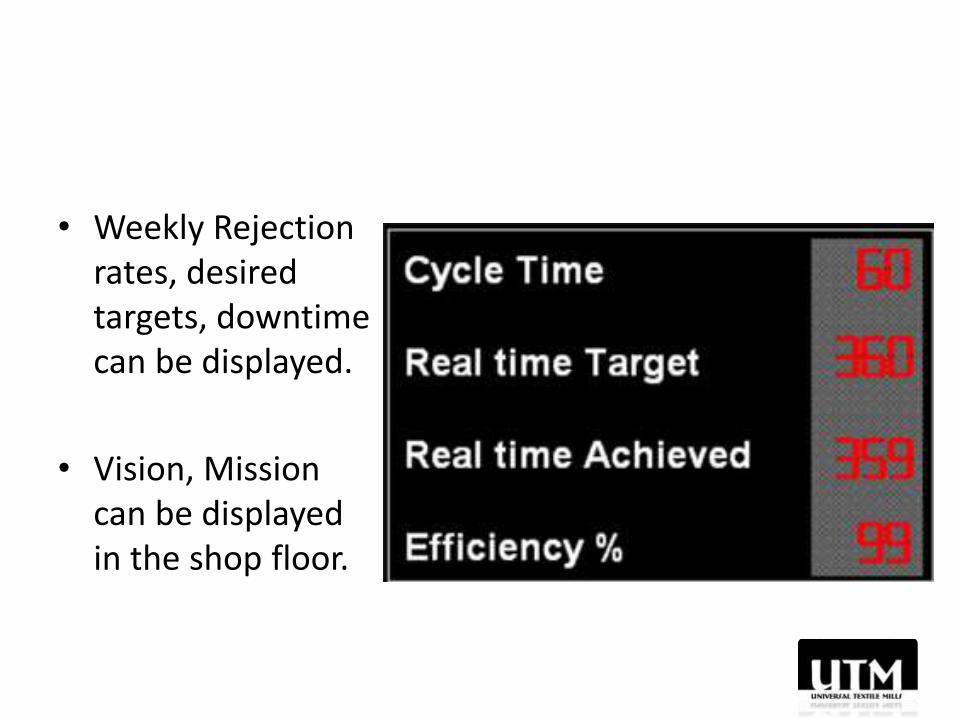
• Weekly Rejection rates, desired targets, downtime can be displayed.
• Vision, Mission can be displayed in the shop floor.

• Visual Control:
– Signs such as Warning, Danger signs, Safety signs, etc.
2. WASTE MANAGEMENT
Textile Manufacturing
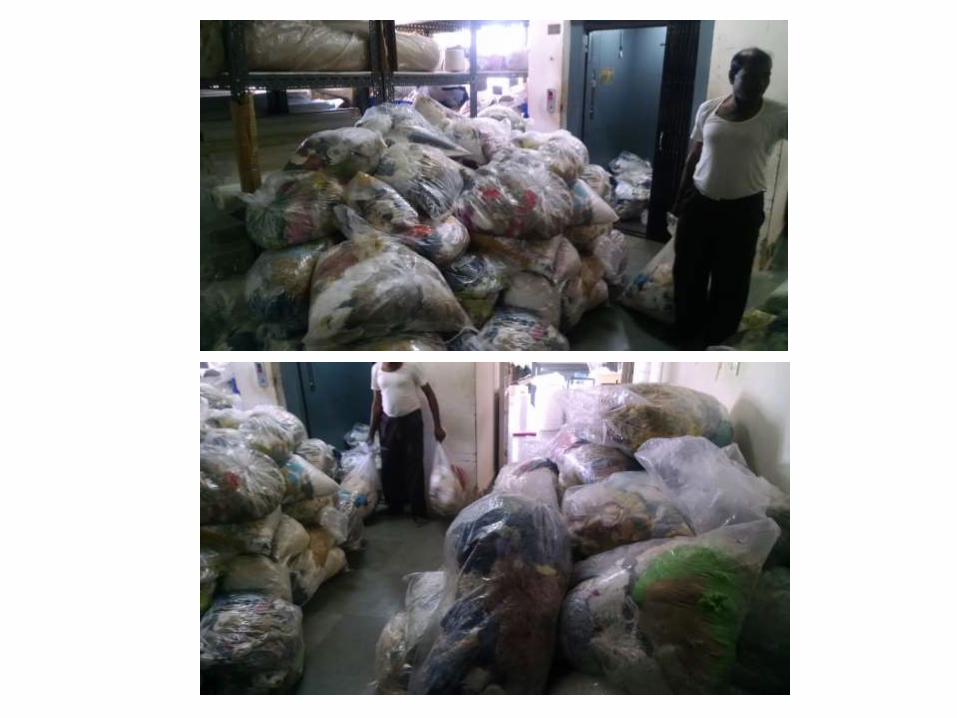
CURRENT SITUATION
• The products are exported to Europe and America. As a result, products which do not conform to the desired specifications are rejected.
• This results in rejection of even slightly defected products.
• The scrap is sold based on the weight.
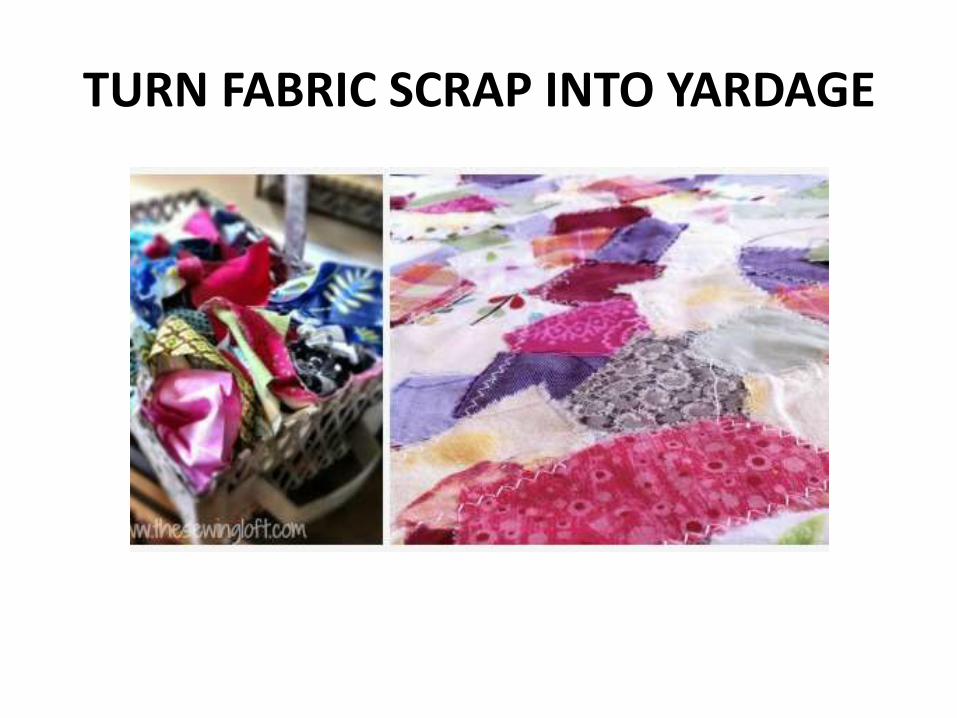
TURN FABRIC SCRAP INTO YARDAGE
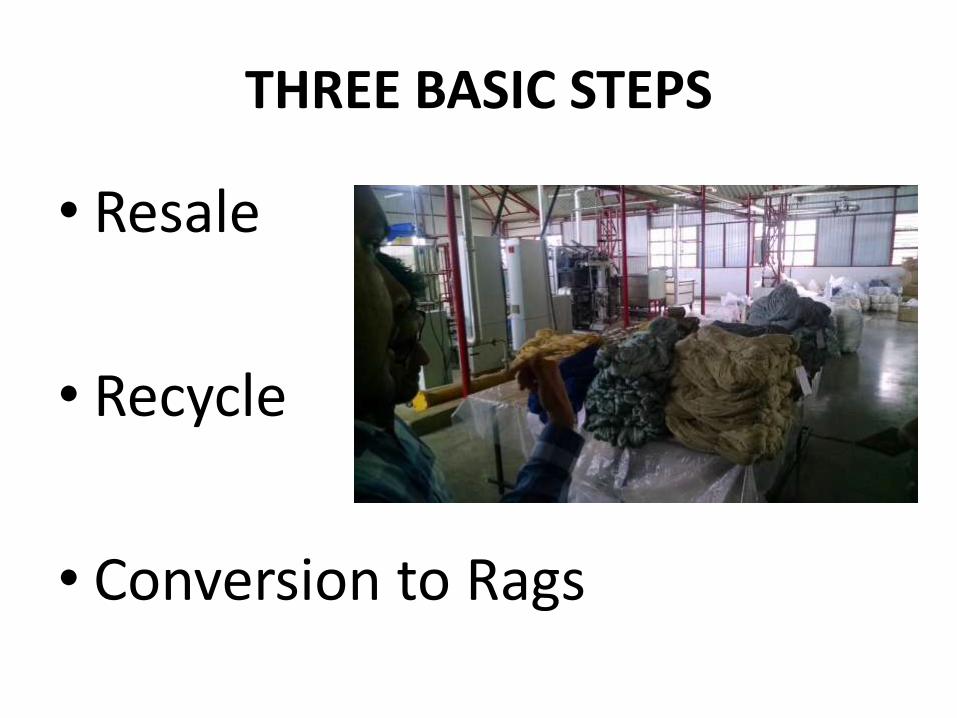
THREE BASIC STEPS
• Resale
• Recycle
• Conversion to Rags

GENERAL OBJECTIVES OF REDUCING TEXTILE CUTTING WASTE
• Optimum, uniform width
• Maximum practical length
• Minimum defects
• Protective packaging, with clean, increased ends at beginning and end of roll
• Minimum shade variation
TO STUDY..
• Reduce waste/costs associated with textile cuttings
• Reduce waste/costs associated with common recyclables (paper, plastic, etc.) and generate revenue
• Reduce waste/costs associated with dyes and chemicals

3. QUALITY

QUALITY ASPECTS IN DIFFERENT PROCESSES
A. Quality issues in the digital textile printing.
B. Quality issues in the digital jacquard looms for yarn weaving.

A. DIGITAL TEXTILE PRINTING
• This is the technology that consists of printing your designs on fabric, directly from your computer, with no other additional step.

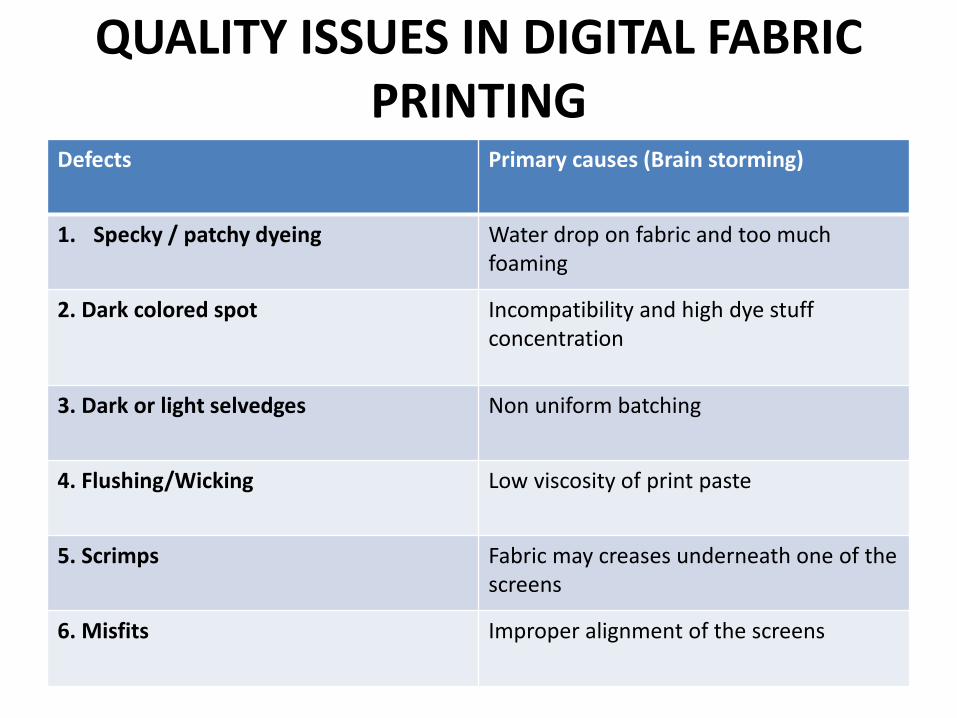
QUALITY ISSUES IN DIGITAL FABRIC PRINTING
Defects Primary causes (Brain storming)
1. Specky / patchy dyeing Water drop on fabric and too much foaming
2. Dark colored spot Incompatibility and high dye stuff concentration
3. Dark or light selvedges Non uniform batching
4. Flushing/Wicking Low viscosity of print paste
5. Scrimps Fabric may creases underneath one of the screens
6. Misfits Improper alignment of the screens

MEASURING DEFECTS USING CHECK SHEET TOOL
Defect Types/
Event Occurrence
Dates
TOTALSunday Monday Tuesday Wednesday Thursday Friday Saturday
Specky / patchy dyeing 11 16 6 15 5 24 6 83
Dark coloured spot 2 5 1 2 1 11
Dark or light selvedges 3 8 1 9 21
Scrimps 1 6 1 8
Misfits 1 1 1 4 7
Miscellaneous 2 1 1 4
Flushing/Wicking/Color 8 19 10 5 11 53
Colour out 2 1 3
Machine Stop 1 1
TOTAL 25 47 20 28 10 30 31 191
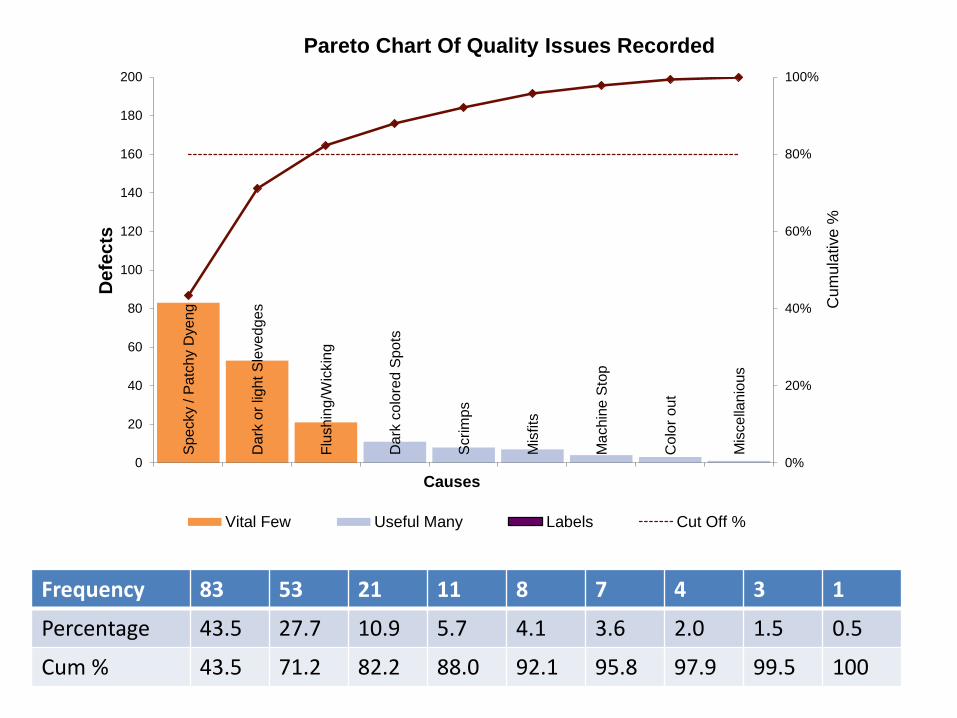
Frequency 83 53 21 11 8 7 4 3 1
Percentage 43.5 27.7 10.9 5.7 4.1 3.6 2.0 1.5 0.5
Cum % 43.5 71.2 82.2 88.0 92.1 95.8 97.9 99.5 100
Sp
ecky / P
atc
hy D
ye
ng
Da
rk o
r lig
ht
Sle
ve
dg
es
Flu
sh
ing
/Wic
kin
g
Da
rk c
olo
red
Sp
ots
Scrim
ps
Mis
fits
Ma
chin
e S
top
Co
lor
out
Mis
ce
llanio
us
0%
20%
40%
60%
80%
100%
0
20
40
60
80
100
120
140
160
180
200
Cu
mu
lative
%
Defe
cts
Causes
Pareto Chart Of Quality Issues Recorded
Vital Few Useful Many Labels Cut Off % [42]
• From Pareto Analysis it was observed that “ 71.2% of quality issues were caused due to Specky / patchy dyeing & Flushing/Wicking”
• So these 2 issues will be considered for further analysis
B. JACQUARD WEAVING
• Weaving is done by employing Jacquard looms which involves the programmed raising of each warp thread over the other depending on the desired pattern.

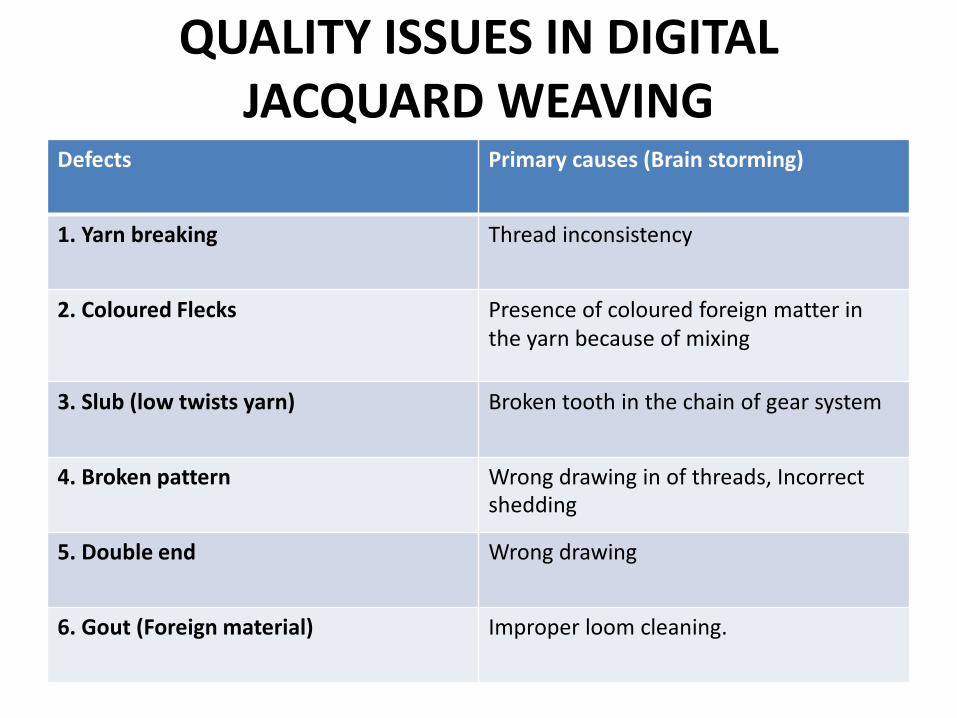
QUALITY ISSUES IN DIGITAL JACQUARD WEAVING
Defects Primary causes (Brain storming)
1. Yarn breaking Thread inconsistency
2. Coloured Flecks Presence of coloured foreign matter in the yarn because of mixing
3. Slub (low twists yarn) Broken tooth in the chain of gear system
4. Broken pattern Wrong drawing in of threads, Incorrect shedding
5. Double end Wrong drawing
6. Gout (Foreign material) Improper loom cleaning.

MEASURING DEFECTS USING CHECK SHEET TOOL
Defect Types/
Event Occurrence
Dates
TOTALSunday Monday Tuesday Wednesday Thursday Friday Saturday
Loose Threads
1 1 2 2 6
Coloured Flecks
2 2
Slub (low twists yarn)
6 5 3 9 4 7 34
Broken pattern
2 3 4 7 16
Double end
1 1
Gout (Foreign
material)4 6 9 4 2 25
Yarn breaking
2 1 1 4
Miscellaneous
1 1 2
Hole/Cut/Tear
1 1
TOTAL 15 12 15 6 19 12 12 91
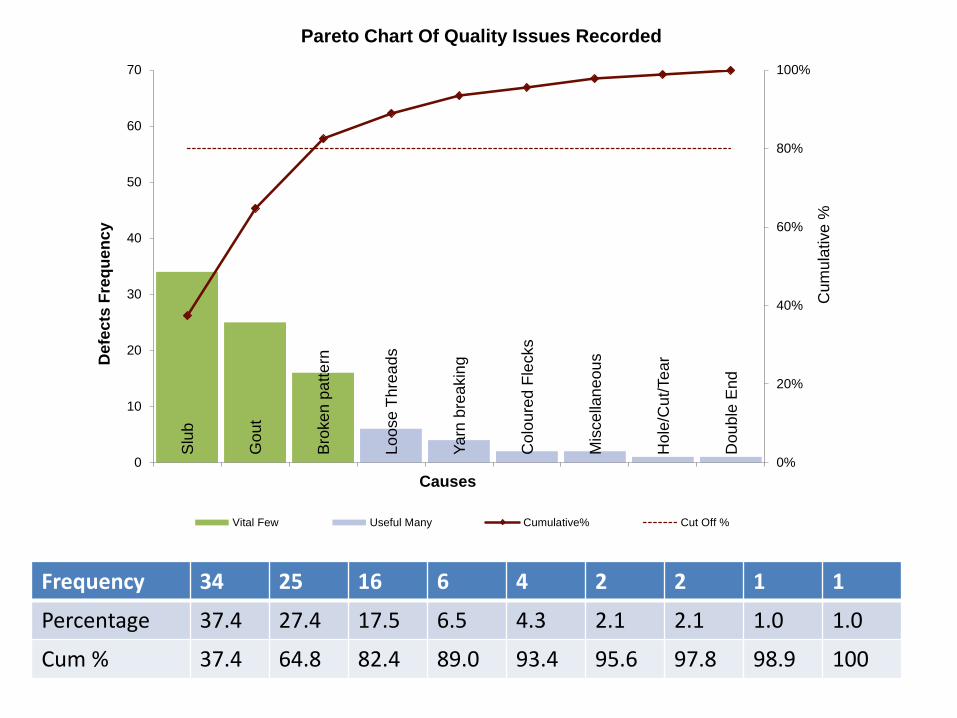
Frequency 34 25 16 6 4 2 2 1 1
Percentage 37.4 27.4 17.5 6.5 4.3 2.1 2.1 1.0 1.0
Cum % 37.4 64.8 82.4 89.0 93.4 95.6 97.8 98.9 100
Slu
b
Go
ut
Bro
ke
n p
att
ern
Lo
ose
Th
rea
ds
Ya
rn b
rea
kin
g
Colo
ure
d F
lecks
Mis
cella
ne
ou
s
Hole
/Cu
t/Te
ar
Dou
ble
En
d
0%
20%
40%
60%
80%
100%
0
10
20
30
40
50
60
70
Cum
ula
tive
%
Defe
cts
Fre
qu
en
cy
Causes
Pareto Chart Of Quality Issues Recorded
Vital Few Useful Many Cumulative% Cut Off % [42]
• From Pareto Analysis it was observed that “ 78.5% of quality issues were caused due to Slub, Gout & Brocken pattern”
• So these 3 issues will be considered for further analysis


STEPS
DONE Measuring the number of different defects over a period of
time. Using the Pareto analysis (80-20 concept) for finding the
most frequently occuring defects.
TO DO
• Then trying to find out the probable causes for those defects using Why-why analysis and Fish Bone diagram.
• Finally finding the pursuable causes and eliminating them in order to remove the overall problem.

FUTURE COURSE OF ACTION
• Generation of alternatives
• Choose the most feasible solution
• Evaluation of suggestions in terms of • Cost of implementation
• Savings
• Impact on quality
• Implementation