study on global natural gas prices to end-usersp global... · the largest producing regions are...
TRANSCRIPT
June 2019
www.platts.com CUSTOM ANALYTICS
STUDY ON GLOBAL NATURAL GAS PRICES TO END-USERSFOR
AUSTRALIAN COMPETITION & CONSUMER COMMISSION
John McManusJebsen Seo
CUSTOM ANALYTICS REPORT
JUNE 2019
© 2018 S&P Global Platts, a division of S&P Global Inc. All rights reserved. 2HAVE A SPECIFIC QUESTION ON COMMODITIES?
CONTACT CUSTOM ANALYTICS AT [email protected]
CONTENTS
EXECUTIVE SUMMARY ……………………………………………………………… 3
INTRODUCTION ……………………………………………………………… 5
COUNTRY SPECIFIC
North America ……………………………………………………………… 8
Europe ……………………………………………………………… 11
Latin America & Middle East ……………………………………………………………… 16
Asia ……………………………………………………………… 17
SIMILARITIES & DIFFERENCESTO EASTERN AUSTRALIA ……………………………………………………………… 21
CONCLUSION ……………………………………………………………… 22
METHODOLOGY ……………………………………………………………… 23
DISCLAIMERS ……………………………………………………………… 24
CUSTOM ANALYTICS REPORT
JUNE 2019
© 2018 S&P Global Platts, a division of S&P Global Inc. All rights reserved. 3HAVE A SPECIFIC QUESTION ON COMMODITIES?
CONTACT CUSTOM ANALYTICS AT [email protected]
EXECUTIVE SUMMARY AND STUDY OVERVIEW
The countries in this study cover a wide range of pricing, supply/demand, and tax policies, ranging from countries like the UnitedStates which sees very low prices due to abundant supply and low tax rates to countries like Sweden which have very high end-userprices due to limited supply and exceptionally high tax rates. Comparing Eastern Australian natural gas markets to the countriesanalyzed in this study shows that natural gas prices paid by end users in Eastern Australia mirror those across much of WesternEurope.
While the natural gas market in Eastern Australia has its own production, domestic natural gas consumption must compete againstnatural gas volumes for export via multiple LNG export facilities. The competition between the LNG consumption and domesticconsumption markets in Eastern Australia is unlike many of the natural gas markets covered in this analysis and is unique.
MAIN PRICE DRIVERS
The two main factors impacting end-user delivered prices are access to diverse natural gas supply and country-specific tax policy.Countries with abundant and varied supply sources such as domestic production, pipeline imports, and LNG imports tend to see lowernatural gas prices than countries which are dependent on just one supply source. Additionally, tax policy plays a major role indelivered end-user prices of natural gas. In several of the high-tax countries, more than 50 percent of end-user prices came from taxcomponents.
Delivered industrial prices tend to track closely with wholesale or citygate prices in nearly all of the countries. These wholesale pricesin turn follow global price benchmarks, including Henry Hub in US, NBP/TTF in Europe, JKM in Asia, or the price of Dated Brent forlong-term LNG supply. Delivered industrial prices in this sector were generally in the range of 5-15 USD/MMBtu for most countries.Delivered residential prices were usually much higher than delivered industrial prices due to the additional distribution costs andhigher tax rates for residential end users. Residential prices were generally in the range of 8-30 USD/MMBtu across most countries inthis study. On the other hand, wholesale prices, which excludes operational and end-user distribution costs, were in the range of 3-10USD/MMBtu.
COMPARISONS TO EASTERN AUSTRALIA
The Eastern Australia natural gas market is unique when compared to many of the countries covered in this analysis – while there areseveral other net-exporting countries included in this analysis such as US, Canada, Denmark, and Malaysia, each of them have at leastone or two key differences with the Eastern Australia natural gas markets. When compared to US, Eastern Australia’s size of LNGexports in relation to total gas demand is much larger, the supply/demand balance after accounting for LNG exports is not asoversupplied, and the cost of gas production is higher. These differences are due to the shale oil and gas revolution in US where muchof its natural gas supply comes from associated gas from oil wells and is produced because of favorable shale oil drilling economics.
Although it is a net exporter, Eastern Australia shares similarities with many of the net importing countries. In Queensland, LNGliquefaction plants compete with domestic demand and prices are more similar to net-importing countries such as those in WesternEurope. In Western Europe, the reliance on pipeline imports from Russia and Northern Africa, and the reliance on LNG imports keepsprices higher in almost all of the Western European markets than in net exporting countries like the US and Canada which have moreproduction than they can consume locally.
On the other hand, Victoria’s distance from competing LNG export demand causes lower end-user prices in general closer to those inPeninsular Malaysia and UK.
Natural gas prices in the industrial sector across Eastern Australia range between an estimated 8-11 USD/MMBtu which is comparableto a number of countries in this study such as Malaysia (8 USD/MMBtu), the UK (9 USD/MMBtu), Portugal (9.50 USD/MMBtu), andDenmark (12 USD/MMBtu).
From a gas supply infrastructure and geographical perspective, China and Malaysia are comparable with Eastern Australia. Allcountries have domestic gas production that is far from their where their demand centers are, Eastern coastal cities for China and theWestern Peninsular for Malaysia. The key differences between Eastern Australia and these two countries are the state of pricingregulation and accessibility to the LNG markets via regasification terminals.
If Eastern Australia were to fully develop infrastructure connecting to all possible supply, she would mirror China which connectssupply from the Western states to the coastal regions and which also has regasification terminals along the coastal cities. However,this may not be feasible for Eastern Australia being a natural net exporter of gas.
Natural gas prices in the residential sector across Eastern Australia range between 15 USD/MMBtu in Victoria to as high as 30USD/MMBtu in Queensland. The lower residential price range seen in Victoria is comparable to the US (12 USD/MMBtu) and UK (17USD/MMBtu). Both of these countries have low tax rates on residential natural gas consumption as well as readily available access tonatural gas supply, similar to Victoria. The higher residential prices in New South Wales and Queensland are comparable to residentialnatural gas prices in Spain (28 USD/MMBtu), Switzerland (30 USD/MMBtu), and Chile (34 USD/MMBtu). These countries have little to nodomestic production and are almost entirely reliant on pipeline imports or imports of LNG.
CUSTOM ANALYTICS REPORT
JUNE 2019
© 2018 S&P Global Platts, a division of S&P Global Inc. All rights reserved. 4HAVE A SPECIFIC QUESTION ON COMMODITIES?
CONTACT CUSTOM ANALYTICS AT [email protected]
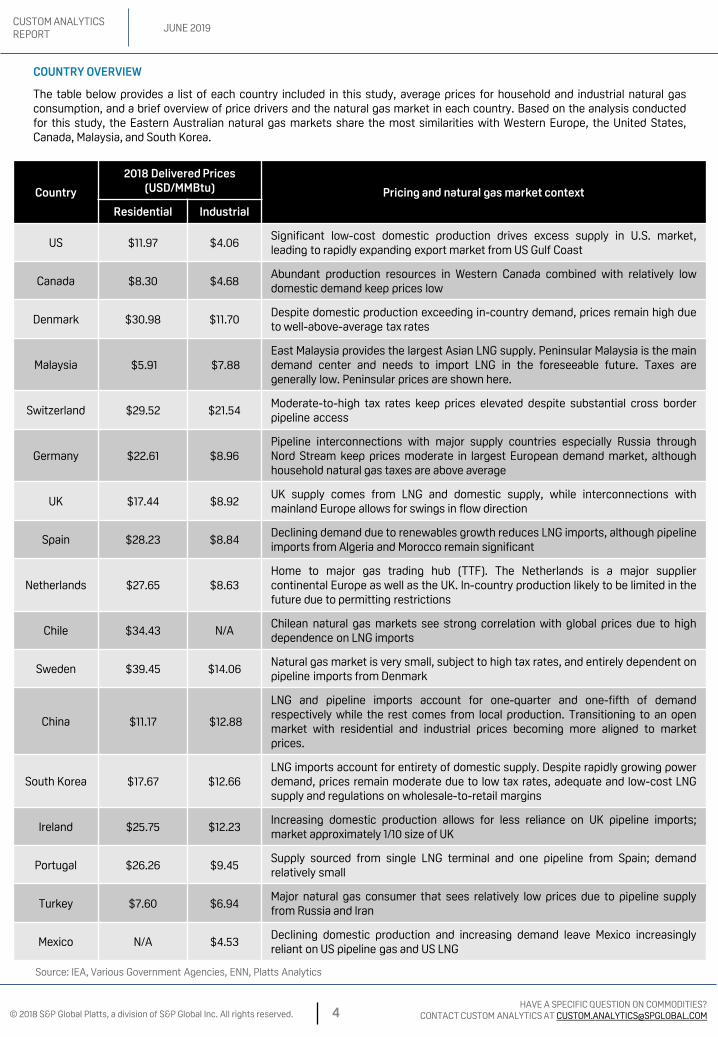
COUNTRY OVERVIEW
The table below provides a list of each country included in this study, average prices for household and industrial natural gasconsumption, and a brief overview of price drivers and the natural gas market in each country. Based on the analysis conductedfor this study, the Eastern Australian natural gas markets share the most similarities with Western Europe, the United States,Canada, Malaysia, and South Korea.
Country
2018 Delivered Prices(USD/MMBtu) Pricing and natural gas market context
Residential Industrial
US $11.97 $4.06Significant low-cost domestic production drives excess supply in U.S. market,leading to rapidly expanding export market from US Gulf Coast
Canada $8.30 $4.68Abundant production resources in Western Canada combined with relatively lowdomestic demand keep prices low
Denmark $30.98 $11.70Despite domestic production exceeding in-country demand, prices remain high dueto well-above-average tax rates
Malaysia $5.91 $7.88East Malaysia provides the largest Asian LNG supply. Peninsular Malaysia is the maindemand center and needs to import LNG in the foreseeable future. Taxes aregenerally low. Peninsular prices are shown here.
Switzerland $29.52 $21.54Moderate-to-high tax rates keep prices elevated despite substantial cross borderpipeline access
Germany $22.61 $8.96Pipeline interconnections with major supply countries especially Russia throughNord Stream keep prices moderate in largest European demand market, althoughhousehold natural gas taxes are above average
UK $17.44 $8.92UK supply comes from LNG and domestic supply, while interconnections withmainland Europe allows for swings in flow direction
Spain $28.23 $8.84Declining demand due to renewables growth reduces LNG imports, although pipelineimports from Algeria and Morocco remain significant
Netherlands $27.65 $8.63Home to major gas trading hub (TTF). The Netherlands is a major suppliercontinental Europe as well as the UK. In-country production likely to be limited in thefuture due to permitting restrictions
Chile $34.43 N/AChilean natural gas markets see strong correlation with global prices due to highdependence on LNG imports
Sweden $39.45 $14.06Natural gas market is very small, subject to high tax rates, and entirely dependent onpipeline imports from Denmark
China $11.17 $12.88
LNG and pipeline imports account for one-quarter and one-fifth of demandrespectively while the rest comes from local production. Transitioning to an openmarket with residential and industrial prices becoming more aligned to marketprices.
South Korea $17.67 $12.66LNG imports account for entirety of domestic supply. Despite rapidly growing powerdemand, prices remain moderate due to low tax rates, adequate and low-cost LNGsupply and regulations on wholesale-to-retail margins
Ireland $25.75 $12.23Increasing domestic production allows for less reliance on UK pipeline imports;market approximately 1/10 size of UK
Portugal $26.26 $9.45Supply sourced from single LNG terminal and one pipeline from Spain; demandrelatively small
Turkey $7.60 $6.94Major natural gas consumer that sees relatively low prices due to pipeline supplyfrom Russia and Iran
Mexico N/A $4.53Declining domestic production and increasing demand leave Mexico increasinglyreliant on US pipeline gas and US LNG
Source: IEA, Various Government Agencies, ENN, Platts Analytics
CUSTOM ANALYTICS REPORT
JUNE 2019
© 2018 S&P Global Platts, a division of S&P Global Inc. All rights reserved. 5HAVE A SPECIFIC QUESTION ON COMMODITIES?
CONTACT CUSTOM ANALYTICS AT [email protected]
MARKET OVERVIEW
INTRODUCTION
Natural gas, mostly made up of methane, is becoming a global commodity. A few decades ago, natural gas was considered adomestic commodity that stayed within the country or region. Each country’s government could manage gas flows and pricingeither unilaterally or bilaterally with neighboring countries, without concern for global and other regional events.
Fast forward to today, the individual natural gas markets are now interconnected by the emergence of a vibrant Liquefied NaturalGas (LNG) market. Just as how other major commodities have moved from a local focus to a global market, natural gas has alsoevolved in similar fashion. With each wave of LNG liquefaction trains and regasification units starting up, the increasing globalconnectivity can only strengthen the link between domestic and global markets. No longer will natural gas markets stay isolated orinsulated from global events and global prices as before.
There are some countries that are trying to buck the trend. These are countries with highly regulated and subsidized gas cost in theresidential sector. However, some of these countries are moving gradually towards global prices for reasons which include the long-term sustainability of ever-increasing demand for natural gas and the economic benefits from having an open gas market. The keydrawbacks from opening up are dissent from residents paying for higher energy prices and the loss of centralized control of acountry’s energy assets.
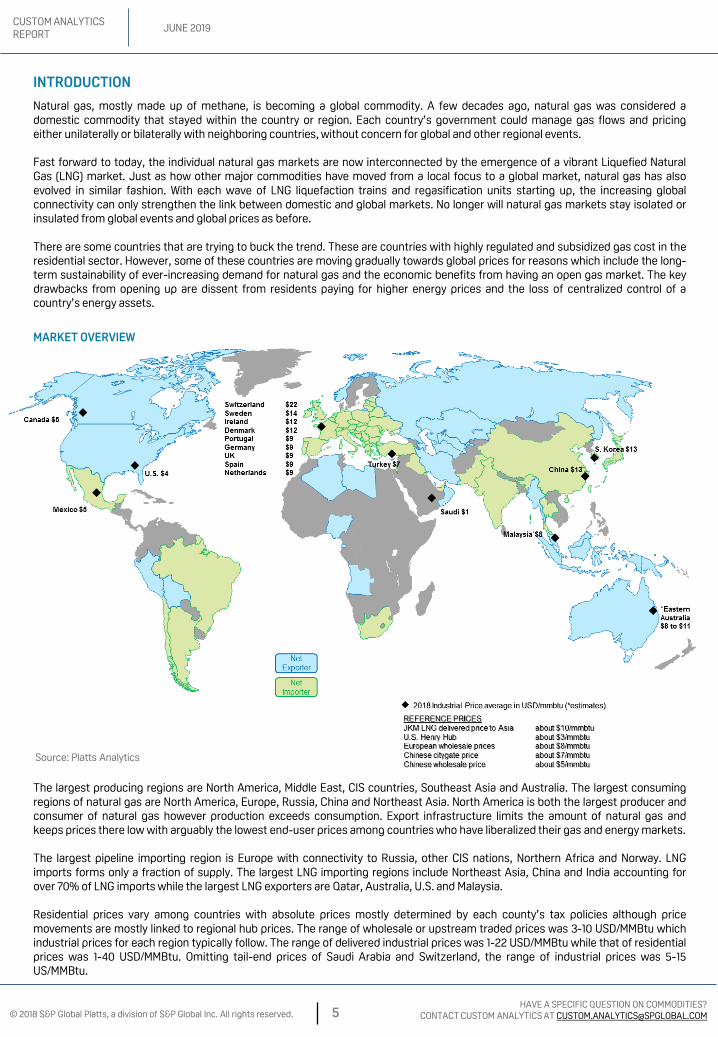
The largest producing regions are North America, Middle East, CIS countries, Southeast Asia and Australia. The largest consumingregions of natural gas are North America, Europe, Russia, China and Northeast Asia. North America is both the largest producer andconsumer of natural gas however production exceeds consumption. Export infrastructure limits the amount of natural gas andkeeps prices there low with arguably the lowest end-user prices among countries who have liberalized their gas and energy markets.
The largest pipeline importing region is Europe with connectivity to Russia, other CIS nations, Northern Africa and Norway. LNGimports forms only a fraction of supply. The largest LNG importing regions include Northeast Asia, China and India accounting forover 70% of LNG imports while the largest LNG exporters are Qatar, Australia, U.S. and Malaysia.
Residential prices vary among countries with absolute prices mostly determined by each county’s tax policies although pricemovements are mostly linked to regional hub prices. The range of wholesale or upstream traded prices was 3-10 USD/MMBtu whichindustrial prices for each region typically follow. The range of delivered industrial prices was 1-22 USD/MMBtu while that of residentialprices was 1-40 USD/MMBtu. Omitting tail-end prices of Saudi Arabia and Switzerland, the range of industrial prices was 5-15US/MMBtu.
Source: Platts Analytics
CUSTOM ANALYTICS REPORT
JUNE 2019
© 2018 S&P Global Platts, a division of S&P Global Inc. All rights reserved. 6HAVE A SPECIFIC QUESTION ON COMMODITIES?
CONTACT CUSTOM ANALYTICS AT [email protected]
Other than LNG liquefaction, natural gas is consumed in industries as a fuel, or as a chemical feedstock such as the production ofhydrogen, methanol and fertilizers. It is used in the power generation sector as a generating fuel alongside coal, and as a heatingfuel for residential, commercial and public sector use.
In the winter months, the residential and commercial sectors require more heating which directly comes from either natural gas ortown gas which may or may not be made up entirely of natural gas. Indirect uses of natural gas come mainly as a generation fuelfor power which includes air-conditioning during the warmer months and electric heating. Equatorial countries such as Mexico,Malaysia and Saudi Arabia are countries which require power from generating fuels for cooling and seldom require heating. Ingeneral, the further away from the equator, the more heating is required.
0
100
200
300
400
500
600
700
800
900
Bcm
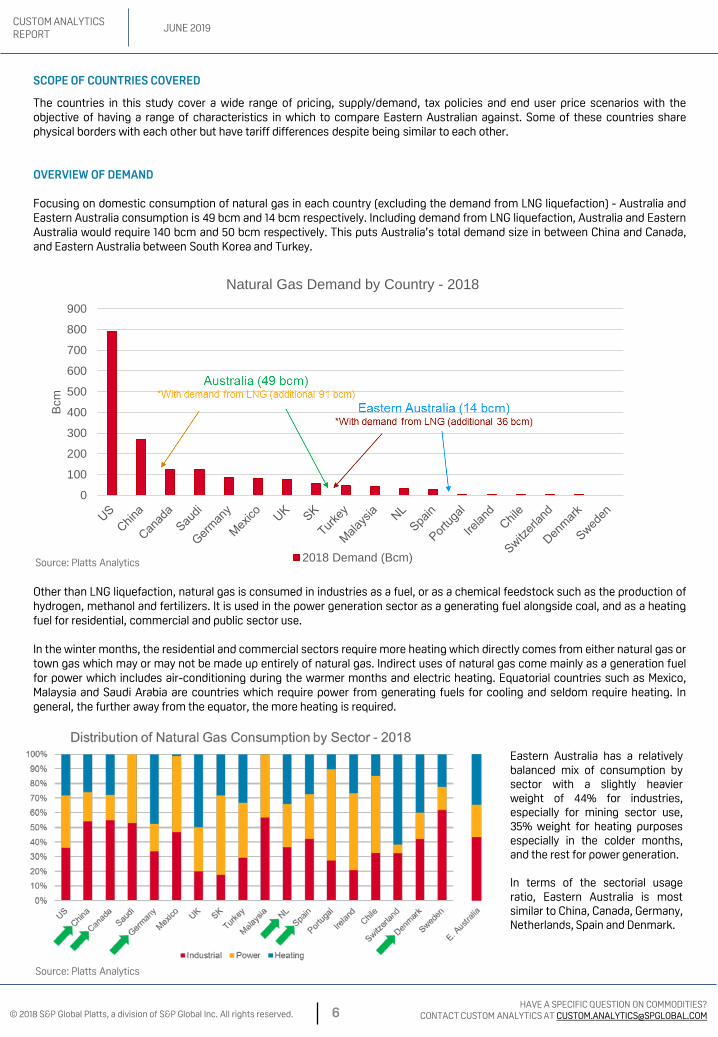
Natural Gas Demand by Country - 2018
2018 Demand (Bcm)
SCOPE OF COUNTRIES COVERED
The countries in this study cover a wide range of pricing, supply/demand, tax policies and end user price scenarios with theobjective of having a range of characteristics in which to compare Eastern Australian against. Some of these countries sharephysical borders with each other but have tariff differences despite being similar to each other.
OVERVIEW OF DEMAND
Focusing on domestic consumption of natural gas in each country (excluding the demand from LNG liquefaction) - Australia andEastern Australia consumption is 49 bcm and 14 bcm respectively. Including demand from LNG liquefaction, Australia and EasternAustralia would require 140 bcm and 50 bcm respectively. This puts Australia’s total demand size in between China and Canada,and Eastern Australia between South Korea and Turkey.
Source: Platts Analytics
Source: Platts Analytics
Eastern Australia has a relativelybalanced mix of consumption bysector with a slightly heavierweight of 44% for industries,especially for mining sector use,35% weight for heating purposesespecially in the colder months,and the rest for power generation.
In terms of the sectorial usageratio, Eastern Australia is mostsimilar to China, Canada, Germany,Netherlands, Spain and Denmark.
CUSTOM ANALYTICS REPORT
JUNE 2019
© 2018 S&P Global Platts, a division of S&P Global Inc. All rights reserved. 7HAVE A SPECIFIC QUESTION ON COMMODITIES?
CONTACT CUSTOM ANALYTICS AT [email protected]
COUNTRY PROFILES
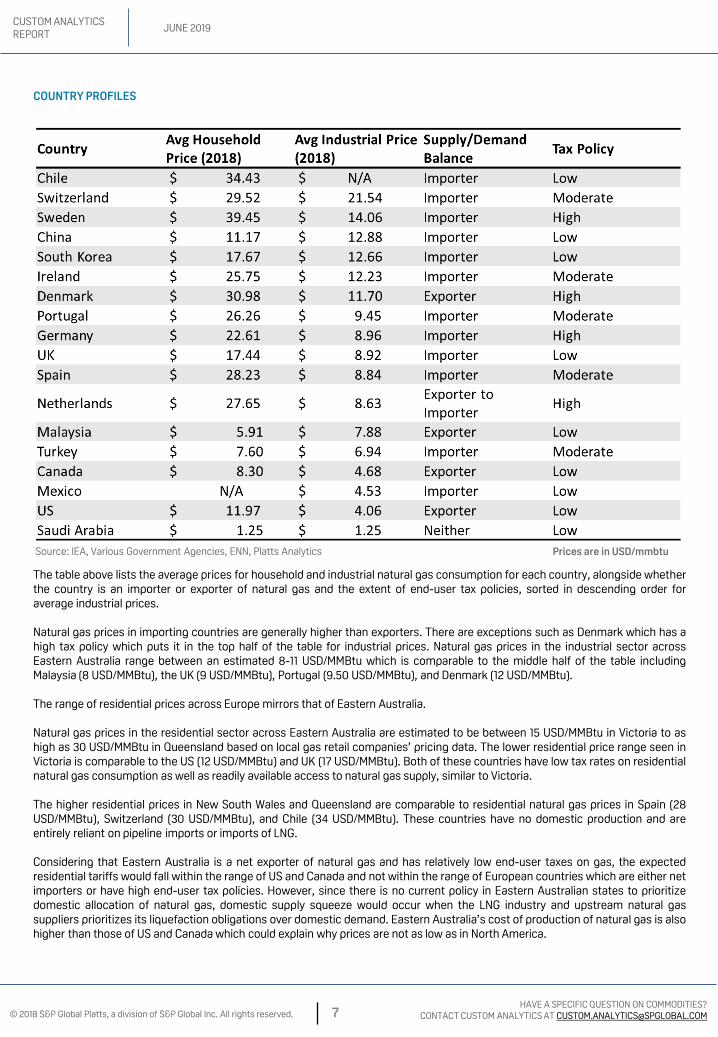
The table above lists the average prices for household and industrial natural gas consumption for each country, alongside whetherthe country is an importer or exporter of natural gas and the extent of end-user tax policies, sorted in descending order foraverage industrial prices.
Natural gas prices in importing countries are generally higher than exporters. There are exceptions such as Denmark which has ahigh tax policy which puts it in the top half of the table for industrial prices. Natural gas prices in the industrial sector acrossEastern Australia range between an estimated 8-11 USD/MMBtu which is comparable to the middle half of the table includingMalaysia (8 USD/MMBtu), the UK (9 USD/MMBtu), Portugal (9.50 USD/MMBtu), and Denmark (12 USD/MMBtu).
The range of residential prices across Europe mirrors that of Eastern Australia.
Natural gas prices in the residential sector across Eastern Australia are estimated to be between 15 USD/MMBtu in Victoria to ashigh as 30 USD/MMBtu in Queensland based on local gas retail companies’ pricing data. The lower residential price range seen inVictoria is comparable to the US (12 USD/MMBtu) and UK (17 USD/MMBtu). Both of these countries have low tax rates on residentialnatural gas consumption as well as readily available access to natural gas supply, similar to Victoria.
The higher residential prices in New South Wales and Queensland are comparable to residential natural gas prices in Spain (28USD/MMBtu), Switzerland (30 USD/MMBtu), and Chile (34 USD/MMBtu). These countries have no domestic production and areentirely reliant on pipeline imports or imports of LNG.
Considering that Eastern Australia is a net exporter of natural gas and has relatively low end-user taxes on gas, the expectedresidential tariffs would fall within the range of US and Canada and not within the range of European countries which are either netimporters or have high end-user tax policies. However, since there is no current policy in Eastern Australian states to prioritizedomestic allocation of natural gas, domestic supply squeeze would occur when the LNG industry and upstream natural gassuppliers prioritizes its liquefaction obligations over domestic demand. Eastern Australia’s cost of production of natural gas is alsohigher than those of US and Canada which could explain why prices are not as low as in North America.
Source: IEA, Various Government Agencies, ENN, Platts Analytics Prices are in USD/mmbtu
CUSTOM ANALYTICS REPORT
JUNE 2019
© 2018 S&P Global Platts, a division of S&P Global Inc. All rights reserved. 8HAVE A SPECIFIC QUESTION ON COMMODITIES?
CONTACT CUSTOM ANALYTICS AT [email protected]
NORTH AMERICA
Natural gas prices in North America have seen a dramatic shift over the past decade as a rapid increase in shale gas production fromthe United States has flipped the country from a net importer to a major exporter of LNG into the global markets. The strongproduction growth from US shale has impacted prices in Canada as Canadian prices are closely linked to prices in the US due to theamount of natural gas that Canada exports to the US. In Mexico, an increasing reliance on pipeline imports from the United States inthe past several years has further linked the natural gas markets of Mexico and the United States.
The growth of low-cost shale production, as well as the rapid increase in dry-gas focused drilling in the US Northeast has allowed forNorth American gas prices to largely decouple from global pricing benchmarks linked to oil or LNG since the start of the currentdecade.
UNITED STATES
From 2000 through 2010, wholesale prices measured at the US benchmark Henry Hub largely moved in line with global oil and/or LNGprices as the country was an importer of LNG, bringing in LNG cargoes to multiple LNG regasification facilities along the US GulfCoast and in the US Northeast demand markets.
In addition to its dependence on imported LNG volumes to supply up to 5 percent of annual demand during the mid-2000s, the USwas highly dependent on natural gas production from the US Gulf Coast with the bulk of production coming from the states of Texasand Louisiana. In 2005, combined production volumes from Texas and the US Southeast markets (Louisiana, Alabama, andMississippi) accounted for 284 Bcm, providing more than 55 percent of total US production.
With the bulk of US production centered near the US Gulf Coast and widespread demand regions in the US Northeast, Mid-Atlantic,and Midwest markets, the US steadily developed a large pipeline transportation grid which historically moved production north tomeet demand in the northern half of the country. US demand was primarily centered in the home heating and industrial demandsectors, as the power sector accounted for approximately 25 percent of US demand in 2005.
Shale gas production in the United States began to enter the market in the mid-to-late 2000s in places like the Haynesville shale inLouisiana and Texas. The most significant impact from shale, however, started to appear in 2010 as natural gas production from theMarcellus and Utica shale formations in the US Northeast began to grow rapidly.
The US Northeast produced 35 Bcm in 2010, accounting for just six percent of total US production. By 2018, Northeast natural gasproduction reached nearly 300 Bcm and accounted for more than 35 percent of US production.
The rapid increase in domestic natural gas production in the United States had a number of impacts on the US natural gas markets.Due to its previous position as an importer of LNG, the US had plenty of infrastructure to import LNG, but no ability to export LNG fromthe country. While the US exported a small percentage of its production to Mexico via pipeline, that demand source remained at lessthan 5 percent of the total US demand market.
With an excess of supply in the US market and relatively little ability to send that gas into the global markets, natural gas wholesaleprices measured at Henry Hub have remained between $3/MMBtu and $5/MMBtu for the majority of the past decade, compared tomultiple periods that saw prices above $10/MMBtu between 2000 and 2010.
CUSTOM ANALYTICS REPORT
JUNE 2019
© 2018 S&P Global Platts, a division of S&P Global Inc. All rights reserved. 9HAVE A SPECIFIC QUESTION ON COMMODITIES?
CONTACT CUSTOM ANALYTICS AT [email protected]
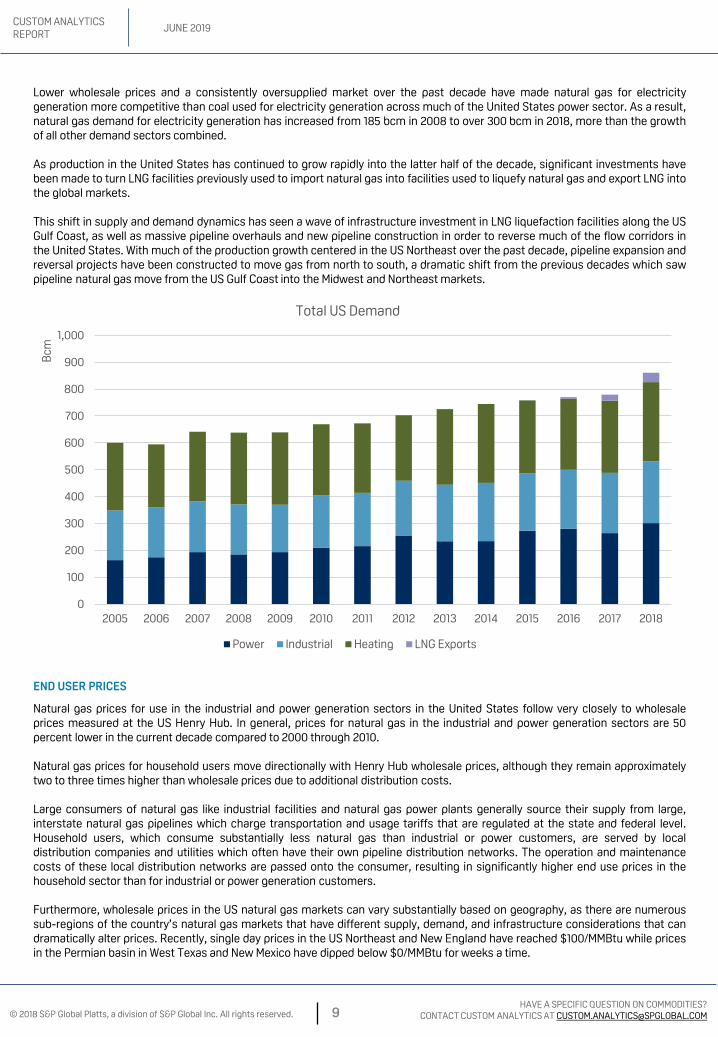
Lower wholesale prices and a consistently oversupplied market over the past decade have made natural gas for electricitygeneration more competitive than coal used for electricity generation across much of the United States power sector. As a result,natural gas demand for electricity generation has increased from 185 bcm in 2008 to over 300 bcm in 2018, more than the growthof all other demand sectors combined.
As production in the United States has continued to grow rapidly into the latter half of the decade, significant investments havebeen made to turn LNG facilities previously used to import natural gas into facilities used to liquefy natural gas and export LNG intothe global markets.
This shift in supply and demand dynamics has seen a wave of infrastructure investment in LNG liquefaction facilities along the USGulf Coast, as well as massive pipeline overhauls and new pipeline construction in order to reverse much of the flow corridors inthe United States. With much of the production growth centered in the US Northeast over the past decade, pipeline expansion andreversal projects have been constructed to move gas from north to south, a dramatic shift from the previous decades which sawpipeline natural gas move from the US Gulf Coast into the Midwest and Northeast markets.
END USER PRICES
Natural gas prices for use in the industrial and power generation sectors in the United States follow very closely to wholesaleprices measured at the US Henry Hub. In general, prices for natural gas in the industrial and power generation sectors are 50percent lower in the current decade compared to 2000 through 2010.
Natural gas prices for household users move directionally with Henry Hub wholesale prices, although they remain approximatelytwo to three times higher than wholesale prices due to additional distribution costs.
Large consumers of natural gas like industrial facilities and natural gas power plants generally source their supply from large,interstate natural gas pipelines which charge transportation and usage tariffs that are regulated at the state and federal level.Household users, which consume substantially less natural gas than industrial or power customers, are served by localdistribution companies and utilities which often have their own pipeline distribution networks. The operation and maintenancecosts of these local distribution networks are passed onto the consumer, resulting in significantly higher end use prices in thehousehold sector than for industrial or power generation customers.
Furthermore, wholesale prices in the US natural gas markets can vary substantially based on geography, as there are numeroussub-regions of the country’s natural gas markets that have different supply, demand, and infrastructure considerations that candramatically alter prices. Recently, single day prices in the US Northeast and New England have reached $100/MMBtu while pricesin the Permian basin in West Texas and New Mexico have dipped below $0/MMBtu for weeks a time.
0
100
200
300
400
500
600
700
800
900
1,000
2005 2006 2007 2008 2009 2010 2011 2012 2013 2014 2015 2016 2017 2018
Bcm
Total US Demand
Power Industrial Heating LNG Exports
CUSTOM ANALYTICS REPORT
JUNE 2019
© 2018 S&P Global Platts, a division of S&P Global Inc. All rights reserved. 10HAVE A SPECIFIC QUESTION ON COMMODITIES?
CONTACT CUSTOM ANALYTICS AT [email protected]
CANADA
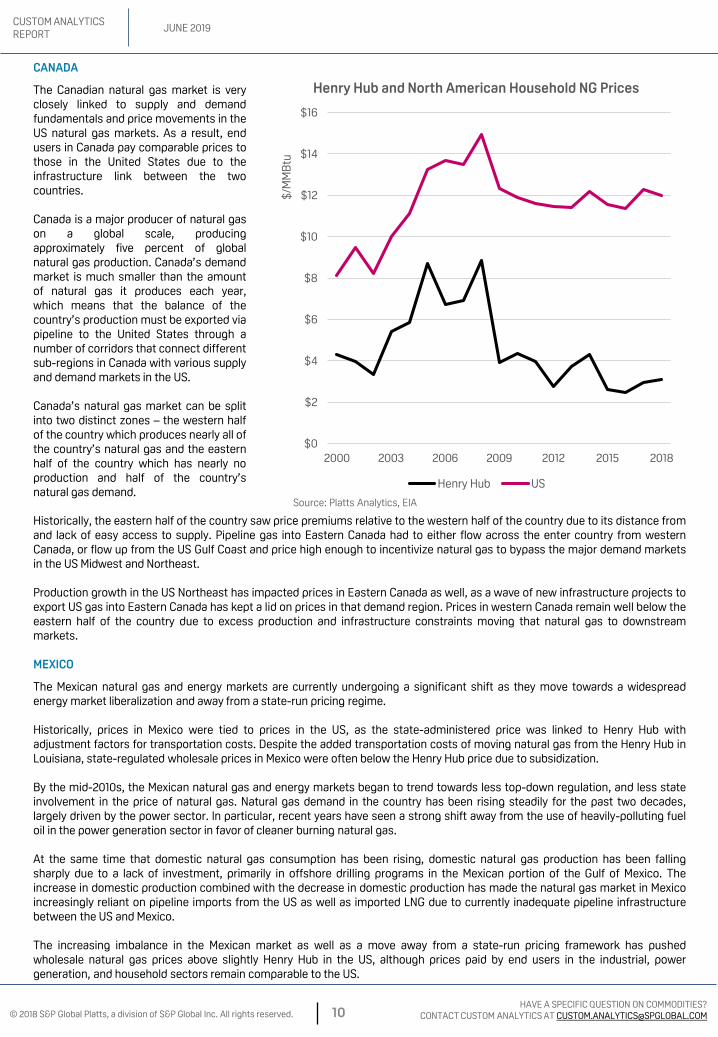
The Canadian natural gas market is veryclosely linked to supply and demandfundamentals and price movements in theUS natural gas markets. As a result, endusers in Canada pay comparable prices tothose in the United States due to theinfrastructure link between the twocountries.
Canada is a major producer of natural gason a global scale, producingapproximately five percent of globalnatural gas production. Canada’s demandmarket is much smaller than the amountof natural gas it produces each year,which means that the balance of thecountry’s production must be exported viapipeline to the United States through anumber of corridors that connect differentsub-regions in Canada with various supplyand demand markets in the US.
Canada’s natural gas market can be splitinto two distinct zones – the western halfof the country which produces nearly all ofthe country’s natural gas and the easternhalf of the country which has nearly noproduction and half of the country’snatural gas demand.
$0
$2
$4
$6
$8
$10
$12
$14
$16
2000 2003 2006 2009 2012 2015 2018
$/M
MB
tu
Henry Hub and North American Household NG Prices
Henry Hub US
Historically, the eastern half of the country saw price premiums relative to the western half of the country due to its distance fromand lack of easy access to supply. Pipeline gas into Eastern Canada had to either flow across the enter country from westernCanada, or flow up from the US Gulf Coast and price high enough to incentivize natural gas to bypass the major demand marketsin the US Midwest and Northeast.
Production growth in the US Northeast has impacted prices in Eastern Canada as well, as a wave of new infrastructure projects toexport US gas into Eastern Canada has kept a lid on prices in that demand region. Prices in western Canada remain well below theeastern half of the country due to excess production and infrastructure constraints moving that natural gas to downstreammarkets.
MEXICO
The Mexican natural gas and energy markets are currently undergoing a significant shift as they move towards a widespreadenergy market liberalization and away from a state-run pricing regime.
Historically, prices in Mexico were tied to prices in the US, as the state-administered price was linked to Henry Hub withadjustment factors for transportation costs. Despite the added transportation costs of moving natural gas from the Henry Hub inLouisiana, state-regulated wholesale prices in Mexico were often below the Henry Hub price due to subsidization.
By the mid-2010s, the Mexican natural gas and energy markets began to trend towards less top-down regulation, and less stateinvolvement in the price of natural gas. Natural gas demand in the country has been rising steadily for the past two decades,largely driven by the power sector. In particular, recent years have seen a strong shift away from the use of heavily-polluting fueloil in the power generation sector in favor of cleaner burning natural gas.
At the same time that domestic natural gas consumption has been rising, domestic natural gas production has been fallingsharply due to a lack of investment, primarily in offshore drilling programs in the Mexican portion of the Gulf of Mexico. Theincrease in domestic production combined with the decrease in domestic production has made the natural gas market in Mexicoincreasingly reliant on pipeline imports from the US as well as imported LNG due to currently inadequate pipeline infrastructurebetween the US and Mexico.
The increasing imbalance in the Mexican market as well as a move away from a state-run pricing framework has pushedwholesale natural gas prices above slightly Henry Hub in the US, although prices paid by end users in the industrial, powergeneration, and household sectors remain comparable to the US.
Source: Platts Analytics, EIA
CUSTOM ANALYTICS REPORT
JUNE 2019
© 2018 S&P Global Platts, a division of S&P Global Inc. All rights reserved. 11HAVE A SPECIFIC QUESTION ON COMMODITIES?
CONTACT CUSTOM ANALYTICS AT [email protected]
EUROPEAN MARKETS
The ten countries included in the European natural gas market analysis cover a wide range of market conditions, based oninfrastructure, supply and demand fundamentals, and tax policy. There are a number of factors that impact end-user pricing inEurope, but the two biggest factors are access to diverse sources of supply and tax policy.
Both wholesale and end-user natural gas prices across Europe are higher than those in North America, as the continent’s netshort position requires natural gas imports via both LNG and pipeline gas. Due to its position as a net importer, Europe mustcompete in the global market for LNG cargoes which could otherwise route to Northeast Asia, Southeast Asia, Latin America, orother global demand markets.
Europe has a number of varied supply sources, include domestic production in the UK, Norway, and Netherlands, pipeline importsfrom Russia and Algeria, as well as dozens of LNG import terminals to multiple countries across Europe.
Countries that have diverse sources of supply from multiple streams including pipeline imports, LNG imports, and domesticproduction as well as low tax rates generally see the lowest end user prices across the industrial, power generation, andhousehold sectors.
Countries in this grouping include the UK and Turkey, which both have multiple sources of imported pipeline gas, multiple LNGimport terminals, and low-to-moderate tax rates.
On the other end of the spectrum, countries with limited supply optionality and high tax rates tend to see some of the highestnatural gas prices across all end use sectors in the study.
These countries often have no domestic production, are entirely reliant on pipeline imports from a single country, and have taxrates above 20 percent on natural gas for industrial use and above 40 percent for household use. Countries in this groupinginclude Sweden, Denmark, and Switzerland.
Europe has two major gas pricing hubs that serve as signals to the broader global gas market about the supply and demandconditions in Europe. The Dutch Title Transfer Facility (TTF) hub effectively sits at the center of the European gas market, offeringsubstantial pipeline interconnectivity to much of the rest of the continent, including to the UK. In the wholesale market, much ofthe gas in Northwest Europe trades at a differential to TTF.
The National Balancing Point (NBP) hub serves as the virtual trading point for the exchange of natural gas in the UK. The differencein pricing between these two hubs can provide an informative signal to indicate the supply and demand balance of NorthwestEurope near the TTF hub and the supply and demand balance in the UK via the NBP hub.
Due to the LNG import capabilities of numerous European countries, NBP and TTF can be thought of as European-specific pricinghubs that indicated the relative supply/demand balances on the continent that need to fluctuate enough with global prices toincentivize LNG cargoes to deliver to Europe instead of other competing markets.
CUSTOM ANALYTICS REPORT
JUNE 2019
© 2018 S&P Global Platts, a division of S&P Global Inc. All rights reserved. 12HAVE A SPECIFIC QUESTION ON COMMODITIES?
CONTACT CUSTOM ANALYTICS AT [email protected]
UK
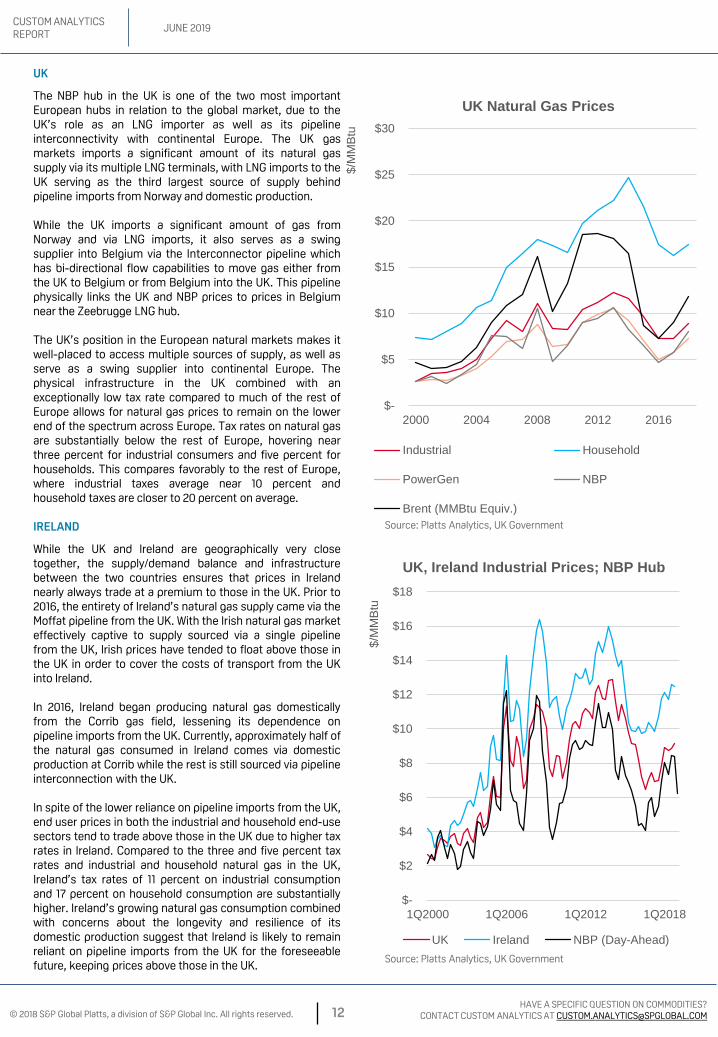
The NBP hub in the UK is one of the two most importantEuropean hubs in relation to the global market, due to theUK’s role as an LNG importer as well as its pipelineinterconnectivity with continental Europe. The UK gasmarkets imports a significant amount of its natural gassupply via its multiple LNG terminals, with LNG imports to theUK serving as the third largest source of supply behindpipeline imports from Norway and domestic production.
While the UK imports a significant amount of gas fromNorway and via LNG imports, it also serves as a swingsupplier into Belgium via the Interconnector pipeline whichhas bi-directional flow capabilities to move gas either fromthe UK to Belgium or from Belgium into the UK. This pipelinephysically links the UK and NBP prices to prices in Belgiumnear the Zeebrugge LNG hub.
The UK’s position in the European natural markets makes itwell-placed to access multiple sources of supply, as well asserve as a swing supplier into continental Europe. Thephysical infrastructure in the UK combined with anexceptionally low tax rate compared to much of the rest ofEurope allows for natural gas prices to remain on the lowerend of the spectrum across Europe. Tax rates on natural gasare substantially below the rest of Europe, hovering nearthree percent for industrial consumers and five percent forhouseholds. This compares favorably to the rest of Europe,where industrial taxes average near 10 percent andhousehold taxes are closer to 20 percent on average.
IRELAND
While the UK and Ireland are geographically very closetogether, the supply/demand balance and infrastructurebetween the two countries ensures that prices in Irelandnearly always trade at a premium to those in the UK. Prior to2016, the entirety of Ireland’s natural gas supply came via theMoffat pipeline from the UK. With the Irish natural gas marketeffectively captive to supply sourced via a single pipelinefrom the UK, Irish prices have tended to float above those inthe UK in order to cover the costs of transport from the UKinto Ireland.
In 2016, Ireland began producing natural gas domesticallyfrom the Corrib gas field, lessening its dependence onpipeline imports from the UK. Currently, approximately half ofthe natural gas consumed in Ireland comes via domesticproduction at Corrib while the rest is still sourced via pipelineinterconnection with the UK.
In spite of the lower reliance on pipeline imports from the UK,end user prices in both the industrial and household end-usesectors tend to trade above those in the UK due to higher taxrates in Ireland. Compared to the three and five percent taxrates and industrial and household natural gas in the UK,Ireland’s tax rates of 11 percent on industrial consumptionand 17 percent on household consumption are substantiallyhigher. Ireland’s growing natural gas consumption combinedwith concerns about the longevity and resilience of itsdomestic production suggest that Ireland is likely to remainreliant on pipeline imports from the UK for the foreseeablefuture, keeping prices above those in the UK.
$-
$5
$10
$15
$20
$25
$30
2000 2004 2008 2012 2016
$/M
MB
tu
UK Natural Gas Prices
Industrial Household
PowerGen NBP
Brent (MMBtu Equiv.)
$-
$2
$4
$6
$8
$10
$12
$14
$16
$18
1Q2000 1Q2006 1Q2012 1Q2018
$/M
MB
tu
UK, Ireland Industrial Prices; NBP Hub
UK Ireland NBP (Day-Ahead)
Source: Platts Analytics, UK Government
Source: Platts Analytics, UK Government
CUSTOM ANALYTICS REPORT
JUNE 2019
© 2018 S&P Global Platts, a division of S&P Global Inc. All rights reserved. 13HAVE A SPECIFIC QUESTION ON COMMODITIES?
CONTACT CUSTOM ANALYTICS AT [email protected]
NETHERLANDS
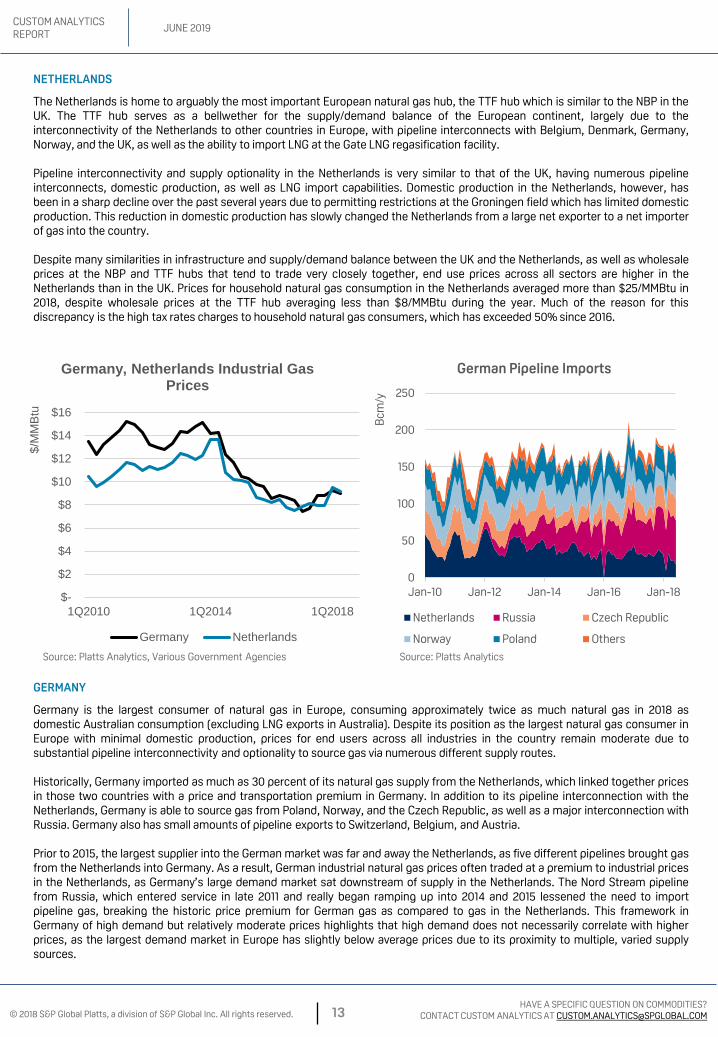
The Netherlands is home to arguably the most important European natural gas hub, the TTF hub which is similar to the NBP in theUK. The TTF hub serves as a bellwether for the supply/demand balance of the European continent, largely due to theinterconnectivity of the Netherlands to other countries in Europe, with pipeline interconnects with Belgium, Denmark, Germany,Norway, and the UK, as well as the ability to import LNG at the Gate LNG regasification facility.
Pipeline interconnectivity and supply optionality in the Netherlands is very similar to that of the UK, having numerous pipelineinterconnects, domestic production, as well as LNG import capabilities. Domestic production in the Netherlands, however, hasbeen in a sharp decline over the past several years due to permitting restrictions at the Groningen field which has limited domesticproduction. This reduction in domestic production has slowly changed the Netherlands from a large net exporter to a net importerof gas into the country.
Despite many similarities in infrastructure and supply/demand balance between the UK and the Netherlands, as well as wholesaleprices at the NBP and TTF hubs that tend to trade very closely together, end use prices across all sectors are higher in theNetherlands than in the UK. Prices for household natural gas consumption in the Netherlands averaged more than $25/MMBtu in2018, despite wholesale prices at the TTF hub averaging less than $8/MMBtu during the year. Much of the reason for thisdiscrepancy is the high tax rates charges to household natural gas consumers, which has exceeded 50% since 2016.
$-
$2
$4
$6
$8
$10
$12
$14
$16
1Q2010 1Q2014 1Q2018
$/M
MB
tu
Germany, Netherlands Industrial Gas Prices
Germany Netherlands
0
50
100
150
200
250
Jan-10 Jan-12 Jan-14 Jan-16 Jan-18
Bcm
/yGerman Pipeline Imports
Netherlands Russia Czech Republic
Norway Poland Others
GERMANY
Germany is the largest consumer of natural gas in Europe, consuming approximately twice as much natural gas in 2018 asdomestic Australian consumption (excluding LNG exports in Australia). Despite its position as the largest natural gas consumer inEurope with minimal domestic production, prices for end users across all industries in the country remain moderate due tosubstantial pipeline interconnectivity and optionality to source gas via numerous different supply routes.
Historically, Germany imported as much as 30 percent of its natural gas supply from the Netherlands, which linked together pricesin those two countries with a price and transportation premium in Germany. In addition to its pipeline interconnection with theNetherlands, Germany is able to source gas from Poland, Norway, and the Czech Republic, as well as a major interconnection withRussia. Germany also has small amounts of pipeline exports to Switzerland, Belgium, and Austria.
Prior to 2015, the largest supplier into the German market was far and away the Netherlands, as five different pipelines brought gasfrom the Netherlands into Germany. As a result, German industrial natural gas prices often traded at a premium to industrial pricesin the Netherlands, as Germany’s large demand market sat downstream of supply in the Netherlands. The Nord Stream pipelinefrom Russia, which entered service in late 2011 and really began ramping up into 2014 and 2015 lessened the need to importpipeline gas, breaking the historic price premium for German gas as compared to gas in the Netherlands. This framework inGermany of high demand but relatively moderate prices highlights that high demand does not necessarily correlate with higherprices, as the largest demand market in Europe has slightly below average prices due to its proximity to multiple, varied supplysources.
Source: Platts Analytics, Various Government Agencies Source: Platts Analytics
CUSTOM ANALYTICS REPORT
JUNE 2019
© 2018 S&P Global Platts, a division of S&P Global Inc. All rights reserved. 14HAVE A SPECIFIC QUESTION ON COMMODITIES?
CONTACT CUSTOM ANALYTICS AT [email protected]
DENMARK
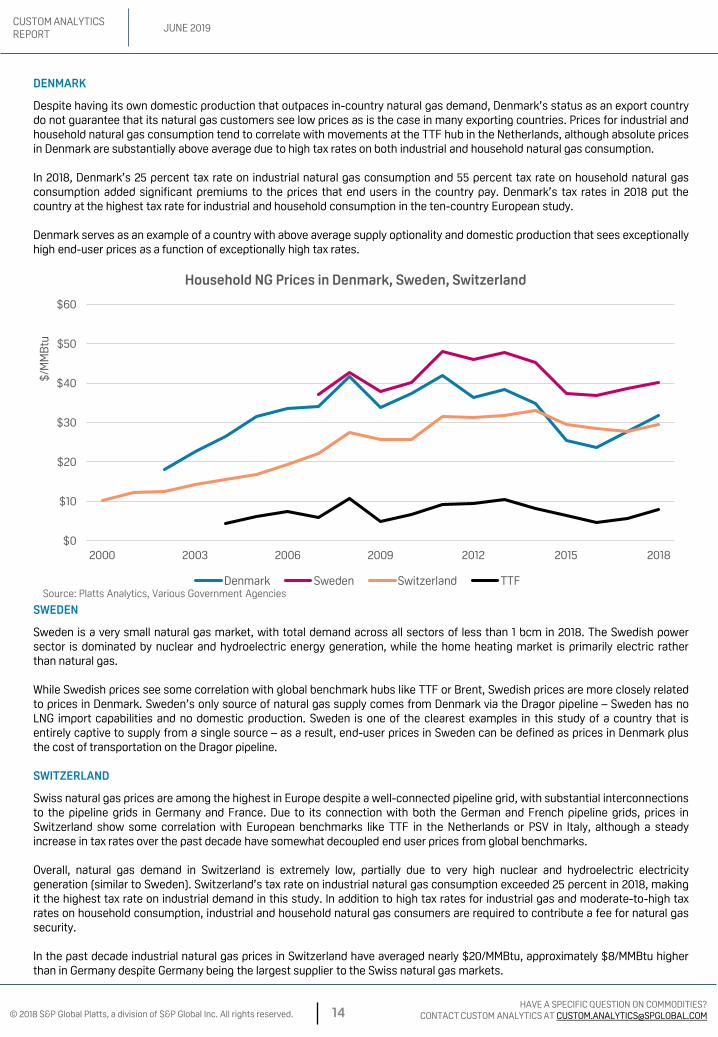
Despite having its own domestic production that outpaces in-country natural gas demand, Denmark’s status as an export countrydo not guarantee that its natural gas customers see low prices as is the case in many exporting countries. Prices for industrial andhousehold natural gas consumption tend to correlate with movements at the TTF hub in the Netherlands, although absolute pricesin Denmark are substantially above average due to high tax rates on both industrial and household natural gas consumption.
In 2018, Denmark’s 25 percent tax rate on industrial natural gas consumption and 55 percent tax rate on household natural gasconsumption added significant premiums to the prices that end users in the country pay. Denmark’s tax rates in 2018 put thecountry at the highest tax rate for industrial and household consumption in the ten-country European study.
Denmark serves as an example of a country with above average supply optionality and domestic production that sees exceptionallyhigh end-user prices as a function of exceptionally high tax rates.
$0
$10
$20
$30
$40
$50
$60
2000 2003 2006 2009 2012 2015 2018
$/M
MB
tu
Household NG Prices in Denmark, Sweden, Switzerland
Denmark Sweden Switzerland TTF
SWEDEN
Sweden is a very small natural gas market, with total demand across all sectors of less than 1 bcm in 2018. The Swedish powersector is dominated by nuclear and hydroelectric energy generation, while the home heating market is primarily electric ratherthan natural gas.
While Swedish prices see some correlation with global benchmark hubs like TTF or Brent, Swedish prices are more closely relatedto prices in Denmark. Sweden’s only source of natural gas supply comes from Denmark via the Dragor pipeline – Sweden has noLNG import capabilities and no domestic production. Sweden is one of the clearest examples in this study of a country that isentirely captive to supply from a single source – as a result, end-user prices in Sweden can be defined as prices in Denmark plusthe cost of transportation on the Dragor pipeline.
SWITZERLAND
Swiss natural gas prices are among the highest in Europe despite a well-connected pipeline grid, with substantial interconnectionsto the pipeline grids in Germany and France. Due to its connection with both the German and French pipeline grids, prices inSwitzerland show some correlation with European benchmarks like TTF in the Netherlands or PSV in Italy, although a steadyincrease in tax rates over the past decade have somewhat decoupled end user prices from global benchmarks.
Overall, natural gas demand in Switzerland is extremely low, partially due to very high nuclear and hydroelectric electricitygeneration (similar to Sweden). Switzerland’s tax rate on industrial natural gas consumption exceeded 25 percent in 2018, makingit the highest tax rate on industrial demand in this study. In addition to high tax rates for industrial gas and moderate-to-high taxrates on household consumption, industrial and household natural gas consumers are required to contribute a fee for natural gassecurity.
In the past decade industrial natural gas prices in Switzerland have averaged nearly $20/MMBtu, approximately $8/MMBtu higherthan in Germany despite Germany being the largest supplier to the Swiss natural gas markets.
Source: Platts Analytics, Various Government Agencies
CUSTOM ANALYTICS REPORT
JUNE 2019
© 2018 S&P Global Platts, a division of S&P Global Inc. All rights reserved. 15HAVE A SPECIFIC QUESTION ON COMMODITIES?
CONTACT CUSTOM ANALYTICS AT [email protected]
SPAIN
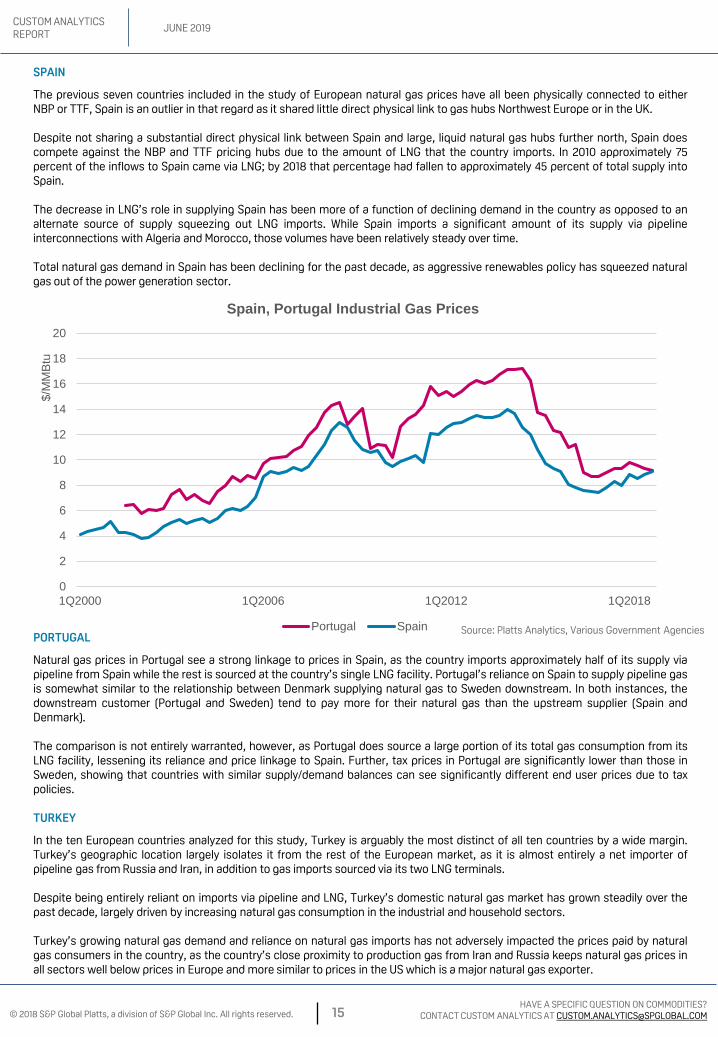
The previous seven countries included in the study of European natural gas prices have all been physically connected to eitherNBP or TTF, Spain is an outlier in that regard as it shared little direct physical link to gas hubs Northwest Europe or in the UK.
Despite not sharing a substantial direct physical link between Spain and large, liquid natural gas hubs further north, Spain doescompete against the NBP and TTF pricing hubs due to the amount of LNG that the country imports. In 2010 approximately 75percent of the inflows to Spain came via LNG; by 2018 that percentage had fallen to approximately 45 percent of total supply intoSpain.
The decrease in LNG’s role in supplying Spain has been more of a function of declining demand in the country as opposed to analternate source of supply squeezing out LNG imports. While Spain imports a significant amount of its supply via pipelineinterconnections with Algeria and Morocco, those volumes have been relatively steady over time.
Total natural gas demand in Spain has been declining for the past decade, as aggressive renewables policy has squeezed naturalgas out of the power generation sector.
0
2
4
6
8
10
12
14
16
18
20
1Q2000 1Q2006 1Q2012 1Q2018
$/M
MB
tu
Spain, Portugal Industrial Gas Prices
Portugal SpainPORTUGAL
Natural gas prices in Portugal see a strong linkage to prices in Spain, as the country imports approximately half of its supply viapipeline from Spain while the rest is sourced at the country’s single LNG facility. Portugal’s reliance on Spain to supply pipeline gasis somewhat similar to the relationship between Denmark supplying natural gas to Sweden downstream. In both instances, thedownstream customer (Portugal and Sweden) tend to pay more for their natural gas than the upstream supplier (Spain andDenmark).
The comparison is not entirely warranted, however, as Portugal does source a large portion of its total gas consumption from itsLNG facility, lessening its reliance and price linkage to Spain. Further, tax prices in Portugal are significantly lower than those inSweden, showing that countries with similar supply/demand balances can see significantly different end user prices due to taxpolicies.
TURKEY
In the ten European countries analyzed for this study, Turkey is arguably the most distinct of all ten countries by a wide margin.Turkey’s geographic location largely isolates it from the rest of the European market, as it is almost entirely a net importer ofpipeline gas from Russia and Iran, in addition to gas imports sourced via its two LNG terminals.
Despite being entirely reliant on imports via pipeline and LNG, Turkey’s domestic natural gas market has grown steadily over thepast decade, largely driven by increasing natural gas consumption in the industrial and household sectors.
Turkey’s growing natural gas demand and reliance on natural gas imports has not adversely impacted the prices paid by naturalgas consumers in the country, as the country’s close proximity to production gas from Iran and Russia keeps natural gas prices inall sectors well below prices in Europe and more similar to prices in the US which is a major natural gas exporter.
Source: Platts Analytics, Various Government Agencies
CUSTOM ANALYTICS REPORT
JUNE 2019
© 2018 S&P Global Platts, a division of S&P Global Inc. All rights reserved. 16HAVE A SPECIFIC QUESTION ON COMMODITIES?
CONTACT CUSTOM ANALYTICS AT [email protected]
LATIN AMERICA AND MIDDLE EAST
Along with our analysis of countries in North America and Europe, we also took a look at Chile in Latin America and Saudi Arabia inthe Middle East. In addition to being geographically distinct and separate from the North American and European markets, pricingmovements in both countries tend to be more nuanced as well.
CHILE
Natural gas prices in Chile see strong correlation with prices in the global market due to the country’s high reliance on imports viaits two LNG terminals or from pipeline gas sourced from Argentina. Chile is the fifth-largest consumer of energy on the continent,but unlike other large economies in South America (Argentina, Brazil, etc.) it is a relatively minor producer of fossil fuels. As aresult, Chile remains highly dependent on imports to satisfy its domestic consumption needs – Chile’s prices for natural gas in thehousehold market are some of the highest across all countries that we studied for this project.
In the late 1990s, Chile made substantial investments in natural gas pipeline and distribution systems to deliver to its industrial andpower generation sectors – very little natural gas use in the home heating market segment Chile sourced nearly all of its naturalgas supply from Argentina until the late 2000s, when Argentina began to increase its domestic subsidy for natural gas in theresidential sector, thereby increasing demand for natural gas and limiting the amount of gas available for export into Chile.
As a result, Chile began the construction of two LNG import facilities to lessen its reliance on Argentinian natural gas. Chileannatural gas prices tend to track with the global market, as the country largely sources its supply via LNG.
SAUDI ARABIA
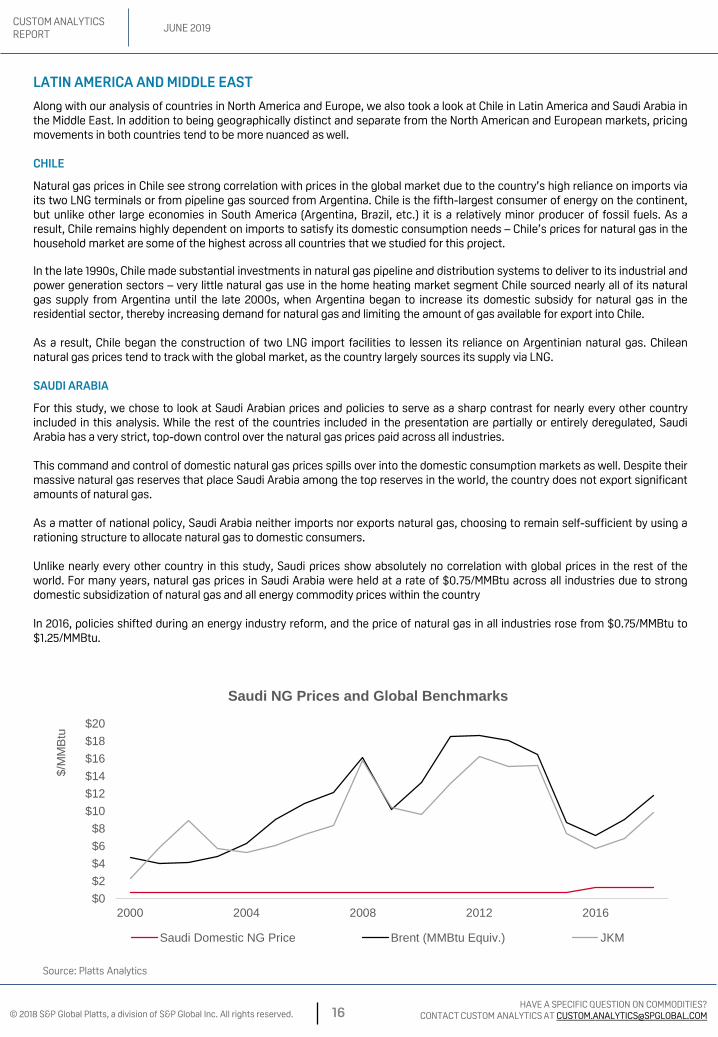
For this study, we chose to look at Saudi Arabian prices and policies to serve as a sharp contrast for nearly every other countryincluded in this analysis. While the rest of the countries included in the presentation are partially or entirely deregulated, SaudiArabia has a very strict, top-down control over the natural gas prices paid across all industries.
This command and control of domestic natural gas prices spills over into the domestic consumption markets as well. Despite theirmassive natural gas reserves that place Saudi Arabia among the top reserves in the world, the country does not export significantamounts of natural gas.
As a matter of national policy, Saudi Arabia neither imports nor exports natural gas, choosing to remain self-sufficient by using arationing structure to allocate natural gas to domestic consumers.
Unlike nearly every other country in this study, Saudi prices show absolutely no correlation with global prices in the rest of theworld. For many years, natural gas prices in Saudi Arabia were held at a rate of $0.75/MMBtu across all industries due to strongdomestic subsidization of natural gas and all energy commodity prices within the country
In 2016, policies shifted during an energy industry reform, and the price of natural gas in all industries rose from $0.75/MMBtu to$1.25/MMBtu.
$0$2$4$6$8
$10$12$14$16$18$20
2000 2004 2008 2012 2016
$/M
MB
tu
Saudi NG Prices and Global Benchmarks
Saudi Domestic NG Price Brent (MMBtu Equiv.) JKM
Source: Platts Analytics
CUSTOM ANALYTICS REPORT
JUNE 2019
© 2018 S&P Global Platts, a division of S&P Global Inc. All rights reserved. 17HAVE A SPECIFIC QUESTION ON COMMODITIES?
CONTACT CUSTOM ANALYTICS AT [email protected]
ASIA
SOUTH KOREA
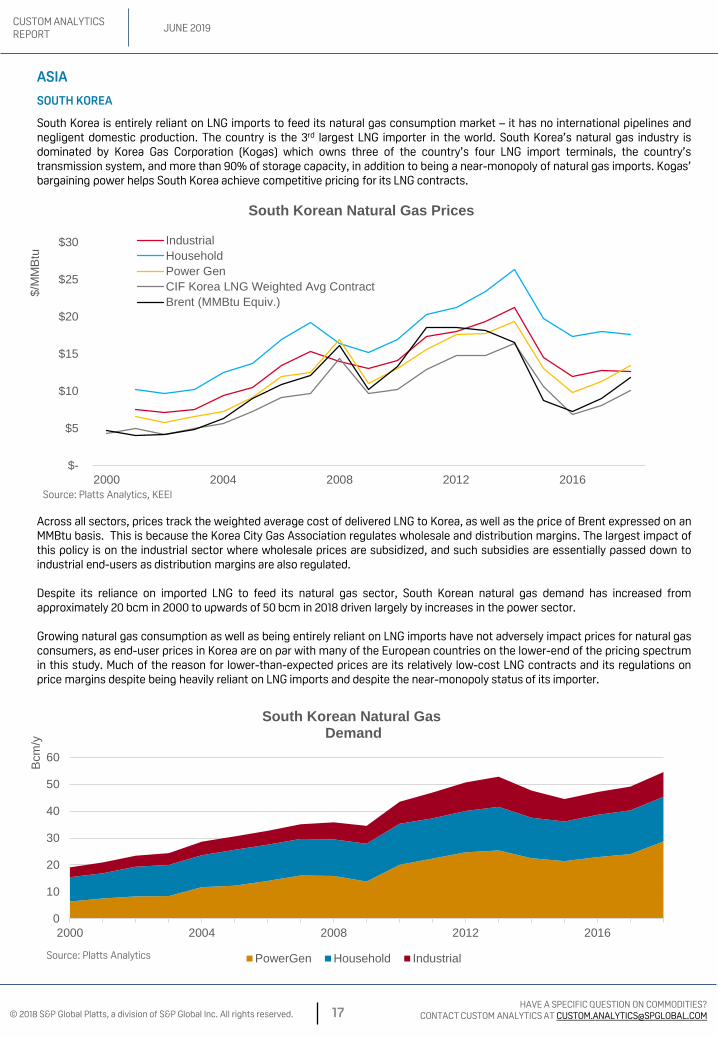
South Korea is entirely reliant on LNG imports to feed its natural gas consumption market – it has no international pipelines andnegligent domestic production. The country is the 3rd largest LNG importer in the world. South Korea’s natural gas industry isdominated by Korea Gas Corporation (Kogas) which owns three of the country’s four LNG import terminals, the country’stransmission system, and more than 90% of storage capacity, in addition to being a near-monopoly of natural gas imports. Kogas’bargaining power helps South Korea achieve competitive pricing for its LNG contracts.
$-
$5
$10
$15
$20
$25
$30
2000 2004 2008 2012 2016
$/M
MB
tu
South Korean Natural Gas Prices
IndustrialHouseholdPower GenCIF Korea LNG Weighted Avg ContractBrent (MMBtu Equiv.)
0
10
20
30
40
50
60
2000 2004 2008 2012 2016
Bcm
/y
South Korean Natural GasDemand
PowerGen Household Industrial
Across all sectors, prices track the weighted average cost of delivered LNG to Korea, as well as the price of Brent expressed on anMMBtu basis. This is because the Korea City Gas Association regulates wholesale and distribution margins. The largest impact ofthis policy is on the industrial sector where wholesale prices are subsidized, and such subsidies are essentially passed down toindustrial end-users as distribution margins are also regulated.
Despite its reliance on imported LNG to feed its natural gas sector, South Korean natural gas demand has increased fromapproximately 20 bcm in 2000 to upwards of 50 bcm in 2018 driven largely by increases in the power sector.
Growing natural gas consumption as well as being entirely reliant on LNG imports have not adversely impact prices for natural gasconsumers, as end-user prices in Korea are on par with many of the European countries on the lower-end of the pricing spectrumin this study. Much of the reason for lower-than-expected prices are its relatively low-cost LNG contracts and its regulations onprice margins despite being heavily reliant on LNG imports and despite the near-monopoly status of its importer.
Source: Platts Analytics, KEEI
Source: Platts Analytics
CUSTOM ANALYTICS REPORT
JUNE 2019
© 2018 S&P Global Platts, a division of S&P Global Inc. All rights reserved. 18HAVE A SPECIFIC QUESTION ON COMMODITIES?
CONTACT CUSTOM ANALYTICS AT [email protected]
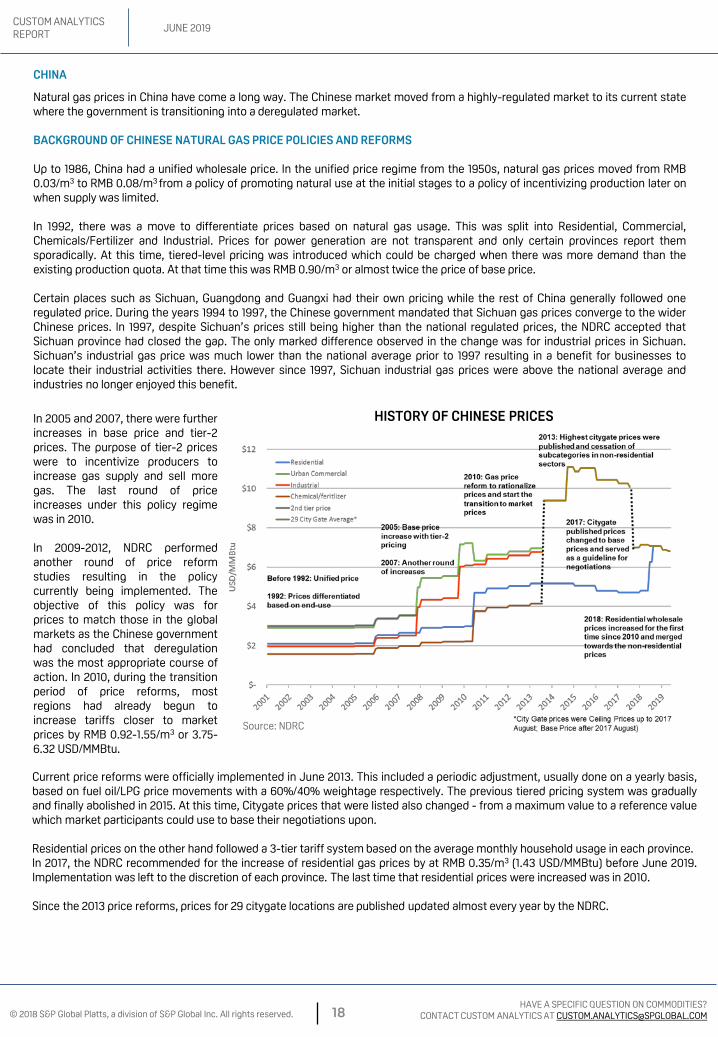
Current price reforms were officially implemented in June 2013. This included a periodic adjustment, usually done on a yearly basis,based on fuel oil/LPG price movements with a 60%/40% weightage respectively. The previous tiered pricing system was graduallyand finally abolished in 2015. At this time, Citygate prices that were listed also changed - from a maximum value to a reference valuewhich market participants could use to base their negotiations upon.
Residential prices on the other hand followed a 3-tier tariff system based on the average monthly household usage in each province.In 2017, the NDRC recommended for the increase of residential gas prices by at RMB 0.35/m3 (1.43 USD/MMBtu) before June 2019.Implementation was left to the discretion of each province. The last time that residential prices were increased was in 2010.
Since the 2013 price reforms, prices for 29 citygate locations are published updated almost every year by the NDRC.
CHINA
Natural gas prices in China have come a long way. The Chinese market moved from a highly-regulated market to its current statewhere the government is transitioning into a deregulated market.
BACKGROUND OF CHINESE NATURAL GAS PRICE POLICIES AND REFORMS
Up to 1986, China had a unified wholesale price. In the unified price regime from the 1950s, natural gas prices moved from RMB0.03/m3 to RMB 0.08/m3 from a policy of promoting natural use at the initial stages to a policy of incentivizing production later onwhen supply was limited.
In 1992, there was a move to differentiate prices based on natural gas usage. This was split into Residential, Commercial,Chemicals/Fertilizer and Industrial. Prices for power generation are not transparent and only certain provinces report themsporadically. At this time, tiered-level pricing was introduced which could be charged when there was more demand than theexisting production quota. At that time this was RMB 0.90/m3 or almost twice the price of base price.
Certain places such as Sichuan, Guangdong and Guangxi had their own pricing while the rest of China generally followed oneregulated price. During the years 1994 to 1997, the Chinese government mandated that Sichuan gas prices converge to the widerChinese prices. In 1997, despite Sichuan’s prices still being higher than the national regulated prices, the NDRC accepted thatSichuan province had closed the gap. The only marked difference observed in the change was for industrial prices in Sichuan.Sichuan’s industrial gas price was much lower than the national average prior to 1997 resulting in a benefit for businesses tolocate their industrial activities there. However since 1997, Sichuan industrial gas prices were above the national average andindustries no longer enjoyed this benefit.
In 2005 and 2007, there were furtherincreases in base price and tier-2prices. The purpose of tier-2 priceswere to incentivize producers toincrease gas supply and sell moregas. The last round of priceincreases under this policy regimewas in 2010.
In 2009-2012, NDRC performedanother round of price reformstudies resulting in the policycurrently being implemented. Theobjective of this policy was forprices to match those in the globalmarkets as the Chinese governmenthad concluded that deregulationwas the most appropriate course ofaction. In 2010, during the transitionperiod of price reforms, mostregions had already begun toincrease tariffs closer to marketprices by RMB 0.92-1.55/m3 or 3.75-6.32 USD/MMBtu.
Source: NDRC
HISTORY OF CHINESE PRICES
CUSTOM ANALYTICS REPORT
JUNE 2019
© 2018 S&P Global Platts, a division of S&P Global Inc. All rights reserved. 19HAVE A SPECIFIC QUESTION ON COMMODITIES?
CONTACT CUSTOM ANALYTICS AT [email protected]
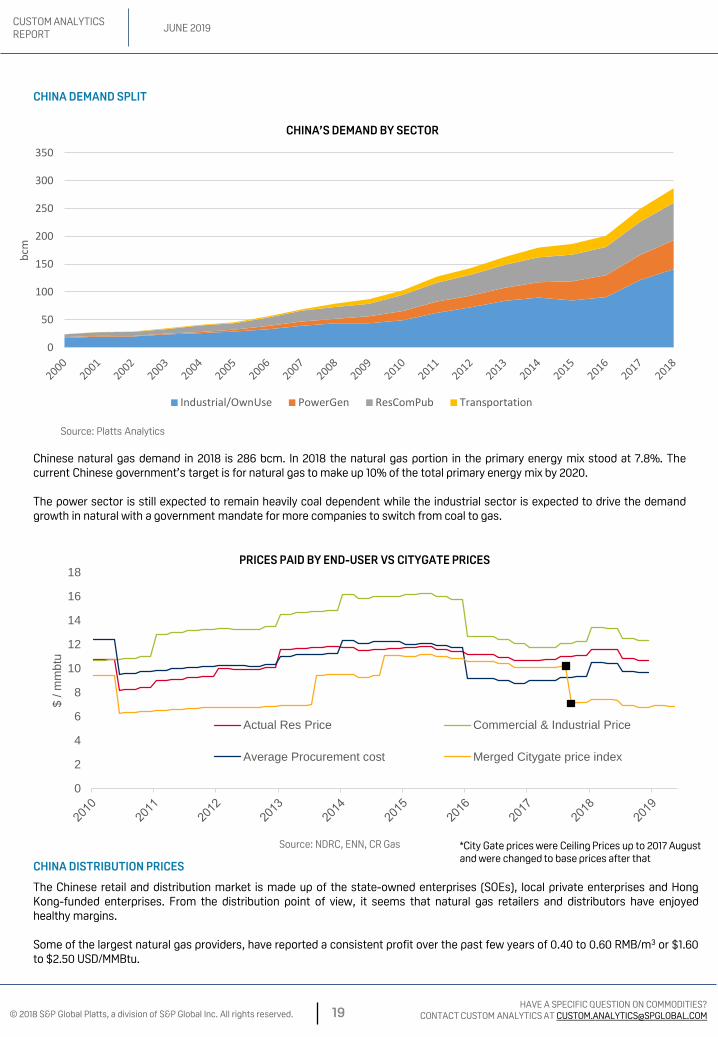
Chinese natural gas demand in 2018 is 286 bcm. In 2018 the natural gas portion in the primary energy mix stood at 7.8%. Thecurrent Chinese government’s target is for natural gas to make up 10% of the total primary energy mix by 2020.
The power sector is still expected to remain heavily coal dependent while the industrial sector is expected to drive the demandgrowth in natural with a government mandate for more companies to switch from coal to gas.
CHINA DEMAND SPLIT
Source: Platts Analytics
Source: NDRC, ENN, CR Gas
The Chinese retail and distribution market is made up of the state-owned enterprises (SOEs), local private enterprises and HongKong-funded enterprises. From the distribution point of view, it seems that natural gas retailers and distributors have enjoyedhealthy margins.
Some of the largest natural gas providers, have reported a consistent profit over the past few years of 0.40 to 0.60 RMB/m3 or $1.60to $2.50 USD/MMBtu.
0
50
100
150
200
250
300
350
bcm
Industrial/OwnUse PowerGen ResComPub Transportation
CHINA’S DEMAND BY SECTOR
PRICES PAID BY END-USER VS CITYGATE PRICES
CHINA DISTRIBUTION PRICES
0
2
4
6
8
10
12
14
16
18
$ / m
mbt
u
Actual Res Price Commercial & Industrial Price
Average Procurement cost Merged Citygate price index
*City Gate prices were Ceiling Prices up to 2017 August and were changed to base prices after that
CUSTOM ANALYTICS REPORT
JUNE 2019
© 2018 S&P Global Platts, a division of S&P Global Inc. All rights reserved. 20HAVE A SPECIFIC QUESTION ON COMMODITIES?
CONTACT CUSTOM ANALYTICS AT [email protected]
*Asia Weighted Contract Price is a volume-weighted price, calculated based on customs data for imported LNG into Southeast Asia and Northeast Asia
$-
$2
$4
$6
$8
$10
$12
$14
$16
$18
2002 2006 2010 2014 2018
$/M
MB
tu
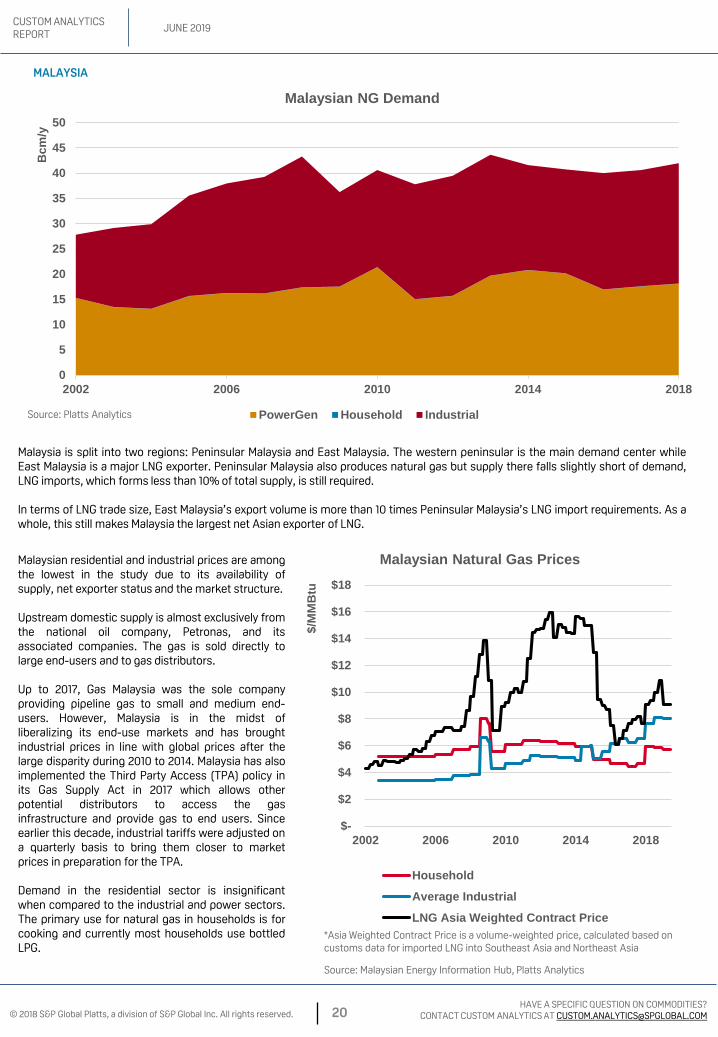
Malaysian Natural Gas Prices
Household
Average Industrial
LNG Asia Weighted Contract Price
MALAYSIA
Source: Platts Analytics
Source: Malaysian Energy Information Hub, Platts Analytics
0
5
10
15
20
25
30
35
40
45
50
2002 2006 2010 2014 2018
Bcm
/y
Malaysian NG Demand
PowerGen Household Industrial
Malaysia is split into two regions: Peninsular Malaysia and East Malaysia. The western peninsular is the main demand center whileEast Malaysia is a major LNG exporter. Peninsular Malaysia also produces natural gas but supply there falls slightly short of demand,LNG imports, which forms less than 10% of total supply, is still required.
In terms of LNG trade size, East Malaysia’s export volume is more than 10 times Peninsular Malaysia’s LNG import requirements. As awhole, this still makes Malaysia the largest net Asian exporter of LNG.
Malaysian residential and industrial prices are amongthe lowest in the study due to its availability ofsupply, net exporter status and the market structure.
Upstream domestic supply is almost exclusively fromthe national oil company, Petronas, and itsassociated companies. The gas is sold directly tolarge end-users and to gas distributors.
Up to 2017, Gas Malaysia was the sole companyproviding pipeline gas to small and medium end-users. However, Malaysia is in the midst ofliberalizing its end-use markets and has broughtindustrial prices in line with global prices after thelarge disparity during 2010 to 2014. Malaysia has alsoimplemented the Third Party Access (TPA) policy inits Gas Supply Act in 2017 which allows otherpotential distributors to access the gasinfrastructure and provide gas to end users. Sinceearlier this decade, industrial tariffs were adjusted ona quarterly basis to bring them closer to marketprices in preparation for the TPA.
Demand in the residential sector is insignificantwhen compared to the industrial and power sectors.The primary use for natural gas in households is forcooking and currently most households use bottledLPG.
CUSTOM ANALYTICS REPORT
JUNE 2019
© 2018 S&P Global Platts, a division of S&P Global Inc. All rights reserved. 21HAVE A SPECIFIC QUESTION ON COMMODITIES?
CONTACT CUSTOM ANALYTICS AT [email protected]
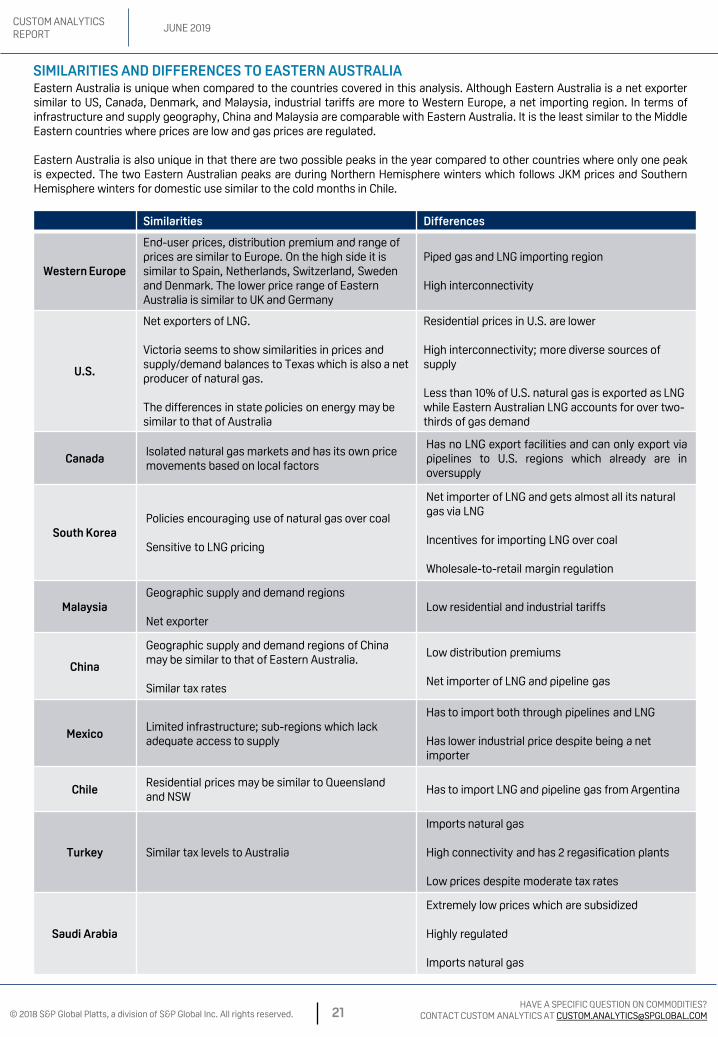
SIMILARITIES AND DIFFERENCES TO EASTERN AUSTRALIA
Similarities Differences
Western Europe
End-user prices, distribution premium and range of prices are similar to Europe. On the high side it is similar to Spain, Netherlands, Switzerland, Sweden and Denmark. The lower price range of Eastern Australia is similar to UK and Germany
Piped gas and LNG importing region
High interconnectivity
U.S.
Net exporters of LNG.
Victoria seems to show similarities in prices and supply/demand balances to Texas which is also a net producer of natural gas.
The differences in state policies on energy may be similar to that of Australia
Residential prices in U.S. are lower
High interconnectivity; more diverse sources of supply
Less than 10% of U.S. natural gas is exported as LNG while Eastern Australian LNG accounts for over two-thirds of gas demand
CanadaIsolated natural gas markets and has its own price movements based on local factors
Has no LNG export facilities and can only export viapipelines to U.S. regions which already are inoversupply
South KoreaPolicies encouraging use of natural gas over coal
Sensitive to LNG pricing
Net importer of LNG and gets almost all its natural gas via LNG
Incentives for importing LNG over coal
Wholesale-to-retail margin regulation
MalaysiaGeographic supply and demand regions
Net exporterLow residential and industrial tariffs
China
Geographic supply and demand regions of China may be similar to that of Eastern Australia.
Similar tax rates
Low distribution premiums
Net importer of LNG and pipeline gas
MexicoLimited infrastructure; sub-regions which lack adequate access to supply
Has to import both through pipelines and LNG
Has lower industrial price despite being a net importer
ChileResidential prices may be similar to Queensland and NSW
Has to import LNG and pipeline gas from Argentina
Turkey Similar tax levels to Australia
Imports natural gas
High connectivity and has 2 regasification plants
Low prices despite moderate tax rates
Saudi Arabia
Extremely low prices which are subsidized
Highly regulated
Imports natural gas
Eastern Australia is unique when compared to the countries covered in this analysis. Although Eastern Australia is a net exportersimilar to US, Canada, Denmark, and Malaysia, industrial tariffs are more to Western Europe, a net importing region. In terms ofinfrastructure and supply geography, China and Malaysia are comparable with Eastern Australia. It is the least similar to the MiddleEastern countries where prices are low and gas prices are regulated.
Eastern Australia is also unique in that there are two possible peaks in the year compared to other countries where only one peakis expected. The two Eastern Australian peaks are during Northern Hemisphere winters which follows JKM prices and SouthernHemisphere winters for domestic use similar to the cold months in Chile.
CUSTOM ANALYTICS REPORT
JUNE 2019
© 2018 S&P Global Platts, a division of S&P Global Inc. All rights reserved. 22HAVE A SPECIFIC QUESTION ON COMMODITIES?
CONTACT CUSTOM ANALYTICS AT [email protected]
SUMMARY AND CONCLUSION
Other than markets which are regulated, the key price drivers are seasonal demand and related supply/demandfundamentals. These prices are closely linked to oil, NBP/TTF and JKM.
Price levels in general are determined by each country’s end-user tax policies and access to diverse sources of natural gas.Countries’ policies on taxes, subsidies and energy preferences generally play a much larger factor on tariffs than the cost ofLNG or imported pipeline gas. Residential price premiums of distributed gas to wholesale and to citygate prices vary widelyfor different countries and Eastern Australia tariffs are similar to those in European countries. Industrial prices are typicallyclose to wholesale or citygate prices. Eastern Australia tariffs are competitive in relation to European countries with lowertariffs but are more expensive than other countries which are net exporters of natural gas or LNG.
The Eastern Australia market is unique with a mixed set of similarities and differences to other countries’ gas markets. Eventhough Eastern Australia is a net exporter, it has some symptoms of an importing nation. Its highest gas demand comesfrom LNG exports, accounting for over two-thirds of total demand.
In terms of similarities to another developed country where infrastructure considerations strongly impacts prices, Canadaor parts of Canada comes the closest. Canada is in essence in an opposite situation where there is too much supply and adearth of infrastructure to export the gas which causes prices to be low. In the case of Eastern Australia, there is ampleinfrastructure for gas to be exported to LNG markets. This causes a potential shortage for domestic use with no alternatesupply coming from either Western Australia or from regasification terminals.
This leads to Eastern Australia potentially having two peaks each year, different from other countries which normally haveone seasonal peak. Eastern Australia potentially peaks during the Northern Hemisphere winters which follows JKM pricesand during the Southern Hemisphere winters for domestic use. Eastern Australia is exposed to the upside of global LNGprices but lacks exposure to the downside of global LNG prices.
Although Eastern Australia has similar price linkages to Asian countries via LNG, there is a key difference - most Asiancountries have some form of regulation or policies which limit prices to industries and/or residential sectors while EasternAustralia does not.
Finally, if all infrastructure is fully developed and Eastern Australia is connected to all possible gas supply sources, it mayhave a similar setup to the Chinese coastal cities which has access to domestic gas from the western states andregasification terminals. However, it may not be economically viable for Eastern Australia, which is naturally net surplus onnatural gas, to build infrastructure to and connect to all possible supply sources like China. Aside from economic feasibility,the different state laws and policies within Australia also present a hurdle on implementing such projects.
CUSTOM ANALYTICS REPORT
JUNE 2019
© 2018 S&P Global Platts, a division of S&P Global Inc. All rights reserved. 23HAVE A SPECIFIC QUESTION ON COMMODITIES?
CONTACT CUSTOM ANALYTICS AT [email protected]
METHODOLOGY
Data of end-user tariffs provided in the study were sourced from publicly-available information, Platts proprietary databaseand survey data, and were converted to a US dollar per million British units basis. Wherever available, prices were providedfor residential, industrial, power and other sectors on a monthly, quarterly or yearly basis.
Delivered end-user prices are defined as the full price that end users would pay including all costs to receive natural gas.Wherever applicable in each country, end-user prices could include the following:
1) Production costs of natural gas at the wellhead including royalties and taxes2) Transmission costs of natural gas to the point of wholesale prices3) LNG wholesale prices4) Wholesale natural gas margins5) Transmission and distribution costs to end-users6) Retail margins7) End-user taxes8) Subsidies, regulations and other pricing policies
The three levels of end-user taxes are low, medium and high defined as (i) 10% and under, (ii) between 10-20%, and (iii)above 20% respectively.
If a country exports more natural gas and LNG than it imports, they are considered a net exporter. Conversely, if they importmore than they export, they are considered net importers.
All demand and consumption data do not include feed gas consumption from LNG liquefaction terminals unless explicitlystated.
Conversion rates:1 MMBtu = 1.055 GJ1 cubic meter of natural gas = 0.0362 MMBtu
Japan has been omitted from the study because 2018 data was not available at the time of the study. It is worth noting thatJapanese industrial tariffs are historically similar to South Korean industrial tariffs while Japanese residential tariffs werebetween $30/MMBtu and $40/MMBtu in the recent 10 years where data is available.
All LNG and oil indices including Platts JKMTM and Platts Dated Brent are Platts proprietary data.
© 2019 S&P Global Platts, a division of S&P Global Inc. All rights reserved.
The names “S&P Global Platts” and “Platts” and the S&P Global Platts logo are trademarks of S&P Global Inc. Permission for any commercial use of the S&P Global
Platts logo must be granted in writing by S&P Global Inc.
You may view or otherwise use the information, prices, indices, assessments and other related information, graphs, tables and images (“Data”) in this publication
only for your personal use or, if you or your company has a license for the Data from S&P Global Platts and you are an authorized user, for your company’s internal
business use only. You may not publish, reproduce, extract, distribute, retransmit, resell, create any derivative work from and/or otherwise provide access to the
Data or any portion thereof to any person (either within or outside your company, including as part of or via any internal electronic system or intranet), firm or
entity, including any subsidiary, parent, or other entity that is affiliated with your company, without S&P Global Platts’ prior written consent or as otherwise
authorized under license from S&P Global Platts. Any use or distribution of the Data beyond the express uses authorized in this paragraph above is subject to the
payment of additional fees to S&P Global Platts.
S&P Global Platts, its affiliates and all of their third-party licensors disclaim any and all warranties, express or implied, including, but not limited to, any warranties
of merchantability or fitness for a particular purpose or use as to the Data, or the results obtained by its use or as to the performance thereof. Data in this
publication includes independent and verifiable data collected from actual market participants. Any user of the Data should not rely on any information and/or
assessment contained therein in making any investment, trading, risk management or other decision. S&P Global Platts, its affiliates and their third-party licensors
do not guarantee the adequacy, accuracy, timeliness and/or completeness of the Data or any component thereof or any communications (whether written, oral,
electronic or in other format), and shall not be subject to any damages or liability, including but not limited to any indirect, special, incidental, punitive or
consequential damages (including but not limited to, loss of profits, trading losses and loss of goodwill).
ICE index data and NYMEX futures data used herein are provided under S&P Global Platts’ commercial licensing agreements with ICE and with NYMEX. You
acknowledge that the ICE index data and NYMEX futures data herein are confidential and are proprietary trade secrets and data of ICE and NYMEX or its
licensors/suppliers, and you shall use best efforts to prevent the unauthorized publication, disclosure or copying of the ICE index data and/or NYMEX futures data.
Permission is granted for those registered with the Copyright Clearance Center (CCC) to copy material herein for internal reference or personal use only, provided
that appropriate payment is made to the CCC, 222 Rosewood Drive, Danvers, MA 01923, phone +1-978-750-8400. Reproduction in any other form, or for any other
purpose, is forbidden without the express prior permission of S&P Global Inc. For article reprints contact: The YGS Group, phone +1-717-505-9701 x105 (800-501-
9571 from the U.S.).
For all other queries or requests pursuant to this notice, please contact S&P Global Inc. via email at [email protected].
CUSTOM ANALYTICS REPORT
JUNE 2019
© 2018 S&P Global Platts, a division of S&P Global Inc. All rights reserved. 24HAVE A SPECIFIC QUESTION ON COMMODITIES?
CONTACT CUSTOM ANALYTICS AT [email protected]
DISCLAIMER