lupin limited lupin is a dominant force in global generics 8th largest generic globally (by market...
TRANSCRIPT

LUPIN LIMITEDQ2 FY18 Investor Presentation
October 30, 2017
2
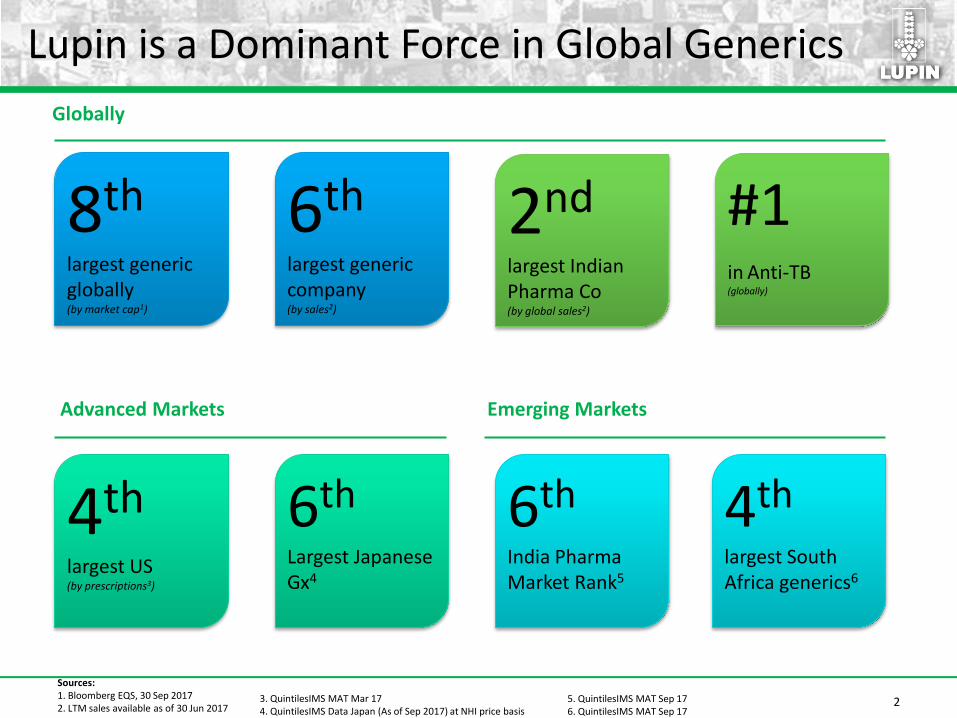
Lupin is a Dominant Force in Global Generics
8th
largest generic globally (by market cap1)
2nd
largest Indian Pharma Co (by global sales2)
6th
largest generic company(by sales2)
Globally
#1in Anti-TB(globally)
6th
India Pharma Market Rank5
4th
largest South Africa generics6
Emerging Markets
4th
largest US(by prescriptions3)
6th
Largest Japanese Gx4
Advanced Markets
Sources:1. Bloomberg EQS, 30 Sep 20172. LTM sales available as of 30 Jun 2017
3. QuintilesIMS MAT Mar 174. QuintilesIMS Data Japan (As of Sep 2017) at NHI price basis
5. QuintilesIMS MAT Sep 176. QuintilesIMS MAT Sep 17
3
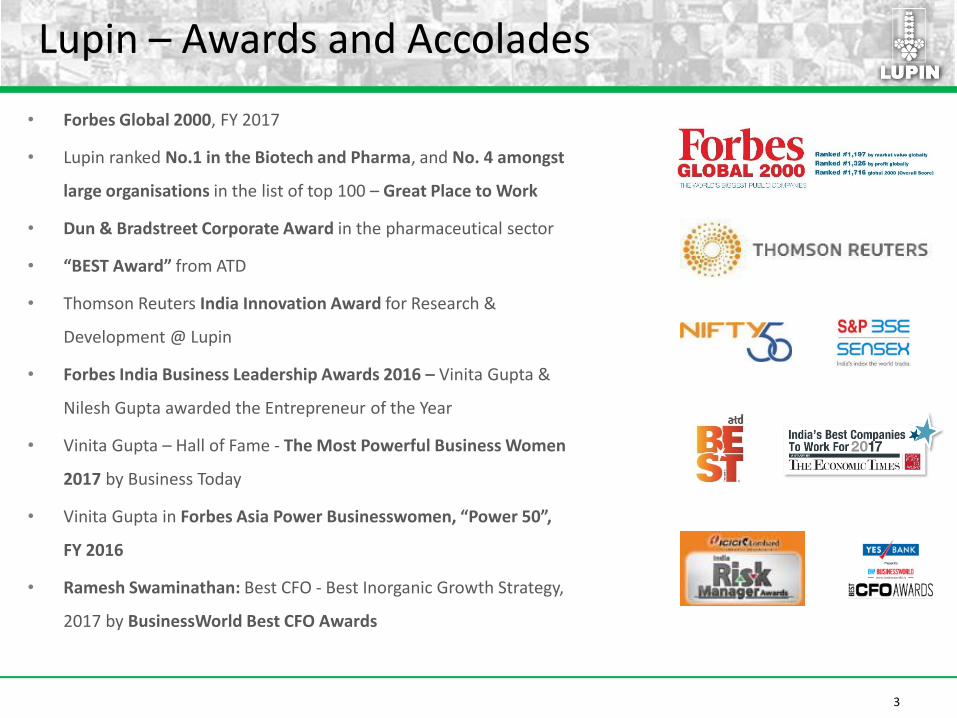
Lupin – Awards and Accolades
• Forbes Global 2000, FY 2017
• Lupin ranked No.1 in the Biotech and Pharma, and No. 4 amongst
large organisations in the list of top 100 – Great Place to Work
• Dun & Bradstreet Corporate Award in the pharmaceutical sector
• “BEST Award” from ATD
• Thomson Reuters India Innovation Award for Research &
Development @ Lupin
• Forbes India Business Leadership Awards 2016 – Vinita Gupta &
Nilesh Gupta awarded the Entrepreneur of the Year
• Vinita Gupta – Hall of Fame - The Most Powerful Business Women
2017 by Business Today
• Vinita Gupta in Forbes Asia Power Businesswomen, “Power 50”,
FY 2016
• Ramesh Swaminathan: Best CFO - Best Inorganic Growth Strategy,
2017 by BusinessWorld Best CFO Awards
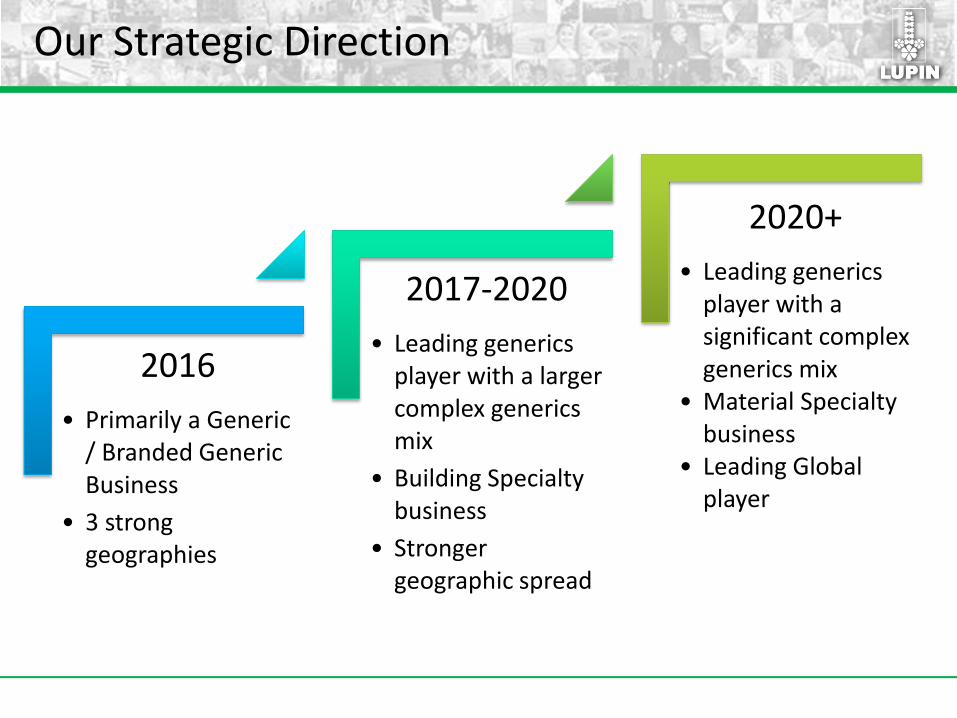
Our Strategic Direction
2016
• Primarily a Generic / Branded Generic Business
• 3 strong geographies
2017-2020
• Leading generics player with a larger complex generics mix
• Building Specialty business
• Stronger geographic spread
2020+
• Leading generics player with a significant complex generics mix
• Material Specialty business
• Leading Global player
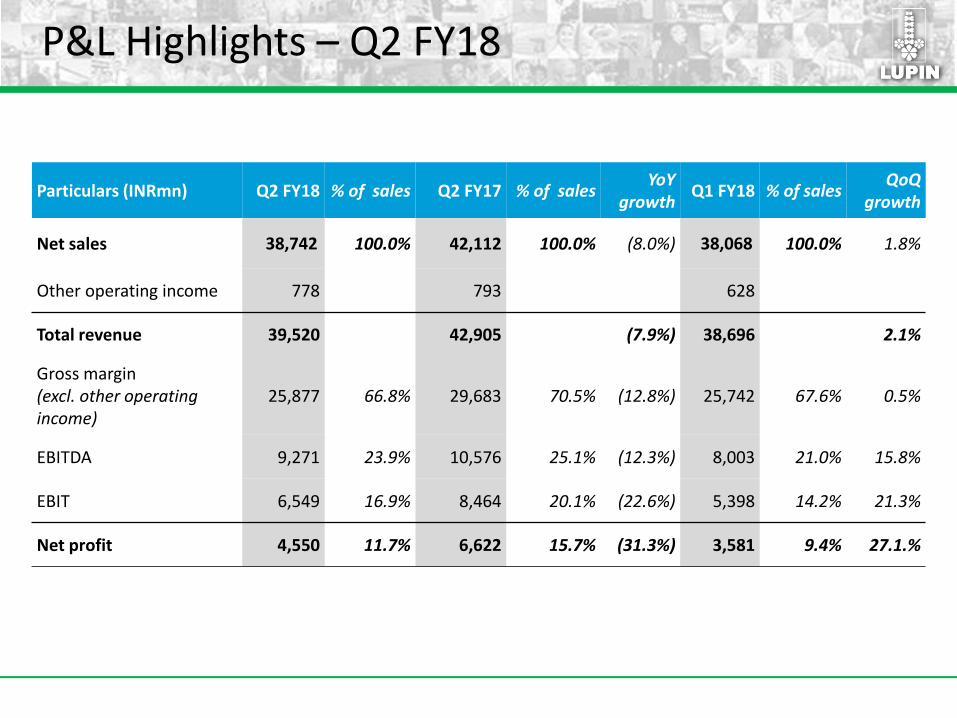
P&L Highlights – Q2 FY18
Particulars (INRmn) Q2 FY18 % of sales Q2 FY17 % of salesYoY
growth Q1 FY18 % of sales
QoQ growth
Net sales 38,742 100.0% 42,112 100.0% (8.0%) 38,068 100.0% 1.8%
Other operating income 778 793 628
Total revenue 39,520 42,905 (7.9%) 38,696 2.1%
Gross margin(excl. other operating income)
25,877 66.8% 29,683 70.5% (12.8%) 25,742 67.6% 0.5%
EBITDA 9,271 23.9% 10,576 25.1% (12.3%) 8,003 21.0% 15.8%
EBIT 6,549 16.9% 8,464 20.1% (22.6%) 5,398 14.2% 21.3%
Net profit 4,550 11.7% 6,622 15.7% (31.3%) 3,581 9.4% 27.1.%
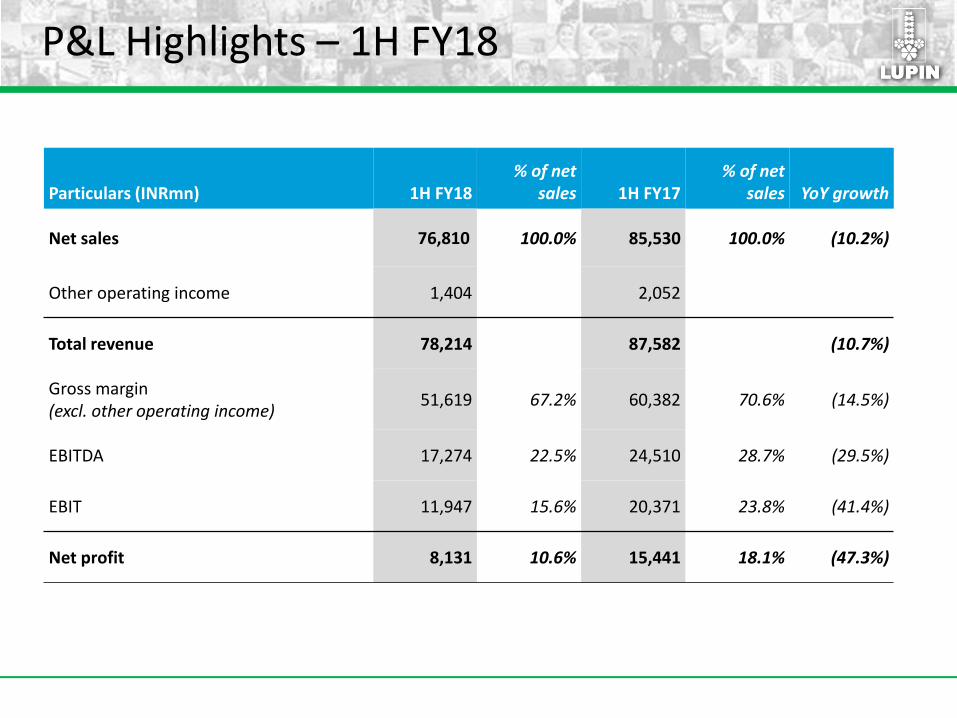
P&L Highlights – 1H FY18
Particulars (INRmn) 1H FY18% of net
sales 1H FY17% of net
sales YoY growth
Net sales 76,810 100.0% 85,530 100.0% (10.2%)
Other operating income 1,404 2,052
Total revenue 78,214 87,582 (10.7%)
Gross margin(excl. other operating income)
51,619 67.2% 60,382 70.6% (14.5%)
EBITDA 17,274 22.5% 24,510 28.7% (29.5%)
EBIT 11,947 15.6% 20,371 23.8% (41.4%)
Net profit 8,131 10.6% 15,441 18.1% (47.3%)
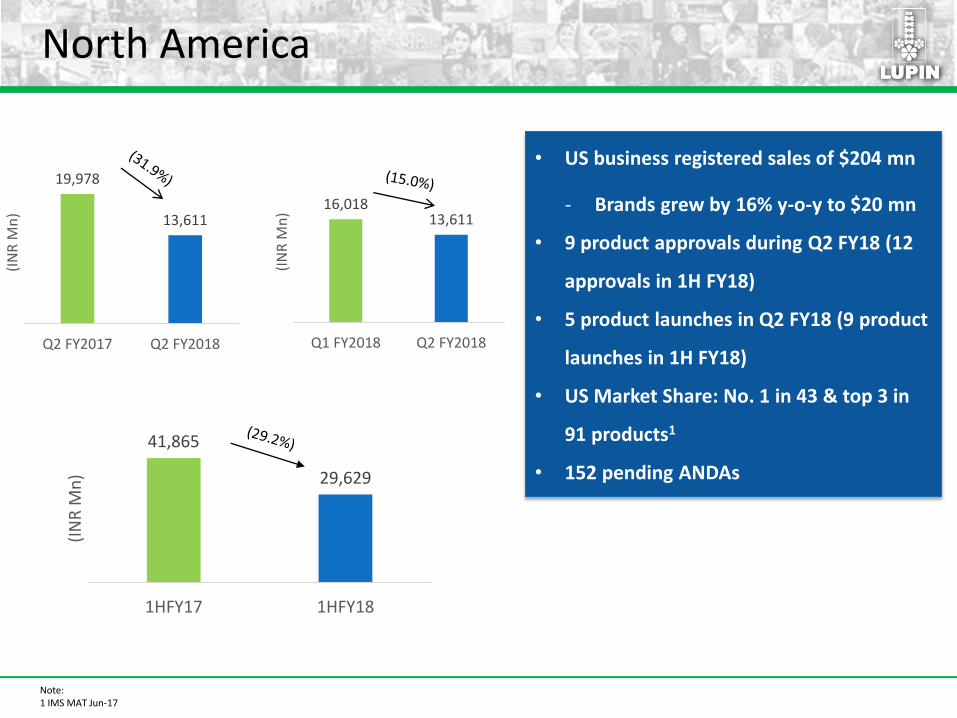
North America
• US business registered sales of $204 mn
- Brands grew by 16% y-o-y to $20 mn
• 9 product approvals during Q2 FY18 (12
approvals in 1H FY18)
• 5 product launches in Q2 FY18 (9 product
launches in 1H FY18)
• US Market Share: No. 1 in 43 & top 3 in
91 products1
• 152 pending ANDAs
Note:1 IMS MAT Jun-17
19,978
13,611
Q2 FY2017 Q2 FY2018
(IN
R M
n)
16,01813,611
Q1 FY2018 Q2 FY2018
(IN
R M
n)
41,865
29,629
1HFY17 1HFY18
(IN
R M
n)
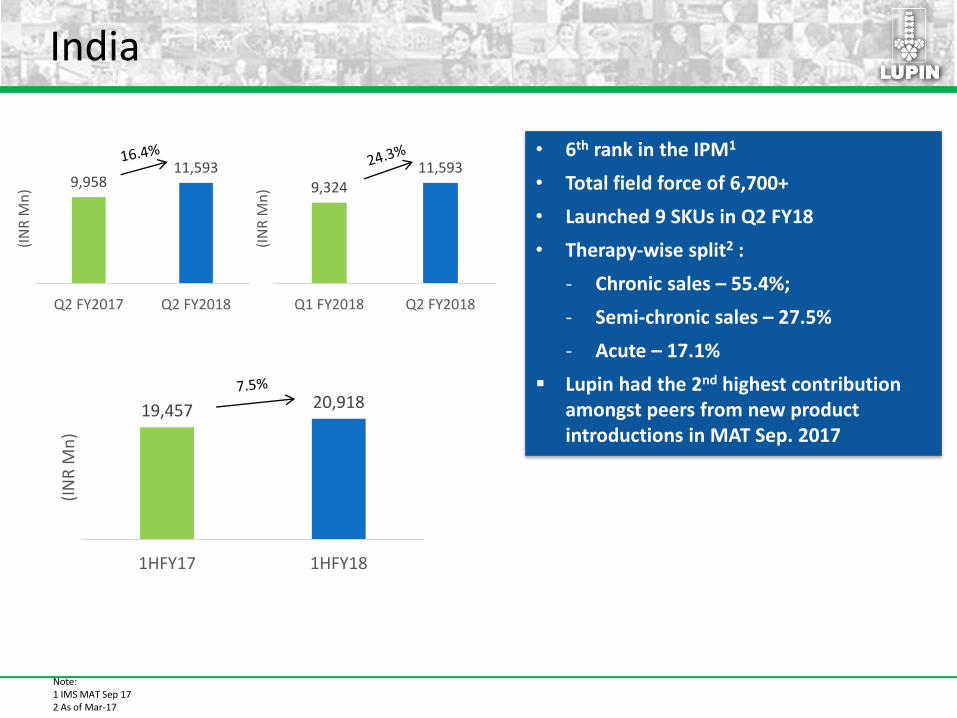
India
Note:1 IMS MAT Sep 172 As of Mar-17
• 6th rank in the IPM1
• Total field force of 6,700+
• Launched 9 SKUs in Q2 FY18
• Therapy-wise split2 :
- Chronic sales – 55.4%;
- Semi-chronic sales – 27.5%
- Acute – 17.1%
Lupin had the 2nd highest contribution amongst peers from new product introductions in MAT Sep. 2017
9,95811,593
Q2 FY2017 Q2 FY2018
(IN
R M
n) 9,324
11,593
Q1 FY2018 Q2 FY2018
(IN
R M
n)
19,457 20,918
1HFY17 1HFY18
(IN
R M
n)
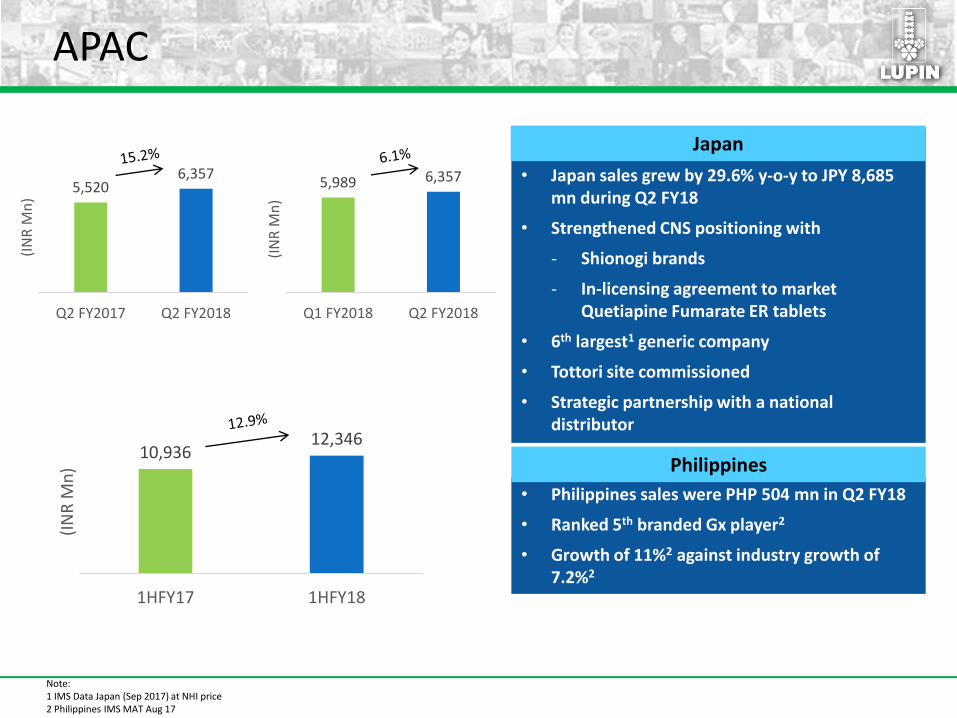
APAC
Japan
• Japan sales grew by 29.6% y-o-y to JPY 8,685 mn during Q2 FY18
• Strengthened CNS positioning with
- Shionogi brands
- In-licensing agreement to market Quetiapine Fumarate ER tablets
• 6th largest1 generic company
• Tottori site commissioned
• Strategic partnership with a national distributor
• Philippines sales were PHP 504 mn in Q2 FY18
• Ranked 5th branded Gx player2
• Growth of 11%2 against industry growth of 7.2%2
Note:1 IMS Data Japan (Sep 2017) at NHI price 2 Philippines IMS MAT Aug 17
Philippines
Japan
5,5206,357
Q2 FY2017 Q2 FY2018
(IN
R M
n)
5,989 6,357
Q1 FY2018 Q2 FY2018
(IN
R M
n)
10,93612,346
1HFY17 1HFY18
(IN
R M
n)
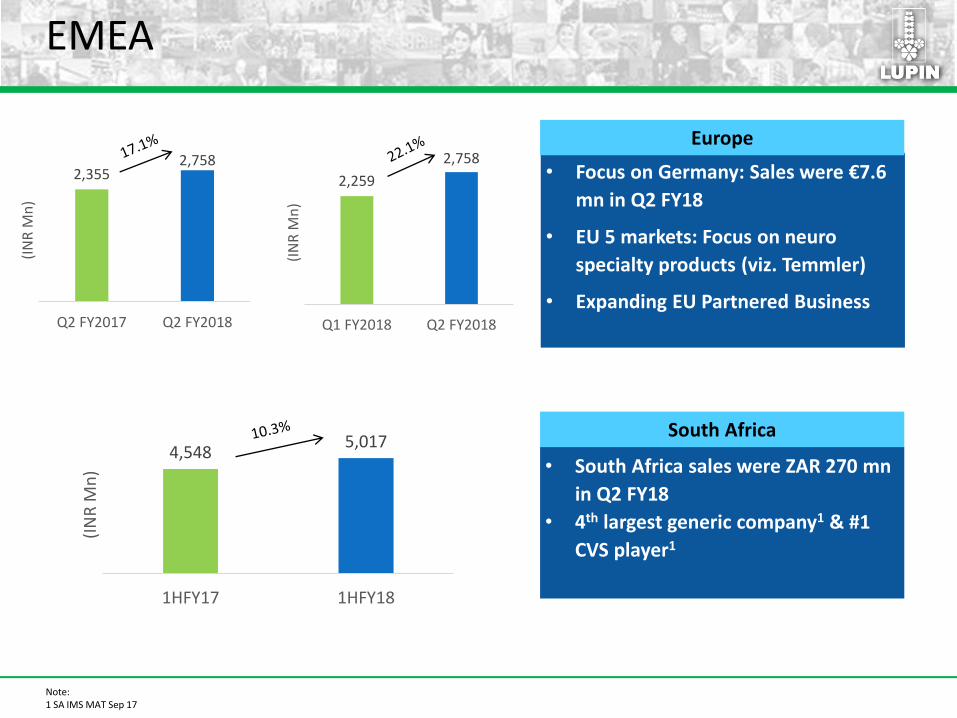
EMEA
Note:1 SA IMS MAT Sep 17
• South Africa sales were ZAR 270 mn
in Q2 FY18
• 4th largest generic company1 & #1
CVS player1
South Africa
• Focus on Germany: Sales were €7.6
mn in Q2 FY18
• EU 5 markets: Focus on neuro
specialty products (viz. Temmler)
• Expanding EU Partnered Business
Europe
2,3552,758
Q2 FY2017 Q2 FY2018
(IN
R M
n)
2,259
2,758
Q1 FY2018 Q2 FY2018
(IN
R M
n)
4,5485,017
1HFY17 1HFY18
(IN
R M
n)
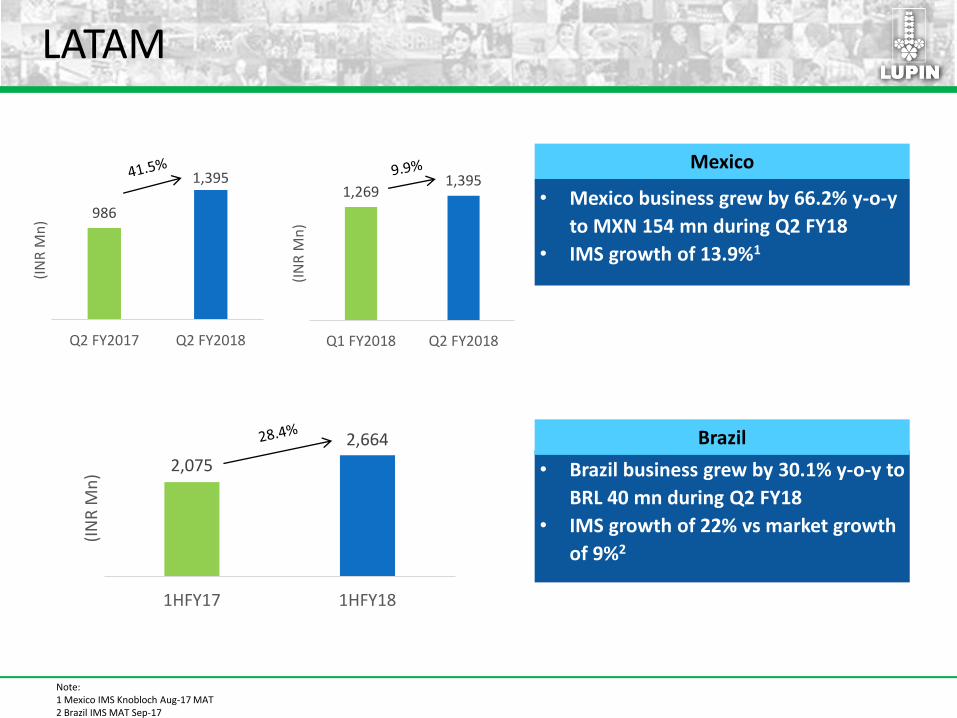
LATAM
Note:1 Mexico IMS Knobloch Aug-17 MAT2 Brazil IMS MAT Sep-17
• Mexico business grew by 66.2% y-o-y
to MXN 154 mn during Q2 FY18
• IMS growth of 13.9%1
• Brazil business grew by 30.1% y-o-y to
BRL 40 mn during Q2 FY18
• IMS growth of 22% vs market growth
of 9%2
Brazil
Mexico
986
1,395
Q2 FY2017 Q2 FY2018
(IN
R M
n)
1,2691,395
Q1 FY2018 Q2 FY2018
(IN
R M
n)
2,075
2,664
1HFY17 1HFY18
(IN
R M
n)
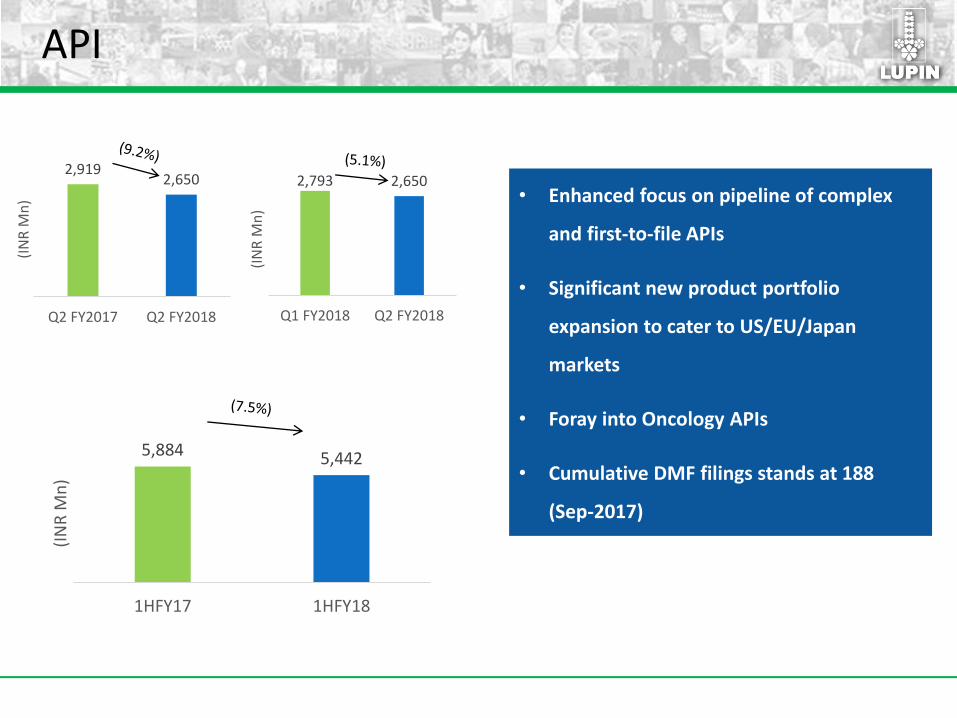
API
• Enhanced focus on pipeline of complex
and first-to-file APIs
• Significant new product portfolio
expansion to cater to US/EU/Japan
markets
• Foray into Oncology APIs
• Cumulative DMF filings stands at 188
(Sep-2017)
2,9192,650
Q2 FY2017 Q2 FY2018
(IN
R M
n)
2,793 2,650
Q1 FY2018 Q2 FY2018
(IN
R M
n)
5,884 5,442
1HFY17 1HFY18
(IN
R M
n)
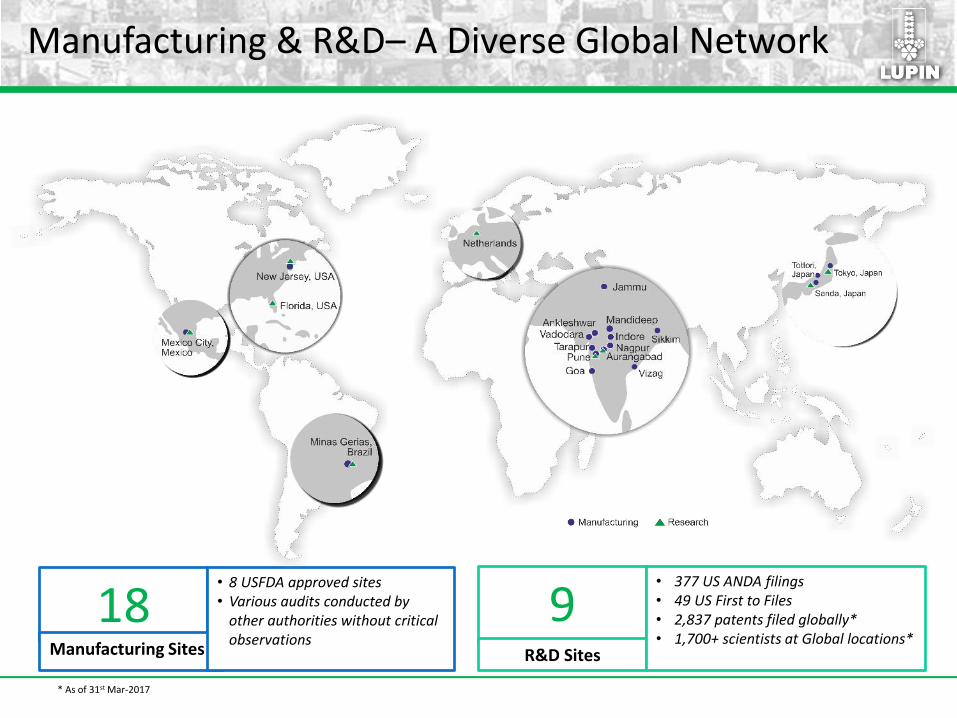
Manufacturing & R&D– A Diverse Global Network
18Manufacturing Sites
• 8 USFDA approved sites• Various audits conducted by
other authorities without critical observations
9R&D Sites
• 377 US ANDA filings• 49 US First to Files• 2,837 patents filed globally*• 1,700+ scientists at Global locations*
* As of 31st Mar-2017
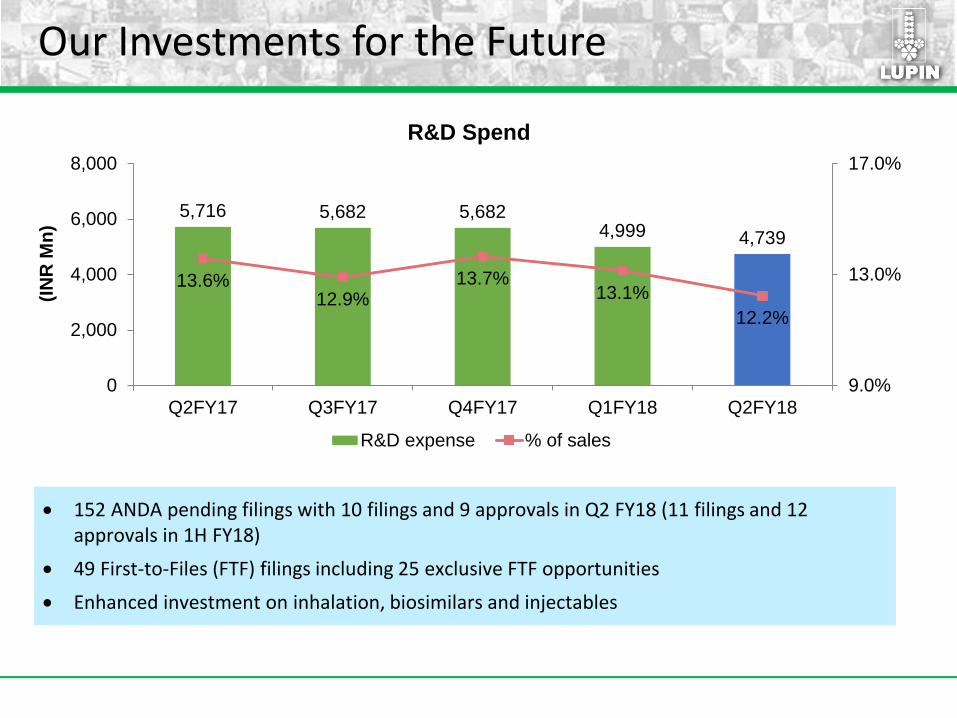
Our Investments for the Future
152 ANDA pending filings with 10 filings and 9 approvals in Q2 FY18 (11 filings and 12 approvals in 1H FY18)
49 First-to-Files (FTF) filings including 25 exclusive FTF opportunities
Enhanced investment on inhalation, biosimilars and injectables
5,716 5,682 5,6824,999 4,739
13.6%12.9%
13.7%13.1%
12.2%
9.0%
13.0%
17.0%
0
2,000
4,000
6,000
8,000
Q2FY17 Q3FY17 Q4FY17 Q1FY18 Q2FY18
(IN
R M
n)
R&D Spend
R&D expense % of sales