study on contribution of surface diffusion title on mass
TRANSCRIPT

TitleSTUDY ON CONTRIBUTION OF SURFACE DIFFUSIONON MASS TRANSFER OF ACTINIDES AND FISSIONPRODUCTS IN GRANITE( Dissertation_全文 )
Author(s) Yamaguchi, Tetsuji
Citation 京都大学
Issue Date 2001-03-23
URL https://doi.org/10.11501/3183578
Right
Type Thesis or Dissertation
Textversion author
Kyoto University

STUDY ON
CONTRIBUTION OF SURFACE DIFFUSION ON
MASS TRANSFER OF ACTINIDES AND
FISSION PRODUCTS IN GRANITE
TETSUJI YAMAGUCHI
2001

Study on Contribution of Surface Diffusion
on Mass Transfer of Actinides
and Fission Products in Granite
by
Tetsuji Yamaguchi JAERI
Tokai, Ibaraki 319-1195, Japan
January 2001

i
Abstract
When long-lived radionuclides are transported with groundwater through fractures in rock
mass surrounding a high-level radioactive waste repository, diffusion into pores in the rock
matrix and ensuing sorption onto mineral surfaces reduce the concentration of the nuclides
transported through the geosphere. Owing to this mechanism, frequently fractured rock mass
in Japan may have considerable retardation capacity against the transport of radionuclides. To
take the matrix diffusion into account in evaluating the migration of radionuclides in deep
geologic formations for the safety assessment of the repository, it is essential to understand
the mechanisms of the diffusion of radionuclides into the rock matrix and to quantify the
diffusivity.
The pore structure was characterized by water-saturation porosimetry, mercury intrusion
porosimetry and SEM observation for Inada granite that is well known domestic biotitic
granite from the Inada mine in the Ibaraki prefecture, eastern Japan. The distribution of the
pore diameter of the granite was approximately logarithmic normal; the pore structure is
uniform. The porosity was (0.49±0.07) % with the modal diameter of 160 nm. The fact that
the pore is much larger in size than the diffusing ions allows the application of the Fick’s
diffusion law to interpret the mass transfer of the aqueous species in the granite.
The effective diffusivity (De) in the Inada granite was measured for Ba2+
, Sr2+
, Mg2+
, Co2+
,
Ni2+
, UO22+
, HTO, Cs+ and I
-. A positive correlation was observed between the De value in the
granite and diffusivity in bulk solution (Dv) for most of the ions. However, an unexpectedly
high De value was obtained for strontium accompanied with high distribution ratio. Based on
this result, a model which takes into account contribution of both the surface and the pore
diffusion was proposed for the sorbed species.
A through-diffusion experiment was performed for 85
Sr2+
to examine the effect of sorption
on minerals on the diffusivity. The granite and the groundwater were obtained from 240-m
level of Underground Research Laboratory (URL) of Atomic Energy of Canada Limited
(AECL) in Manitoba, Canada. A fair amount of strontium was removed from the solution and
was adsorbed on the granite, which corresponded to the sorption distribution ratio, Rd, of
0.091 – 0.180 m3 kg
-1. Nevertheless, Rd value assessed from the apparent diffusivity and the
effective diffusivity was 0.0041 m3 kg
-1. The contribution of the surface diffusion can explain
this discrepancy; the retardation of the apparent diffusive transport is smaller than that
predicted from the sorption Rd value because part of the adsorbed strontium is mobile in
adsorbed state.
The effective diffusivity and distribution ratio of 133
Ba2+
in Inada granite have been
determined by the through-diffusion method. Experiments were performed in triplicate for

ii
0.1, 1, 10 and 102 mol m
-3 BaCl2 solution. The De value obtained for the BaCl2 concentration
of 10 mol m-3
agreed to the estimated value based on the pore diffusion model. The lower
BaCl2 concentration yielded the higher De value and higher Rd value than those for 10
mol m-3
. The variation in De was neither due to the speciation of barium in the solution nor
variation in physical properties of the pore structure in the rock. Contribution of diffusion in
adsorbed state should be responsible for the variation in De. The result is strongly indicative
of the diffusion in adsorbed state.
The effective diffusivity of 125
I- was determined in Inada granite and in compacted
bentonite by the through-diffusion method. The effective diffusivity of I- in compacted
bentonite is smaller than the value estimated based on the pore diffusion model. This is
because accessible pore space in the compacted bentonite is limited for anionic species due to
electrostatic repulsion between the species and negatively charged surface of the pores. This
was not the case for the diffusion of I- in the granite, where the size of the pore space is much
larger than the range of the electrostatic repulsion so that the accessible pore space in the
granite for anionic species is virtually the same as that for neutral and cationic species.
Effective diffusivities for uranium and plutonium, in Inada granite, of (1.42±0.29)x10-13
m2
s-1
, and (5.1±2.3)x10-14
m2 s
-1, respectively, have been obtained in a 10
2 mol m
-3 NaHCO3
solution at pH 9.3 where uranium is present predominantly as UO2(CO3)34-
. The effective
diffusivity of UO2(CO3)34-
in the granite was found to be four times larger than that of the
uncomplexed UO22+
obtained in 102 mol m
-3 KCl at pH 4. The effective diffusivity of
UO2(CO3)34-
in the granite and the estimated bulk diffusivity of this species, (6.6±0.4)x10-10
m2 s
-1, are consistent with an empirical correlation between De and Dv obtained in this study.
The diffusivity of neptunium and plutonium in the granite was also studied by the
through-diffusion method under reducing conditions in atmosphere-controlled chambers in
which oxygen concentration was lower than a few ppm. A 103 mol m
-3 NaHCO3 solution was
used in the neptunium experiment where neptunium is present as Np(CO3)44-
and Np(CO3)56-
.
A De value of (4.0±1.5)x10-13
m2 s
-1 and a rock capacity factor (+Rd) value of 0.15±0.22
were obtained. A 102 mol m
-3 NaHCO3 solution was used in the plutonium experiment where
plutonium is present predominantly as Pu(CO3)2(OH)22-
. A De value of (2.0±1.4)x10-13
m2 s
-1
and a (+Rd) value of 1.5±0.7 were obtained. The effective diffusivities for Np and Pu were
also considered to be consistent with the pore diffusion model. Another diffusion experiment
for plutonium through granite from URL was performed using the groundwater obtained from
the same location. Most of the Pu initially contained in the source reservoir was adsorbed on
the granite and diffusion through 5x10⁻³
-m thick granite was not observed in the experimental
period of 945 days. Enhancement of the diffusivity by surface diffusion was not observed even in
the case that Pu was significantly adsorbed on granite. The contribution of the surface diffusion

iii
is insignificant for actinide carbonate complexes which are adsorbed on the mineral surfaces
through chemical reactions or surface complexation.
In order to predict the diffusing species of Pu, equilibrium constant for Pu(IV) carbonate
complex species was determined and compiled in a database. Solubility of Pu(IV) was
measured over a total carbonate concentration range of 10-4
to 10-1
mol kg-1
. The measured
solubility was proportional to the square of the bicarbonate concentration at the pH range of
9.4 - 10.1. The equilibrium constant of
PuO2·xH2O + 2HCO3- = Pu(CO3)2(OH)2
2- + xH2O K=10
-2.7±0.5
was obtained at ionic strength of 0.1 mol kg-1
. At pH 12 and 13 where carbonate ion is
dominant, the equilibrium constant of
PuO2·xH2O + 2CO32-
= Pu(CO3)2(OH)44-
+ (x-2)H2O K=10-4.98±0.31
was obtained. Literatures were reviewed to compile equilibrium constant of formation of
aqueous species and compounds for Np and Pu for the speciation of these elements.
Aqueous species including actinide complex species can diffuse into micro-pores in intact
granites. The diffusivity can be higher than the value expected from the pore-diffusion model
due to the contribution of the surface diffusion. Both the pore and the surface diffusion should
be considered to predict diffusive behavior of radionuclides in geosphere and in engineered
barrier system.

iv
Contents
1. General introduction ___________________________________________________ 1
1.1. Background _______________________________________________________ 1
1.2. Previous studies ___________________________________________________ 1
1.3. Objective of this study ______________________________________________ 4
2. Microporous structures _________________________________________________ 5
2.1. Introduction _______________________________________________________ 5
2.2. Experimental ______________________________________________________ 5
2.3. Results and discussion ______________________________________________ 8
2.4. Conclusion ________________________________________________________ 9
3. Relationship between De and Dv ________________________________________ 19
3.1. Introduction ______________________________________________________ 19
3.2. Experimental _____________________________________________________ 20
3.3. Data analysis _____________________________________________________ 22
3.4. Results ___________________________________________________________ 23
3.5. Discussion ________________________________________________________ 24
3.6. Conclusion _______________________________________________________ 27
4. Effect of adsorption on apparent diffusivity in granite ____________________ 45
4.1. Introduction ______________________________________________________ 45
4.2. Experimental _____________________________________________________ 45
4.3. Results and Discussion ____________________________________________ 47
4.4. Conclusion _______________________________________________________ 50
5. Diffusive behavior of cationic species ___________________________________ 58
5.1. Introduction ______________________________________________________ 58
5.2. Experimental _____________________________________________________ 58
5.3. Results ___________________________________________________________ 59
5.4. Discussion ________________________________________________________ 61

v
5.5. Conclusion _______________________________________________________ 62
6. Diffusive behavior of anionic species ____________________________________ 70
6.1. Introduction ______________________________________________________ 70
6.2. Experimental _____________________________________________________ 70
6.3. Results and discussion _____________________________________________ 72
6.4. Conclusion _______________________________________________________ 72
7. Diffusive behavior of actinide carbonate complexes _______________________ 79
7.1. Introduction ______________________________________________________ 79
7.2. Experimental _____________________________________________________ 79
7.3. Results ___________________________________________________________ 83
7.4. Discussion ________________________________________________________ 86
7.5. Conclusion _______________________________________________________ 89
8. Thermodynamic data acquisition and data compilation __________________ 105
8.1. Introduction _____________________________________________________ 105
8.2. Experimental ____________________________________________________ 106
8.3. Results and discussion ____________________________________________ 107
8.4. Thermodynamic data compilation __________________________________ 110
9. Concluding remarks _________________________________________________ 125
Acknowledgement _____________________________________________________ 127
References ____________________________________________________________ 128

1
1. General introduction
1.1. Background
After emplacement of high-level radioactive waste in a deep underground repository,
long-lived radionuclides may be leached from the wastes and may subsequently be
transported through the surrounding rock mass. One may not expect retardation capacity
against radionuclide transport to the rock mass in Japan, where water-bearing fractures are
frequently observed due to diastrophism. If the pores or micro fissures in the rock matrix are
accessible to the radionuclides transported with groundwater through the fractures in the rock
surrounding the repository, diffusion into the pores or micro fissures in the rock matrix and
ensuing sorption onto mineral surfaces reduce the concentration of the nuclides transported
through the geosphere (Neretnieks, 1980). Owing to this mechanism, frequently fractured
rock mass in Japan may have considerable retardation capacity against the transport of
radionuclides. To take the matrix diffusion into account in evaluating the migration of
radionuclides in deep geologic formations for the safety assessment of the repository, it is
essential to understand the mechanisms of the diffusion of radionuclides into the rock matrix
and to quantify the diffusivity. Granite was used in this study because it occurs widely in
Japan and is being considered as a potential host rock for the deep underground disposal of
the high-level radioactive waste.
1.2. Previous studies
Neretnieks (1980) applied pore-diffusion model to the diffusion of ions in rock matrix that
had been proposed for the diffusion in macro-porous media by Brakel & Heertjes (1974).
Da = Dv-2
/(1 + Rd/) = Dp/(1 + Rd/) = De/( + Rd) (1-1)
where Dv : diffusivity in bulk solution (m2 s
-1),
: constrictivity of the pores ( - )
: tortuosity of the pores ( - )
: bulk density of the rock (kg m-3
),
Rd : distribution ratio (m3 kg
-1),
: porosity of the rock ( - ),
Dp : pore diffusivity (m2 s
-1).

2
Da is an apparent diffusivity defined as
J = -DaC/x (1-2)
where J : diffusive flux (mol m-2
s-1
or Bq m-2
s-1
)
C : amount of a diffusing species in unit volume of porous material (mol m-3
or
Bq m-3
)
x : length coordinate in diffusion direction (m)
De is an effective diffusivity or intrinsic diffusivity defined as
J = -Dec/x (1-3)
where c : concentration of diffusing species in pore water (mol m-3
or Bq m-3
).
In the pore-diffusion model, De is modeled as
De = Dv-2
(1-4)
Many researchers investigated the apparent diffusivity or the effective diffusivity and
discussed the applicability of Eq. (1-1) to the diffusion of sorbed species in rocks. Skagius &
Neretnieks (1982) determined the effective diffusivity of cesium and strontium from the rate
of sorption into pieces of granite, which were more than ten times higher than expected from
the results of non-sorbed species and the electrical resistivity measurements. They interpreted
the results as an effect of surface diffusion. Their determination of the effective diffusivity,
however, was not very accurate due to incomplete attainment of the sorption equilibrium.
Bradbury & Stephen (1986) performed the through-diffusion experiments for 85
Sr, 137
Cs and 95m
Tc in sandstone and found that the effective diffusivity of Sr was higher than that of iodide
by 4-5 times. They suggested that a different diffusion mechanism or process may be
occurring. Smith (1989) performed the through-diffusion experiments for 85
Sr, 137
Cs and 125
I
in sandstone and found that the effective diffusivity of 85
Sr is higher than those of 137
Cs and 125
I by a factor of more than 6. Bradbury et al. (1986) performed the through-diffusion
experiments for 85
Sr, 137
Cs and 95m
Tc in sandstone anhydrite and upper magnesian limestone
and found that the diffusive transport was orders of magnitude higher than predicted from the
pore-diffusion model. They mentioned that the results may be explained by a second diffusion
mechanism, namely surface diffusion. Skagius & Neretnieks (1988) performed both the
in-diffusion experiment and the through-diffusion experiment for cesium and strontium in
biotite gneiss and found the diffusive transport was higher than expected from the pore
diffusion model. They concluded that both the pore diffusion and the surface diffusion had to
be included to interpret the experimental data. Tsukamoto & Ohe (1991) performed
intraparticle diffusion experiments into crushed granite for cesium and strontium and
determined the apparent diffusivity. They interpret the results taking both the surface and the

3
pore diffusion processes. Their determination of the apparent diffusivity, however, was not
accurate because they used the crushed granite. Berry & Bond (1992) determined the effective
diffusivity of HTO, iodide, cesium, strontium and americium in sandstone by the
through-diffusion method and calculated the contribution of the surface diffusion to the
effective diffusivity as 73 % for strontium and 62 % for americium. They concluded that
evidence has been obtained for the apparent existence of the process of surface diffusion in
the migration of strontium and americium, but not cesium, through the sandstone. Brace et al.
(1965) and Ohlsson & Neretnieks (1998) suggested the existence of surface diffusion from
electrical conductivity measurements. The evidence of the surface diffusion obtained from the
electrical conductivity measurements is, however, quite indirect.
Several researchers observed higher diffusivity for strontium and cesium in rocks than
expected from pore diffusion model using geometric parameters of the pores obtained for
iodine. This comparison is insignificant because diffusivity of iodine in rocks may be reduced
by electrostatic repulsion between iodide anion and negatively charged surface of the pores.
Some researchers attributed the higher diffusivity for strontium and cesium in rocks to the
contribution of the surface diffusion. The evidence of the surface diffusion, however, has not
been provided. Systematic and careful data acquisition is necessary to prove the diffusivity in
rock is higher than expected from the pore-diffusion model and to explain the reason.
Since the surface diffusion is driven by the gradient of the adsorbed species on the surface
of the pores, it may enhance mass transfer of the actinides that is adsorbed on the mineral
surfaces in rocks. Information on the contribution of the surface diffusion on the diffusivity of
actinide in rocks is, however, scarce. Many attempts to determine the diffusivity of actinides
in rocks were not successful (Torstenfelt et al., 1982; Muuronen et al., 1986; Sato et al., 1986;
Berry et al., 1987; Triay et al., 1993; Puukko et al., 1993) because of low solubility and high
sorption onto minerals. Several researchers determined apparent diffusivity of actinides in
rocks (Ittner et al., 1988; Suksi et al., 1989; McKeegan et al., 1989 and Brink et al., 1991a and
1991b; Idemitsu et al., 1991, 1992 and 1993). The contribution of the surface diffusion can
not be discussed based on these apparent diffusivity because estimation of the apparent
diffusivity based on the pore-diffusion model requires distribution ratio of the actinides for
intact rocks, which is not available. It is necessary to determine the effective diffusivity of the
actinides in rocks from the through-diffusion experiment and to compare it with the value
estimate from Eq. (1-4). Meier et al. (1988) and Berry et al. (1994) determined effective
diffusivity of actinides in rocks by through-diffusion method. The contribution of the surface
diffusion, however, cannot be discussed based on their data because extent of the contribution
of the pore-diffusion on effective diffusivity is not known. Kumata et al. (1990) determined
effective diffusivity of neptunium in granite by through-diffusion method. The contribution of
the surface diffusion cannot be discussed based on their data because neptunium was in
4
pentavalent state and little adsorbed on the granite under the employed condition. Berry &
Bond (1992) determined the effective diffusivity of HTO, iodide, cesium, strontium and
americium in sandstone by the through-diffusion method and calculated the contribution of
the surface diffusion to the effective diffusivity as 62 % for americium. This is the only
experimental result that suggests the apparent existence of the surface diffusion in the
diffusion of actinide in rocks. Their estimation of the contribution of the pore-diffusion based
on the diffusivity of Am3+
in water, however, contains large error due to uncertainty in
speciation of americium in aqueous solution. In order to investigate the contribution of the
surface diffusion on the diffusion of actinides in rocks, the effective diffusivity should be
determined by the through-diffusion experiment in a well-characterized rock under the
conditions that the chemical speciation of the actinide is known.
1.3. Objective of this study
The objectives of this study are
- to characterize pore structure of a Japanese granite and to quantify the contribution of the
pore-diffusion on effective diffusivity of sorbed species in the granite and to clearly present
that the effective diffusivity of the sorbed species is higher than expected from the
pore-diffusion model.
- to prove that the higher diffusivity of sorbed species in granite occurs under geological
conditions by performing diffusion experiments under anoxic conditions using granite and
groundwater obtained from deep underground.
- to provide a direct evidence of surface diffusion, which is an increase of diffusive flux with
increasing distribution ratio for a cation in the Japanese granite.
- to determine the effective diffusivity for some actinide carbonate complexes and to clarify
the contribution of the surface diffusion on the diffusion of actinides in rocks
- to compile a thermodynamic database for Np and Pu that is necessary for predicting their
dominant diffusing species in granite pore water by literature review and experiments to
obtain important lacking data for Pu(IV) carbonate complexes.
To achieve these objectives, the most satisfactory method of measuring diffusion of sorbed
species in granite is through-diffusion experiments, in which steady-state diffusive flux is
determined (Lever, 1986).

5
2. Microporous structures
2.1. Introduction
It is well-known that the Fick’s diffusion law can be applied to the diffusion in porous
materials.
J = -DaC/x (2-1)
where J : diffusive flux (mol m-2
s-1
or Bq m-2
s-1
)
Da : apparent diffusivity (m2 s
-1)
C : amount of a diffusing species in unit volume of porous material (mol m-3
or
Bq m-3
)
x : length coordinate in diffusion direction (m)
When this theory is applied to the diffusion of ions in a rock, the pore size is assumed to be
significantly larger than the diffusing ions. This assumption should be verified.
In order to understand the diffusivity of ions in rocks quantitatively and to discuss the
contribution of the surface diffusion, porosity of the rock is one of essential parameters
determining the effective diffusivity of ions in rock as shown in Eq. (1-4). It is, however,
difficult to determine the porosity precisely for low-porosity rocks. Nishiyama et al. (1990)
analyzed the pores for several kinds of rocks by water saturation method and mercury
intrusion porosimetry. The total porosity of Inada granite determined by two methods differed
by a factor of 2. The porosity of the rock must be determined as highly precisely as possible
considering the critical role of the porosity in estimating the effective diffusivity of ions in the
rock.
Agterberg et al. (1984) presented that the pore size distribution of a kind of granite was
bi-modal. In such a case, theoretical understanding of the diffusivity in rocks is complicated
(Wakao & Smith, 1962; Skagius & Neretnieks, 1986; Lever, 1986; Nishiyama et al., 1990).
Knowledge on micro-porous structure in a rock is necessary before applying theories to the
diffusion of ions in the rock.
The objectives of this chapter are to characterize pore structure of a granite and to examine
the assumptions in applying the Fick’s diffusion law to the diffusion of ions in the rock.
2.2. Experimental
The porosity, , was determined by water saturation for a granite from Inada, Ibaraki, eastern
Japan and a granite obtained from an exploratory borehole, JE-2, that was drilled into the
6
rockmass surrounding the vertical fracture JZ 2 in the underground research Laboratory (URL)
of AECL, in Manitoba, Canada. Although the technique has been commonly used to
characterize pores in rocks, special cares are taken to analyze low-porosity rock precisely. The
water saturation method uses water-saturated weight, submerged weight and dry weight of the
rock samples to calculate the porosity. The errors accompanied in the measurements of the
water-saturated weight often bring about significant errors in determination of the porosity.
Analysis of drying curves of water-saturated weight enabled precise measurements of porosity.
The method developed by Melnyk and Skeet (1986) was applied to a 5x10⁻³
-m thick, 4x10⁻²
-m
diameter Inada granite disk and to a 5x10⁻³
-m thick 6.1x10⁻²
-m diameter URL granite disk. A
granite disk was saturated with water under vacuum and then wiped with a piece of wet paper.
The granite disk was suspended by a wire from a balance and enclosed by a plexiglass box to
reduce air currents. A drying curve was obtained by correcting sample weights by a personal
computer every minute for about 30 minutes until the sample was visually dry. The sample was
then re-saturated with deionized water and another drying curve was obtained. Three drying
curves were obtained for each sample. After plotting a drying curve, the water-saturated but
surface-dry weight, Ws, was obtained from the point of intersection of the initial and final
straight-line portions as described by Melnyk and Skeet (1986). The Ws values obtained from
the 3 drying curves were averaged.
The sample was saturated with deionized water again, placed on a hanger suspended under
the balance and immersed in a vessel containing deionized water. A small jack under the vessel
was used to bring the water level to a reference mark on the hanger. The weight was corrected
for the weight of the hanger immersed to the same reference mark to obtain the submerged
sample weight, Wu. The determination was repeated 3 times and the results were averaged.
After the sample was dried at 105 C for 20 days in an oven, the sample was equilibrated
with laboratory air for about 1 hour, and then weighed. This sequence was repeated 3 times and
the results were averaged to give the dry weight, Wd. The porosity of the sample was obtained
from
= Vp / Vr = (Ws - Wd) / (Ws – Wu) (2-2)
where Vp : volume of the pore space in the granite sample (m3),
Vr : bulk volume of the granite sample (m3).
The uncertainties were propagated from the weight measurements to the porosity. The
measurement were performed for 4 Inada granite samples, D1, D2, D3 and D4, and 7 URL
granite samples, F1, F4, F7, F10, F11, G1 and G2. For several samples, the saturated weight
was obtained by weighing the water-saturated sample immediately after wiping the surfaces
with a damp cloth for comparison.

7
After the porosity measurement by water saturation, an Inada granite sample, D2, was cut
into 5 segments whose dimensions were around 5x10-3
m x 1x10-2
m x 2.5x10-2
m by a
diamond saw (ISOMET Low Speed Saw, BUEHLER). Sharp points on the edges of the pieces
were removed by a piece of carborundum paper. The mercury intrusion porosimetry was
applied to these segments to determine the pore size distribution. In the mercury intrusion
porosimetry, a major part of the error in the porosity determination is due to rough surfaces of
the sample. The rock sample was cut into rectangular parallelepipeds by diamond low-speed
saw, instead of crushing, to reduce the surface roughness. The detection limit of the mercury
intrusion is also a cause for the error for low-porosity samples. Five samples whose total
volume was 6x10⁻⁶
m3 were simultaneously put in the measurement cell of the porosimeter to
increase the amount of intruding mercury. A mercury porosimeter, Pore sizer 9310
(micromeritics), was used. The pressure range was (0.1 – 207)x106 N m
-2, which corresponded
to the pore-diameter range of 10,000 - 6 nm. The minimum detectable amount of mercury
intruded in the sample was 1.08x10⁻¹⁰
m3. Another Inada granite sample, D4, and a URL granite
sample, G1, were cut into small pieces with the same dimension and used for porosity
determination by mercury intrusion. Inada granite core was crushed and 10 segments whose
total weight was about 5 g were picked up and analyzed for comparison. As described in detail
by Katsube & Hume (1987), the pressure required to force mercury into the pores is correlated
with the pore-diameter by the following equation assuming that the pores are cylindrical:
D = -4cos / p (2-3)
where D : diameter of the pores (m),
: surface tension of mercury (0.48 N m-1
),
: contact angle (139, Good & Mikhail, 1981),
p : pressure (N m-2
).
The pore structure of Inada granite was observed by SEM (S-650, Hitachi, Super Scan 330
FEG, Shimadzu) after depositing carbon on the surfaces. A 4.0x10⁻²
-m diameter, 5x10⁻³
-m
thickness Inada granite sample was cut into 4 fan-shaped segments with a diamond low-speed
saw. One of the segments was polished up to No. 6000 on a glass plate and up to 1/4 µm
diamond paste on a nylon buff. Care was taken to keep the surface flat and to prevent the
sample from cracking. The surface was cleaned and observed by optical microscope in each
step of polishing to obtain good polished surfaces for contacting parts of minerals and for
cleavable mica and feldspar.

8
2.3. Results and discussion
The saturated weight, Ws, of the disk was determined based on the following weight
changes due to drying as a function of time as shown in Fig. 2-1. Three Ws values obtained
from the triplicate measurements were almost identical and averaged to obtain the Ws value
tabulated in Table 2-1. The saturated weights obtained by weighing the water-saturated
sample immediately after wiping the surfaces with a damp cloth were shown in parenthesis in
Table 2-1. These measurements overestimated the Ws value by 10-15 mg, which lead to an
overestimation of the porosity by 0.002. Submerged weights of the samples were determined
as an average of triplicate measurements as shown in Table 2-1. Figure 2-2 shows the weight
change of a sample while dying at 105 °C. The weight change becomes negligibly small after
19 days, which indicates complete dryness. Figure 2-3 shows the weight change of a dried
sample equilibrated with laboratory humidity. The weight change becomes negligibly small
after 1 hour, which indicates that the outer surface of the sample was equilibrated with the
laboratory humidity. The Wd value was determined as an average of triplicate measurements
and shown in Table 2-1. The porosity of each sample was determined from Ws, Wu and Wd by
Eq. (2-2) and shown in Table 2-1. The porosity of Inada granite sample was determined to be
(0.49±0.07) % as an average of the results for 4 samples. The porosity of URL granite sample
was determined to be (0.40±0.10) % as an average of the results for 7 samples.
The results of the mercury intrusion porosimetry for the cut Inada granite samples and for
the crushed ones were compared in Fig. 2-4. No difference was observed between 2 samples
in the partial porosity obtained in the pore diameter range smaller than 400 nm. The
differences observed in the pore diameter range larger than 400 nm is due to the differences in
the roughness of the sample surfaces. Mercury intruded into cavities on the sample surfaces
was counted. The results of the mercury intrusion porosimetry were shown in Table 2-2 and in
Fig. 2-5 with literature data for Lac du Bonnet granite (Agterberg et al., 1984). The pore-size
distribution of the granite was nearly logarithmic normal with the modal diameter of 160 nm
for Inada granite and 340 nm for URL granite. The bi-modal distribution that had been
typically observed for Lac du Bonnet granite was not seen in the present measurements. Total
porosity determined by mercury intrusion agrees with the value that had been determined by
water saturation. The specific surface areas were determined to be 70 m2 kg
-1 for Inada granite
and 20 m2 kg
-1 for URL granite.
Figure 2-6 shows the optical microscope images of the polished surface. In SEM image for
the polished surface, pores of a few tens – a few hundreds nm wide were observed. A typical
image was shown in Fig. 2-7. In this figure, pores of 100 nm wide were observed between
quartz and other minerals. In plagioclase, pores of several tens nm in width were observed as
shown in Fig. 2-7.

9
2.4. Conclusion
The water saturation method and the mercury intrusion porosimetry were applied to the
characterization of micropores in granite. Although these techniques have been commonly
used to characterize pores in rocks, special cares should be taken for precise measurement of
the porosity and the pore size of low-porosity rocks. In the water saturation method, analysis
of drying curves of water-saturated weight enabled precise measurements of porosity. In the
mercury intrusion porosimetry, a major part of the error due to rough surfaces of the sample
can be reduced by cutting the samples into rectangular parallelepipeds, instead of crushing.
The volume of the rock sample put into the measurement cell of the mercury porosimeter
should be optimized. The porosity of Inada granite was determined to be (0.49±0.07) % with
the modal diameter of 160 nm. The micropores of a few tens to a few hundred nanometers in
width were observed by SEM. The URL granite had the porosity of (0.40±0.10) % and the
modal diameter of 340 nm. When the Fick’s diffusion law is applied to the diffusion of ions in
rocks, the pore size is assumed to be significantly larger than the diffusing ions. The
assumption was confirmed for Inada granite and for URL granite. Since the pore size was
found to be uniform, the contribution of the pore-diffusion to the effective diffusivity of ions
in the granite can be estimated precisely based on the porosity of the granite obtained in this
chapter.


19
3. Relationship between De and Dv
3.1. Introduction
Radionuclide migration analysis has to deal with concentration of radionuclides in pore
water, c (mol m-3
or Bq m-3
), while Eq. (2-1) dealing with amount of a diffusing species in
unit volume of porous material, C. Correlation between C and c is given as:
C = c + Rdc (3-1)
where : porosity of the rock ( - ),
: bulk density of the rock (kg m-3
),
Rd : distribution ratio (m3 kg
-1).
Combining Eq. (3-1) with Eq. (2-1), diffusion equation for the concentration of radionuclides
in pore water is obtained.
J = -Da( + Rd) c/x (3-2)
The terms +Rd and Da( + Rd) are often called rock capacity factor and effective
diffusivity, De (or intrinsic diffusivity, Di), respectively.
J = -Dec/x (3-3)
The effective diffusivity of an aqueous species through the interconnected pore space in a
rock matrix is often assumed to be proportional to its diffusivity in bulk solution (Dv) and to
the geometric parameters of the rock: (porosity), (constrictivity) and -2
(: tortuosity)
(Neretnieks, 1980; Skagius and Neretnieks, 1982; 1986; 1988; Nishiyama et al., 1990;
Kumata et al., 1990; Tsukamoto and Ohe, 1991; Idemitsu et al., 1992).
De = Dv-2
(3-4)
This relationship has been proposed for diffusion in macro-porous media by Brakel and
Heertjes (1974), and has been applied to the diffusion in rock matrix by Neretnieks (1980).
Although it is convenient to use this relationship to describe diffusion in rock, it is very
difficult to verify the relationship because of micro-inhomogeneity of intact rock. Nishiyama
et al. (1990) measured the effective diffusivity of I- in various rocks and investigated the
proportional relationship between De and . They found that De was roughly proportional to .
They also suggested that the term -2
was approximately expressed as 3x10⁻³
0.3. Equation
(3-4) states the proportional relationship between De and Dv, but this has not been verified.
The objective of this chapter is to examine the relationship between De and Dv.
20
3.2. Experimental
Preparation
The rock used in this study was Inada granite, whose chemical and mineral compositions
are shown in Table 3-1 (Idemitsu et al., 1992; Yamaguchi et al., 1993). A granite core having a
diameter of 4.0x10⁻²
m was cut to 5x10⁻³
m thickness with a diamond saw. Granite disks
without visible cracks were used in the experiments.
The method described by Garrel et al. (1949) was modified in this study. The acrylic
diffusion cell used in this study is shown in Fig. 3-1. A granite disk was fitted tightly into the
central part of the cell and any gap between the rock disk and the acrylic were filled with a
silicone gasket. The central support member containing the granite disk was sandwiched
between the two reservoirs, each with a capacity of 1.16x10⁻⁴
m3. The assembled diffusion
cell was soaked in the solution to be used in the diffusion experiments under vacuum to
evacuate all air from the interconnected pores in the granite. The diffusion cell was then kept
under atmospheric pressure for 30 days to pre-condition the granite disk with the solution at
the same pH. Solutions were prepared from reagent grade chemicals (Wako Pure Chemical
Industries, Ltd., Tokyo) and deionized water (Milli-Q Labo System, Millipore).
Series 1
The 1st series of experiments was performed to measure effective diffusivity of Ba
2+, Sr
2+,
Mg2+
, Co2+
and Ni2+
in the granite. The source solution was prepared by dissolving Ba(NO3)2,
Sr(NO3)2, MgC12, CoC12, NiC12 and KCl powders in deionized water to get the concentration
of 102 mol m
-3 for each metal ion. The pH of the solution was adjusted to 4.0 with dilute KOH
to prevent hydrolysis, carbonate complexation and precipitation of the metal ions. The
diffusion experiment was started by placing the source solution in one reservoir (source
reservoir) and 102 mol m
-3 KCl solution in the other (measurement reservoir). The experiment
was sextupled using granite disks: B3, B6, B9, B10, B19 and B21 at 25°C in a water bath.
Two milliliters aliquot of the solution was taken from the measurement reservoir at 10 days
intervals. The concentrations of the tracers in the solutions were determined by inductively
coupled plasma (ICP) emission spectrometry.
Series 2
In the 2nd
series of experiments, the effective diffusivities of Sr2+
in the granite were
measured. The source solution was prepared by dissolving Sr(NO3)2 powders in deionized
water to get the concentration of 102 mol m
-3 for Sr
2+. The pH of the solution was 5.5. The
diffusion experiment was started by placing the source solution in the source reservoir and
deionized water in the measurement reservoir. The experiment was triplicated at room
21
temperature. Sampling and the concentration measurement were performed as the same
manner as those in the 1st series of experiments.
Series 3
In the 3rd
series of experiments, the effective diffusivities of UO22+
in the granite was
measured. Uranium-233 was chemically purified by anion exchange and prepared as a
8.9x10⁻¹
mol m-3
solution in 103 mol m
-3 HCl. The source solutions for the diffusion
experiments were prepared by adding a 3x10⁻⁶
m3 volume of the stock solution to 3.45x10
-4
m3 volume of 10
2 mol
-3 KCl in a polypropylene bottle. The pH was adjusted to 4.0 with dilute
KOH. The concentration of uranium in the source solution was 7.7 mol m-3
. The diffusion
experiments were started by placing the source solution in the source reservoir and an equal
volume of the 102 mol m
-3 KCl solution at pH 4.0 in the measurement reservoir. Experiments
were performed in triplicate using granite disks: B11, B14 and B16 at room temperature (20 -
25 °C). At 10 days intervals, a 5x10⁻⁸
m3 aliquot was taken from the measurement reservoir
and diluted to prevent the salt from interfering with -spectrometry of the samples. A 5x10⁻⁸
m3 aliquot of the diluted sample solution was evaporated on a stainless steel planchet and its
activity determined by -spectrometry.
Series 4
In the 4th
series of experiments, the effective diffusivity of water in the granite was
measured using tritiated water as a tracer. Concentration of 3H in the water stock solution was
8.34x10¹¹
Bq m-3
. After the granite disk was soaked in deionized water under vacuum for a
couple of days to evacuate all air from the interconnected pores, the diffusion experiment was
started by adding 1.25x10⁻⁷
m3 of tritiated water stock solution into the source reservoir. The
concentration of 3H in the solution in the source reservoir was planned to be 8.62x10
8 Bq m
-3.
To make sure the concentration of 3H in the source solution, 1x10
-7 m
3 aliquot was withdrawn
and its activity determined by liquid scintillation counter, TRI-CARB 2550 TR/AB, Packard.
The pH of the solution was 5.5. The experiment was triplicated using granite disks: D4, D7
and D9 at (25.0±0.5)°C in a water bath. At 7 days intervals, 1x10⁻⁶
m3 aliquot was taken
from the measurement reservoir and mixed with a 3x10⁻⁶
m3 volume of liquid scintillation
cocktail to determine its radioactivity by the liquid scintillation counter. The 1x10⁻⁶
m3 aliquot
removed from the measurement reservoir was replaced by an equal volume of the deionized
water to maintain the water levels in the two reservoirs.
Series 5
In the 5th
series of experiments, the effective diffusivity of Cs+ and I
- in the granite was
measured using 134
Cs and 125
I as tracers. Stock solution of 134
Cs was prepared as a 1.62x10¹³
Bq m-3
solution in 10 mol m-3
HCl. Stock solution of 125
I was prepared as a 3.24x10¹³
Bq m-3
solution in NaI/Na2S2O3 solution in which the concentrations of I- and S2O3
2- were 3.3x10
-1

22
and 3.2x10⁻¹
mol m-3
, respectively. After completing the 4th
series of experiments, the solution
in the diffusion cell D9 was replaced by a 102 mol m
-3 KI solution. After pre-conditioning the
granite disk with the 102 mol m
-3 KI for 30 days, the solution in both reservoirs was replaced
by fresh 102 mol m
-3 KI solution, and a 1x10
-8 m
3 portion of the
125I stock solution and the
same volume of the 134
Cs stock solution were added to the source reservoir to start the
diffusion experiment. The pH of the 102 mol m
-3 KI solution was 6.0. The experiment was
performed at 25°C in a water bath. At 7 days intervals, 1x10⁻⁶
m3 aliquot was taken from the
measurement reservoir and its radioactivity determined by pure Ge detector.
Sampling and analysis
The aliquot removed from the measurement reservoir was replaced by an equal volume of
blank solution to maintain the balance of the water levels between the two reservoirs. This
balancing avoids occurrence of pressure difference that leads to advective transport from the
source to measurement reservoir. The concentration of tracers in the source reservoir was also
determined periodically. At the termination of each experiment, the inner wall of the
measurement reservoir was rinsed with 104 mol m
-3 HCl to determine the amount of the
tracers adsorbed on the cell walls. The amount of the adsorbed tracer was found to be less
than 3 % of the final inventory in the measurement reservoir and can be ignored. The
statistical error of the determination of the tracer concentration was 3 - 14 % in radioactivity
measurement and 5 % in ICP-AES.
3.3. Data analysis
The rate of change of concentration of an ion in pore water due to diffusion in
one-dimensional system is derived from Eq. (3-3) as:
(+Rd)c/t = De2c/x
2 (3-5)
The initial and boundary conditions are
c(x, 0) = 0 at 0<x≦L (3-6)
c(0, t) = c1 (3-7)
c(L, t) = c2 << c1, (3-8)
where L : thickness of the rock sample (m),
c1 : concentration of a species in the source reservoir (mol m-3
or Bq m-3
),
c2 : concentration of a species in the measurement reservoir (mol m-3
or Bq m -3
).
The solution of Eq. (3-5) had been given by Crank (1975). The concentration of a species in

23
the measurement reservoir after a long period is approximated as:
c2(t)/c1 = AV2-1
(DeL-1
t – (+Rd)L/6) (3-9)
where A : cross section of the sample (m2),
V2 : volume of the measurement reservoir (m3).
De and (+Rd) were determined from the slope and the intercept on the concentration axis of
the extrapolated linear region of a diffusion curve.
3.4. Results
Figures 3-2a – 3-2e show the time dependence of the concentrations of Ba, Sr, Mg, Co and
Ni in the measurement reservoirs from the 1st series of experiments. The concentrations
increase linearly with time after 10 days. The effective diffusivity and the rock capacity factor
were determined by the least squares fitting and are presented in Table 3-2 together with
literature data.
Figure 3-3 shows the time dependence of the concentration of Sr in the measurement
reservoirs from the 2nd
series of experiments. Larger differences in concentration are observed
between multiple diffusion run than those observed in the 1st series of experiments, which
may be due to absence of coexisting cations. The portion of the diffusion curve where the
concentration of Sr increased linearly with time was found for each diffusion run and fitted to
the Eq. (3-9) by least squares to determine the effective diffusivity and the rock capacity
factor as shown in Table 3-2.
Figure 3-4 shows the time dependence of the uranium concentration in the measurement
reservoir from the 3rd
series of experiments. The uranium concentrations increased linearly
with time after 50 days. The effective diffusivity and the rock capacity factor were determined
by the least squares fitting and are presented in Table 3-2 together with literature data. In
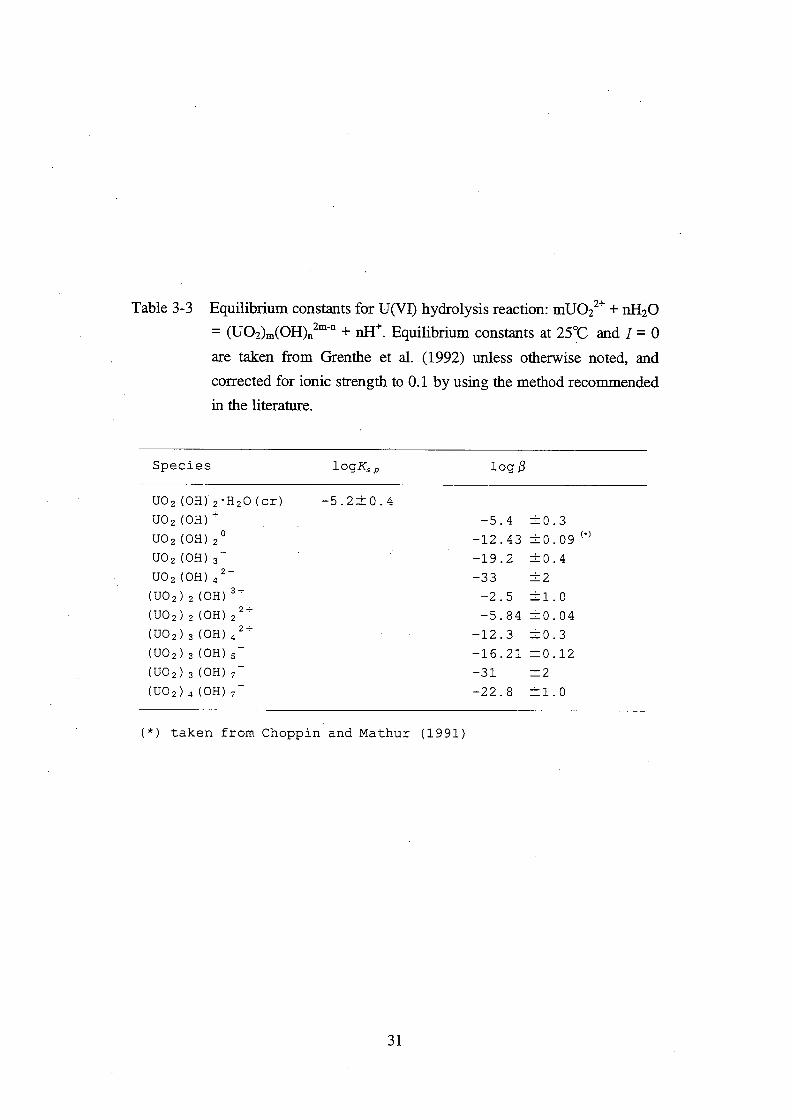
aerated solutions, the dominant oxidation state of uranium is hexavalent. Speciation of
uranium was calculated using the stability constants of the hydrolysis species expected to be
present around pH 4 that are shown in Table 3-3. Complexation of UO22+
at pH 4 by chloride
and by carbonate is negligible (Grenthe et al., 1992). The calculation shows that the uranium
concentration in solution is limited by precipitation of UO2(OH)2・H2O above pH 6. In the
present study, the uranium concentration in the source reservoir remained virtually constant as
shown in Fig. 3-4, which suggests no significant removal of uranium by precipitation and/or
sorption on reservoir walls. More than 93 % (96±3 %) of the uranium was calculated to be
present as UO22+
throughout the experiment although the pH of the solution had increased to
4.1 by the end of the experiment. The average De value obtained in this experiment was

24
(3.6±1.6)x10-14
m2 s
-1 for the triplicate experiments. This value is close to that for uranine, but
one order of magnitude lower than those obtained for Sr2+
and NpO2+, and two orders of
magnitude lower than that obtained for I-. The effective diffusivity differs significantly
between UO22+
and NpO2+, although they have similar ionic structures.
Figure 3-5 shows the time dependence of the concentration of 3H in the measurement
reservoirs from the 4th
series of experiments. The concentrations increase linearly with time.
The effective diffusivity and the rock capacity factor were determined by the least squares
fitting and are presented in Table 3-2.
Figure 3-6 shows the time dependence of the concentrations of 134
Cs and 125
I in the
measurement reservoir from the 5th
series of experiments. The concentrations increase linearly
with time. The effective diffusivity and the rock capacity factor were determined by the least
squares fitting and are presented in Table 3-2.
3.5. Discussion
In order to check the validity of the constant proportionality between De and Dv assumed in
Eq. (3-4), Dv's for the diffusing species under the experimental conditions were estimated by
taking into account mode of diffusion (Li and Gregory, 1974) (salt diffusion or tracer
diffusion), concentration of the diffusing species and ionic strength of the solution and
temperature. The diffusion of metal ions in the 1st series of experiments is considered to be
not tracer-diffusion but salt-diffusion. The diffusivities of BaCl2, SrCl2, MgCl2, CoCl2 and
NiCl2 at infinite dilution were given as 1.38x10⁻⁹
, 1.33x10⁻⁹
, 1.25x10⁻⁹
, 1.25x10⁻⁹
, and
1.25x10⁻⁹
m2
s-1
, respectively by Li and Gregory (1974). The diffusivity of the metal ions in
bulk of the working solution is reduced by 17 % from the value at infinite dilution due to
concentration of the metal ion itself (Robinson & Stokes 1955). The uncertainty on Dv due to
ionic strength of the working solution are estimated to be 3% based on the difference between
the CaCl2 diffusivity in a 5x10² mol m
-3 solution and that in a 10
2 mol m
-3 solution (Robinson
& Stokes 1955). The Dv of Ba2+
, Sr2+
, Mg2+
, Co2+
and Ni2+
under the condition was estimated
to be (1.15±0.03)x10-9
, (1.11±0.03)x10-9
, (1.04±0.03)x10-9
, (1.03±0.03)x10-9
and
(1.04±0.03)x10-9
m2 s
-1, respectively. The diffusion of Sr
2+ in the 2
nd series of experiments is
considered to be not tracer-diffusion but salt-diffusion. The diffusivity of Sr(NO3)2 in infinite
dilution is 1.30x10⁻⁹
m2 s
-1 (Li and Gregory, 1974). The concentration of Sr(NO3)2 in the
experiments was 102 mol m
-3, which would reduce the diffusivity by 17% on the basis of the
data for CaCl2 (Robinson & Stokes 1955). The temperature was room temperature (20 –
25) °C, which gives an uncertainty of 13% for Dv (Mills, 1961). The Dv of Sr2+
under the
condition was estimated to be (1.08±0.14)x10-9
m2 s
-1. The diffusivity of UO2
2+ at infinite

25
dilution (Li and Gregory, 1974) can be used as the diffusivity in bulk solution in the 3rd
series
of experiments because the concentration of uranium was much lower than that of KCl, which
assured tracer diffusion. The ionic strength of the solution was 102 mol m
-3, which gives an
uncertainty of 3% fot Dv (Mills, 1961). The temperature was room temperature (20 – 25) °C,
which gives an uncertainty of 13% for Dv (Mills, 1961). The Dv of UO22+
was estimated to be
(4.3±0.6)x10-10
m2 s
-1 as shown in Table 3-2. The diffusivity of H2O at infinite dilution (Li
and Gregory, 1974) can be used as the diffusivity of HTO in bulk solution in the 4th
series of
experiments because the mode of this diffusion was self diffusion. The Dv of HTO was
estimated to be 2.14x10⁻⁹
m2 s
-1 as shown in Table 3-2. The diffusion of cesium and iodine in
granite in the 5th
series of experiments were also considered to be tracer diffusion. The
diffusivity of Cs+ and I
- in 10
2 mol m
-3 KI solution is 1.98 x10
-9 m
2 s
-1 and 1.99x10
-9 m
2 s
-1,
respectively (Mills 1961).
Experimentally obtained De's for strontium, cobalt, uranium, tritiated water and iodine are
plotted versus Dv in Fig. 3-7. Except for the data for Sr2+
obtained in the 2nd
series of
experiments, the data points lie on a curve. A positive correlation is observed between De
values in the granite and diffusivity in bulk of the solution for most of the ions. The De/Dv
ratios were, however, not constant but 3.6x10⁻⁴
, 2.9x10⁻⁴
, 2.4x10⁻⁴
, 2.3x10⁻⁴
and 8.4x10⁻⁵
for
HTO, I-, Sr
2+ (1
st series), Co
2+ and UO2
2+, respectively.
The De value for Sr2+
obtained in the 2nd
series of experiments was higher than the value
expected from Eq. (3-4) by 40 times. The De value for Sr2+
was higher than that obtained for I-
whose diffusivity in bulk solution is lower than that for Sr2+
. Similar high diffusivity of Sr2+
had been observed previously for a sandstone by Bradbury et al. (1986) and for a gneiss by
Skagius & Neretnieks (1988). The value of ( + Rd) obtained for Sr in the 2nd
series of
experiments was much higher than that obtained in the 1st series of experiments. In deionized
water where the 2nd
series of experiments were performed, adsorption site on the surface of
the pores in the granite sample was available for strontium ion, while in the 102 mol m
-3 KCl
solution where the 1st series of experiments was performed, potassium ion occupied sorption
sites on the surface of the pores in the granite sample and prevent strontium ion from being
adsorbed. Effect of the presence of potassium ion on the adsorption of strontium had been
reported by several researchers (Andersson et al., 1983; Ohe, 1984; Yamaguchi et al., 1991;
Mahoney & Langmuir, 1991) and had been discussed based on the assumption that the cations
are adsorbed onto rock through cation exchange reactions. In the 2nd
series of experiments, the
distribution ratio of strontium as well as effective diffusivity is higher than that in the 1st
series of experiments. In the 1st series of experiments, cations diffuse through the granite and
are hardly adsorbed on the surfaces of the pores. In the 2nd
series of experiments, strontium is
adsorbed on the surfaces of the pores and diffuse through the granite at higher effective

26
diffusivity than that in the 1st series of experiment. The results were well explained by
supposing that the adsorbed Sr ions are mobile in adsorbed state.
In the case that surface diffusion and pore diffusion contribute to the diffusion of sorbed
species, Eq. (3-5) can be expressed as follows (Skagius & Neretnieks, 1988)
c/t + q/t = Dp2c/x
2 + Ds
2q/x
2 (3-10)
where q : amount of ion adsorbed onto rock (mol kg-1
),
Dp : pore diffusivity (m2 s
-1),
Ds : surface diffusivity (m2 s
-1).
Since local chemical equilibrium may be reached at every point inside the sample, the relation
between c and q is given by an equilibrium equation. Langmuir & Freundrich sorption
isotherms are well known. Skagius & Neretnieks (1988) reported the analysis of diffusion
experiments using these isotherms but enough agreement with the experimental data was not
obtained. In the case of Sr, linear sorption isotherm may be applicable (Skagius et al., 1982;
Bradbury & Stephen, 1986)
q = Rdc. (3-11)
Using Eq. (3-11), Eq. (3-10) is simplified as
( +Rd)c/t = (Dp +DsRd)2c/x
2 (3-12)
Equation (3-12) is converted into Eq. (3-5) if a different definition of De is made as
De = Dp + DsRd (3-13)
The diffusion equation including surface diffusion is, thus, solved in the above mentioned way.
Eq. (3-13) states that De depends on Rd in the case that the surface diffusion is predominant.
Figure 3-8 shows effective diffusivities of Sr in several rocks as a function of Rd. The
effective diffusivity clearly depends on Rd. This might be due to the contribution of the
second term of Eq. (3-13) or surface diffusion. Using the least squares method, the pore and
the surface diffusivity are determined as
Dp = 10-12.68±0.15
m2 s
-1 = (2.1±0.7)x l0
-13 m
2 s
-1, (3-14)
Ds = 10-11.50±0.09
m2 s
-1 = (3.5±0.7)x10
-12 m
2 s
-1. (3-15)
The present surface diffusivity is consistent with the former value determined by an
intraparticle diffusion experiment (Tsukamoto & Ohe, 1991).
Equation (3-13) states that De depends on porosity, , in the case that Rd is low. Lang et al.
(1986) measured the effective diffusivities of Sr through Kimmeridge and Coraloolith rock
samples by the through-diffusion method in high saline ground water whose ionic strength

27
was 3.66. Sorptivities calculated based on their data are 0.047 and 0.18 for Kimmeridge and
Coraloolith, respectively, which are fairly low because of the high ionic strength. These De
values are expected to be explained mainly by pore diffusion. The effective diffusivities are
related to porosity as shown in Fig. 3-9. The dependence on porosity is similar to that of
iodide although the number of data points are limited. In the case of low distribution ratio, Sr
diffuse mainly through the pores as if non-sorbed species. The effective diffusivity of Sr when
distribution ratio is low can be expressed as
De = 2.1x10⁻¹⁰
1.3. (3-16)
The effective diffusivities of iodide in rocks were expressed as De = 6.4x10⁻¹⁰
1.3 (Nishiyama
et al., 1990), which is 3 times larger than that of Sr. This difference in De is reasonable
because the diffusivity of I- in bulk solution is larger than that of Sr
2+ by 2.5 times (Li &
Gregory, 1974). The effective diffusivities of Sr in rocks are successfully expressed as
De = 2.1x10⁻¹⁰
1.3 + 3.5x10
-12Rd. (3-17)
3.6. Conclusion
The effective diffusivities in Inada granite were measured for several species. A positive
correlation was observed between De values in the granite and diffusivity in bulk solution for
most of the ions. However, an unexpectedly high De value was obtained for strontium of high
distribution ratio. A model that takes into account contribution of both the surface and the
pore diffusion was proposed for sorbed species. Since experiments to determine the effective
diffusivity in porous material are very time consuming, it is often suggested to estimate De
values from a single De and the knowledge of Dv based on the proportionality between De and
Dv. The results of this work indicate that this approach may introduce large errors.


45
4. Effect of adsorption on apparent diffusivity in granite
4.1. Introduction
Pore-diffusion model assumes that the apparent diffusivity Da of a species in a porous
material is correlated with the diffusivity in bulk of the solution (Dv), geometric parameters of
the pores in the rock: (porosity), (constrictivity) and -2
(: tortuosity), and distribution
ratio (Rd) as
Da = Dv-2
/(1 + Rd-1
).
(4-1)
Equation (4-1) can be rewritten as
Da = Dv-2
/( + Rd) = De/( + Rd). (4-2)
The values of De and (+Rd) obtained for UO22+
from the through-diffusion experiment in
chapter 3 supports the Eq. (4-2); the values yield a Da value of (1.7 - 3.7)x10-12
m2 s
-1, which
is close to the value reported by Idemitsu et al. (1991, 1992 and 1993). Bradbury et al. (1986),
however, reported that the apparent diffusivity of cesium and strontium for 3 types of rocks
was higher by orders of magnitude than that predicted from Eq. (4-1). The value for De can be
higher than Dv-2
for sorbed species as shown in chapter 3, which can be a reason for the
high Da value reported by Bradbury et al. (1986). Equation (4-1) assumes the retardation of
apparent diffusive transport by adsorption as (1 + Rd-1
)-1
. If some of the diffusing species
can diffuse as adsorbed state, the retardation can be smaller than that expected form Rd value
obtained from batch sorption tests, which can be another reason for the high Da value. Clear
understanding of the effect of the adsorption onto minerals on diffusive transport of
radionuclides is required because it is one of the most important phenomena for performance
assessment of radioactive waste disposal.
The objectives of this chapter are to obtain values for Da, De and Rd for strontium from a
through-diffusion experiment using a granite and groundwater from deep underground and to
discuss the effect of the adsorption of Sr2+
onto minerals on its apparent diffusive transport
through the granite.
4.2. Experimental
A granite core with a diameter of 6.1x10⁻²
m was obtained from an exploratory borehole JE 2
that was drilled into the rockmass surrounding the vertical fracture JZ 2 in Underground
Research Laboratory (URL), Manitoba, Canada. Four liters of groundwater from JZ 2 was also
46
obtained from this borehole. The porosity and the modal diameter of the pores of and the
granite had been determined to be (0.40±0.10)% and 340 nm, respectively in chapter 2.
Chemical composition of the groundwater is given in Table 4-1. Precaution was paid to
exclude atmospheric oxygen as much as possible to avoid air oxidation of the granite in this
experiment. The rock sawing equipment was modified by enclosing the diamond rotary blade
and motor with an acrylic/polyethylene housing. Compressed N2 gas was used to displace as
much of the atmospheric oxygen as possible. To hold the rock core as firmly as possible to
prevent chipping during cutting, a new holder was designed and constructed. Eleven 4.8x10⁻³
-m
thick disks of granite were cut from the core, using groundwater from Fracture Zone 2 in the
URL to cool the blade during cutting. The 11 disks were placed in an acrylic vessel filled with
groundwater from Fracture Zone 2. A small polyethylene bag filled with iron powder was added
to this vessel to scavenge atmospheric and dissolved oxygen and to maintain reducing
conditions.
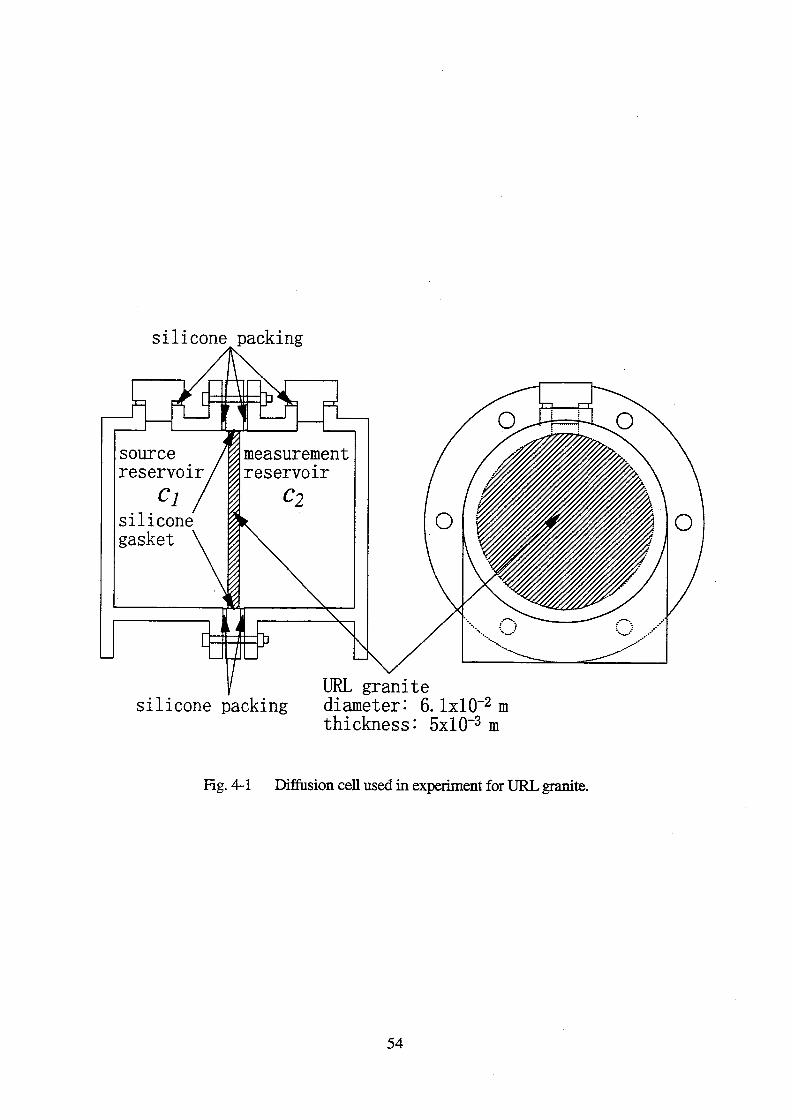
Three granite disks, F2, F5 and F8, were attached to acrylic frames of diffusion cell with
silicone gaskets. Diffusion cells were assembled as shown in Fig. 4-1. These operations were
done in a glove box under N2 with an oxygen concentration of less than 1 ppm. The capacity of
the reservoir was 1.18x10⁻⁴
m3.
After evacuating all air entrapped in the interconnected pore space in the granite disks as
described in chapter 3, the diffusion cells were filled with fresh groundwater because it was
felt that loss of CO2 might have occurred as a result of the evacuation.
The starting solution was prepared by combining 4.0x10⁻⁴
m3 of the groundwater, 2.5x10
-6
m3 of
125I stock solution, 5x10
-8 m
3 of
85Sr stock solution and 1.5x10
-6 m
3 portion of the
9.3x101 mol m
-3 SrI2 solution. The initial concentrations of stable SrI2,
125I and
85Sr in the
solution were planned to be 3.4x10⁻¹
mol m-3
, 1.62x10⁹ Bq m
-3 and 1.17x10
8 Bq m
-3,
respectively. To make sure the concentrations of 125
I and 85
Sr in the source solution, 1x10⁻⁶
m3
aliquot was withdrawn and its activity determined by -spectrometry. The half-lives of Sr-85
(T1/2 = 65.2 days) and I-125 (T1/2 = 59.7 days) are short in relation to the duration of the
diffusion experiments. Stable SrI2 was added to the source solution to maintain adsorption of
these species onto granite in appropriate level through the experimental period. A
concentration of SrI2 of 3.4x10⁻¹
mol m-3
was selected for the following two reasons: (1)
There should be a substantial difference in strontium concentration between the source
solution and the groundwater that contained about 3x10⁻³
mol m-3
strontium. (2) Changes of
ionic strength due to adding SrI2 should be minimized. The diffusion experiments were started
by placing the starting solution in one reservoir (source reservoir) and the groundwater in the
other, or measurement, reservoir. The experiment was performed in triplicate at room
temperature. At 14 days intervals, 1x10⁻⁶
m3 aliquot was taken from both reservoirs to
determine the concentrations of 125
I and 85
Sr. The 1x10⁻⁶
m3 aliquot removed from the

47
measurement reservoir was replaced by an equal volume of the groundwater to maintain the
water levels in the two reservoirs. Concentrations of strontium and iodine were measured by
-spectrometry.
When the diffusion run was terminated after 300 days from the start of the diffusion run,
both compartments of the diffusion cell were drained and 6x10⁻⁶
m3 aliquots analyzed by
-spectrometry. Both compartments were then flushed with 1x10⁻⁵
m3 distilled and deionized
water and 6x10⁻⁶
m3 aliquots analyzed by -spectrometry. The sides of the disks F5 and F8
facing the source reservoirs were ground with 60-grit waterproof carborundum paper. The
disks were weighed prior to grinding to obtain the weights of the material that was removed
by grinding. The disks were ground by hand by rubbing them over the carborundum paper.
Care was taken to ensure that grinding was as even as possible by rotating the disks
periodically. After an initial grinding of the face, the disk was weighed. The surface was then
ground again to remove some additional material and the granite disk weighed again. The
material removed from the disk by grinding and any carborundum powder that was removed
in the process were transferred to a tared polyethylene weighing dish by tapping the
carborundum paper gently. This weighing dish was weighed to obtain the amount of material
transferred. The material removed from the disk by grinding was analyzed by -spectrometry.
4.3. Results and Discussion
Concentrations of 85
Sr for 3 diffusion runs (F2, F5 and F8) are shown in Fig. 4-2. The
concentration of strontium increased linearly with time for F2 and F5 after 50 days from the
start of diffusion. Achievement of a steady state diffusion was confirmed by the fact that the
decrease of Sr concentration in the source reservoirs became comparable to the increase in the
measurement reservoirs after 50 days. The linear portion of the diffusion curve was analyzed
based on the definition of the effective diffusivity:
De = -J/(c/x) = uVA-1
/{(c1 - c2)L-1
} (4-3)
where u : slope of the linear portion of through-diffusion curve (Bq m-3
s-1
)
c1 : average concentration of 85
Sr in the source reservoir in the period of 50-300 days
(Bq m-3
),
c2 : average concentration of 85
Sr in the measurement reservoir in the period of
50-300 days (Bq m-3
).
An effective diffusivity (De) of (1.9±0.3)x10-12
m2 s
-1 was obtained for F2 and (2.2±0.5)x10
-12
m2 s
-1 for F5 by the least squares fitting, and these are averaged to be (2.10.6)x10
-12 m
2 s
-1.

48
The following equation was proposed in chapter 3 to correlate the effective diffusivity of
strontium in rocks with the porosity of the rock and distribution ratio for Sr on granite
De = 2.1x10⁻¹⁰
1.3 + DsRd (4-4)
where Ds : surface diffusivity (m2 s
-1).
The first term, the contribution of pore diffusion, was calculated to be 1.6x10⁻¹³
m2 s
-1 using
the value of 0.004 for the porosity. The experimentally obtained De value is one order of
magnitude higher than this value. Contribution of the second term that stands for the
contribution of the surface diffusion seems to be dominant. On the other hand, for non-sorbed
iodine, the effective diffusivity can be explained taking only pore diffusion into account.
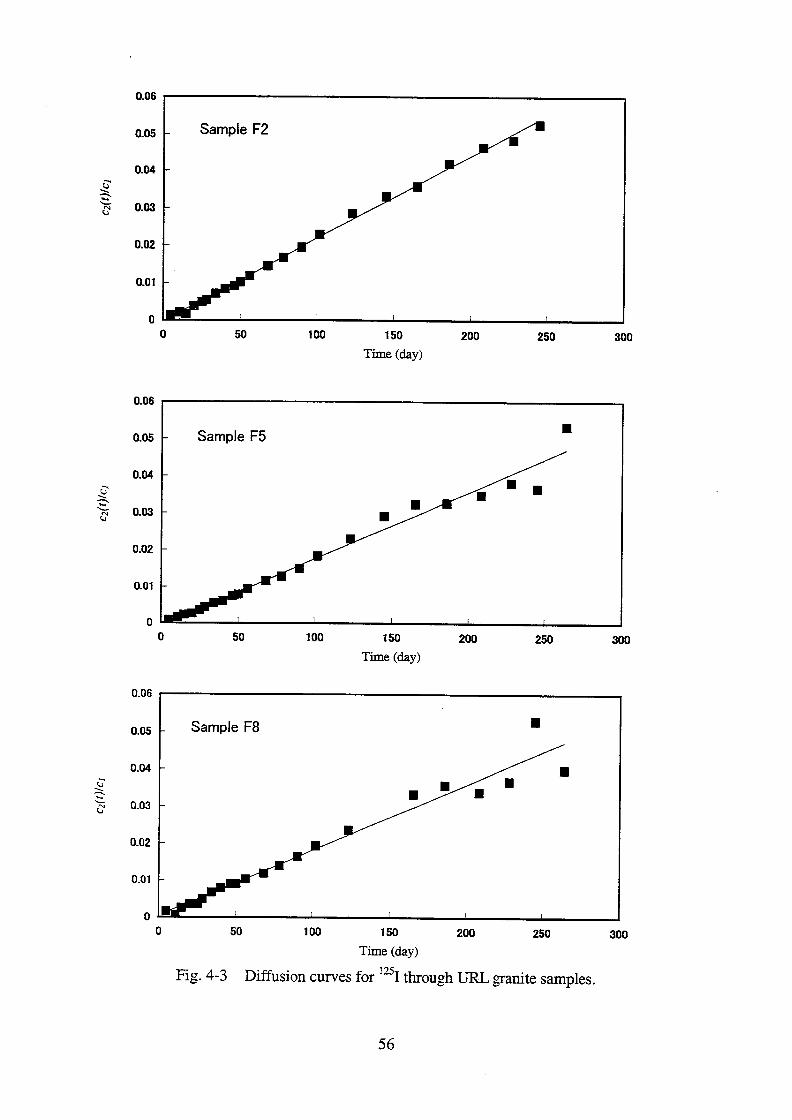
Concentrations of 125
I for 3 diffusion runs (F2, F5 and F8) are shown in Fig. 4-3. The effective
diffusivity of (4.40.7)x10-13
m2 s
-1 was obtained. Based on the pore diffusion model, the
effective diffusivity was calculated to be 4.9x10⁻¹³
m2 s
-1 using the following correlation
(Nishiyama et al., 1990):
De = 6.4x10⁻¹⁰
1.3 (4-5)
The calculated value is close to the value obtained empirically for iodine.
Significant losses of Sr were observed from the source solutions with time: Over the first
50-day period, the Sr concentration in the source reservoirs decreased by one order of
magnitude. The decrease in the Sr concentration in the source reservoir over the first 50 days
is attributed to sorption and diffusion into the interconnected pore space in the granite disks.
The amount of strontium in unit volume of granite in time t at a point whose distance from the
granite surface facing to the source reservoir, C(x, t), is described by the following equation.
C/t = Da2C/x
2 (4-6)
C = 0 (t=0, 0<xL) (4-7)
C = (+Rd)c1 (t>0, x=0) (4-8)
C = (+Rd)c2 (t>0, x=L) (4-9)
c1 = c1(0) - DaAV-1∫
0
t(-C/x)x=0dt (4-10)
c2 = DaAV-1∫
0
t(-C/x)x=Ldt (4-11)
The solution of these equations had been given by Spacek & Kubin (1967)
(c1-c2)/c1(0) =
i=14[zi
2 + (2+)]
-1exp(-zi
2DatL
-2) (4-12)
where = (+Rd)ALV-1
and zi are positive roots of the characteristic equation
tan z = 2z/(z2 - 2
) (4-13)

49
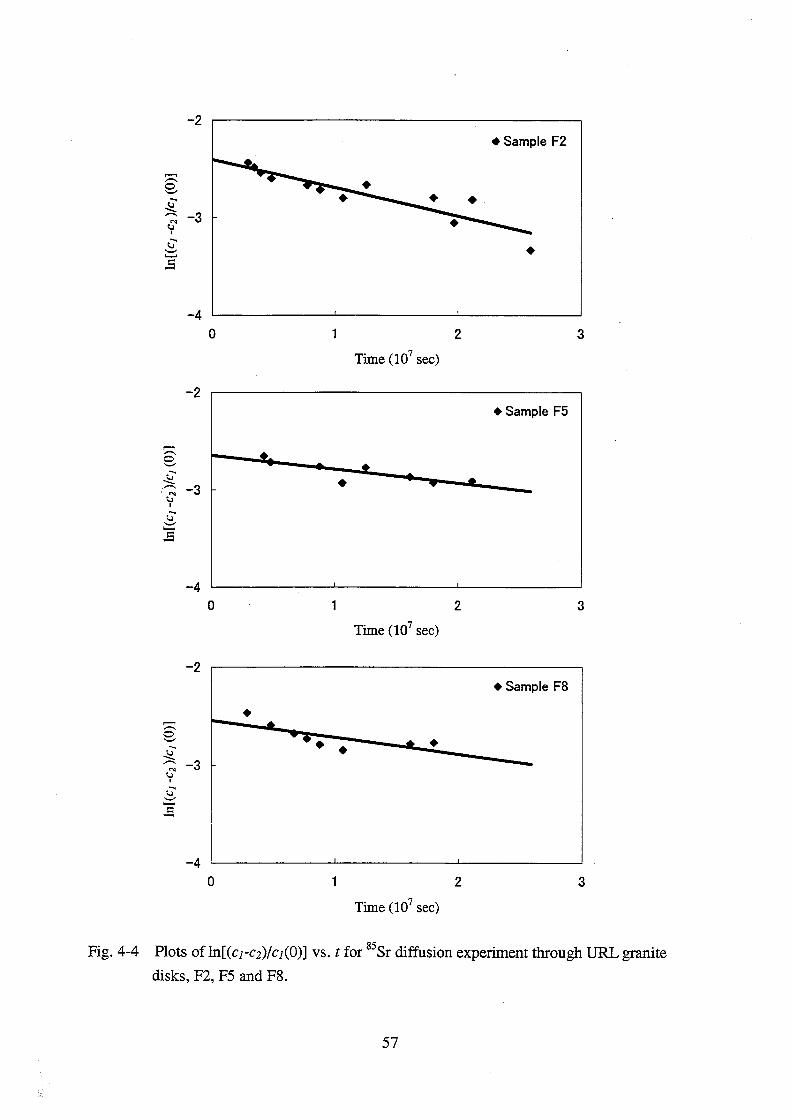
The infinite series of Eq. (4-12) converges rapidly, so that for sufficiently large t only the first
term with z1 can be considered. After plotting ln[(c1-c2)/c1(0)] on t as shown in Fig. 4-4,
-z12DaL
-2 and ln{4[z1
2 + (2+)]
-1} were obtained from the slope and the intercept of the
linear portion of the plot and tabulated in Table 4-2. An apparent diffusivity of (2.01.4)x10-13
m2 s
-1 and a value for Rd of 0.156±0.023 m
3 kg
-1 were obtained on an average of the results
from 3 runs. The Da value is lower than the De value by one order of magnitude, which yields
an Rd value of 0.004±0.003 m3 kg
-1 by using the relation
+Rd = De / Da. (4-14)
This Rd value is one fortieth of the value of 0.156±0.023 m3 kg
-1 obtained by analyzing the
change of the concentration of Sr in both reservoirs.
The results obtained in the grinding procedures were shown in Table 4-3. The average
weight of granite removed from the four sides of the two disks was 6.65x10⁻⁵
kg. Using the
diameter of the granite disks as 6.1x10⁻²
m and a density of the granite of 2.64x10³ kg m
-3,
this corresponds to the removal of an average of 8.6x10⁻⁶
m from the surface of the disks. The
specific surface area of the URL granite was earlier given as 20 m2 kg
-1. If the material
removed from the granite disks is representative of the rock fabric, the contribution to the
surface area by that of the interconnected pore space is 6.71x10-5
kg x 20 m2 kg
-1 or 1.34x10
-3
m2 for F-5. By adding the outer surface area of the granite disk of 2.92x10
-3 m
2, the total
surface area of the removed granite material is 4.26x10⁻³
m2. The adsorbed activity is then 216
Bq/4.26x10-3
m2
= 5.1x10⁴ Bq m
-2. The concentration of
85Sr in the source reservoir at the
termination of the experiment was 5.95x10⁶ Bq m
-3. This gives Ra value of 5.1x10
4/5.95x10
6
= 8.5x10⁻³
m or Rd value of 0.171 m3 kg
-1. This value is close to the Rd value obtained by
analyzing the change of the concentration of Sr in both reservoirs.
Distribution ratio can also be calculated from the mass balance of strontium, which is
described by the following equation:
c1, iniV1 = c1, finV1 + c1, fnRaA +∫0
L cfin(x)( + Raa)Adx + c2, finRaA + c2, finV2
(4-15)
where c1, ini : initial concentration of strontium in the source reservoir (1.17x10⁸ Bq m
-3)
c1, fin : final concentration of strontium in the source reservoir (Bq m-3
)
c2, fin : fianl concentration of strontium in the measurement reservoir (Bq m-3
)
cfin(x) : final concentration of strontium in the pore water in granite (Bq m-3
)
Ra : surface-based distribution ratio (= Rd/a, m)
a : specific surface area of the granite (20 m2 kg
-1)

50
A : cross section of the granite sample (2.921x10⁻³
m2)
Assuming that strontium concentration in the pore water in the granite as
cfin(x) = {c1, fin(L-x) + c2, finx}/L, (4-16)
Ra value of (4.5±0.6)x10-3
m or Rd value of 0.091±0.013 m3 kg
-1 was determined. This value
is close to the Rd value obtained from the diffusion curve analysis again.
These results show that the strontium was removed from the solution and was adsorbed on
the granite, which corresponds to the sorption Rd value of 0.091 - 0.180 m3 kg
-1. Nevertheless,
Rd value assessed from the apparent diffusivity and the effective diffusivity was 0.0041
m3 kg
-1. The contribution of the surface diffusion discussed in chapter 3 can explain this
discrepancy; the retardation of the apparent diffusive transport is smaller than that predicted
from the sorption Rd value because part of the adsorbed strontium is mobile in adsorbed state.
4.4. Conclusion
A through-diffusion experiment was performed for 85
Sr2+
to examine the effect of
adsorption on minerals on the diffusivity in granite. The ratio, De/Da, was much lower than
the value estimated from distribution ratios. Although the reason for the discrepancy has not
been identified, the discrepancy should exist if some of the adsorbed species diffuse as
adsorbed state.

51
Table 4-1 Chemical composition of groundwater used in SrI2 diffusion experiment through
granite obtained from Underground Research Laboratory. (All values in 10-3
kg m-3
)
Ion Concentration
(2s)
Method
Na 102 10 FAA
K 1.13 0.01 FAA
Ca 15.4 0.5 ICP-ES
Mg 6.5 0.2 ICP-ES
Si 4.8 0.1 ICP-ES
Sr 0.178 0.005 ICP-ES
B 0.578 0.017 ICP-ES
Cl 60.7 3.1 IC
Br 0.3 0.1 IC
F 5.42 0.27 IC
SO4 49.4 2.5 IC
Alkalinity* 188 10 titrimetry
*as HCO3


58
5. Diffusive behavior of cationic species
5.1. Introduction
Several researchers (Bradbury et al., 1986; Skagius & Neretnieks, 1988; Tsukamoto & Ohe,
1991) suggested contribution of diffusion of adsorbed ion or surface diffusion, based on the fact
that effective diffusivity of cationic species was much larger than the calculated value based on
Eq. (3-4). The evidence of the surface diffusion, however, has not been provided. In chapter 3,
the effective diffusivity of Sr2+
in various rocks was found to roughly agree with
De = Dv-2
+ DsRd (5-1)
The second term of Eq. (5-1), DsRd, represents the contribution of diffusion in the adsorbed
state. The equation states that the effective diffusivity of an ion increases linearly with its
distribution ratios onto rock materials.
The objective of this chapter is to confirm this increase of De with Rd. The
through-diffusion experiment was performed for Ba2+
in a granite as a function of Ba
concentration because the through-diffusion method provides the distribution ratio as well as
the effective diffusivity.
5.2. Experimental
The preparation of the Inada granite disks and the diffusion cell used in the experiments
were the same as those described in chapter 3. After assembling a diffusion cell, the diffusion
cell was soaked in deionized water under vacuum for 3 days to evacuate all air from the
interconnected pores. The diffusion cell was filled with a 102 mol m
-3 BaCl2 solution to
pre-equilibrate the granite disks with the solution for 30 days.
The starting solution was prepared by combining 1.2x10⁻⁴
m3 of 10
2 mol m
-3 BaCl2
solution, 3x10⁻⁷
m3 of
133Ba (10.5 y half life) stock solution (10
3 mol m
-3 HCl) and 3x10
-7 m
3
of 125
I (59.9 days half life) stock solution in a polypropylene bottle. Stock solution of 125
I was
NaI/Na2S2O3 solution in which the concentrations of I- and S2O3
2- were 3.3x10
-1 and 3.2x10
-1
mol m-3
, respectively. Solutions were prepared from reagent grade chemicals (Wako Pure
Chemical Industries, Ltd., Tokyo) and deionized water (Milli-Q Labo System, Millipore). To
measure the concentrations of 133
Ba and 125
I in the solution, 1x10⁻⁶
m3 aliquot was withdrawn
and its activity determined by -spectrometry. The diffusion experiments were started by
placing the starting solution in the source reservoir and the 102 mol m
-3 BaCl2 solution in the
other, or measurement, reservoir. The diffusion experiments were performed at (25.0±0.5)°C

59
in a water bath.
At 14 days intervals, 1x10⁻⁶
m3 aliquot was taken from the measurement reservoirs to
determine the concentrations of 133
Ba and 125
I. The 1x10⁻⁶
m3 aliquot removed from the
measurement reservoir was replaced by an equal volume of the 102 mol m
-3 BaCl2 solution to
maintain the water levels in the two reservoirs. Diffusion experiment for the 102 mol m
-3
BaCl2 solution was performed in triplicate using diffusion cells N3, N12 and O3. The
diffusion run was performed in triplicate also for 10, 1 and 10-1
mol m-3
BaCl2 solution.
Diffusion cells L14, N9 and O3 were used in the experiment performed at 10 mol m-3
BaCl2
concentration, N6, O6 and O8 at a 1 mol m-3
, and L12, O16 and O22 at 10-1
mol m-3
.
The concentration of 133
Ba and 125
I in the source reservoir was also determined periodically.
At the termination of each experiment, the inner wall of the measurement reservoir was rinsed
with 103 mol m
-3 HCl to determine the amount of
133Ba adsorbed on the cell walls. The
amount of 133
Ba was found to be less than 1 % of the final 133
Ba inventory in the measurement
reservoir and can be ignored.
Zeta potential of the granite in BaCl2 solutions were measured by a microscope
electrophoresis zeta potential analyzer, RANK Brothers MARK II. The granite was crushed
into around 2x10⁻³
-m grains and was milled by a mixer mill. The milled material was
suspended in the BaCl2 solutions overnight and the supernatant was used for the zeta potential
analysis.
5.3. Results
Method of data analysis is the same as that described in chapter 3. Figure 5-1(a) shows the
time dependence of the concentration of 133
Ba in the measurement reservoirs from the
diffusion experiments using the 102 mol m
-3 BaCl2 solution. The statistical error of the
determination of the tracer concentration was 1 - 5 % in radioactivity measurement. The
concentrations increase linearly with time after 100 days from the start of the diffusion. The
effective diffusivity (De) of (2.7 – 10.1)x10-13
m2 s
-1 and the rock capacity factor (+Rd) of
0.031 – 0.909 were obtained by the least squares fitting and tabulated in Table 5-1. An
average 133
Ba concentration in the period of 100 – 400 days was used as c1 in this calculation
to make a correction for the decrease in 133
Ba concentration in the source reservoir during the
experimental period. Figure 5-2 shows the time dependence of the concentration of 133
Ba in
the measurement reservoirs from the diffusion experiments using the 10 mol m-3
BaCl2 solution.
The concentrations increase linearly with time after 100 days from the start of the diffusion.
The effective diffusivity (De) of (1.66 – 2.12)x10-13
m2 s
-1 and the rock capacity factor
(+Rd) of 0.194 – 0.235 were obtained by the least squares fitting and tabulated in Table 5-1.

60
Figure 5-2 also shows the time dependence of the concentration of 133
Ba in the measurement
reservoirs from the diffusion experiments using the 1 mol m-3
BaCl2 solution. Linear portion of
the curve appeared after 200 days from the start of the diffusion. The effective diffusivity (De)
of (1.99 – 2.90)x10-13
m2 s
-1 and the rock capacity factor (+Rd) of 0.456 – 0.624 were
obtained by the least squares fitting and tabulated in Table 5-1. Figure 5-2 also shows the time
dependence of the concentration of 133
Ba in the measurement reservoirs from the diffusion
experiments using the 10-1
mol m-3
BaCl2 solution. The concentrations increase linearly with
time after 300 days. The effective diffusivity (De) of (5.71 – 7.43)x10-13
m2 s
-1 and the rock
capacity factor (+Rd) of 1.198 – 1.379 were obtained by the least squares fitting and
tabulated in Table 5-1.
Figure 5-1(b) shows the time dependence of the concentration of 125
I in the measurement
reservoirs from the diffusion experiments using the 102 mol m
-3 BaCl2 solution. The statistical
error of the determination of the tracer concentration was 2 - 10 % in radioactivity
measurement. The concentrations increase linearly with time after 100 days from the start of
the diffusion. The effective diffusivity of (6.28 – 15.6)x10-13
m2 s
-1 and the rock capacity
factor ranged between -0.067 and 1.27 were obtained by the least squares fitting and tabulated
in Table 5-2. An average 125
I concentration in the period of 100 – 250 days was used as c1 in
this calculation to make a correction for the decrease in 125
I concentration in the source
reservoir during the experimental period. Figure 5-3 shows the time dependence of the
concentration of 125
I in the measurement reservoirs from the diffusion experiments using the 10
mol m-3
BaCl2 solution. The concentrations increase linearly with time for the first 70 days
period. The increase of the 125
I concentration with time become less steep in the period of 70
– 120 days and another linear increase was observed in the period of 120 – 250 days. The
second linear portion was analyzed using Eq. (3-3) to obtain another De:
De = -J/(c/x) = [c2(250)-c2(120)]VA-1
/[(c1 - c2)L-1
] (5-2)
where c1 : average concentration of 125
I in the source reservoir in the period of 120-250
days (Bq m-3
),
c2 : average concentration of 125
I in the measurement reservoir in the period of
120-250 days (Bq m-3
).
An effective diffusivity (De) of (3.07 – 3.91)x10-13
m2 s
-1 were obtained by the least squares
fitting and tabulated in Table 5-2. Average 125
I concentrations in the period of 120 – 250 days
was used as c1 and c2 in this calculation to make a correction for the change in 125
I
concentration in the reservoirs during the period. Figure 5-3 also shows the time dependence
of the concentration of 125
I in the measurement reservoirs from the diffusion experiments using
the 1 mol m-3
BaCl2 solution. From the first linear portion of the curve, the effective diffusivity
of (6.62 – 10.1)x10-13
m2 s
-1 and the rock capacity factor ranged between –0.065 and +0.090

61
were obtained. From the second linear portion of the curve, the effective diffusivity of (1.41 –
4.74)x10-13
m2 s
-1 was obtained. Figure 5-3 also shows the time dependence of the
concentration of 125
I in the measurement reservoirs from the diffusion experiments using the
10-1
mol m-3
BaCl2 solution. From the first linear portion of the curve, the De value of (3.90 –
10.0)x10-13
m2 s
-1 and the rock capacity factor ranged between –0.135 and +0.152 were
obtained. From the second linear portion of the curve, the effective diffusivity of (3.06 –
3.89)x10-13
m2 s
-1 were obtained.
The zeta potential of the milled granite suspension was +5.1 mV in 102 mol m
-3 BaCl2
solution, -7.4 mV in 10 mol m-3
BaCl2 solution, -13.6 mV in 1 mol m-3
BaCl2 solution and
–30.7 mV in 10-1
mol m-3
.
5.4. Discussion
The physical parameters of the granite, -2
, was estimated to be (2.5±0.6)x10-4
based on
the De and Dv data for strontium described in chapter 3. Since the diffusion of 133
Ba in the
present experiment was self-diffusion, Dv value of 8.48x10⁻¹⁰
m2 s
-1 (Li & Gregory, 1974) can be
used. Equation (3-4) gave the effective diffusivity of barium of (2.1±0.5)x10-13
m2 s
-1 under the
present experimental conditions. The De values obtained at the BaCl2 concentration of 10
mol m-3
agreed with the estimated value. The De values obtained for the most concentrated
solution of BaCl2, 102 mol m
-3, were largely scattered in the triplicate runs, and further
discussion was not made in this paper. The De value obtained for the 1 mol m-3
BaCl2 solution
was slightly higher than the estimated value and the value obtained for the 10-1
mol m-3
BaCl2
solution was higher by 3 times.
The zeta potential gradually approached zero as the BaCl2 concentration increased, which
suggested that the sorption sites were almost saturated by Ba2+
ion at the higher BaCl2
concentration. For this reason, the Rd value shown in Table 5-1 has a negative correlation to the
BaCl2 concentration. In case of low Rd value due to high BaCl2 concentration, De value was low,
while in case of higher Rd value due to low BaCl2 concentration, De value was high. This positive
correlation between De and Rd suggests the contribution of the second term of the Eq. (5-1).
The variation in De value was not due to the speciation of barium in the solution because
complexations of Ba2+
by Cl- and S2O3
2- are negligible and carbonate precipitation is not
favorable under the working pH range (5.8 - 6.7) (Dean, 1978). The effective diffusivity of
iodine, non-sorbed species, was not affected by BaCl2 concentrations; (6.1±0.8) x10-13
,
(8.4±1.4)x10-13
and (6.7±2.5)x10-13
m2 s
-1 for 10, 1 and 10
-1 mol m
-3 BaCl2 solution,
respectively. These values are close to an estimated value, 6.4x10⁻¹³
m2 s
-1, obtained from an
equation for the effective diffusivity of iodine in rocks (Nishiyama et al., 1990)

62
De = 6.4x10⁻¹⁰
1.3 (5-3)
where was 0.0049. The results for iodine show that the physical property of the pore
structure was almost the same in the experiments, and accordingly the variation in De of Ba2+
was not physically caused. Both Dv and -2
values were independent on the BaCl2
concentration; nevertheless, De depended from BaCl2 concentration. One has to deal with the
second term of Eq. (5-1) or the contribution of the diffusion in adsorbed state.
The effective diffusivity was plotted versus Rd in Fig. 5-4. Because the data lie on a
straight line, the data were fitted to Eq. (5-1) using the least squares method to determine the
Ds value of (2.4±0.1)x10-13
m2 s
-1. The present Ds value is smaller than the value for Sr
2+,
3.5x10⁻¹²
m2 s
-1, obtained in chapter 3. As presented by Lever (1986),
Da = Ds (5-4)
if there is strong sorption and there is significant surface diffusion. The present Ds value is
close to the Da value obtained for Sr, (2.0±1.4)x10-13
m2 s
-1, described in chapter 4.
The effective diffusivity of iodine was reduced by half about after 100 days from the start
of the diffusion as shown in Fig. 5-3. This reduction may be due to oxidation of I-. In aerated
conditions, iodide anion can be oxidized by dissolved oxygen;
I- + 1.5O2(g) = IO3
- log K = 13.38 (Yamaguchi & Takeda, 1999) (5-5)
Diffusivity of IO3- in water at infinite dilution is 1.06x10
-9 m
2 s
-1 while that of I
- is 2.00x10
-9
m2 s
-1 at 25ºC (Li & Gregory, 1974).
Figure 5-5 shows schematics of the diffusion of 133
Ba2+
through the granite in the present
experiment. Gradient of 133
Ba2+
concentration exists both in aqueous phase and in adsorbed
phase between the source reservoir and the measurement reservoir. Diffusion of 133
Ba2+
is
driven by both of these gradients. Diffusive flux in adsorbed phase, -Dsq/x, prevails over
that in aqueous phase, -Dpc/x, when distribution ratio is high.
5.5. Conclusion
The effective diffusivity (De) and Rd of 133
Ba2+
in Inada granite have been determined by the
through-diffusion method. Experiments were performed in triplicate for 10-1
, 1, 10 and 102
mol m-3
BaCl2 solution at 25°C. The De value obtained at the BaCl2 concentration of 10
mol m-3
, agreed to the estimated value based on the pore diffusion model. The lower BaCl2
concentration yielded the higher De value and higher Rd value. The variation in De was
neither due to the speciation of barium in the solution nor variation in physical properties of
the pores structure in the rock. Contribution of diffusion in adsorbed state should be

63
responsible for the variation in De. The result is strongly indicative of the diffusion in
adsorbed state. When we apply pore diffusion model to sorbed ions ignoring the contribution
of surface diffusion, diffusive flux may be underestimated.

64
Table 5-1 Effective diffusivity and rock capacity factor for barium in Inada granite.
[BaCl2]
(mol m-3
)
Run No. De
(10-13
m2 s
-1)
Rd
( - )
10-1
L12
O16
O22
Avg.
6.57 7.43
5.71
6.6±0.7
2.14
2.53
2.01
2.23±0.22
1
N6
O6
O8
Avg.
1.99
2.25
2.90
2.38±0.38
0.52
0.56
0.72
0.60±0.09
10
L14 N9
O3
Avg.
1.66
2.12
2.08
1.95±0.21
0.20
0.24
0.21
0.216±0.019
102 N3
N12
O10
8.40
10.1
2.70
0.36
1.01
0.03
Table 5-2 Effective diffusivity and rock capacity factor for iodine in Inada granite.
[BaCl2]
(mol m-3
)
Run No. 0 – 70 days 120 - 250 days
De
(10-13
m2 s
-1)
Rd
( - )
De
(10-13
m2 s
-1)
10-1
L12
O16
O22
Avg.
10.0 3.90
6.29
6.7±2.5
0.15
-0.14
-0.10
-0.03±0.13
3.06
3.54
3.89
3.50±0.34
1
N6
O6
O8
Avg.
6.62
8.55
10.1
8.4±1.4
0.03
-0.07
0.09
0.02±0.06
2.20
1.41
4.74
2.8±1.5
10
L14 N9
O3
Avg.
5.15
7.22
6.07
6.2±0.8
-0.03
0.00
-0.03
-0.019±0.012
3.18
3.07
3.91
3.39±0.38
102 N3
N12
O10
15.6
15.0
6.28
1.27
1.16
-0.07
(*)
(*)
(*)
(*) No difference was observed between two period.
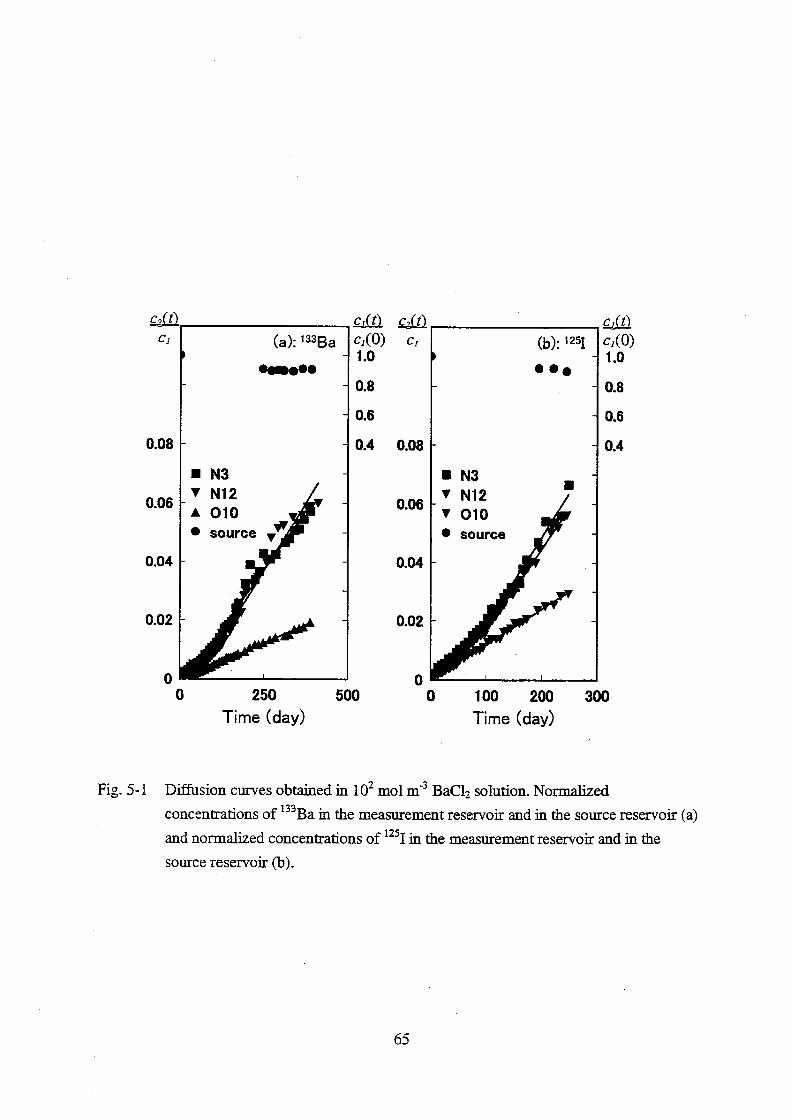


70
6. Diffusive behavior of anionic species
6.1. Introduction
For anionic species, diffusion into rock matrix is an important retarding mechanism
because retardation by sorption is not promising. Many researchers observed that the effective
diffusivity of anionic species in compacted bentonite is smaller than the value estimated by
Eq. (1-4). The accessible pore space in the compacted bentonite is considered to be limited for
anionic species because of electrostatic repulsion between anionic species and negatively
charged surface of the wall of the pores. Nishiyama et al. (1990) reported that the effective
diffusivity of I- in an andesite is smaller than the value estimated by Eq. (1-4).
The objective of this chapter is to examine if the effective diffusivity of anionic species in
the granite is reduced or not by electrostatic repulsion between the species and negatively
charged surface of the granite.
6.2. Experimental
Two granite disks, D5 and J11, were used. The preparation of the granite disks and the
diffusion cell used in the experiments were the same as those described in chapter 3. The
starting solution for D5 was prepared by combining 1.2x10⁻⁴
m3 of 10
2 mol m
-3 SrI2 solution
and 10-8
m3 of
125I stock solution in a polypropylene bottle. The concentration of
125I in the
solution in the source reservoir was planed to be 2.7x10⁹ Bq m
-3. To make sure the
concentrations of 125
I in the solution, a 1x10⁻⁷
m3 aliquot was withdrawn and its activity
determined by spectrometry by a pure Ge detector. After the granite disks were soaked in
deionized water under vacuum for a few days to evacuate all air from the interconnected
pores, the diffusion experiment was started by placing the starting solution in the source
reservoir and the deionized water in the measurement reservoir. The starting solution for J11
was prepared by combining 1.2x10⁻⁴
m3 of a 10
2 mol m
-3 CsI solution, a 1x10
-8-m
3 portion of
125I stock solution and a 1x10
-8-m
3 portion of
134Cs stock solution in a polypropylene bottle.
The concentrations of 125
I and 134
Cs in the starting solution were planned to be 2.7x10⁹ Bq m
-3
and 3.33x10⁸ Bq m
-3, respectively. To make sure the concentrations of
125I and
134Cs in the
starting solution, a 1x10⁻⁶
m3 aliquot was withdrawn and its activity determined by
-spectrometry. The diffusion experiments were started by placing the starting solution in the
source reservoir and the deionized water in the measurement reservoir. At 7 days intervals,
1x10⁻⁶
m3 aliquot was taken from the measurement reservoirs to determine the concentrations
of 125
I and 134
Cs. The 1x10⁻⁶
m3 aliquot removed from the measurement reservoir was

71
replaced by an equal volume of the distilled and deionized water to maintain the water levels
in the two reservoirs. The diffusion experiments were performed at (25.0±0.5) °C in a water
bath.
For comparison, effective diffusivity of HTO and I- in compacted bentonite were measured.
The bentonite clay used in this study was a Na type bentonite, Kunigel V1, from Kunimine
Industries Co., Ltd. The acrylic diffusion cell used in this study was shown in Fig. 6-1. The
central member of the diffusion cell has a hole that is 2x10⁻²
m in diameter and 1.7x10⁻²
m in
depth. A 7.33-g weight of the bentonite powder was placed in the hole and held by a stainless
steel sintered filter that is 1.2x10⁻³
-m thick. The density of the bentonite was 1.6x10⁻³
kg m-3
.
The central member containing the bentonite was sandwiched between the two reservoirs,
each with a capacity of 1.15x10⁻⁴
m3. The assembled diffusion cell was soaked in 4.5 mol m
-3
Na2SO4 solution under vacuum to evacuate all air from the interconnected pores in the
bentonite. The starting solution was prepared by combining 1.2x10⁻⁴
m3 of 4.5 mol m
-3
Na2SO4 solution and 1.25x10⁻⁷
m3 of
3H stock solution in a polypropylene bottle. The
concentration of 3H in the solution in the source reservoir was planed to be 8.0x10
8 Bq m
-3. To
make sure the concentrations of 3H in the solution, five 1x10
-7 m
3 aliquots were withdrawn
and its activity determined by liquid scintillation counter. The diffusion experiment was
started by placing the starting solution in the source reservoir and the 4.5 mol m-3
Na2SO4
solution in the measurement reservoir. At 7 days intervals, 1x10⁻⁶
m3 aliquot was taken from
the measurement reservoirs to determine the concentrations of 3H. The 1x10
-6-m
3 aliquot
removed from the measurement reservoir was replaced by an equal volume of the blank
solution to maintain the water levels in the two reservoirs. The diffusion experiments were
performed at (25.0±0.5) °C in a water bath. After the 3H diffusion run, another diffusion run
was performed using the diffusion cell. The 125
I source solution was prepared by combining
1.2x10⁻⁴
m3 of 4.5 mol m
-3 Na2SO4 solution and 1.34x10
-6 m
3 of
125I stock solution in a
polypropylene bottle. The concentration of 125
I in the solution in the source reservoir was
planed to be 1x10⁸ Bq m
-3. To make sure the concentrations of
125I in the solution, three 10
-7
m3 aliquots were withdrawn and its activity determined by -spectrometry. The diffusion
experiment was started by replacing the 3H source solution with the
125I source solution. At 7
days intervals, 1x10⁻⁶
m3 aliquot was taken from the measurement reservoirs to determine the
concentrations of 125
I. The 1x10⁻⁶
-m3 aliquot removed from the measurement reservoir was
replaced by an equal volume of the blank solution to maintain the water levels in the two
reservoirs. The diffusion experiments were performed at room temperature (30°C) under Ar in
an atmosphere-controlled chamber to minimize the oxidation of iodine.
Solutions were prepared from reagent grade chemicals (Wako Pure Chemical Ind., Ltd.,
Tokyo), standard radioisotope solutions (SCETI Company Ltd., Tokyo) and deionized water
(Milli-Q Labo System, Millipore).

72
6.3. Results and discussion
The through-diffusion curves obtained from the 3H and
125I diffusion experiments in
bentonite were shown in Fig. 6-2. The method described by Crank (1975) was used to analyze
these data. Values for De were obtained from the slope, and the rock capacity factor, (+Rd),
from the intercept on the concentration axis of the extrapolated linear portion,
c2(t)/c1 = AV-1
L-1
Det – ALV-1
(+Rd)/6 (6-1)
Values for c1 in this data analysis were determined by correcting the initial iodine
concentration in source reservoirs for the decrease in the concentration during the
experimental period. The effective diffusivity and the rock capacity factor are presented in
Table 6-1. The difference in diffusivity was very clear between 3H and
125I; the effective
diffusivity of iodine is much smaller than that of 3H. The result is consistent with literature.
The through-diffusion curves obtained from the iodine diffusion experiments in the granite
are shown in figures 6-3. The effective diffusivity and the rock capacity factor obtained by
above-mentioned way are presented in Table 6-1. The effective diffusivities of I- in granite are
not so much different from that of HTO. De values of anionic species in bentonite is much
smaller than that of neutral species because the effective porosity is much smaller for anionic
species than for neutral species due to electrostatic repulsion between the mineral surfaces
and the diffusing species. This is not the case for the granite because the size of the pore is
much larger than the range of the electrostatic force as shown in chapter 2.
The diffusivity of ions in water is affected by the ionic strength of the solution (Ushiki et al.,
1993) and by the mode of diffusion (Li & Gregory 1974). The diffusivity of I- in water under
the experimental conditions are tabulated in Table 6-1. The small variation between the
experimentally obtained De values for I- is consistent with the variation in Dv as shown in Fig.
6-4. If the De value of HTO in a rock, De(HTO), is known, the De value of I-, De(I
-), can be
estimated using their diffusivity in water by
De(I-) = De(HTO) × Dv(I
-) / Dv(HTO) (6-2)
as shown with the broken line in Fig. 6-4.
6.4. Conclusion
For non-sorbed anionic species, the effective diffusivity in compacted bentonite is smaller
than the value estimated by Eq. (1-4). Such a reduction of the De value was not observed for

73
the diffusion of anionic species in the granite. The electrostatic repulsion between anionic
species and negatively charged surface of the wall of the pores does not reduce the effective
diffusivity so much because the pores in granite is larger than the range of electrostatic force.
The effective diffusivity of anionic species in granite is affected by the ionic strength of the
solution and by the mode of diffusion.
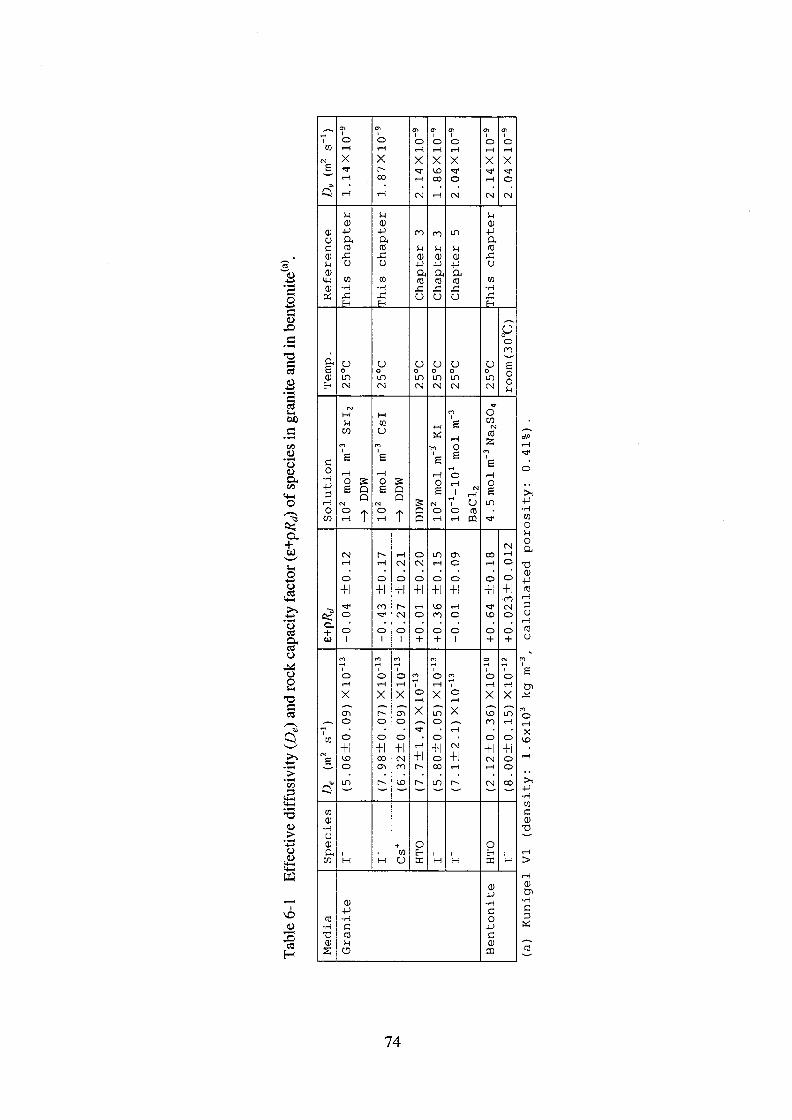

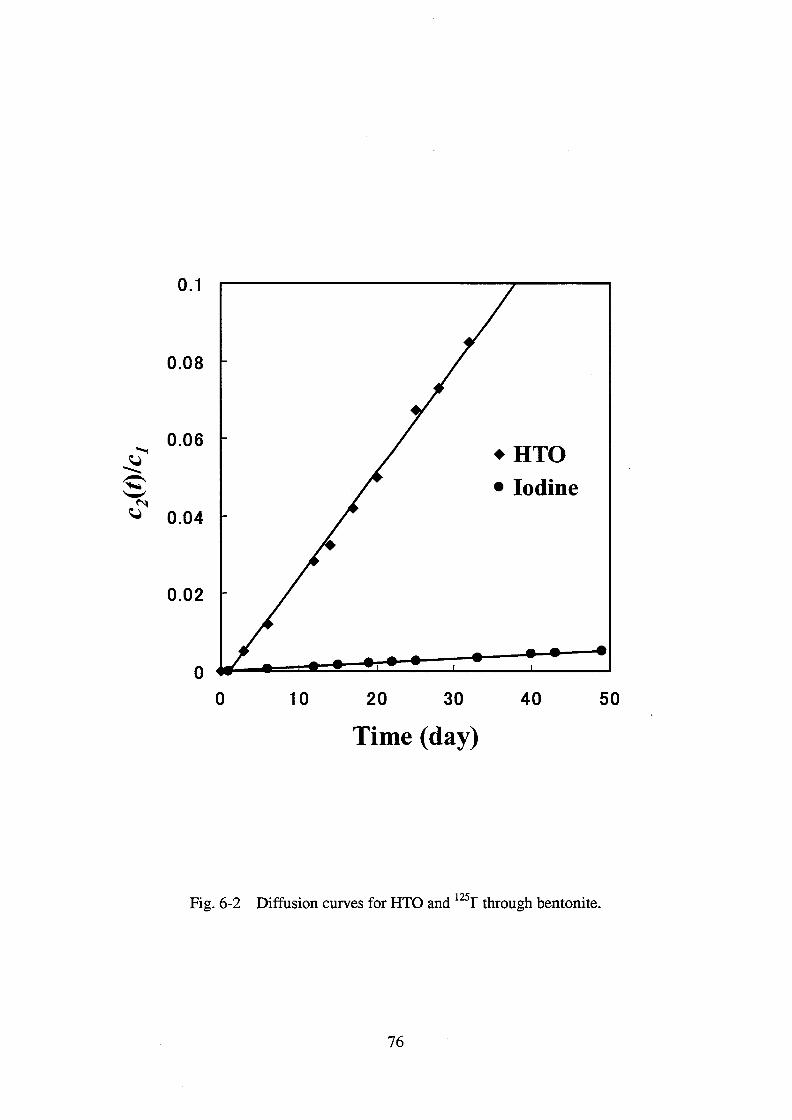

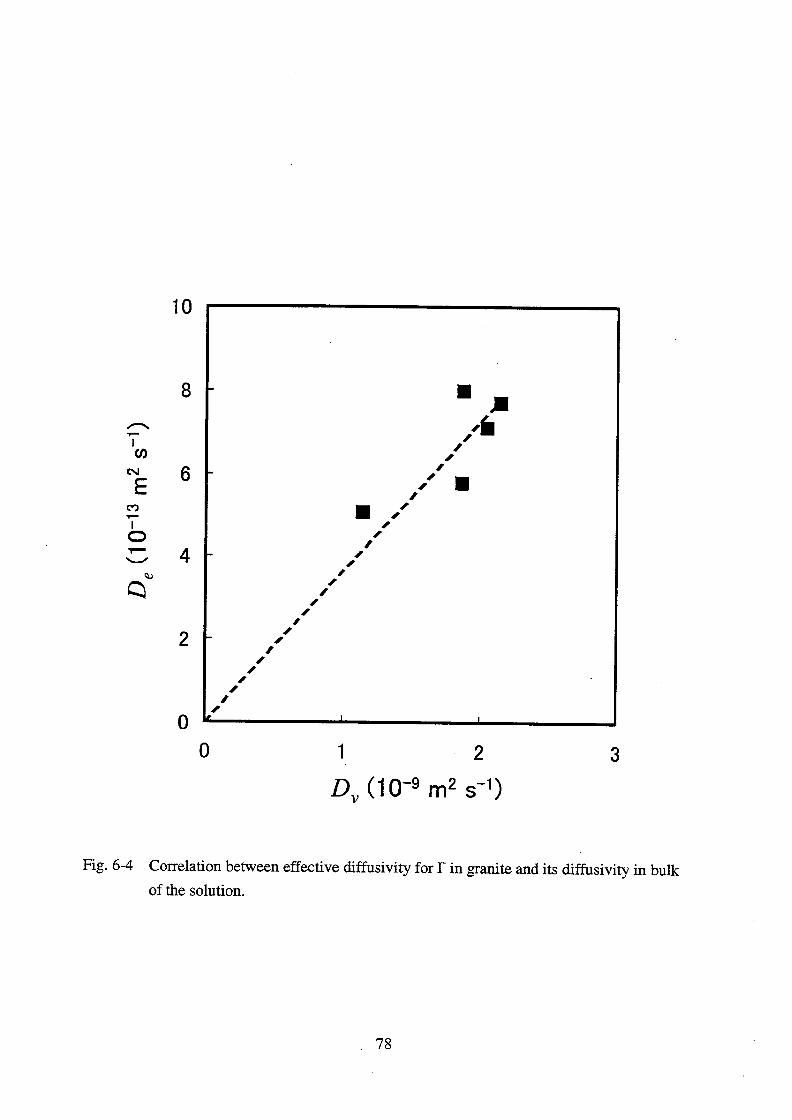

79
7. Diffusive behavior of actinide carbonate complexes
7.1. Introduction
It may be possible to apply Eq. (1-4) to estimate the De value for actinide species such as
UO22+
, Th4+
, and several trivalent actinides whose bulk diffusivities in solution are known (Li
& Gregory, 1974; Fourest et al., 1995). This is not the case, however, for actinide complex
species because data on their bulk diffusivity are not available. It is necessary to
experimentally determine the diffusivity in rock matrices for carbonate complex species that
are potential dominant aqueous species of actinides in groundwater under geologic disposal
conditions.
The objectives of this chapter are to perform series of through-diffusion experiments for
actinide carbonate complexes in granite and to see if the surface diffusion is significant or not.
7.2. Experimental
Preparation
The preparation of the Inada granite disk and the acrylic diffusion cell used in this study
were the same as those described in chapter 3. After evacuating all air from the interconnected
pores in the granite disk, the diffusion cell was transferred into an atmosphere-controlled
chamber and was filled with a working solution under atmospheric pressure to pre-condition the
disks for the solution for 30 days. The oxygen concentration in the chamber was kept lower than
a few ppm. Solutions were prepared from reagent grade chemicals (Wako Pure Chemical Ind.,
Ltd. or Aldrich Chemical Company, Inc.) and distilled and deionized water (Milli-Q Labo
System, Millipore). The diffusion experiments were performed in triplicate at room temperature.
Series 1
The first series of experiments was performed for Pu using the granite and the groundwater
from URL described in chapter 4. The diffusion experiment was performed in triplicate using
three granite disks, F3, F6 and F9 under N2 atmosphere. Plutonium-238 was prepared as a
2.6x10⁻²
mol m-3
(4x10¹²
Bq m-3
) Pu(IV) solution in aqua regia. The starting source solution
was prepared by combining a 1.5x10⁻⁵
m3 volume of 10
2 mol m
-3 NaHCO3 solution, a 1x10
-8
m3 volume of 1.5x10
4 mol m
-3 NaOH, a 1x10
-8 m
3 volume of a Pu stock solution, 3x10
-6 m
3
volume of 1.2x10² mol m
-3 NaNO2 solution, a 3x10
-4 m
3 volume of the groundwater and a
42x10-6
m3 volume of deionized water in a polypropylene bottle. The groundwater was
filtered through 0.2 m filter before use. The initial concentrations of Pu, total carbonate and

80
NO2- were planed as 7.2x10
-7 mol m
-3, 2.5 mol m
-3 and 1 mol m
-3, respectively. The pH and
Eh were measured. Lowering of the pH of the solution during preparation may cause loss of
bicarbonate ion from the solution and precipitation of PuO2·nH2O. To minimize pH changes
of the groundwater through the preparation, Pu was prepared as NaHCO3 solution and then
mixed with groundwater. A couple of 2x10⁻⁷
m3 aliquots was taken from the source solution to
determine the Pu concentration in the source solution. A Pu diffusion experiment was started
by placing the solution into one reservoir of the diffusion cell. A 2x10⁻⁷
-m3 aliquot was taken
after 4, 24 and 120 hours to measure the Pu concentration by liquid scintillation counting
(LSC). A 1x10⁻⁶
-m3 aliquot was sampled from the measurement reservoir and 1x10
-7-m
3
aliquot from the source reservoir at approximately 10 days intervals to follow the Pu
concentration with time. The balance between the water levels in the 2 reservoirs was
maintained by adding the groundwater into the measurement reservoir.
The oxidation state of Pu in the source solution was analyzed by using TTA extraction
technique (Foti & Freiling, 1964; Nitsche et al., 1988) under N2. A 2x10⁻⁷
m3 volume of the
source solution was acidified with 1.8x10⁻⁶
m3 of 1.1x10
3 mol m
-3 HCl in a vial. A 2x10
-6-m
3
volume of a 4x10² mol m
-3 TTA xylene solution was added and the mixture was shaken for 10
min. The extraction procedure was triplicated. The mixture was settled for another 10 min for
phase separation. A 2x10⁻⁷
m3 aliquot was taken from aqueous and organic phase and the Pu
concentration was measured. The oxidation state of Pu in the stock solution was also analyzed
by the same procedure for comparison.
After terminating the 1st series of experiments, 1x10
-6-m
3 aliquots were withdrawn from the
reservoirs and analyzed by LSC. The remainder of the solutions was removed from both
reservoirs of the three diffusion cells, F3, F6 and F9. Both reservoirs of these three cells were
filled with 1x10⁻⁴
-m3 volume of distilled and deionized water and left to soak for a 1-hour
period. 1x10⁻⁶
-m3 aliquots of these rinse solutions were taken from the reservoirs and prepared
for radiometric analysis by LSC to determine the amount of Pu readily removed from inner
walls of the reservoirs. The remaining rinse solution was removed from the cells and discarded.
The three diffusion cells were then removed from the N2 glove box and disassembled. Both
acrylic compartments of the three diffusion cells were washed with 1.1x10⁻⁴
m3 of 10
3 mol m
-3
HCl for a 24-hr period. 1x10⁻⁶
-m3 aliquots of the acid washings were taken for radiometric
analysis by LSC.
The granite disks were each sandwiched between two photographic plates for a period of 7
days and for a period of 20 days. Four small granite coupons were cut from one of the granite
disks using a diamond cut off saw. The dimensions of these coupons is 4x10-3
m x 8x10-3
m.
The surface of the coupon exposed to the source reservoir were ion milled at the rate of
1.2x10⁻¹⁰
m min-1
or 7x10⁻⁹
m hr-1
. The samples were ion milled for 4, 8, 16, and 32 hours to
remove 2.9x10⁻⁸
, 5.7x10⁻⁸
, 1.15x10⁻⁷
and 2.3 x10⁻⁷
m of granite from the surfaces. The

81
coupons were autoradiographed afterwards. A piece of granite disk used in the Pu diffusion
experiment was sliced laterally at an angle using a diamond wheel saw as shown in Fig 7-1.
The smallest thickness of the “hot” side of the granite wedge was ~ 1x10⁻³
m. The “cold” side
of this wedge was contacted with a piece of LR 115 film.
Series 2
The 2nd
series of experiments was performed for Pu through the Inada granite using a 102
mol m-3
NaHCO3 solution at room temperature (24.5±3.2 C). The diffusion experiment was
performed in triplicate using three granite disks, D4, J4 and J5. A working solution was
prepared in an atmosphere-controlled chamber under Ar by adding NaHCO3 powder and
Na2S2O4 powder into distilled and deionized water. The total carbonate concentration and the
concentration of S2O42-
in the working solution was 102 and 10 mol m
-3, respectively.
Plutonium (0.0031% 238
Pu, 97.41% 239
Pu, 2.56% 240
Pu and 0.026% 241
Pu) as chemically
purified by TTA extraction and was prepared as 3.2 mol m-3
(1.77x10¹²
Bq m-1
) Pu(IV) stock
solutions in 104 mol m
-3 HNO3. The starting solution was prepared by combining a 6x10
-4 m
3
of volume of the working solution and a 1x10⁻⁶
-m3 volume of 2x10
3 mol m
-3 NaOH solution
and a 2x10⁻⁷
-m3 volume of the Pu stock solution in a polypropylene bottle. The pH and the Eh
were measured. Three 1x10⁻⁷
-m3 aliquots were withdrawn to determine the Pu concentration.
The diffusion experiments were started by placing the starting solution in the source
reservoir and an equal volume of the working solution in the other, measurement, reservoir. At
7 days intervals, 1x10⁻⁶
m3 aliquot was taken from the measurement reservoir and analyzed by
LSC. The 1x10⁻⁶
-m3 aliquot removed from the measurement reservoir was replaced by an
equal volume of the working solution to maintain the balance between thee water levels in the
2 reservoirs. At 28 days intervals, the pH and Eh of the source solution were measured and
two 1x10⁻⁷
-m3 aliquots were taken from the source reservoir for radiometric analysis by LSC
and for carbonate concentration analysis by carbonate electrode, CE-331 (TOA Electronics
Ltd.).
After the 2nd
series of experiments, the oxidation state of Pu was analyzed for each
reservoir by using TTA extraction technique that was described above. Since the extraction
period of 10 min could be long enough to oxidize Pu(III) to Pu(IV), another series of
extraction was performed by shaking the mixture for 1 min for comparison. The remainder of
the solutions was removed from both reservoirs of the three diffusion cells. The reservoirs were
rinsed with a 1x10⁻⁵
-m3 volume of distilled and deionized water 3 times and then washed with a
1x10⁻⁵
-m3 volume of 10
4 mol m
-3 HNO3. The washings were sampled for radiometric analysis
by -spectrometry to determine the amount of Pu adsorbed on the inner walls of the diffusion
cell.

82
Series 3
The 3rd
series of experiments was performed for Np through the Inada granite at room
temperature (26±1 C). The diffusion experiment was performed in triplicate using three
granite disks, D7, J7 and J8. A working solution was prepared in an atmosphere-controlled
chamber under Ar by adding NaHCO3 powder and Na2S2O4 powder into distilled and
deionized water. The total carbonate concentration and the concentration of S2O42-
in the
working solution was 103 and 50 mol m
-3, respectively. Neptunium-237 was prepared as 22
mol m-3
(1.36x10¹¹
Bq m-3
) Np(IV) stock solution in 103 mol m
-3 HCl. The starting solution
was prepared by combining a 6x10⁻⁴
-m3 volume of the working solution and a 1.8x10
-6-m
3
volume of the Np stock solution in a polypropylene bottle. The pH and the Eh were measured.
Three 1x10⁻⁷
-m3 aliquots were withdrawn to determine the Np concentration. The diffusion
experiments were started by placing the starting solution in the source reservoir and an equal
volume of the working solution in the other, measurement, reservoir. At 10 days intervals,
1x10⁻⁶
-m3 aliquot was taken from the measurement reservoir and analyzed by LSC. The
1x10⁻⁶
-m3 aliquot removed from the measurement reservoir was replaced by an equal volume
of the working solution to maintain the balance between thee water levels in the 2 reservoirs.
After the 3rd
series of experiments, three 1x10⁻⁷
-m3 aliquots were taken from the source
reservoir for radiometric analysis by LSC. The oxidation state of Np in the source solutions
was analyzed by using TTA extraction technique that was described above. The pH, Eh and
total carbonate concentration were measured for both reservoirs of the three diffusion cells.
The amount of Np adsorbed on acrylic walls was determined by the procedures described for
the 2nd
series of experiments.
Series 4
The 4th
series of experiments was performed for U, Pu and Am through Inada granite under
aerobic condition for comparison. The diffusion experiment was performed in triplicate using
three granite disks, C15, C17 and C19 at (25±1)°C. Uranium-233 and americium-241 were
prepared as 8.6x10⁻¹
mol m-3
(7.1x10¹⁰
Bq m-3
) and 1.8x10⁻³
mol m-3
(5.6x10¹⁰
Bq m-3
) stock
solutions, respectively, in 102 mol m
-3 HCl. Plutonium-239 was prepared as 4.2x10
-1 mol m
-3
(2.3x10¹¹
Bq m-3
) Pu(IV) stock solution in 104 mol m
-3 HNO3. The starting solution was
prepared by combining 1x10⁻⁴
m3 of 10
2 mol m
-3 Na2CO3, 2.75x10
-4 m
3, 10
2 mol m
-3 NaHCO3,
3x10⁻⁶
m3 of the
233U stock solution, 9.5x10
-7 m
3 of the
239Pu stock solution and 1x10
-6 m
3 of
241Am stock solution in a polypropylene bottle. To maintain the Pu in the tetravalent state,
0.26 g NaNO2 was added to this mixture. The pH was adjusted to 9.3 by adding dilute NaOH
and HCl. The initial concentrations of total carbonate and NO2- in the source solution were
102 and 10 mol m
-3, respectively. The Eh and concentration of
233U,
239Pu and
241Am were
determined and the oxidation state of Pu was determined by TTA extraction. To measure the

83
concentrations of actinides in the source solution, a 5x10⁻⁸
m3 aliquot was withdrawn and
diluted to 2x10⁻⁶
m3 to prevent the salt from interfering with -spectrometry of the samples. A
5x10⁻⁸
m3 aliquot of this diluted solution was evaporated on a stainless steel planchet and its
activity determined by -spectrometry. The solution was stored for 40 days in atmosphere at
room temperature to ensure that the concentrations of the actinides remained constant. The pH,
Eh, total carbonate concentration and concentrations of the actinides were determined again,
and the TTA extraction was performed. A blank solution was prepared by adding NaHCO3
powder and NaNO2 powder into distilled and deionized water. The pH was adjusted to 9.3.
The diffusion experiments were started by placing the actinide-containing solution in the
source reservoir and the blank solution in the other, or measurement reservoir. At 10 days
intervals, a 5x10⁻⁸
m3 aliquot was taken from the measurement reservoir to determine the
concentrations of the actinide elements. The 5x10⁻⁸
m3 aliquot removed from the
measurement reservoir was replaced by an equal volume of the blank solution to maintain the
balance between the water levels in the two reservoirs and to avoid actinide transport through
the granite by advective flow. The concentrations of U, Pu and Am, pH, Eh and total
carbonate concentration of the solution in one of the source reservoirs were determined at the
55th
and the 366th
day. At the termination of each experiment, the inner wall of the
measurement reservoir was washed with 104 mol m
-3 HNO3 to determine the amount of
diffusing species adsorbed on the cell walls.
7.3. Results
The result of TTA extraction for the Pu starting solution for the 1st series of experiments
was shown in Table 7-1. There is no significant difference between the extraction for the stock
solution and that for the source solution. The result suggests the Pu(IV) groundwater solution
was successfully prepared. No plutonium was observed in the measurement reservoirs
throughout the experiments. That is consistent with the fact that the photographic plates in
contact with the “cold” side of the granite disks for 20 days showed no image. Concentrations
of 238
Pu in the source reservoirs decreased quickly after the start of the diffusion as shown in
Table 7-2. Sorption onto granite is responsible for the decrease. The autoradiographic images
for the “hot” side of the granite disks exposed for 7 days are shown in Fig. 7-2 with the
corresponding optical images. The images show the sorption of Pu on the granite samples. The
results of the radiometric analysis for the final contact solution, the DDW rinsings and the acid
washings are shown in Table 7-3. The amount of Pu associated with the acrylic compartments
was 37 – 68 % of the initial inventory. Adsorption onto the acrylic compartment was also
responsible for the decrease of Pu concentration in the source reservoirs. No difference was
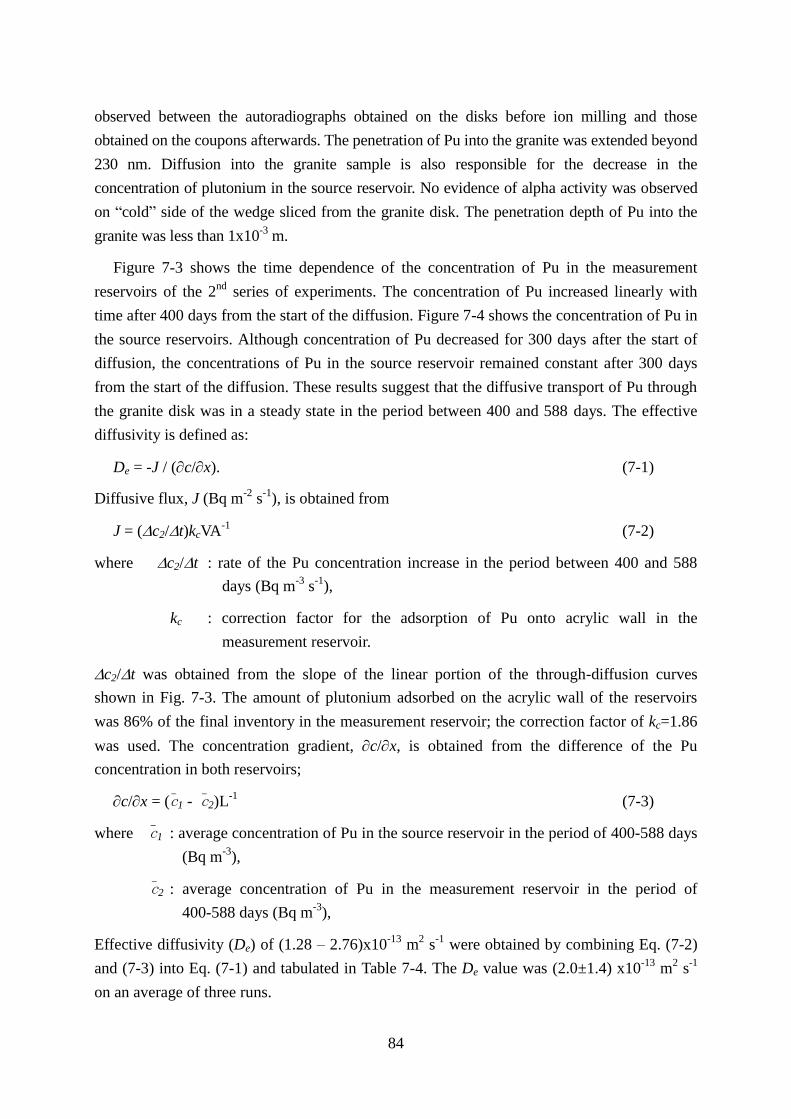
84
observed between the autoradiographs obtained on the disks before ion milling and those
obtained on the coupons afterwards. The penetration of Pu into the granite was extended beyond
230 nm. Diffusion into the granite sample is also responsible for the decrease in the
concentration of plutonium in the source reservoir. No evidence of alpha activity was observed
on “cold” side of the wedge sliced from the granite disk. The penetration depth of Pu into the
granite was less than 1x10⁻³
m.
Figure 7-3 shows the time dependence of the concentration of Pu in the measurement
reservoirs of the 2nd
series of experiments. The concentration of Pu increased linearly with
time after 400 days from the start of the diffusion. Figure 7-4 shows the concentration of Pu in
the source reservoirs. Although concentration of Pu decreased for 300 days after the start of
diffusion, the concentrations of Pu in the source reservoir remained constant after 300 days
from the start of the diffusion. These results suggest that the diffusive transport of Pu through
the granite disk was in a steady state in the period between 400 and 588 days. The effective
diffusivity is defined as:
De = -J / (c/x). (7-1)
Diffusive flux, J (Bq m-2
s-1
), is obtained from
J = (c2/t)kcVA-1
(7-2)
where c2/t : rate of the Pu concentration increase in the period between 400 and 588
days (Bq m-3
s-1
),
kc : correction factor for the adsorption of Pu onto acrylic wall in the
measurement reservoir.
c2/t was obtained from the slope of the linear portion of the through-diffusion curves
shown in Fig. 7-3. The amount of plutonium adsorbed on the acrylic wall of the reservoirs
was 86% of the final inventory in the measurement reservoir; the correction factor of kc=1.86
was used. The concentration gradient, c/x, is obtained from the difference of the Pu
concentration in both reservoirs;
c/x = (c1 - c2)L-1
(7-3)
where c1 : average concentration of Pu in the source reservoir in the period of 400-588 days
(Bq m-3
),
c2 : average concentration of Pu in the measurement reservoir in the period of
400-588 days (Bq m-3
),
Effective diffusivity (De) of (1.28 – 2.76)x10-13
m2 s
-1 were obtained by combining Eq. (7-2)
and (7-3) into Eq. (7-1) and tabulated in Table 7-4. The De value was (2.0±1.4) x10-13
m2 s
-1
on an average of three runs.

85
Equation (3-9) cannot be applied to determine (+Rd) because concentration of Pu in the
source reservoir changed as shown in Fig. 7-4. Spacek & Kubin (1967) proposed a method to
determine apparent diffusivity in the case that the concentration of diffusing species in source
reservoir decreases with time due to diffusion into membranes. This method used in chapter 4
can neither be used in this study because the concentration of Pu in the source reservoir
decreased due to precipitation of PuO2·xH2O as well as diffusion into granite and subsequent
sorption onto mineral surfaces. An intercept on x axis of the linear portion of the Pu
through-diffusion curve is 362±14 days. The intercept of 1.21±0.36 days was calculated from
Eq. (3-9) for a hypothetical species whose effective diffusivity is (2.0±1.4)x10-13
m2 s
-1 that is
not adsorbed on the granite. Regarding the ratio of the two intercepts, 300±90, as sorption
retardation factor, (1+Rd-1
), value for (+Rd) was calculated and tabulated in Table 7-4.
Figure 7-5 shows the time dependence of the concentration of Np in the measurement
reservoirs of the 3rd
series of experiments. The amount of Np adsorbed on the wall of the
reservoirs was negligibly small. The concentration of Np increased linearly with time after 50
days from the start of the diffusion. The concentrations of Np in the source reservoirs remain
constant throughout the diffusion run. The method described by Crank (1975) was used to
analyze the data. After plotting the concentration of diffusing species in the measurement
reservoir against time, values for De are obtained from the slope, and the rock capacity factor,
(+Rd), from the intercept on the concentration axis of the extrapolated linear portion, where
is the bulk density of the rock and Rd is the distribution ratio. Effective diffusivity (De)
ranged from 2.85x10⁻¹³
m2 s
-1 to 5.41x10
-13 m
2 s
-1 and (+Rd) ranged from –0.01 to +0.33
were obtained by the least squares fitting and tabulated in Table 7-4. The effective diffusivity
and the rock capacity factor was (4.0±1.5) x10-13
m2 s
-1 and 0.15±0.22, respectively, on an
average of three runs. The result of the TTA extraction analysis presented in Table 7-1 shows
that the neptunium was in tetravalent state until the end of the diffusion run.
Figure 7-6 shows the time dependence of the concentrations of 233
U, 239
Pu and 241
Am in the
measurement reservoirs for the 4th
series of experiments. No americium was observed in the
measurement reservoirs throughout the experiments. The concentrations of U and Pu increase
linearly with time after 150 days. For all three cells, the increase in relative uranium
concentration was greater than that of plutonium. The relative uranium concentration in cell
C17 was the largest of the 3 runs and that of C19 the smallest. This order is the same for Pu
concentration. The amount of uranium, plutonium and americium adsorbed on the acrylic wall
of the reservoirs were found to be 3% of the inventory in the solutions in the reservoirs and
can be ignored. The concentrations of all three actinides in the source reservoir remained
virtually constant, as shown in Table 7-5, suggesting no significant removal occurred by
precipitation and/or sorption on reservoir walls or on the surfaces of the granite disks. The
method described by Crank (1975) was used to analyze the data as described above. The

86
effective diffusivity and the rock capacity factor are presented in Table 7-4 with literature
data.
7.4. Discussion
The extent of penetration of the Pu into the granite disk for the 1st series of experiments was
estimated using a diffusion model. Pu was assumed to be present initially in a very thin layer on
the outer surface of the granite disk because almost all of the Pu in the source reservoir had
disappeared from solution in a very short time period. The solution to the diffusion equation is
C(x, t) = (Dat)-0.5
exp(-x2 / 4Dat). (7-4)
The minimum Da value of 1x10-21
m2 s
-1 was roughly estimated as shown in Fig. 7-7 from the
fact that no difference was observed between the autoradiographs obtained before ion milling
and those obtained afterwards. The maximum Da value of 1x10-15
was roughly estimated as
shown in Fig. 7-7 from the fact that the penetration depth of Pu into the granite was less than
1x10⁻³
m. Using a value of 2.0x10⁻¹³
m2 s
-1 for the effective diffusivity of Pu obtained from the
second series of experiments and a Rd of 0.28 m3 kg
-1 (Vandergraaf and Ticknor 1994), an
apparent diffusivity of 2.7x10⁻¹⁶
m2 s
-1 is estimated using Eq. (4-2). The calculated Pu profile in
the granite after 1000 days contact time is also shown in Figure 7-7. The calculated Pu profile is
consistent with the experimental observation that the penetration depth of Pu was more than 230
nm and was less than 1x10⁻³
m. Diffusion of sorbed species in granite can be enhanced through
the surface diffusion as discussed in chapters 3, 4 and 5. In the 1st series of experiments,
enhancement of the diffusivity was not observed for Pu although Pu was adsorbed on the granite.
The contribution of the surface diffusion may be significant for species that is
electro-statically adsorbed on the mineral surfaces, but not for the actinide carbonate
complexes that is adsorbed on the surfaces through chemical reactions or surface
complexation.
The result of the TTA extraction analysis presented in Table 7-3 shows that the plutonium
was in tetravalent state until the end of the 2nd
series of experiments. Since Pu(III) can be
oxidized to Pu(IV) during the 10-min extraction period and extracted by TTA, 1-min
extraction was performed for Pu. The results were the same as that of 10-min extraction,
which suggests that Pu(III) is unlikely to be dominant. Speciation calculation using a
thermodynamic database (Yamaguchi 2000) shows that a hydroxy-carbonate complex of
Pu(IV), Pu(CO3)2(OH)22-
is dominant under the employed condition. The effective diffusivity
of Pu obtained in the granite obtained from the 4th
series of experiments was 1/4 as high as the
value from the 2nd
series of experiments. The 4th
series of experiments were performed under
aerobic atmosphere under which Pu was partially oxidized to Pu(VI), which might be

87
responsible for the difference in the De value. The diffusion experiments for neptunium were
performed under higher NaHCO3 concentration than that for plutonium where carbonate
complexes of Np(IV), Np(CO3)44-
and Np(CO3)56-
were predicted to be dominant.
The De value obtained for uranium in the 4th
series of experiments was (1.42±0.29)x10-13
m2 s
-1 on an average of three experiments. This value is larger by four times than that of the
uncomplexed uranyl ion, UO22+
, (3.6±1.6)x10-14
m2 s
-1 obtained in chapter 3. The previous
experiment had been performed in 102 mol m
-3 KCl solution at pH 4, while this experiment
was in 102 mol m
-3 NaHCO3 at pH 9.3. In aerated solutions, the dominant oxidation state of
uranium is hexavalent. Complexation of UO22+
by nitrite anion is negligible (Brown and
Wanner, 1987). Speciation of uranium(VI) under the conditions under which this experiments
was performed was calculated using the data compiled by Yamaguchi & Takeda (1999). More
than 99.9 % of the uranium was calculated to be present as a monomeric tri-carbonate
complex, UO2(CO3)34-
throughout the experiment. The structure of the complex species is
shown elsewhere (Weigel, 1985). The bond length between the uranium atom and the nearest
oxygen atoms of the carbonate groups is 0.244-0.246 nm (Weigel, 1985). The bond length
between the carbon atom and the oxygen atoms in the carbonate group is 0.122-0.134 nm
(Weigel, 1985). Based on these bond length, the size of this species was graphically estimated
to be 0.42±0.03 nm. The radius of the ions can be correlated with diffusivity (Yamaguchi et
al., 1997a) using the relationship
D0 = RT(r/rs) / (6N0
r) (7-5)
where D0 : diffusivity of ion at infinite dilution (m
2 s
-1)
R : gas constant (= 8.314 J mol-1
K-1
)
T : absolute temperature (K)
r : hydrated ion radius (m)
r/rs : correction factor ( - )
N : Avogadro's number (= 6.02x10²³
mol-1
)
0 : viscosity of water (8.902x10
-4 N s m
-2 at 25°C)
The diffusivity of UO2(CO3)34-
was estimated to be (7.2±0.5)x10-10
m2 s
-1 assuming no
significant hydration occurs. In this calculation, the correction factor r/rs is 1.23 (Nightingale,
1959). An empirical correlation between De and Dv has been presented in chapter 3. The value
for UO2(CO3)34-
obtained in this experiment is consistent with the previously-obtained
correlation as shown in Fig. 7-8.
It is noteworthy that the diffusivity of the UO2(CO3)34-
complex is larger than that of the
"master" species, UO22+
, both in bulk of the solution and in the pores of the granite. A similar

88
effect of complexation on the diffusivity of metal ions has been observed for Fe2+
and Fe3+
complexes with CN- (Dean, 1978). The diffusivity of Fe(CN)6
4- at infinite dilution, 7.3x10
-10
m2 s
-1, is larger than that of Fe
2+, 7.1x10
-10 m
2 s
-1 and the diffusivity of Fe(CN)6
3- at infinite
dilution, 8.8x10⁻¹⁰
m2 s
-1, is larger than that of Fe
3+, 5.9x10
-10 m
2 s
-1.
In aerated solutions, the dominant oxidation state of americium is trivalent. Based on the
data compiled by Yamaguchi & Takeda (1999), a tri-carbonate complex species, Am(CO3)33-
is predicted to be dominant under the employed condition. No diffusion of americium through
the granite was detected. This suggests that either the effective diffusivity is very small or the
distribution ratio very large. Eq. (3-9) shows that the intercept on the time axis of the
extrapolated linear portion of a through-diffusion curve is (+Rd)L2/6De or L
2/6Da. An upper
limit to the apparent diffusivity, Da, of americium in the granite was estimated to be 1.3x10⁻¹³
m2 s
-1 from L
2/6Da < 366 days. For comparison, the apparent diffusivities of uranium and
plutonium in the 4th
series of experiments were (4.6±1.0)x10-13
and (4.4±0.9)x10-13
m2 s
-1,
respectively. The apparent diffusivity of americium was smaller than those for uranium and
plutonium. A similar low diffusivity for americium in rock has been observed elsewhere
(Torstenfelt, 1982; Muuronen et al., 1986; Suksi et al., 1987; Berry et al., 1987; Ittner and
Torstenfelt, 1988; Andersson et al., 1992). Similarly to the results from the 1st series of
experiments, enhancement of the diffusivity was not observed for Am species although Am was
adsorbed on the granite.
The effective diffusivity of Np and Pu carbonate complexes and that of uranyl tri-carbonate
complex species obtained previously are close each other, ranging from 1.4x10⁻¹³
to 4.0x10⁻¹³
m2 s
-1. The effective diffusivity of aqueous species in the granite obtained in chapter 2 is
ranged widely between 3.6x10⁻¹⁴
m2 s
-1 and 1.0x10
-11 m
2 s
-1. Equation (3-4) shows that the
variation in De is caused by variation in Dv. Rai et al. (1999a) reported structure of Np(CO3)56-
.
The distance between central cation and distal oxygen of carbonate group is 0.42 nm, which
was close to that of UO2(CO3)34-
, 0.40 nm (Weigel, 1985). Although ionic structure is not
known for Pu(CO3)2(OH)22-
, the effective radii of the hydroxy-carbonate complex species in
solution are expected to be similar to Np(CO3)56-
and UO2(CO3)34-
because that is roughly
defined by the size of a bulky carbonate group. The effective size is similar for Np(CO3)56-
,
UO2(CO3)34-
and Pu(CO3)2(OH)22-
, and their diffusivity in water are expected to be similar
based on Eq. (7-5). This may be the reason that the effective diffusivity of the carbonate
complexes in granite are close to each other. The contribution of the surface diffusion also
induces wide variety in De value in the granite for the species that is electrostatically adsorbed
on the mineral surfaces. However, this is not the case for the actinide carbonate complexes.

89
7.5. Conclusion
The diffusivity of uranium, neptunium, plutonium and americium in granite matrices has been
studied by the through-diffusion method in the presence of carbonate. Effective diffusivities for
Pu(CO3)2(OH)22-
, Np(CO3)n4-2n
(n=4, 5) and UO2(CO3)34-
, in Inada granite, of (2.0±1.4)x10-13
m2 s
-1, (4.0±1.5)x10
-13 m
2 s
-1 and (1.42±0.29)x10
-13 m
2 s
-1, respectively, have been obtained.
The effective diffusivity of UO2(CO3)34-
in granite and the estimated bulk diffusivity of this
species, (6.6±0.4)x10-10
m2 s
-1, are consistent with an empirical correlation between De and Dv
obtained in chapter 3. In separate series of experiments for plutonium and americium under
the conditions that adsorption onto granite is more favorable, enhancement of the diffusivity by
surface diffusion was not observed. Upper limits of Da value were determined to be 1x10-15
m2 s
-1 and 1.3x10
-13 m
2 s
-1 for plutonium and americium, respectively. The contribution of the
surface diffusion is not significant for the actinide carbonate complexes that is adsorbed on
the surfaces through surface complexation. Actinide complex species that is formed in
groundwater under deep geological environments migrate through rock matrix following to
the Fick’s diffusion law, and the diffusivities are consistent with the pore-diffusion model.


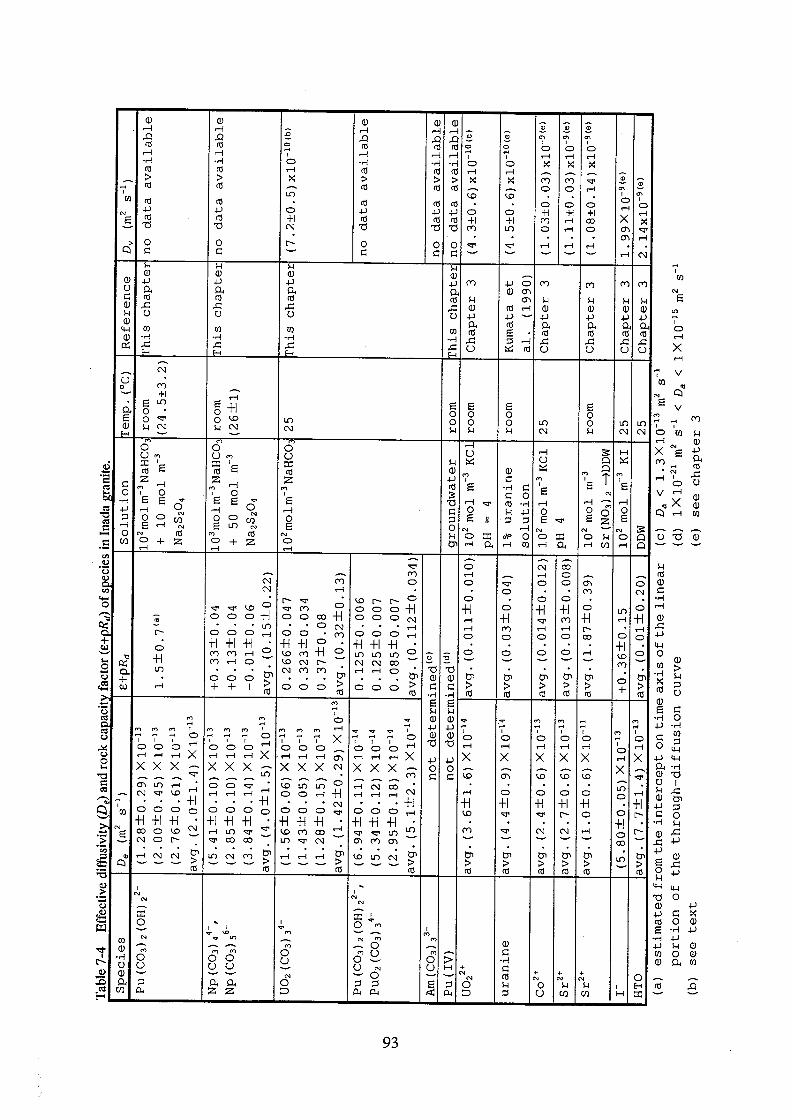


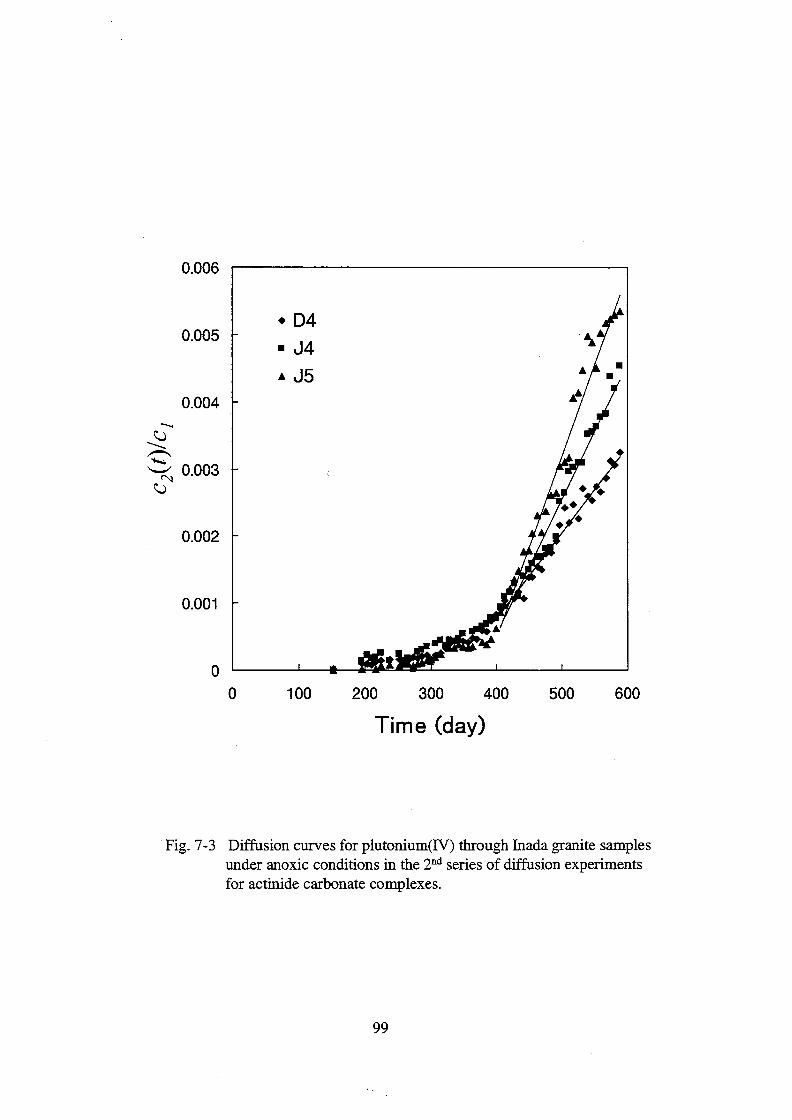


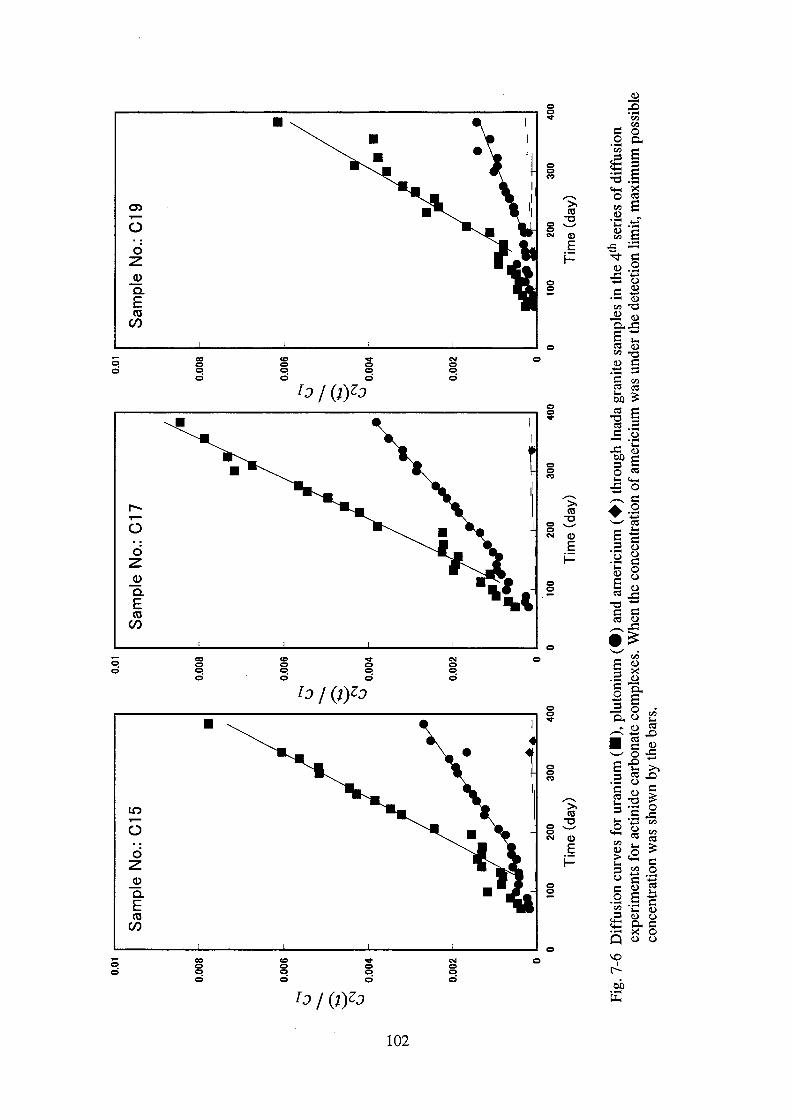


105
8. Thermodynamic data acquisition and data compilation
8.1. Introduction
The effective diffusivity of uranium, neptunium and plutonium in Inada granite was
determined and the chemical species of the actinides under the experimental conditions were
predicted to be UO2(CO3)34-
, Pu(CO3)2(OH)22-
and Np(CO3)n4-2n
(n=4, 5), respectively, in
chapter 7. Prediction of the diffusing species that is formed in aqueous solution requires
knowledge of all relevant species present in solution. Thermodynamic database is necessary
for the prediction. The thermodynamic database is also useful for predicting solubility of
radionuclides in groundwater that is one of essential parameters required for performance
assessment of geological disposal of radioactive wastes. OECD/NEA released extensive
volumes of thermodynamic database for uranium (Grenthe et al., 1992) and for americium
(Silva et al., 1995), which enabled reliable speciation for these actinides. Thermodynamic
database is necessary for neptunium and plutonium.
Because of their strong tendency of complexation, carbonate or bicarbonate ions are likely
to be some of the most significant ligands to be considered (Kim, 1986; Newton & Sullivan,
1985). Therefore, a clearer understanding of the carbonate complexation is needed especially
for tetravalent state whish is favorable under geological disposal conditions. Experimental
data on the complexation of tetravalent plutonium by carbonate are limited in number and
poor in quality. For example, Moskvin & Gel'man (1958) predicted the mono carbonate
complex species, PuCO32+
, for 0.36 - 3.6 mol kg-1
K2CO3 solutions. Their work, however, has
been reviewed critically (Lierse, 1985; Puigdomènech & Bruno, 1991), and some
misunderstandings have been pointed out. Kim et al. (1983) suggested that Pu(CO3)x4-2x
(x = 1
- 5) are the dominant aqueous species with Pu(OH)2CO3(s) as the solubility-controlling solid
in NaClO4 / NaHCO3 / Na2CO3 solutions at pH > 8 and I = 1.0. Their interpretation of the
solubility data, however, was criticized by Rai & Ryan (1985). Considering the critical role of
carbonate complex species in safety assessment of radioactive waste disposal, experiments on
the speciation of Pu(IV) in the aqueous carbonate system should be performed.
The objectives of this chapter are to compile thermodynamic database for Np and Pu for
predicting dominant diffusing species in granite pore water and to experimentally obtain
lacking thermodynamic data for Pu(IV) in aqueous carbonate system.

106
8.2. Experimental
Sample solutions were prepared from reagent grade chemicals (Wako Pure Chemical Ind.,
Ltd., Tokyo) and deionized water (Milli-Q System, Millipore). The isotopic composition of
the plutonium was 0.0031% 238
Pu, 97.41% 239
Pu, 2.56% 240
Pu and 0.026% 241
Pu. Plutonium
was chemically purified by anion exchange. The eluted Pu in hydrochloric acid was converted
to Pu(IV) as a nitrate and prepared as a 1.8x10⁻¹
mol m-3
solution in 104 mol m
-3 HNO3.
An aliquot of the Pu(IV) stock solution was added to a 2x10⁻⁵
m3 solution containing KCl,
K2CO3 and KOH in a polypropylene tube. The initial concentrations of Pu(IV), K+ and total
carbonate (Ct) in the sample solution were typically 1.3x10⁻⁶
, 0.1 and 10-4
- 10-1
mol kg-1
,
respectively. The pH was adjusted to values between 9.4 and 13.0 by adding dilute KOH. A
10-7
m3 volume of 10
-1 mol kg
-1 NaNO2 solution was added to maintain the Pu in the
tetravalent state. The samples were sealed and stored for 2 weeks in air at room temperature
(20 - 25°C).
After two weeks, the pH and Eh of the sample solutions were measured with a Ag/AgCl
electrode and a Pt/AgCl electrode, respectively. The electrode was calibrated with pH buffer
solutions (pH = 6.86 and 9.18) and a ORP standard (95 mV against the reference electrode).
The total carbonate concentration was measured with CO2 electrode (TOA Electronics Ltd.
Japan, type CE-235, detection limit: 4.0x10⁻⁵
mol kg-1
). The electrode had been calibrated
with a KHCO3 solution using the same procedure as for the measurement of the carbonate
concentration. The micro-centrifuge system (Millipore) was used to effect the separation
processes. A 5x10⁻⁷
m3 aliquot of the sample solution was filtered through 0.45 µm durapore
(PVDF) and 10,000 NMWL (nominal molecular weight limit) polysulfur filters that had been
rinsed with blank solution. The average pore size was estimated to be about 4.5x10⁻⁷
m and
3x10⁻⁹
m, respectively. Plutonium remaining on filters was re-dissolved by passing in 103
mol m-3
HNO3 through these filters. The concentration of Pu was measured with a
spectroscopy after evaporating 5x10⁻⁸
m3 of the final filtrate on a stainless steel planchet.
The oxidation state of the Pu was determined by TTA extraction (Foti & Freiling, 1964;
Nitsche et al., 1988; Pratopo et al., 1990). A 10-7
m3 aliquot of the final filtrate was acidified
with 10-6
m3 of 10
3 mol m
-3 HCl. An equal volume of 4x10
-4 mol m
-3 TTA in xylene solution
was added and the mixture was shaken for 10 min. This method was validated using K2CO3
solutions spiked with a Pu(IV) stock solution and a Pu(VI) perchloric acid solution and by
re-acidifying these solutions (Pu concentration = 10-8
mol kg-1
) within 10 min for TTA
extraction.
Plutonium solid that had formed in a few samples was used for characterization. The initial
concentrations of Pu(IV) and Ct in these samples were 1.0x10⁻⁴
mol kg-1
and 10-2
– 10-1

107
mol kg-1
, respectively, and the pH was 9.65 - 9.85 and 12. The solid phase was trapped on a
0.45 µm filter, rinsed 3 times with 10-6
m3 of deionized water and re-dissolved in 2x10
-6 m
3 of
103 mol m
-3 H2SO4. The concentrations of carbonate and plutonium dissolved from the solid
were measured with the CO2 electrode and a spectrometer, respectively. To prevent the
disturbance on the carbonate measurement by acidic gas, a non-volatile acid (H2SO4) was
used to dissolve the solid. The electrode was calibrated with a KHCO3 solution using 103 mol
m-3
H2SO4 as an acidifier. In this case, the detection limit was 6x10⁻⁵
mol kg-1
.
To check the method used to characterize the solid material, a preliminary test was carried
out using cobalt (Co2+
) in place of plutonium. Cobalt was chosen because both hydroxide and
carbonate precipitates can be readily prepared. A cobalt precipitate was prepared from CoCl2
solution with an addition of NaHCO3 at pH = 8.0 and Ct = 10-1
mol kg-1
. The amount of cobalt
was varied from 2.4x10⁻⁸
to 1.2x10⁻⁷
kg. Precipitates were also prepared in 10-1
mol kg-1
Na2CO3 at pH = 11.0 and 10-1
mol kg-1
NaClO4 at pH = 11.0 for comparison.
8.3. Results and discussion
Cobalt forms Co(OH)2(s) (log Ksp = -15.2; Yamaguchi & Takeda, 1999) in alkaline
solutions and CoCO3(s) (log Ksp = -9.98; Yamaguchi & Takeda, 1999) in carbonate solutions.
Cobalt carbonate may be formed in the NaHCO3 solution (pH = 8.0) by the following reaction
Co2+
+ HCO3- = CoCO3(s) + H
+ (8-1)
Cobalt hydroxide may be formed in the Na2CO3 (pH = 11.0) and 10-1
mol kg-1
NaClO4
solutions (pH = 11.0) by the following reaction
Co2+
+ 2OH- = Co(OH)2(s) (8-2)
The results of the carbonate concentrations for the cobalt precipitates are shown in Table 8-1.
The measured carbonate concentration at pH = 8 is almost equal to that of cobalt. At pH = 11,
on the other hand, the measured carbonate concentration is much less than that of the cobalt.
This indicates that carbonate determination in precipitates can be used to determine whether
the plutonium precipitate is carbonate or not. The error of measurement is about 10 % and is
possibly the result from incomplete separation and rinsing of the solid. The carbonate
concentration for the cobalt precipitates at pH 11 in Na2CO3 are higher than those in NaClO4
and may be due to adsorption of carbonate on the solid and incomplete rinsing of the solid.
Hence, detection limit of this determination is considered to be 10-4
mol kg-1
.
The carbonate concentrations for the Pu(IV) solid phase are shown in Table 8-2. Even in
the 10-1
mol kg-1
KHCO3 solution, the carbonate content was below the detection limit (10-4
mol kg-1
). The virtual absence of carbonate suggests the formation of hydrated oxide

108
PuO2·xH2O.
Our results do not agree with earlier predictions (Kim et al., 1983; Lierse, 1985) suggesting
the transformation of solid species from oxide to hydroxy-carbonate in solutions of > 10-4
mol kg-1
carbonate. In the present study, the mole fraction of hydrated oxide and
hydroxy-carbonate were > 0.9 and < 0.1, respectively. The equilibrium constant of the
transformation reaction:
PuO2·xH2O + CO32-
+ H2O = PuOCO3·xH2O + 2OH- (8-3)
was estimated to be K < 10-6.7
. This calculation was based on the assumption that the ratio of
the mole fraction between the solid phases was equal to their activity ratio. The solubility
product of PuO2·xH2O at I = 0.1 was estimated to be log Ksp = -54.70 using the Davies
equation (Rai, 1984). A solubility product, Ksp, of > 10-48.0
was estimated for PuOCO3·xH2O.
Carbonate concentrations in the range of 10-4
– 5x10⁻¹
mol kg-1
were kept approximately
constant for about 100 days under the experimental conditions as shown in Fig. 8-1. A sample
of the concentration as low as 10-5
mol kg-1
was affected by the atmospheric CO2.
Figure 8-2 shows the redox potential of the sample solutions at different pHs. The
following reaction is likely to control the redox condition of the sample solutions:
0.5NO2- + 0.5H2O = 0.5NO3
- + H
+ + e
- K = 10
-14.15 (8-4)
Pu(IV) is extracted by TTA while other oxidation states of Pu(V) and Pu(VI) remain in the
aqueous phase (Foti & Freiling, 1964; Nitsche et al., 1988) in 103 mol m
-3 HCl. The extraction
of Pu(IV) from carbonate solution was (92.9±2.4) %, while that of Pu(VI) was less than 0.3 %
was determined from the validation experiment. More than 90 % of the Pu was extracted from
the sample solutions under the condition indicating that the Pu was mainly in the tetravalent
state, although a 10 % uncertainty exists.
A series of solubility measurements was carried out at pHs 9.4, 10.1, 13 from the direction
of over-saturation to determine the time required for equilibrium to be reached. As shown in
Fig. 8-3, the Pu concentrations reach equilibrium within the first 14 days from the direction of
over-saturation. The total carbonate concentration of a sample of pH 10.1 was increased at the
14th day by adding KHCO3 and K2CO3. The solid phase began to dissolve and took 100 days
to reach a new equilibrium concentration. This suggests that longer equilibration times are
needed from the under-saturation direction than from the over-saturation direction. Although
the equilibrium from the under-saturation direction was also investigated at pH = 13, the
concentration was still increasing after 200 days. The equilibrium was not confirmed because
Eh and total carbonate concentration were significantly affected by atmospheric O2 and CO2.
An equilibration period of 14 days and the over-saturation direction were chosen for the
present study. Considering that the solid phase will proceed to crystallize, the equilibrium

109
state discussed here may be a pseudo equilibrium state.
The measured solubility of Pu(IV) is shown in Fig. 8-4. In low carbonate solutions, an
aqueous neutral species of Pu(OH)40 is dominant. Its solubility was reported by Ewart et al.
(1985). The solubility measured at Ct > 10-4
mol kg-1
is far higher than that of Pu(OH)40,
which is due to complexation. Although the chloride anion is the main anionic species in the
sample solutions, the complex formation of Pu(IV) by Cl- is negligible according to the
predicted formation constant (logPuCl3+ = 1.33; Brown & Wanner, 1987). Carbonate and
bicarbonate concentrations were calculated from Ct and pH using the following equilibrium
constants (Smith & Martell, 1976) at I = 0.1.
H2CO3(aq) = H+ + HCO3
- K = 10
-6.16 (8-5)
HCO3- = H
+ + CO3
2- K = 10
-10.00 (8-6)
H2O = H+ + OH
- K = 10
-13.78 (8-7)
Because the Pu fraction remaining on the filter was one order of magnitude lower than that in
the final filtrate, the size of main Pu species in sample solutions was less than 3x10⁻⁹
m. The
data analysis presented in this paper is based on two assumptions: (a) the thermodynamic
activity of the solid is the same for all carbonate and bicarbonate concentrations, and (b)
bi-nuclear or polynuclear species are not involved.
Because bicarbonate ion is dominant over the pH range of 9.4 - 10.1, the measured Pu
concentrations are plotted versus [HCO3-]. The Pu solubility depends on the bicarbonate
concentration over this pH range; log[Pu(IV)] is proportional to log[HCO3-] with the slope of
2. Hence we considered the following reaction:
PuO2·xH2O + 2HCO3- = Pu(CO3)2(OH)n
-n + (2-n)OH
- + xH2O (8-8)
To determine the value for n, the slope of log ([Pu(CO3)2(OH)n-n
/[HCO3-]2] against log[OH
-]
was calculated to be 0.23±0.57. The best fit for this data is n = 2 although a certain error (n =
2.23±0.57) is associated with this fit. The Pu concentration in bicarbonate solution is given by
the sum of [Pu(OH)40] (= 10
-10.14 mol kg
-1; Ewart et al., 1985) and [Pu(CO3)2(OH)2
2-]. A
least-squares method gives the equilibrium constant of 10-2.7±0.5
for Eq. (8-9).
PuO2·xH2O + 2HCO3- = Pu(CO3)2(OH)2
2- + xH2O (8-9)
Carbonate ion dominates in the higher pH range, in place of bicarbonate. At pH = 12 and
13, the solubility at [CO32-
] > 10-3
mol kg-1
is proportional to the square of the carbonate
concentrations and can be estimated by Eq. (8-10).
PuO2·xH2O + 2CO32-
= Pu(CO3)2(OH)44-
+ (x-2)H2O (8-10)
The Pu concentration in the carbonate solution is given by the sum of [Pu(OH)40] and
[Pu(CO3)2(OH)44-
]. A least-squares method gives an equilibrium constant of 10-4.98±0.31
for

110
Eq. (8-10). Since the data at pH 12 are nearly identical to those at pH 13, the following
pH-dependent reaction was ruled out.
PuO2·xH2O + 2CO32-
= Pu(CO3)2(OH)33-
+ OH- + (x-2)H2O (8-11)
The conditional equilibrium constants of the hydroxy-carbonate complex species are tabulated
in Table 8-3.
The present interpretation for Pu(IV) carbonates is similar to that for Np(IV) carbonates
(Pratopo et al., 1990). The formation of Pu(CO3)x4-2x
(x = 1 - 5) and Pu(OH)2CO3(s), both of
which have been predicted by Kim et al. (1983) and Lierse (1985), were not consistent with
our experimental results. Their solubility in the pH range of 9 to 11 can be fitted with
Eq. (8-9) as well as their interpretation in which the formation of Pu(CO3)32-
was taken into
account. Their solubility in higher pH range was proportional to the square of the carbonate
concentration and can be fitted with Eq. (8-10) as well as their interpretation in which the
formation of Pu(CO3)x4-2x
x = 4, 5 was taken into account.
8.4. Thermodynamic data compilation
Diffusive behavior of an element in geological media depends on the complex species that
may form under the relevant conditions. This information is provided by speciation
calculation using chemical thermodynamic data. The thermodynamic data for compounds and
complexes of neptunium and plutonium were compiled. Original papers were reviewed to
select thermodynamic data for hydrolysis and carbonate complexes that are particularly
important under geological conditions. Some of the data for other species were cited from
existing databases. In order to pick up reliable data from original papers, they were evaluated
from the following viewpoints: (a) the experiments were appropriately performed, and (b) the
experimental data were appropriately analyzed to obtain thermodynamic data. If two or more
experimental data are available, statistical treatments were applied. Auxiliary data were taken
from Silva et al.(1995).
Although Np3+
and Pu3+
are stable in acidic solutions, their formation constants of
complexes are poorly known. The formation constant of Am3+
hydroxide, carbonate, sulphate,
nitrate and fluorine complexes were used for the complexes of Np3+
and Pu3+
. The formation
constants of NpO2+ and UO2
2+ complexes were also used for PuO2
+ and NpO2
2+, respectively,
for supplement. In order to assess the potential effect of nitrate, sulfate and ammonia on the
speciation of actinide elements in groundwater, theoretical formation constants (Brown &
Wanner, 1987) were adopted. The selected data are tabulated in Table 8-4 and Table 8-5.

111
Table 8-1 Carbonate content analysis for cobalt precipitates.
Co condition of solid [Co](a)
Σ[CO2](b)
10-9
kg precipitation mmol kg-1 mmol kg
-1
24 0.1 mol
kg
-1 NaHCO3 (pH=8) CoCO3 0.2 0.23
48 0.1 mol
kg
-1 NaHCO3 (pH=8) CoCO3 0.4 0.40
72 0.1 mol
kg
-1 NaHCO3 (pH=8) CoCO3 0.6 0.66
96 0.1 mol
kg
-1 NaHCO3 (pH=8) CoCO3 0.8 0.84
120 0.1 mol
kg
-1 NaHCO3 (pH=8) CoCO3 1.0 0.98
120 0.1 mol
kg
-1 Na2CO3 (pH=11) Co(OH)2 1.0 0.09
(c)
120 0.1 mol
kg
-1 Na2CO3 (pH=11) Co(OH)2 1.0 0.11
(c)
120 0.1 mol
kg
-1 Na2CO3 (pH=11) Co(OH)2 1.0 0.11
(c)
120 0.1 mol
kg
-1 NaClO4 (pH=11) Co(OH)2 1.0 < 0.06
120 0.1 mol
kg
-1 NaClO4 (pH=11) Co(OH)2 1.0 < 0.06
120 0.1 mol
kg
-1 NaClO4 (pH=11) Co(OH)2 1.0 < 0.06
(a) Assuming that all the cobalt was dissolved in 103 mol m
-3 H2SO4
(b) Total carbonate concentration measured in 103 mol m
-3 H2SO4
(c) About 0.1 mmol kg-1
carbonate was detected, which is likely due to incomplete rinsing of
the solid.
Table 8-2 Carbonate content in Pu solid phase.
Pu condition of precipitation [Pu] Σ[CO2](a)
10-9 kg mmol kg
-1 mmol kg
-1
500 0.01 mol kg-1 KHCO3 (pH = 9.65) 1.0 < 0.1
500 0.03 mol kg-1 KHCO3 (pH = 9.82) 1.0 < 0.1
500 0.10 mol kg-1 KHCO3 (pH = 9.85) 1.0 < 0.1
500 0.05 mol kg-1 K2CO3 (pH = 12.0) 1.0 < 0.1
(a) The detection limit of this measurement in carbonate and bicarbonate solution is 0.1
mmol kg-1
(see text).

112
Table 8-3 Equilibrium constants of Pu(IV) hydrolysis and carbonate species.
reaction I log K
PuO2・xH2O + 2HCO3- = Pu(CO3)2(OH)2
2- + xH2O 0.1 -2.7±0.5
PuO2・xH2O + 2CO32- = Pu(CO3)2(OH)4
4- + (x-2)H2O 0.1 -4.98±0.31
PuO2・xH2O = Pu(OH)40 + (x-2)H2O
0.1 -10.14±0.28(a)
PuO2・xH2O + H2O + CO32- = PuOCO3・xH2O + 2OH
- 0.1 <-6.7
(a) taken from Ewart et al.,(1985).

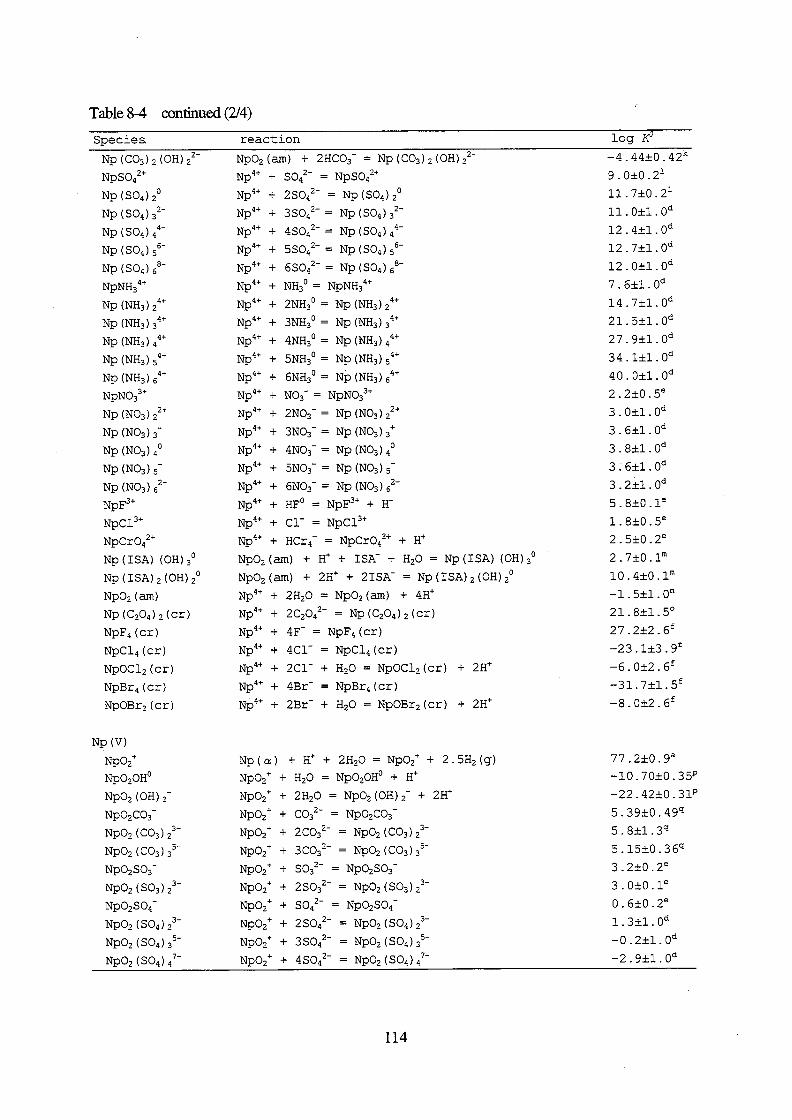
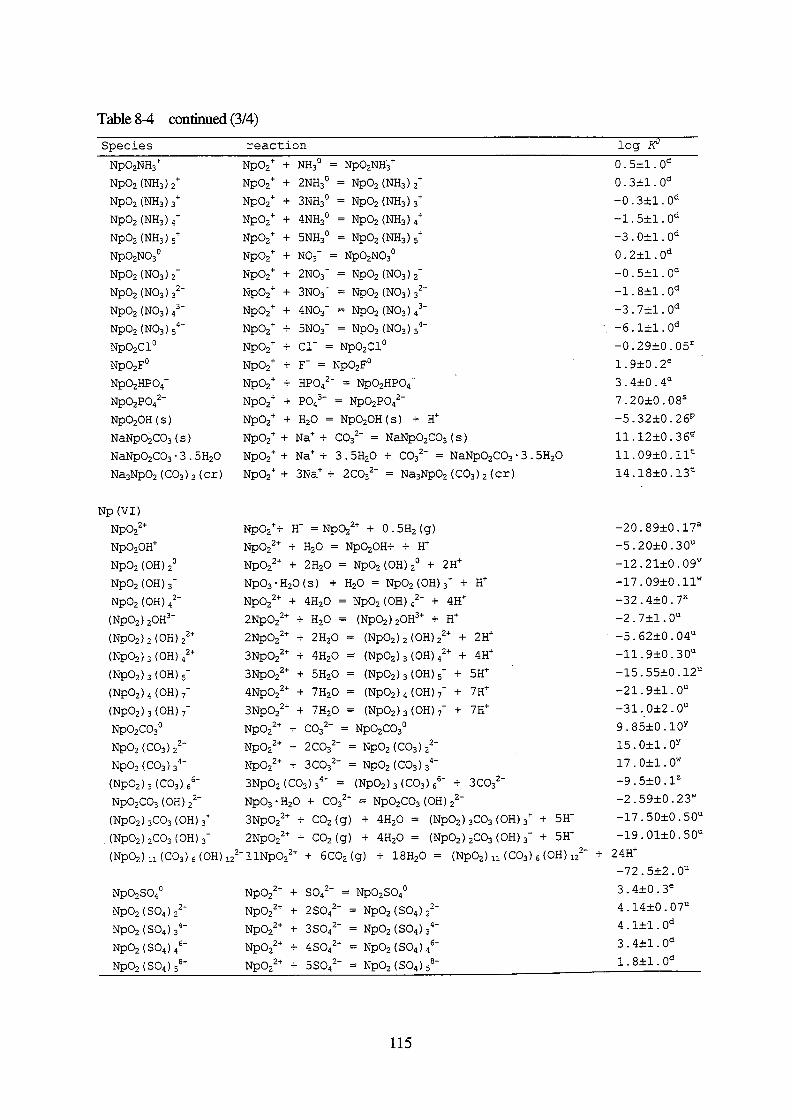

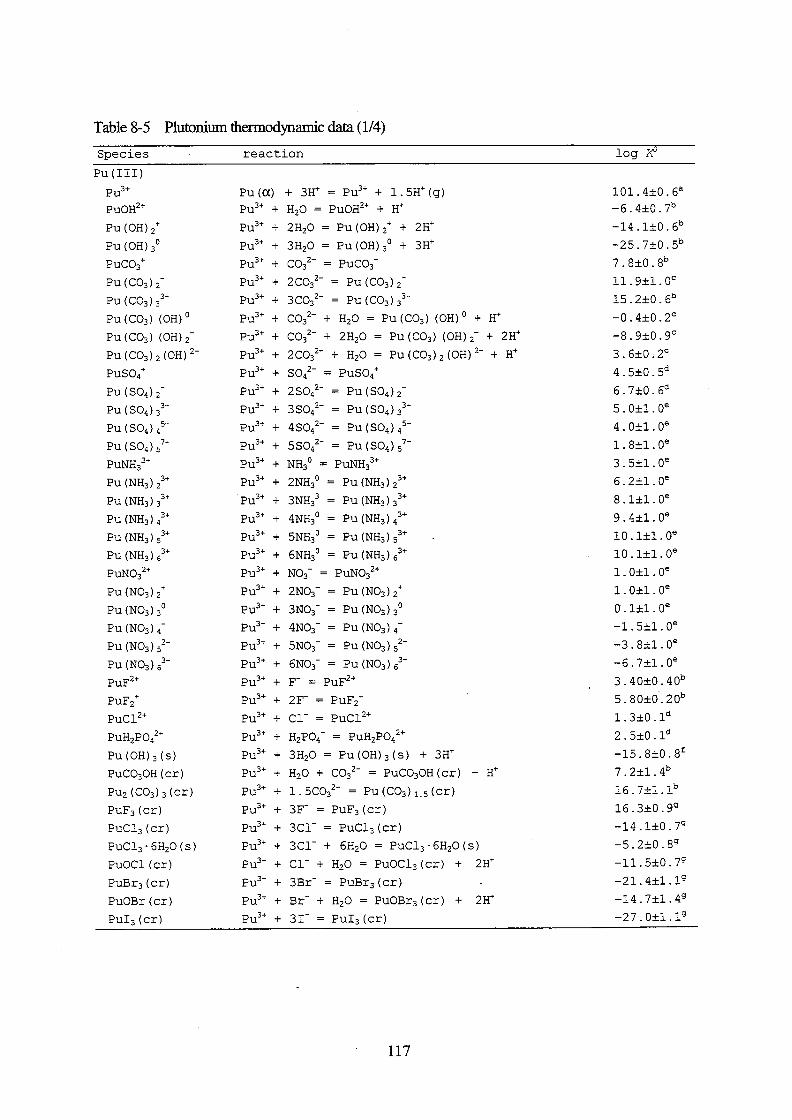


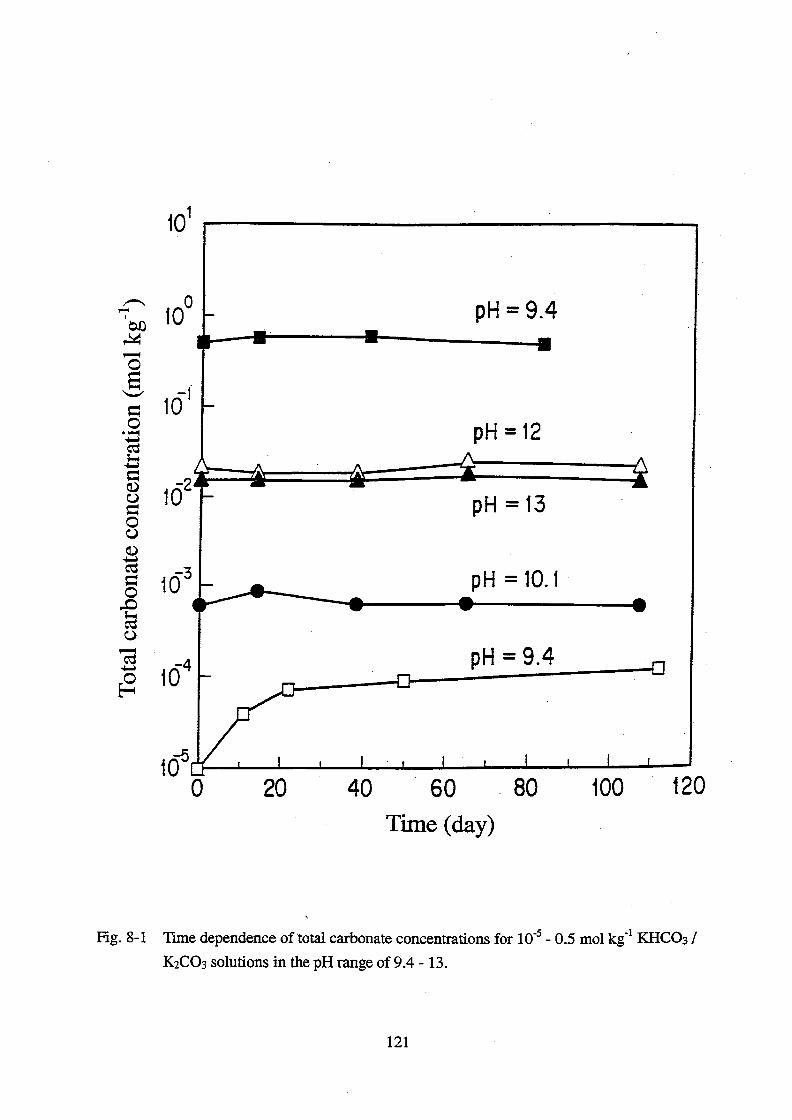
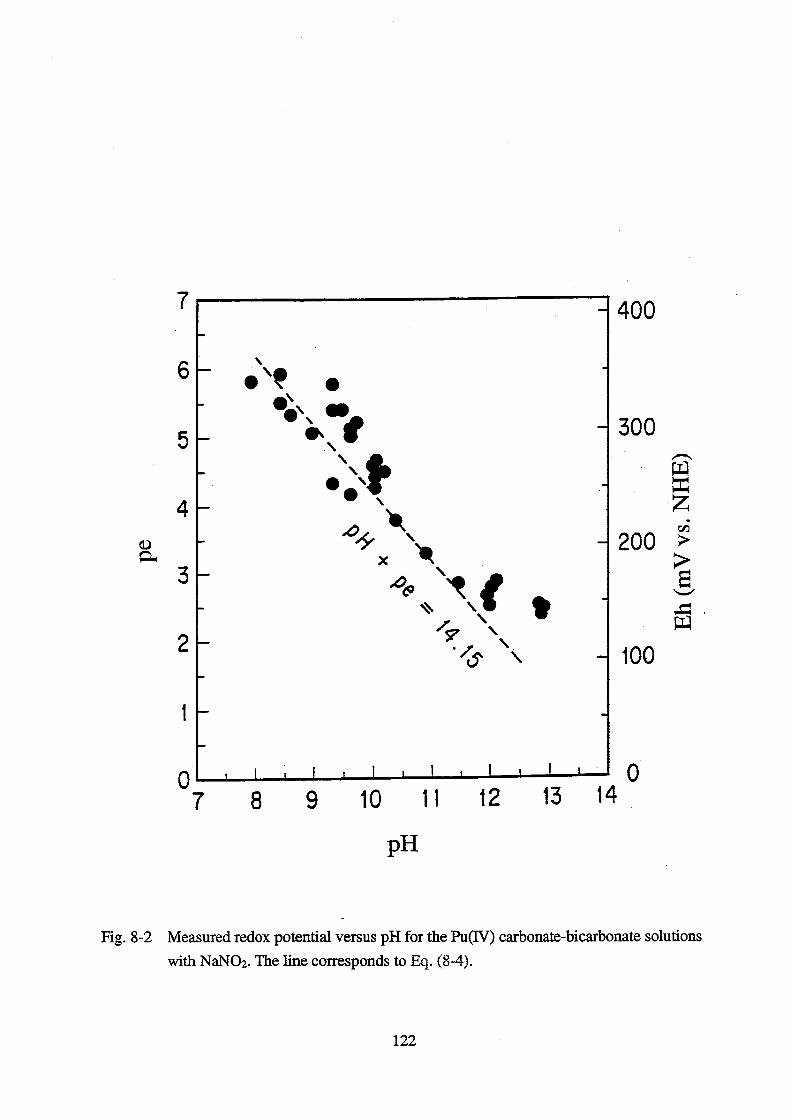


125
9. Concluding remarks
The structure of interconnected pores that act as diffusion paths of aqueous species was
analyzed for a granite from Inada, Ibaraki, Japan by improved techniques. The pore structure
was uniform and the pore size was much larger than aqueous diffusing species; these
conditions allow the application of the Fick’s diffusion law and pore-diffusion model to
interpret the mass transfer of the species in the granite. A positive correlation was observed
between the effective diffusivity for Ba2+
, Sr2+
, Mg2+
, Co2+
, Ni2+
, UO22+
, HTO, Cs+ and I
-
determined under low sorption conditions and their diffusivity in bulk of the solution.
Reduction of the effective diffusivity of I- in granite by electrostatic repulsion between the
anion and negatively charged surface of the pores was not observed. When strontium was
allowed to be adsorbed on the granite, the diffusive flux of strontium through the granite was
higher than that estimated from the pore-diffusion model by 42 times. Based on this result, a
model which takes into account contribution of both the surface and the pore diffusion was
proposed for the diffusion of sorbed species in the granite. The surface diffusivity of
strontium in Inada granite of 3.5x10⁻¹²
m2 s
-1 was obtained.
A through-diffusion experiment was performed under anoxic conditions for 85
Sr2+
for the
granite and the groundwater obtained from 240-m level of Underground Research Laboratory
(URL) of Atomic Energy of Canada Limited (AECL) in Manitoba, Canada. The effective
diffusivity of Sr2+
was higher than predicted from the pore-diffusion model by 13 times.
Apparent existence of surface diffusion was confirmed for the diffusion of Sr2+
in the granite
under geological conditions. In the experiment, a fair amount of strontium was removed from
the solution and was adsorbed on the granite, which corresponded to the distribution ratio, Rd,
of 0.091 - 0.180 m3 kg
-1. Nevertheless, Rd value assessed from the apparent diffusivity and the
effective diffusivity was 0.0041 m3 kg
-1. The contribution of the surface diffusion can explain
this discrepancy; the retardation of the apparent diffusive transport is smaller than that
predicted from the sorption Rd value because part of the adsorbed strontium is mobile in
adsorbed state.
The effective diffusivity and distribution ratio of 133
Ba2+
in Inada granite have been
determined by the through-diffusion method. Experiments were performed in triplicate for
10-1
, 1, 10 and 102 mol m
-3 BaCl2 solution. The De value obtained for the BaCl2 concentration
of 10 mol m-3
agreed to the estimated value based on the pore diffusion model. The lower
BaCl2 concentration yielded the higher De value and higher Rd value than those for 10 mol
m-3
. The variation in De was neither due to the speciation of barium in the solution nor
variation in physical properties of the pore structure in the rock. Contribution of diffusion in
adsorbed state should be responsible for the variation in De. The result is strongly indicative

126
of the diffusion in adsorbed state. The surface diffusivity of 2.4x10⁻¹³
m2 s
-1 was obtained for
Ba2+
in Inada granite.
Solubility of Pu(IV) was measured over a total carbonate concentration range of 10-4
to
10-1
mol kg-1
at I = 0.1. The equilibrium constants of
PuO2·xH2O + 2HCO3- = Pu(CO3)2(OH)2
2- + xH2O K=10
-2.7±0.5 and
PuO2·xH2O + 2CO32-
= Pu(CO3)2(OH)44-
+ (x-2)H2O K=10-4.98±0.31
were obtained. Thermodynamic database was compiled for Np and Pu by adopting these data
and other equilibrium constants of formation of aqueous species and compounds from
literature. The database allowed prediction of dominant actinide species in granite pore water
and discussion on mechanism of their diffusion in granite.
The diffusivity of uranium, neptunium, plutonium and americium in granite matrices has been
studied by the through-diffusion method in the presence of carbonate. Effective diffusivities
obtained for Pu(CO3)2(OH)22-
, Np(CO3)n4-2n
(n=4, 5) and UO2(CO3)34-
were ranged between
1.4x10⁻¹³
m2 s
-1 and 4.0x10
-13 m
2 s
-1, which were consistent with the pore diffusion model.
Enhancement of the diffusivity by surface diffusion was not observed in the case that Pu and Am
were adsorbed on mineral surfaces. The contribution of the surface diffusion is insignificant for
actinide carbonate complexes which are adsorbed on the mineral surfaces through chemical
reactions or surface complexation. Actinide complex species formed in groundwater under
deep geological environments migrate through rock matrix following to the Fick’s diffusion
law, and the diffusivities are consistent with the pore-diffusion model.
As shown in this study, aqueous species including actinide complex species can diffuse
into micro-pores in intact granites. The diffusivity can be higher than the value expected from
the pore-diffusion model. Evidences of the contribution of the surface diffusion were obtained
for divalent cations. The results of this study enable one to estimate an appropriate effective
diffusivity of aqueous species in the granite taking the surface diffusion into account. The
contribution of the surface diffusion directly enhances the radionuclide migration in
geosphere in the case that the diffusion is the main transport mechanism under extremely low
groundwater flow rate. Investigations are necessary for the contribution of the surface
diffusion on diffusive transport of radionuclides in bentonite buffer and in cementitious
materials that compose engineered barrier system of radioactive waste disposal. In these
materials, extremely narrow pore spacing does not allow water to be free from mineral
surfaces. The pore-diffusion model dealing with the concentration of the species in free pore
water may not predict their diffusive behavior in bentonite buffer and in cementitious
materials.

127
Acknowledgement
I acknowledge Professor K. Higashi of Kyoto University for supervising this study. I am
greatly indebted to Professors H. Moriyama and H. Yamana of Kyoto University for helpful
comments on the manuscripts.
I am sincerely grateful to Dr. S. Nakayama of JAERI for close collaboration throughout
this study. Dr. T. T. Vandergraaf of AECL, Canada is acknowledged for suggestions,
discussions and collaboration for chapter 2, 3, 4, 5 and 8. I am indebted to colleagues in
JAERI, Dr. T. Ohnuki, Dr. H. Isobe (present affiliation: Kumamoto University), Dr. Y.
Sakamoto, Mr. S. Takeda and Dr. M. Senoo for their significant contribution to this study.
Experimental supports from graduate students, Ms. C. Kawada (present affiliation: Toshiba
Corporation) and Mr. K. Asahara (present affiliation: Chubu Electric Power Co., INC.) are
greatly acknowledged. I appreciate Mr. Y. Tamura, Mr. M. Saito, Mr. I. Nomura, Mr. H.
Okamoto, Mr. Y. Kawasaki and Mr. A. Kijima of JAERI for performing Pu diffusion
experiments under anoxic conditions. Dr. T. Sato (present affiliation: Kanazawa University) is
acknowledged for his help in the diffusion experiment in bentonite. I express my gratitude to
Dr. S. Fujine of JAERI for encouragement. I hereby acknowledge that this study was
performed as a part of nuclear safety research program of JAERI for many years. Nuclear
Safety Research Association is also acknowledged for hosting experts’ meetings on surface
diffusion over a year. I feel grateful to my wife, Yumi for her assistance.
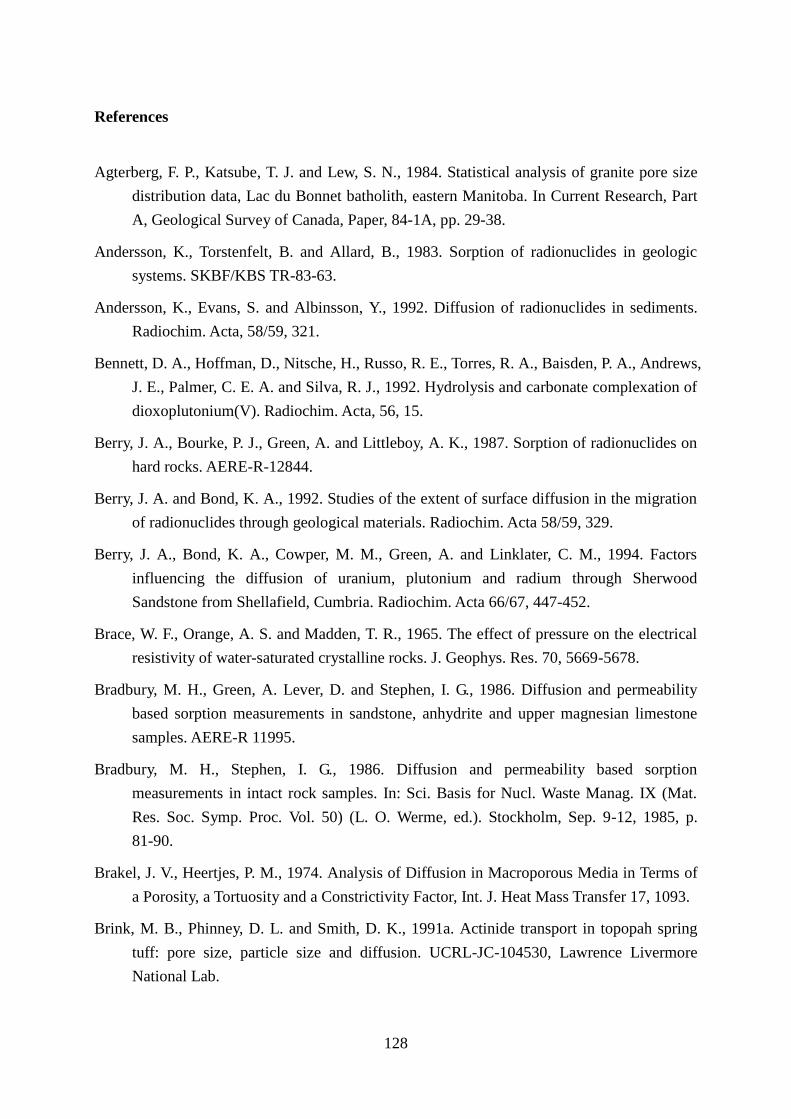
128
References
Agterberg, F. P., Katsube, T. J. and Lew, S. N., 1984. Statistical analysis of granite pore size
distribution data, Lac du Bonnet batholith, eastern Manitoba. In Current Research, Part
A, Geological Survey of Canada, Paper, 84-1A, pp. 29-38.
Andersson, K., Torstenfelt, B. and Allard, B., 1983. Sorption of radionuclides in geologic
systems. SKBF/KBS TR-83-63.
Andersson, K., Evans, S. and Albinsson, Y., 1992. Diffusion of radionuclides in sediments.
Radiochim. Acta, 58/59, 321.
Bennett, D. A., Hoffman, D., Nitsche, H., Russo, R. E., Torres, R. A., Baisden, P. A., Andrews,
J. E., Palmer, C. E. A. and Silva, R. J., 1992. Hydrolysis and carbonate complexation of
dioxoplutonium(V). Radiochim. Acta, 56, 15.
Berry, J. A., Bourke, P. J., Green, A. and Littleboy, A. K., 1987. Sorption of radionuclides on
hard rocks. AERE-R-12844.
Berry, J. A. and Bond, K. A., 1992. Studies of the extent of surface diffusion in the migration
of radionuclides through geological materials. Radiochim. Acta 58/59, 329.
Berry, J. A., Bond, K. A., Cowper, M. M., Green, A. and Linklater, C. M., 1994. Factors
influencing the diffusion of uranium, plutonium and radium through Sherwood
Sandstone from Shellafield, Cumbria. Radiochim. Acta 66/67, 447-452.
Brace, W. F., Orange, A. S. and Madden, T. R., 1965. The effect of pressure on the electrical
resistivity of water-saturated crystalline rocks. J. Geophys. Res. 70, 5669-5678.
Bradbury, M. H., Green, A. Lever, D. and Stephen, I. G., 1986. Diffusion and permeability
based sorption measurements in sandstone, anhydrite and upper magnesian limestone
samples. AERE-R 11995.
Bradbury, M. H., Stephen, I. G., 1986. Diffusion and permeability based sorption
measurements in intact rock samples. In: Sci. Basis for Nucl. Waste Manag. IX (Mat.
Res. Soc. Symp. Proc. Vol. 50) (L. O. Werme, ed.). Stockholm, Sep. 9-12, 1985, p.
81-90.
Brakel, J. V., Heertjes, P. M., 1974. Analysis of Diffusion in Macroporous Media in Terms of
a Porosity, a Tortuosity and a Constrictivity Factor, Int. J. Heat Mass Transfer 17, 1093.
Brink, M. B., Phinney, D. L. and Smith, D. K., 1991a. Actinide transport in topopah spring
tuff: pore size, particle size and diffusion. UCRL-JC-104530, Lawrence Livermore
National Lab.

129
Brink, M. B., Phinney, D. L. and Smith, D. K., 1991b. Effect of heterogeneity on actinide
diffusion rates in tuffaceous rock. UCRL-JC-104754, Lawrence Livermore National
Lab.
Brown, P.L. and Wanner, H., 1987. Predicted formation constants using the unified theory of
metal ion complexation (OECD/NEA, Paris)..
Capdevila, H. and Vitorge, P., 1995. Redox potentials of PuO22+
/PuO2+ and Pu
4+/Pu
3+ at
different ionic strengths and temperatures. Entropy and heat capacity. Radiochim. Acta,
68, 51.
Capdevila, H., Vitorge, P., Giffaut, E. and Delmau, L., 1996. Spectrophotometric study of the
dissociation of the Pu(IV) carbonate limiting complex. Radiochim. Acta, 74, 93.
Choppin, G. R. and Mathur, J. N., 1991. Hydrolysis of actinyl(VI) cations. Radiochim. Acta,
52/53, 25.
Cordfunke, E. H. P. and O’Hare, P. A. G., 1978. The chemical thermodynamics of actinide
elements and compounds, Part 3: Miscellaneous actinide compounds. IAEA, Vienna.
Crank, J., 1975. The mathematics of diffusion. (2nd ed.) Oxford Univ. Press, London.
Dean, A., 1978. Lange's Handbook of Chemistry (McGraw-Hill, New York).
Delmau, L. H., Vitorge, P. and Capdevila, H., 1996. Np(V)/Np)IV in concentrated
carbonate/bicarbonate solutions. CEA-N-2807, CEA, France.
Ewart. F. T., Howse, R. M., Thomason, H. P., Williams, S. J. and Cross, J. E., 1985. The
solubility of actinides in the near-field. In: Sci. Basis for Nucl. Waste Manag. IX (Mat.
Res. Soc. Symp. Proc. Vol. 50) (L. O. Werme, ed.). Stockholm, Sep. 9-12, 1985, p. 701.
Felmy, A. R., Rai. D., Schramke, J. A. and Ryan, J. L., 1989. The solubility of plutonium
hydroxide in dilute solution and in high-ionic-strength chloride brines. Radiochim. Acta,
48, 29.
Flotow, H. E. and Haschke, J. M. Yamauchi S., 1984. The chemical thermodynamics of
actinide elements and compounds, Part 9: The actinide hydrides. IAEA, Vienna.
Foti, S. C. and Freiling, E. C., 1964. The determination of the oxidation states of tracer
uranium, neptunium and plutonium in aqueous media, Talanta 11, 385.
Fourest, B., Morss, L. R., Blain, G., David, F. and M'Halla, J., 1995. Determination of limiting
ionic conductivity of Am3+
(aq) and Cf3+
(aq). Radiochim. Acta, 69, 215.
Fuger, J. and Oetting, F. L., 1976. The chemical thermodynamics of actinide elements and
compounds, Part 2: The actinide aqueous ions. IAEA, Vienna.
Fuger, J., Parker, V. B., Hubbard, W. N. and Oetting, F. L., 1983. The chemical

130
thermodynamics of actinide elements and compounds, Part 8: The actinide halides. IAEA,
Vienna.
Fuger, J., Medvedev, V. A., Khodakovsky, I. L., Navratil, J. D. and Sergeyeva, E. I., 1992. The
chemical thermodynamics of actinide elements and compounds, Part 12: The actinide
aqueous inorganic complexes. IAEA, Vienna.
Garrels, R. M., Dreyer, R. M. and Howland, A. L., 1949. Diffusion of ions through
intergranular spaces in water-saturated rocks. Bull. Geol. Soc. Am., 60, 1809-1828.
Good, R. J. and R. S. Mikhail, 1981. The contact angle in mercury intrusion porosimetry.
Powder Technol., 29, pp. 53-62.
Grenthe, I., Riglet, C. and Vitorge, P., 1986. Studies of metal-carbonate complexes. 14.
Composition and equilibria of trinuclear neptunium(VI)- and plutonium(VI)-carbonate
complexes. Inorg. Chem. 25, 1679.
Grenthe, I., Fuger, J., Konings, R. J. M., Lemire, R. J. Muller, A. B., Nguyen-Trung, C. and
Wanner, H., 1992. Chemical Thermodynamics of Uranium. (North-Holland, Amsterdam).
Idemitsu, K., Furuya, H., Inagaki, Y., Sato, S., 1991. Migration of uranium(VI) in laboratory
scale granite. Proc. of the Third Int. Symp. on Advanced Nucl. Energy Res., Mito,
Japan, Mar. 13-15, 1991, p.207.
Idemitsu, K., Furuya, H., Murayama, K. and Inagaki, Y., 1992. Diffusivity of uranium(VI) in
water-saturated Inada granite. In: Sci. Basis for Nucl. Waste Manag. XV (Mat. Res. Soc.
Symp. Proc. Vol. 257) (C. G. Sombret, ed.), Strasbourg, Nov. 4, 1991, p. 625-632.
Idemitsu, K., Furuya, H., Murayama, K., Asao, T., Inagaki, Y., 1993. Primary diffusion path of
uranium(VI) in laboratory scale water saturated Inada granite. Proc. of the 1993 Int.
Conf. on Nucl. Waste Manag. and Environ. Remed. (D. Alexandre, R. Baker, R.
Kohout, and J. Marek, eds.), Vol. 1, Prague, Czech Republic. Sep. 5-11, 1993, p.
207-212.
Itagaki, H. Nakayama, S., Tanaka, S. and Yamawaki, M., 1992. Effect of ionic strength on the
solubility of neptunium(V) hydroxide. Radiochim. Acta, 58/59, 61.
Ittner, T. and Torstenfelt, B., 1988. Diffusion of neptunium, plutonium and americium in
granitic rock. Radiochim. Acta, 44/45, 171.
Kato, Y., Kimura, T., Yoshida, Z. and Nitani, N., 1996. Solid-liquid phase equilibria of Np(VI)
and of U(VI) under controlled CO2 partial pressures. Radiochim. Acta, 74, 21.
Kato, Y., Kimura, T., Yoshida, Z. and Nitani, N., 1998. Carbonate complexation of
neptunyl(VI). Radiochim. Acta, 82, 63.

131
Katsube, T. J. and Hume, J. P., 1987. Pore structure characteristics of granitic rock samples
from Whiteshell Research Area. In Geotechnical studies at Whiteshell research area
(RA-3), CANMET, Report MRL 87-52. pp. 111-158.
Kim, J. I., Lierse, Ch. and Baumgärtner, F., 1983. Complexation of the plutonium(IV) ion in
carbonate-bicarbonate solutions, Chapter 21, in: Plutonium Chemistry (Carnall, W. T.,
Choppin, G. R. eds.) ACS Symp. Ser. 216, Amer. Chem. Soc., Washington, D.C., p.317.
Kim, J. I., Bernkopf, M., Lierse, Ch. and Koppold, F., 1984. Hydrolysis reactions of Am(III)
and Pu(VI) ions in near-neutral solutions. In: Barney, S., Navratil, J. D. and Schultz, W.
W. (eds.), Geochemical behavior of disposed radioactive waste. ACS Symp. Ser. 246,
Am. Chem. Soc., Washington D. C.
Kim, J. I., 1986. Chemical behaviour of transuranic elements in natural aquatic systems. In:
Handbook on the Physics and Chemistry of the Actinides (Freeman, A. J. and Keller, C.,
eds.) Vol. 4, p. 413, North Holland, Amsterdam.
Kumata, M., Iwai, T., Sagawa, T., Suzuki, T. and Nishiyama, K., 1990. Diffusion experiment
of a radionuclide in granitic rock cores, JAERI-M 90-179 (in Japanese), JAERI, Tokai,
Japan, 21 pp.
Lang, H., Klotz, D. and Moser, H., 1986. Nuclide migration in porous fractured rock.,
EUR-10121, pp. 232-242.
Lever, D. A, 1986. Some notes on experiments measuring diffusion of sorbed nuclides
through porous media, AERE-R-12321.
Li, Y. H., Gregory, S., 1974. Diffusion of ions in sea water and in deep-sea sediments.
Geochim. Cosmochim. Acta, 38, 703.
Lierse, Ch. 1985. Chemical behaviour of plutonium in natural aquatic system: hydrolysis,
carbonate complexation and redox reaction., Ph. D. Thesis (in German), Technische
Universität München, München.
Mahoney, J. J. and Langmuir, D., 1991. Adsorption of Sr on kaolinite, illite and
montmorillonite at high ionic strengths. Radiochim. Acta, 54, 139.
McKeegan, K. D., Phinney, D., Oversby, V. M., Brink, M. B. and Smith, D. K., 1989.
Uranium transport in Topopah spring tuff: an ion-microscope investigation. In: Sci.
Basis for Nucl. Waste Manag. XII (Mat. Res. Soc. Symp. Proc. Vol. 127) (W. Lutz and
R. C. Ewing, eds.). Berlin, Oct. 10-13, 1988, p. 813-821.
Meier, H. Zimmerhackl, E., Hecker, W., Zeitler, G. and Menge, P., 1988. Measurement of
diffusion of radionuclides in sediment rocks. Radiochim. Acta 44/45, 239-244.
Melnyk, T. W. and Skeet, A. M. M., 1986. An improved technique for the determination of rock

132
porosity. Canadian Journal of Earth Science, 23, 1068-1074.
Mills, R., 1961. Trace-ion diffusion in electrolyte solutions, Rev. Pure Appl. Chem. 11, 78.
Morgenstern, A. and Kim, J. I., 1996. The phosphate complexation of neptunium(V).
Radiochim. Acta, 72, 73.
Moriyama H., Pratopo, M. I. and Higashi, K., 1995. Hydrolysis and carbonate complexation
of Np(VI) in high pH solutions. Radiochim. Acta, 69, 49.
Moskvin, A. I., Gel'man, A. D., 1958. Determination of the composition and instability
constants of oxalate and carbonate complexes of plutonium(IV), Russ. Jour. Inorg.
Chem. (Engl. Transl.) 3, 198.
Muuronen, S., Kämäräinen, E-L., Jaakkola, T., Pinnioja, S. and Lindberg, A., 1986. Sorption
and diffusion of radionuclides in rock matrix and natural fracture surfaces studied by
autoradiography. In: Sci. Basis for Nucl. Waste Manag. IX (Mat. Res. Soc. Symp. Proc.
Vol. 50) (L. O. Werme, ed.). Stockholm, Sep. 9-12, 1985, p. 747-754.
Nakayama, S., Yamaguchi, T. and Sekine, K., 1996. Solubility of neptunium(IV) hydrous
oxide in aqueous solutions. Radiochim. Acta, 74, 15.
Neck, V., Runde, W. and Kim, J. I., 1995a. Solid-liquid equilibria of neptunium(V) in carbonate
solutions of different ionic strengths: II. Stability of the solid phases. J. Alloys and
Compounds, 225, 295.
Neck, V., Fanghänel, Th., Rudolph, G. and Kim, J. I., 1995b. Thermodynamics of
neptunium(V) in concentrated salt solutions: chloride complexation and ion interaction
(Pitzer) parameters for the NpO2+ ion. Radiochim. Acta, 69, 39.
Neretnieks, I., 1980. Diffusion in the rock matix: an important factor in radionuclide
retardation? J. Geophys. Res. 85, 4379-4397.
Newton, T. W. and Sullivan, J. C., 1985. Actinide carbonate complexes in aqueous solution.
In: Handbook on the Physics and Chemistry of the Actinides (Freeman, A. J. and Keller,
C., eds.) Vol. 3, p. 387, North Holland, Amsterdam.
Nightingale, E. R., 1959. Phenomenological theory of ion solvation. Effective radii of
hydrated ions, J. Phys. Chem. 63, 1381.
Nishiyama, K., Nakashima, S. Tada, R. and Uchida, T., 1990. Diffusion of an ion in rock pore
water and its relation to pore characteristics, Mining Geol. (in Japanese) 40, 323-326.
Nitsche, H., Lee, S. C. and Gatti, R. C., 1988. Determination of plutonium oxidation states at
trace levels pertinent to nuclear waste disposal, J. Radioanal. Chem. 124, 171.
Nitsche, H. and Silva, R., 1996. Investigation of the carbonate complexation of Pu(IV) in
133
aqueous solution. Radiochim. Acta, 72, 65.
Novak, C. F. and Roberts, K. E., 1995. Thermodynamics modeling of neptunium(V) solubility
in concentrated Na-CO3-HCO3-Cl-ClO4-H-OH-H2O systems. In: Sci. Basis for Nucl.
Waste Manag. XVIII (Mat. Res. Soc. Symp. Proc. Vol. 353) (T. Murakami and R. C.
Ewing, eds.). Kyoto. Japan, Oct. 23-27, 1994, p. 1119-1128.
Ohe, T., 1984. Ion exchange adsorption of radioactive cesium, cobalt, manganese, and
strontium to granitoid rocks in the presence of competing cations. Nucl. Technol., 67,
92-101.
Ohlsson, Y. and Neretnieks, I., 1998. Some evidence for surface ion mobility in rock. J.
Contamin. Hydrol. 35, 91-100.
Okajima, S. and Reed, D. T., 1993. Initial hydrolysis of plutonium(VI). Radiochim. Acta, 60,
173.
Pashalidis, I., Runde, W. and Kim, J. I., 1993. A study of solid-liquid phase equilibria of Pu(VI)
and U(VI) in aqueous carbonate systems. Radiochim. Acta, 61, 141.
Pashalidis, I., Kim, J. I., Ashida, T. and Grenthe, I., 1995. Spectroscopic study of the hydrolysis
of PuO22+
in aqueous solution. Radiochim. Acta, 68, 99.
Pashalidis, I., Czerwinski, K. R., Fanghänel, Th. and Kim, J. I., 1997. Solid-liquid phase
equilibria of Pu(VI) and U(VI) in aqueous carbonate systems. Determination of stability
constants. Radiochim. Acta, 76, 55.
Pratopo, M. I., Moriyama, H. and Higashi, K., 1990. Carbonate complexation of
neptunium(IV) and analogous complexation of ground-water uranium, Radiochim. Acta
51, 27.
Puigdomènech, I. and Bruno, J., 1991. Plutonium solubilities. SKB-TR-91-04, Swedish Nuclear
Fuel and Waste Management Co., Stockholm.
Puukko, E., Heikkinen, T., Hakanen, M. and Lindberg, A., 1993. Diffusion of water, cesium
and neptunium in pores of rocks. YJT-93-23, Nuclear Waste Commission of Finnish
Power Companies, Helsinki.
Rai, D., 1984. Solubility product of Pu(IV) hydrous oxide and equilibrium constants of
Pu(IV)/Pu(V), Pu(IV)/Pu(VI), and Pu(V)/Pu(VI) couples, Radiochim. Acta 35, 97.
Rai, D. and Ryan, J. L., 1985. Neptunium(IV) hydrous oxide solubility under reducing and
carbonate conditions. Inorg. Chem., 24, 247.
Rai, D., Swanson, J. L. and Ryan, L., 1987. Solubility of NpO2·xH2O in the presence of
Cu(I)/Cu(II) redox buffer. Radiochim. Acta, 42, 35.

134
Rai, D., Rao, L. and Moore, D. A., 1998. The influence of isosaccharinic acid on the solubility
of Np(IV) hydrous oxide. Radiochim. Acta, 83, 9.
Rai, D., Hess, N. J., Felmy, A. R., Moore, D. A. and Yui, M., 1999a. A thermodynamic model
for the solubility of NpO2(am) in the aqueous K+-HCO3
—-CO3
2—-OH
—-H2O system.
Radiochim. Acta, 84, 159.
Rai, D., Hess, N. J., Felmy, A. R., Moore, D. A., Moore, D. A., Yui, M. and Vitorge, P., 1999b.
A thermodynamic model for the solubility of PuO2(am) in the aqueous
K+-HCO3
--CO3
2--OH
--H2O system. Radiochim. Acta, 86, 89.
Robinson, R. A. and Stokes, R. H., 1955. Electrolyte Solutions. Butterworths, London.
Sato, S. Furuya, H., Araya, S. and Matsuo, K., 1986. Migration behavior of U(VI) in tuff. In:
Sci. Basis for Nucl. Waste Manag. IX (Mat. Res. Soc. Symp. Proc. Vol. 50) (L. O.
Werme, ed.). Stockholm, Sep. 9-12, 1985, p. 763-770.
Silva, R. J., Bidoglio, G., Rand, M. H., Robouch, P. B., Wanner, H. and Puigdomènech, I.,
1995. Chemical Thermodynamics of Americium. (Elsevier, Amsterdam).
Skagius, K. and Neretnieks, I., 1982. Diffusion in crystalline rocks of some sorbing and
nonsorbing species. KBS-TR-82-12, SKBF/KBS, Stockholm.
Skagius, K., Svedberg, G. and Neretnieks, I., 1982. A study of strontium and cesium sorption
on granite. Nucl. Technol., 59, 302.
Skagius, K. and Neretnieks, I., 1986. Porosities and diffusivities of some nonsorbing species
in crystalline rocks, Water Resour. Res. 22, 389.
Skagius, K. and Neretnieks, I., 1988. Measurement of cesium and strontium diffusion in
biotite gneiss, Water Resour. Res. 24, 75.
Smith, P. A., 1989. Modeling of a diffusion-sorption experiment on sandstone. PSI-Bericht,
Nr.53.
Smith, R. M. and Martell, A. E., 1976. Critical stability constants Vol. 4, Plenum press, New
York.
Spacek, P. and Kubin, M., 1967. Diffusion in gels. J. Polym. Sci: Part C, 16, 705.
Suksi, S., Kämäräinen, E-L., Siitari-Kauppi, M. and Lindberg, A., 1987. Sorption and
diffusion of cobalt, nickel, strontium, iodine, cesium and americium in natural fissure
surfaces and drill core cups studied by autoradiography, III. YJT-87-17.
Suksi, S., Siitari-Kauppi, M., Kämäräinen, E-L. and Lindberg, A., 1989. The effect of ground
water-rock interactions on the migration of redox sensitive radionuclides. In: Sci. Basis
for Nucl. Waste Manag. XII (Mat. Res. Soc. Symp. Proc. Vol. 127) (W. Lutz and R. C.

135
Ewing, eds.). Berlin, Oct. 10-13, 1988, p. 965-972.
Torstenfelt, B., 1982. Mobilities of radionuclides in fresh and fractured crystalline rock.
SKBF-KBS-TR 82-26.
Triay, I. R., Birdsell, K. H., Mitchell, A. J. and Ott, M. A., 1993. Diffusion of sorbing and
non-sorbing radionuclides. LA-UR-93-437, Los Alamos National Lab.
Tsukamoto, M. and Ohe, T., 1991. Intraparticle diffusion of cesium and strontium cations into
rock materials. Chem. Geol. 90, 31.
Uematsu, K., 1988. Japanese approaches to the assessment of radionuclide migration in the
geosphere. Radioactive Waste Management and the Nuclear Fuel Cycle, Vol. 10,
145-158.
Ushiki, H., Okada, I., Takahashi Y., Tanaka, K. and Hashiya, T., 1993. Transport phenomena. In:
Handbook of Chemistry, 4th
edition, basic volume, p. II-61 (in Japanese), The Chemical
Society of Japan, Tokyo.
Vandergraaf, T. T. and Ticknor, K. V., 1994. A compilation and evaluation of sorption coefficients
used in the geosphere model of SYVAC for the 1990 assessment of the Whiteshell
Research Area. Atomic Energy of Canada Limited Report AECL-10546, COG-92-59.001.
Wakao, N. and Smith, J. M., 1962. Diffusion in catalyst pellets. Chemical Engineering
Science 17, 825-834.
Weigel, F., 1985. The carbonates, phosphates and arsenates of the hexavalent and pentavalent
actinides. In: Handbook on the Physics and Chemistry of the Actinides (Freeman, A. J.
and Keller, C., eds.) Vol. 3, North Holland, Amsterdam, pp. 243-288.
Xia, Y., Rao, L., Rai, D. and Felmy, A. R., 1999. Solvent extraction study of Np(IV) sulphate
complexation in Na+-Np
4+-OH
--SO4
2--HSO4
--ClO4
- and Na
+-Np
4+-OH
--SO4
2--HSO4
--Cl
-
systems. Radiochim. Acta, 86, 33.
Yamaguchi, T., Pratopo, M. I., Moriyama, H. and Higashi, K., 1991. Adsorption of cesium
and neptunium(V) on bentonite, Proceedings of the Third International Conference on
Nuclear Fuel Reprocessing and Waste Management (RECOD'91), Sendai, Japan, Vol.2,
p.999.
Yamaguchi, T., Sakamoto, Y. and Senoo, M., 1993. Consideration on effective diffusivity of
strontium in granite. J. Nucl. Sci. Technol. 30, 796-803.
Yamaguchi, T., Sakamoto, Y. and Ohnuki, T., 1994. Effect of complexation on solubility of
Pu(IV) in aqueous carbonate system, Radiochim. Acta, 66/67, 9.
Yamaguchi, T. and Nakayama, S., 1996. Consideration on thermodynamic data for

136
americium(III) aqueous carbonate system. Radioactive Waste Research (in Japanese), 3
(1), 49.
Yamaguchi, T., Sakamoto, Y., Nakayama, S. and Vandergraaf, T. T., 1997a. Effective
diffusivity of the uranyl ion in a granite from Inada, Ibaraki, Japan. J. Contaminant
Hydrology, 26, 109.
Yamaguchi, T., Isobe, H. and Nakayama, S., 1997b. Analysis of Microporous Structure in
Granite. Radioactive Waste Research (in Japanese), 3, 99.
Yamaguchi, T. and Nakayama, S., 1998. Diffusivity of U, Pu and Am carbonate complexes in a
granite from Inada, Ibaraki, Japan studied by through diffusion. Journal of Contaminant
Hydrology, 35, 55-65.
Yamaguchi, T. and Takeda, S., 1999. Consideration on thermodynamic data for predicting
solubility and chemical species of elements in groundwater, Part 1: Tc, U, Am.
JAERI-Data/Code 99-001 (in Japanese).
Yamaguchi, T., 2000. Consideration of thermodynamic data for predicting solubility and
chemical species of elements in groundwater. Part 2: Np, Pu. JAERI-Data/Code
2000-031 [in Japanese], JAERI, Tokai, Japan.
Yamaura, T., Kitamura, A., Fukui, A., Nishikawa, S., Yamamoto, T. and Moriyama, H., 1998.
Solubility of U(VI) in highly basic solutions. Radiochim. Acta, 83, 139.