study of warming influence
DESCRIPTION
Институт химии нефти СО РАН Югорский НИИ Информационных технологий Institute of Petroleum Chemistry SB RAS Ugra research institute of information technologies. STUDY OF WARMING INFLUENCE - PowerPoint PPT PresentationTRANSCRIPT

Yu.M. Polishchuk1,2, V.P. Dneprovskaya1, N.A.Bryksina2, 3
1Institute of Petroleum Chemistry, SB RAS,3, Akademichesky Ave., Tomsk, 634021, Russia
2Ugra State University16, Chekhova street, Khanty-Mansiysk, 628012, Russia
3Ugra research institute of information technologies151, Mira street, Khanty-Mansiysk, 628011, Russia
STUDY OF WARMING INFLUENCE STUDY OF WARMING INFLUENCE ON THERMOKARST STATE IN CONTINUOUS ON THERMOKARST STATE IN CONTINUOUS
PERMAFROST ZONE OF WESTERN SIBERIA ON PERMAFROST ZONE OF WESTERN SIBERIA ON BASE OF REMOTE SENSING DATABASE OF REMOTE SENSING DATA
Институт химии нефти СО РАН Югорский НИИ Информационных технологий Institute of Petroleum Chemistry SB RAS Ugra research institute of information technologies
Институт химии нефти СО РАН Югорский НИИ Информационных технологий Institute of Petroleum Chemistry SB RAS Ugra research institute of information technologies

DATA and
OBJECTS OF GEOCRYOLOGICAL STUDIES
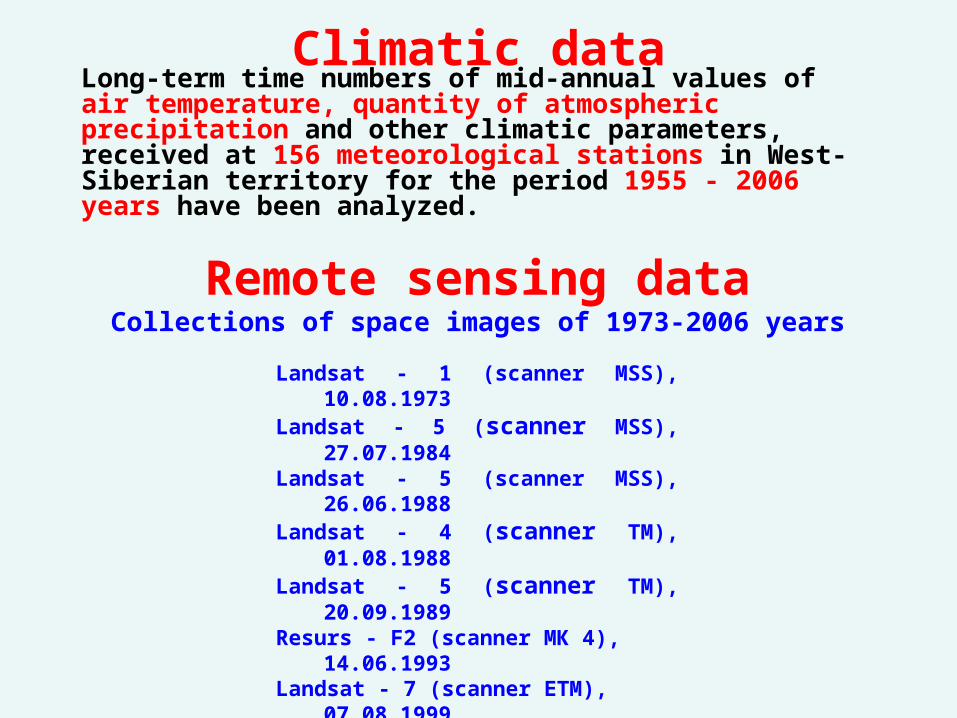
Long-term time numbers of mid-annual values of air temperature, quantity of atmospheric precipitation and other climatic parameters, received at 156 meteorological stations in West-Siberian territory for the period 1955 - 2006 years have been analyzed.
Climatic data
Landsat - 1 (scаnnеr MSS), 10.08.1973Landsat - 5 (scаnnеr MSS), 27.07.1984Landsat - 5 (scаnnеr MSS), 26.06.1988Landsat - 4 (scаnnеr ТM), 01.08.1988Landsat - 5 (scаnnеr ТM), 20.09.1989Resurs - F2 (scanner МК 4), 14.06.1993Landsat - 7 (scаnnеr ETM), 07.08.1999Landsat - 7 (scаnnеr ETM), 03.08.2001Landsat - 7 (scаnnеr ETM), 03.07.2002Spot - 5 (scаnnеr HRV), 20.07.2005ERS-2 – 2005, June – 2006, SeptemberENVISAT – 2004, May - September
Remote sensing dataCollections of space images of 1973-2006 years

Objects of geocryological studies
The most effective geoindicators of cryogenic changes of permafrost territoriesThe most effective geoindicators of cryogenic changes of permafrost territories under global warming using remote sensing are thermokarst lakes. Below is aunder global warming using remote sensing are thermokarst lakes. Below is a
fragment of space image fragment of space image Landsat-7 (07.08.1999Landsat-7 (07.08.1999гг.).) with indicated objects of with indicated objects of geocryological studies: thermokarst lakes - 1; dried lakes (khasyreys) – 2.
1
2

CHARACTERISTICS of
PILOT TERRITORIES
and
OBJECTS OF
GEOCRYOLOGICAL STUDIES

Map of permafrost zoningMap of permafrost zoning

Map of geobotanical zoningMap of geobotanical zoning

Some results ofclimatic changes analysis

Climatic changes in southern part of Western Siberia Climatic changes in southern part of Western Siberia ((territory of Outside the permafrost) territory of Outside the permafrost)
- Mean value- confidence limit for 90 % confidence probability
Quantity of atmospheric precipitation
Mid-annual values of air temperatureMid-annual air temperature in the second period (1980-1992 years) in comparison with the period of 1955-1970 years has increased approximately 1,0 0С
Quantity of atmospheric precipitation has increased approximately 0.2 mm
-3
-2
-1
0
1
2
1950 1960 1970 1980 1990 year
T, ºС
30
34
38
42
1950 1960 1970 1980 1990 year
Q, mm

Temperature changeTemperature change in territory of Continuous and Discontinuous in territory of Continuous and Discontinuous permafrost section (Yamal-Nenets region) permafrost section (Yamal-Nenets region)
Mid-annual air temperature in the second period (1980-2006 years) in comparison with the period of 1973-1979 years has increased 0,96 0С
- Mean value- confidence limit for 90 % confidence probability
-11.0
-10.0
-9.0
-8.0
-7.0
-6.0
-5.0
-4.0
1970 1975 1980 1985 1990 1995 2000 2005 year
T, ºС

Methodical questions of analysis
of geocryologic changes

Space image Landsat-1 (10.08.1973)Space image Landsat-1 (10.08.1973) with indicated thermokarst lakeswith indicated thermokarst lakes

Fragment of space image Spot-5Fragment of space image Spot-5 ( ( 220.00.077..20052005))

Comparison of space images Comparison of space images Landsat-1 (10.08.1973) and Spot-5Landsat-1 (10.08.1973) and Spot-5 ( ( 220.00.077..20052005))

а b c d
1973 1988 1993 2005
151 27 3 0
Landsat-4 (57m)
Landsat-5 (30 m) Resurs -F2 (10 m) Spot-5 (5 m)
Consequent stages of decrease of lake 7 area
Thermokarst lake 7 areas (red) changes

Consequent stages of decrease of lake 9 area
1973 (a) 1993 (b) 2002 (c) 2005 (d)
112 ha 65 ha 52 ha 47 ha
Landsat-4 (57 m) Resurs -F2 (10 m) Landsat-7 (30 m) Spot-5 (5 m)
а b c d
Changes of area of thermokarst lake 9 (red)

Consequent stages of changes of lake 52 area in PT-5
1984 (a) 1988 (b) 1989 (c) 1999 (d) 2001 (e)
43.5 ha 45.6 ha 49.0 ha 3.9 ha 4.4 ha
Landsat-5 (57 m) Landsat-4 (30 m) Landsat-5 (30 m) Landsat-7 (30 m) Landsat-7 (30 m)
Decrease of area (red) of thermokarst lake 52 in time
a b
e c d
Decrease of area (red) of thermokarst lake 52 in time

Foto by S.N. Kirpotin

Intraseasonal changes of thermokarst lakes areasIntraseasonal changes of thermokarst lakes areasusing radar images ERSusing radar images ERS-2-2 and ENVISAT and ENVISAT
PT-12004 -2005 г.
Pilot territories
YearMonth
May June July August September
PT-12004 68,5 71,0 69,2
2005 68,7 69,4 70,6
Date Date Date

Pilot territories
Year
Month
May June July August September
PT-5 2005 57,4 58,6 57,8
2006 56,8 55,8 55,2 55,5
PT-5 2005 -2006 г.
Date Date
Intraseasonal changes of thermokarst lakes areasIntraseasonal changes of thermokarst lakes areasusing radar images ERSusing radar images ERS-2-2

Total area of lakes Total area of lakes :: 1973 - 2155,1 1973 - 2155,1 haha,, 2005 - 1902,2 2005 - 1902,2 haha..
Total area decrease of lakes in PT-1: SS (1973(1973 ) ) – – S S (2005(2005 ) ) == -469,6 ha
Normalized total area decreasek = - 22%
Analysis of lakes area changes in PT-1Analysis of lakes area changes in PT-1Lake number 1973 1988 2002 2005
1 26 13 0 02 90 80 69 313 14 12 3 04 61 27 2 05 76 58 49 476 55 53 45 397 151 27 0 08 43 22 14 139 112 68,3 52 47
10 66 57 36 3011 50 25 6 012 65 61,5 61,7 6513 34,7 33,5 33,3 33,414 68,5 66,8 65,6 54,915 25,3 22,7 24,2 24,816 9,8 12,6 13,4 14,117 52,9 56,4 57,3 57,318 46,8 51,3 51,3 51,219 65 65,8 65,5 66,520 118,2 121,4 121,8 122,821 52,2 55,8 57,4 48,622 21,7 26,8 27,7 27,123 68,4 72,7 75,7 76,224 33,2 34,8 35,7 35,125 25 25,1 26,5 28,226 162,8 167,4 171,5 170,227 22,2 24,1 24,7 24,928 36,9 41,5 41,3 41,629 8 9,7 10,3 10,230 17,5 22,9 21,7 21,931 42,4 42,7 46,2 46,532 29,3 32,5 32 31,633 49,6 50,4 50,6 49,734 14,9 16,2 17,6 17,635 33,1 34,1 38,2 39,836 14,1 15,9 16,5 16,937 11,9 13 14,6 15,438 32,7 35,9 35,6 36,339 94 94,6 100,2 100,340 273,2 273,2 273,1 273,2
Decrease of lake area
Increase of lake area
No changes

Total area of lakes Total area of lakes :: 19198484 - 3165. - 3165.77 haha,, 20020011 - 2892. - 2892.44 haha..
Total area decrease of lakes in PT-5: SS (1984(1984 ) ) – – S S (2001(2001 ) ) == 273,3 ha
Normalized total area decrease k = - 9%
Total analysis of changes of lake’s areas in PT-5Total analysis of changes of lake’s areas in PT-5
Decrease of lake area
Increase of lake area
No changes
Lake number 1984 1988 1989 1999 2001
1 246.8 33.9 34.6 12.3 11.62 42.2 42.3 8.4 7.610 92.1 97.3 99.0 83.1 81.411 128.6 83.1 110.6 58.2 53.913 135.0 143.9 159.9 91.0 98.314 19.7 23.8 11.9 10.617 151.5 161.2 79.0 74.222 27.4 14.4 5.0 7.123 234.6 251.9 238.0 209.825 13.9 17.8 7.8 7.730 13.5 14.0 14.0 6.7 5.536 0.0 0.0 0.0 19.3 0.045 17.1 17.2 2.7 2.950 150.5 148.2 142.2 33.5 26.252 43.5 45.6 49.0 3.9 4.456 17.7 20.9 9.0 10.159 39.9 33.9 41.2 28.3 26.860 62.2 64.4 30.4 34.563 9.0 2.4 11.8 1.8 1.464 2.9 3.7 4.3 0.0 0.069 81.5 76.6 79.0 40.8 31.471 9.0 7.4 16.4 0.4 0.673 35.5 39.8 0.8 0.874 0.0 0.0 0.0 12.4 0.075 60.3 62.0 53.6 50.384 25.1 27.3 29.3 14.4 7.885 18.4 23.7 4.7 8.286 0.0 0.0 0.0 7.9 3.888 71.6 72.0 66.2 64.689 39.3 40.0 28.9 26.74 58.6 66.1 74.3 67.6 74.45 11.6 15.2 16.9 15.1 15.96 7.4 8.1 9.0 8.3 9.67 4.8 6.6 8.0 7.2 8.38 4.2 5.9 8.0 6.7 7.79 37.0 43.1 48.4 46.9 46.112 7.7 11.2 18.2 14.1 17.815 2.6 8.4 11.8 10.7 18.416 0.3 1.0 2.4 13.9 3.718 0.0 3.2 0.0 23.5 3.319 0.0 0.3 0.0 21.0 0.720 0.0 3.2 4.7 15.4 13.321 10.3 14.8 16.2 23.7 28.326 116.0 115.8 129.4 120.9 126.827 33.8 37.6 41.6 39.3 40.829 0.0 0.2 0.2 7.1 1.4
Lake number 1984 1988 1989 1999 2001
33 46.7 47.0 53.1 50.9 53.834 0.0 0.2 0.5 20.3 1.235 0.0 0.0 0.0 3.3 0.037 0.0 0.0 0.0 6.1 4.238 110.5 110.1 115.9 113.7 115.339 0.0 1.2 0.7 4.7 2.740 0.0 0.0 0.0 2.5 0.041 1.3 0.0 21.6 17.0 16.542 70.9 77.0 97.2 86.5 95.443 63.8 73.5 76.8 75.2 80.044 100.5 104.4 109.5 108.3 111.646 42.5 54.4 103.0 74.2 87.347 18.0 17.8 28.7 23.2 25.049 30.0 30.8 42.3 34.4 35.951 50.9 52.6 55.9 53.2 55.454 31.3 31.7 34.9 34.2 35.855 32.6 41.0 41.1 63.557 1.6 2.3 10.8 4.8 12.958 0.0 0.3 2.8 1.3 15.161 1.6 16.4 11.3 32.062 59.6 63.8 83.6 68.9 77.165 41.2 41.5 48.6 44.5 46.567 6.4 6.5 9.8 8.1 10.568 14.2 15.7 27.7 19.3 24.170 77.7 134.3 111.6 181.672 3.9 6.6 7.2 14.4 5.676 9.7 11.2 20.2 19.8 26.477 3.2 8.6 4.1 20.8 4.678 8.7 11.8 11.0 11.279 10.3 18.0 25.8 30.8 38.580 0.0 0.0 0.6 6.6 6.281 0.3 6.4 25.6 9.9 25.882 4.8 12.3 11.9 13.783 7.9 16.0 15.9 17.287 0.0 0.2 0.2 10.2 1.591 15.2 13.1 19.8 19.7 20.03 57.7 60.1 66.9 57.0 64.824 9.3 8.9 9.9 9.8 10.028 27.1 27.8 31.4 28.0 28.131 13.8 15.1 20.7 14.7 17.832 34.4 0.2 45.3 2.948 25.5 26.8 36.3 28.0 29.253 64.7 52.7 78.7 60.7 65.866 10.0 8.4 10.4 9.7 10.290 21.9 23.7 25.9 24.0 25.0

Temporal changes of thermokarst lakes in PT-5Temporal changes of thermokarst lakes in PT-5
y = -1.7376x + 3505.7
R2 = 0.9036
0
20
40
60
80
1980 1985 1990 1995 2000 Т, year
S, ha
Decrease of lake area
y = 0.5619x - 1090.6
R2 = 0.6861
0
20
40
60
80
1980 1985 1990 1995 2000 Т, year
S, ha
Increase of lake area
y = -0.2225x + 476.79
R2 = 0.1657
0
20
40
60
80
1980 1985 1990 1995 2000 Т, year
S, ha
All lake

Results of analysis of geocryologic changes

Samples of lakes areas changes Samples of lakes areas changes in continuous permafrost zonein continuous permafrost zone
Arctic tundra, PT-10, PT-11Arctic tundra, PT-10, PT-11
Total area of lakes Total area of lakes :: 19198484 – – 3463,53463,5 haha,,20020066 – – 37613761,,00 haha..
PT-11PT-11
Total area increase of lakes in PT-11: 297,3 ha
Normalized total area increasek = 9%
Total area increase of lakes in PT-10: 344,1 ha
Normalized total area increase k = 10%
Total area of lakes Total area of lakes :: 1984 – 34211984 – 3421,,2 2 haha,,2006 – 3765,3 2006 – 3765,3 haha..
PT-10PT-10

Changes of summarized area Changes of summarized area of thermokarst lakesof thermokarst lakes in continuous permafrost zonein continuous permafrost zone
Pilot territories PT-7 PT-10 PT-8 PT-9 PT-11
Total area of Total area of lakeslakes, ha
19731984
6292,7 3421,2 1899,13566,9
3611,85
2006 6965,5 3765,3 2035,0 3998,9 3975,9
Volume of sample 80 40 30 40 60Total area decrease of
lakes, ha 672,8 344,1 135,9 432,0 364,05
k, % 10,7 10 7 12 9
k - Normalized total area of lakes increase

Change of summarized area of thermokarst lakes Change of summarized area of thermokarst lakes in discontinuous permafrost zonein discontinuous permafrost zone
k - Normalized total area of lakes decrease
Pilot territories PT-1 PT-2 PT-3 PT-4 PT-5 PT-6
Total area Total area of lakesof lakes,, ha ha
197319841988
2155,13673,
22664,1 3777,
0 3165,7
3864,2
20012005 1685,
53234,8 2644,7 2921,7
2892,42759,6
Total area decrease of lakes, ha -469,6 -438,4 -19,4 -855,3 -273,3 -1104,6
k, % -22 -12 -1 -23 -9 -29

Degree of Degree of latitudelatitude
kk
Normalized value of thermokarst lakes areasNormalized value of thermokarst lakes areasdepending on degree of latitudedepending on degree of latitude

Map of permafrost zoningMap of permafrost zoning

Thank you!Thank you!