study of corrosion tendency of drinking water in the
TRANSCRIPT

© 2016 Ed. Univ. „Al. I. Cuza” Iași. All rights reserved Corresponding author’s e-mail: [email protected]
Available online at http://geology.uaic.ro/auig/
Analele Stiintifice ale Universitatii “Al. I. Cuza” din Iasi Seria Geologie 62 (1–2) (2016) 19–27
AUI GEOLOGIE
Study of corrosion tendency of drinking water in the distribution system of Iasi City, Romania Traian Gavriloaiei1
1 “Alexandru Ioan Cuza” University of Iaşi, Department of Geology, 20A Carol I Blv, 700505 Iaşi, Romania
Abstract The usefulness of water quality indices, such as Langelier saturation index (LSI), the Ryznar stability index (RSI), the Puckorius scaling index (PSI) and aggressiveness index (AI), has been studied, for 30 samples of tap water from drinking water distribution system of Iasi City, Romania. The values of these indices present contradictory results. The LSI values are negative or close to zero and range from -1.748 to +0.174, which means that 12 samples present tendency of corrosion and 18 samples are in equilibrium with the calcium carbonate. Ryznar stability index ranged between 7.25 and 10.89, while Puckorius scaling index ranged between 7.32 and 9.54. According to RSI and PSI indices, the results show that all the samples present moderate to significant corrosive tendency. The AI values indicate that 25 samples present a moderate aggressiveness and 5 samples are non-aggressive. The results of LSI index are reasonably comparable with the RSI values. These two indices (LSI and RSI) are known to offer more precise informations than the Puckorius index or aggressiveness index, in keeping track of corrosion and scaling potential of the water samples. Keywords: corrosion potential, scaling tendency, aggressiveness index, water quality indices, Iasi, Romania.
1. Introduction
The problem associated with lead corrosion in an old distribution system is a priority for an urban settlement, like Iasi City, Romania. Lead in drinking water results from the interaction between water pipe and a soft corrosive water (which is
slightly acidic to slightly basic) with low in hardness and alkalinity, and the extensive use of lead pipe in the former period. The most common problems that influence the domestic water chemistry are the electro-chemical process, which attacks the interior of the water pipes. The damages which appear can be developed

20 Gavriloaiei T.
AUI–G, 62, 1–2, (2016) 19–27
until the occurrence of small holes in the water pipes, which later can compromise even their use. The corrosion and scaling potential is a measure of the degree of aggressiveness of the water inside the water pipes. Chemically speaking, corrosion is defined as a process of destruction of the metallic coating by chemical or electro-chemical reactions, between water and the metallic surface where water is stored (DeBerry et al., 1982). Also, the term is used to describe the water aggressiveness that can dissolve the material, wherewith it comes in contact (Al-Husseini, 2012). While the urban population has access to current water, in Romania most of the rural population still consumes underground water for domestic use. According to the specific chemistry, surface water or underground water can present the following tendencies: scale formation, scale dissolving or both tendencies and then it is in chemical equilibrium with calcium carbonate (DeBerry et al., 1982; Larson, 1975). The corrosion rate depends on the low pH value, the electric conductivity of water, the oxygen con-sumption, temperature, and also the calcium hardness and the alkalinity of the water sample (Larson, 1975). The scale deposit is given by various chemical compounds, according to the hardness or alkalinity of the water. Generally, the water ability to have corrosion or scale-forming tendency is influenced by the quantity of solids dissolved: water with content of sodium salts is more corrosive than the water with content of calcium and magnesium salts, because the last types of salts have the tendency to deposit themselves on the interior of the water pipes. The total elimination of corrosion
and scale-forming tendency is not possible and the problem can be carried out by replacing the components of the flowing system or by treating water with chemical agents, that lead to the decrease of the corrosivity (DeBerry et al., 1982; Larson, 1975; Kumar et al., 2012).
Chemical soil characteristics (amount of carbonate, alkalinity, pH) and its clay content may influence the distribution of chemical elements in groundwaters. The studied area, Iasi City, Romania, belongs to a temperate-continental climate. In the higher areas of the southern part of Iasi City, soils are slightly acidic and supplied with humus; calcium carbonate is less present in groundwater (Iancu and Buzgar, 2008). In the northern part of the perimeter, the reaction of soils varies from slightly acidic to slightly alkaline, except for some sectors from the Bahlui River neighborhood, where soils show moderate to strongly alkaline reaction (Iancu and Buzgar, 2008). The content of calcium carbonate and alkalinity in water distribution system or in underground water of Iasi City is depending on soil evolution, erosion processes or human impact in the area.
In this paper, the main indices were used, including the Langelier saturation index (LSI), the Ryznar saturation index (RSI), the Puckorius scaling index (PSI) and aggressiveness index (AI), respect-tively, to describe the corrosive or scaling tendencies for 30 samples of tap water from water distribution system of Iasi City, Romania.
2. Materials and methods
The Langelier saturation index (LSI) is a measure of the degree of saturation in

Corrosion of drinking water in the distribution system of Iași 21
AUI–G, 62, 1–2, (2016) 19–27
calcium carbonate of a water sample. Most authors calculate LSI from the algebraic difference between the actual pH value and the saturation one (pHs). LSI index is calculated with the formula (Al-Husseini, 2012; Rafferty, 2000; Davil et al., 2009; Saifelnasr et al., 2013; Sivsankar et al., 2013; Shankar, 2014):
LSI = pH – pHs (1) where: pH – values of actual pH;
pHs – values of pH in saturation conditions with calcium carbonate, which is calculated by the equation:
pHs = (9.3 + A + B) – (C +D) (2)
where: A, B, C and D are the empirical
constants based on total dissolved solids (TDS as mg·L-1), water temper-ature (ºC), calcium hardness (CaCO3 as mg·L-1) and total alkalinity (CaCO3 as mg·L-1).
Ryznar (1944) uses a database of scale measurements in municipal water systems to predict the effect of water chemistry and suggested a modified Langelier index, named Ryznar stability index (RSI), calculated with the formula (Al-Husseini, 2012; Rafferty, 2000; Davil et al., 2009; Shankar, 2014):
RSI = 2pHs – pH (3)
The value obtained by reversing the two parameters, better estimates the severity of the scaling tendency and does not function as a predictor of corrosion, because both parameters are calculated according to the degree of saturation in calcium carbonate (Sheikholeslami, 2005). In terms of general corrosion, at low pH,
the corrosive tendency is manifested, while, at high pH, the scale forming tendency occurs. These two indices have been used by Kim et al. (2010) for treated effluents and the authors concluded that the samples must be neutralized to prevent the corrosion tendency.
Another possibility to appreciate the scale forming tendency is given by the Puckorius scaling index (PSI), which tries to quantify the relationship between the saturation state and the scale forming tendency, by considering the buffering capacity of the water sample (Al-Husseini, 2012; Davil et al., 2009; Zia et al., 2008). In the formula given by the author, the actual pH used by LSI and RSI, was replaced with the equilibrium pH (pHeq):
PSI = 2pHs – pHeq (4)
While PSI index is an improvement comparing with the other indicators, this index is not completely error-free: the scaling indicators do not measure the tendency to corrosion of steel or metal, but it rather describes the aggressiveness of the crust layer deposited on the inner walls of the water pipes (Rafferty, 2000; Shankar, 2014).
The aggressiveness index (AI) was developed to ensure the structural integrity of the water pipes. Recently, it has been used to predict whether water quality deg-radation would occur from pipe dissolu-tion. The aggressiveness index is a simpli-fied form of the Langelier index and is defined as follows (DeBerry et al., 1982):
AI = pH + log (A · H) (5) where: A – total alkalinity (CaCO3 as mg·L-1)
H – calcium hardness (CaCO3 as mg·L-1).

22 Gavriloaiei T.
AUI–G, 62, 1–2, (2016) 19–27
In this paper, the total of dissolved solids, salinity, conductivity, pH and temperature of samples were determined in the field (during autumn 2014), with SensION 1 Portable pH Meter and SensION 5 Conductivity Meter (Hach Drel 2100 Portable Water Quality Laboratories). The alkalinity and calcium hardness were determined after sampling, in the labo-ratory, according to the standard methods (Mănescu et al., 1994): the total alkalinity of water was determined by titration with
standard solution of hydrochloric acid, using methyl orange as indicator, while the calcium hardness was determined by titration with Na2-EDTA in buffered solution, using murexide as indicator. 3. Results and discussions
For the present study, 30 water samples have been considered; they were taken from the water distribution system of Iași city and its surroundings (Fig. 1).
Fig. 1 Map of the studied area with the location of the samples (Iasi City, Romania).
The locations of the sampling sites were not distributed regularly on the whole surface taken in the study. This is because, at the moment when the samples have been taken, the author only intended to test the corrosion and scaling potential of the waters from Iasi County.
The water stability indices were never
used to measure the tendency of the samples in the water pipes, but rather to measure the degree of aggressiveness of the deposits of CaCO3, ignoring the content in other cations or anions (the biggest contributors to corrosion) (Kim et al., 2010). The conditions to appreciate the stability of the water samples, concern-

Corrosion of drinking water in the distribution system of Iași 23
AUI–G, 62, 1–2, (2016) 19–27
Tab. 1 Summary of the stability indices used in the present study (DeBerry et al., 1982; Zia et al., 2008; Al-Husseini, 2012; Shams et al., 2012)
Index Index value Water condition
Langelier Saturation Index
LSI < -0.5 -0.5 < LSI < +0.5
LSI > +0.5
Slight to severe corrosion Borderline scale forming tendency, near balanced water Moderate to severe scale forming
Ryznar Stability Index
RSI < 6 6 < RSI < 7
RSI > 7
The scale tendency increases as the index decreases Water is at saturation equilibrium with any CaCO3 The corrosion tendency increases as the index increases
Puckorius Scaling Index
PSI < 6 6 < PSI < 7
PSI > 7
The scale tendency increases as the index decreases Water is at saturation equilibrium with any CaCO3 The corrosion tendency increases as the index increases
Aggressiveness Index
AI < 10 10 < AI < 12
AI > 12
Highly aggressive water Moderately aggressive water Mon-aggressive water
Tab. 2 The values of chemical parameters for the analyzed samples in the study
Samples Minimum Maximum Average SD TDS (mg·L-1) 30 27.40 764 334.20 190.49 Conductivity (µS·cm-1) 30 51.90 1388 609.86 318.54 Salinity (‰) 30 0 0.800 0.327 0.187 Alkalinity (mg CaCO3·L-1) 30 9.80 127.51 50.02 29.07 Hardness (mg CaCO3·L-1) 30 48.04 372.33 258.30 97.29 pH 30 6.07 8.42 6.91 0.56
ing the corrosion or scale forming ten-dency are presented in Table 1.
The analyzed parameters are pres-ented in Table 2, which shows that the values of the physical or chemical properties are all within permissible limits for the quality of domestic water.
The LSI values are between -1.748 and +0.174, indicating a slight to moderate corrosive tendency (for 12 samples) and an equilibrium tendency with calcium carbonate (for 18 samples) taken into consideration (Fig. 2). As these indices are qualitative parameters, the corrosive and scale forming tendency
cannot be measured quantitatively, and the values of the LSI cannot appreciate the actual state of the water samples.
Some good reviews for the saturation index calculated in terms of Langelier equation are presented in the literature. Thus, Wojtowicz (2001) has made a review for the equation of saturation, concerning the values of the solubility constant of calcium carbonate and the ionic strength of the samples. To measure the scaling potential of carbonate systems, Sheikholeslami (2005) used a new index, SPI, based on the relationships between Gibbs free energy and the solubility con-

24 Gavriloaiei T.
AUI–G, 62, 1–2, (2016) 19–27
Fig. 2 The values of LSI, RSI and PSI indices for the analyzed samples.
stants. To estimate the scale forming properties of a water sample, Prisyazhniuk (2007) presented a simplified procedure for LSI, knowing the total alkalinity, the electric conductivity and the pH value of a sample. Zia et al. (2008) studied the influence of the temperature on the final value of the LSI index to predict the corrosive or scale forming tendencies. According to Sivsankar et al. (2013), the corrosion and scaling potential of water is due mainly to the excess of free CO2 and its interaction with CaCO3 and MgCO3.
Different results were obtained for the other two indices taken into consideration. The values of the RSI index were between 7.252 and 10.899, which shows that all the analyzed samples have a significant corrosive tendency. For all samples, the RSI values are larger than 7 and show that the studied samples are under the threatening of corrosion, regardless their source. The Ryznar index attempts to quantify the relationship between the state of samples saturation in CaCO3 and the scale forming tendency, especially in urban water supply system. That is why the RSI index present a heavy tendency to corrosion comparing with the values
given by the LSI index (Kutty et al., 1992). Puckorius (1983) developed a practical scale index, in order to indicate the calcium carbonate scaling tendency of industrial samples (Shams et al., 2012). The result of PSI index revealed that all the samples in the study have a moderate corrosive tendency, because the values of PSI range from 7.323 to 9.547. Corrosion of water samples is accelerated by low pH values, low alkalinity and high free carbon dioxide (Rafferty, 2000). The attack is much rapid as compared to water samples with high alkalinity and low carbon dioxide content.
The AI values are ranging between 10.30 and 12.22, indicating that 25 samples present a moderate aggressive-ness, while 5 samples are non-aggressive. Since the AI is based on CaCO3 satu-ration, it should yield an accurate prediction of non-aggressiveness provided by a protective calcium carbonate coating, but only if water sample has an over-saturated state. However, if the samples are undersaturated in CaCO3, there is no reason to expect the AI to predict the dissolution of pipe water in distribution urban system. Furthermore, the AI does

Corrosion of drinking water in the distribution system of Iași 25
AUI–G, 62, 1–2, (2016) 19–27
not account for temperature and ionic strength (as in the case of Langelier index) and fails to account for protective chemical reactions in drinking water. Nowadays, the AI is a better predictor of pipe performances and it has been used extensively in industry. Contradictory results were also published in literature (Kim et al., 2010, Al-Husseini, 2012, Shams et al., 2012, Shankar, 2014).
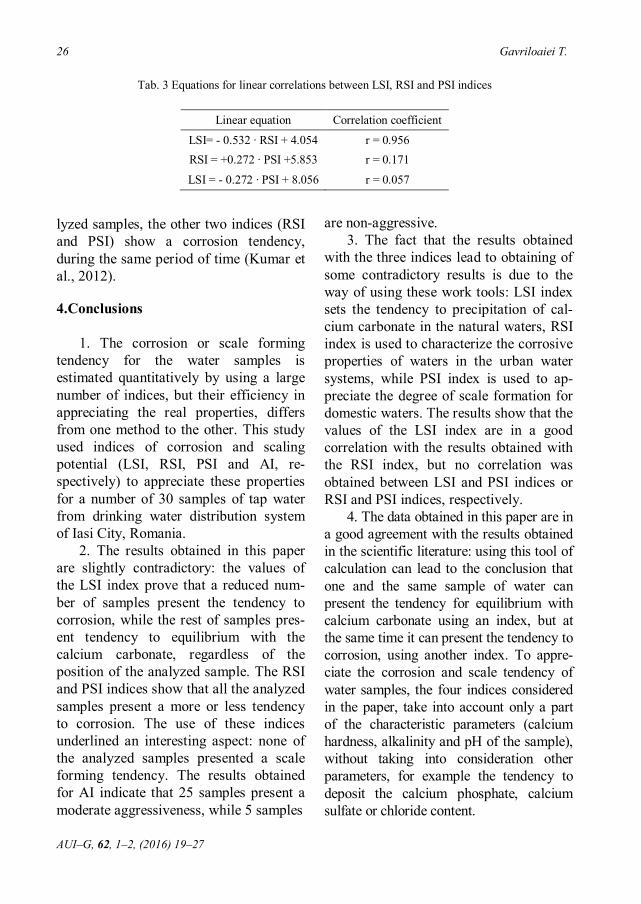
The results of the present paper show that the average values of LSI, RSI, PSI and AI respectively, were -0.507 ± 0.467, +8.571 ± 0.859, +8.190 ± 0.565 and 11.551 ± 0.481, respectively, and presented sig-nificant difference among samples (pa-rameter P): there was a significant dif-ference between LSI and RSI (P=0.000) and between LSI and PSI (P=0.024), but the difference was not significant between RSI and PSI (P=0.577). Despite the fact that there are several samples showing no correlation between these indices, the latter are still used in estimating the tendency to corrosion of the water samples and to understand or diminish the possible causes of this phenomenon. The equations of linear regression among the three indices are given in Table 3 and they can be used to recalculate the values of the three indices.
These three indices are the most used tools to predict the tendency of calcium carbonate scaling, but they are not appro-priate in estimating the tendency of other types of salts to deposit, for example calcium phosphate, calcium sulfate in hard and soft waters, where the salts of chlorate type can perturb the equilibrium conditions for calcium carbonate (DeBerry et al. 1982; Shams et al. 2012). The in-dices are useful to determine the initial conditions to treat the domestic waters,
but cannot substitute a complete chemical analysis of water for any type of sample. The contradictory results of the estima-tions by using the three indices involve the appreciation of the equilibrium conditions of calcium carbonate, which means a theoretical estimation of the tendency to corrosion or scale formation in various conditions or for different types of water samples. Taking into consid-eration that the RSI and PSI indices use the alkaline character of the samples to estimate the buffering capacity, it is considered that the water samples with low alkalinity can form an acidic or corrosive environment in the systems where they appear (Shams et al. 2012). Moreover, the PSI index includes the buffering capacity of the samples, calculated with the equilibrium of the hydrogen ions activity in the system. Even though, some authors consider that the PSI values are more precise com-paring with the values of LSI and RSI indices (Lin et al. 2013). The results obtained in this paper show that the data regarding the LSI index are in a good correlation with the results obtained with the RSI index, but no correlation was obtained between LSI and PSI indices or RSI and PSI indices, respectively. Using the RSI and PSI indices, all the samples present, more or less, a tendency to corro-sion; the results obtained by using the LSI index show a tendency from corrosion until the equilibrium with CaCO3 is attained, for the samples taken into consideration. Similar conclusions were also presented in other papers in the literature. Some authors studied a number of samples of chemically treated cooling waters, between 1998 and 2007: if LSI shows a scale forming tendency of the ana-
26 Gavriloaiei T.
AUI–G, 62, 1–2, (2016) 19–27
Tab. 3 Equations for linear correlations between LSI, RSI and PSI indices
Linear equation Correlation coefficient
LSI= - 0.532 ∙ RSI + 4.054 r = 0.956 RSI = +0.272 ∙ PSI +5.853 r = 0.171
LSI = - 0.272 ∙ PSI + 8.056 r = 0.057
lyzed samples, the other two indices (RSI and PSI) show a corrosion tendency, during the same period of time (Kumar et al., 2012). 4.Conclusions
1. The corrosion or scale forming
tendency for the water samples is estimated quantitatively by using a large number of indices, but their efficiency in appreciating the real properties, differs from one method to the other. This study used indices of corrosion and scaling potential (LSI, RSI, PSI and AI, re-spectively) to appreciate these properties for a number of 30 samples of tap water from drinking water distribution system of Iasi City, Romania.
2. The results obtained in this paper are slightly contradictory: the values of the LSI index prove that a reduced num-ber of samples present the tendency to corrosion, while the rest of samples pres-ent tendency to equilibrium with the calcium carbonate, regardless of the position of the analyzed sample. The RSI and PSI indices show that all the analyzed samples present a more or less tendency to corrosion. The use of these indices underlined an interesting aspect: none of the analyzed samples presented a scale forming tendency. The results obtained for AI indicate that 25 samples present a moderate aggressiveness, while 5 samples
are non-aggressive. 3. The fact that the results obtained
with the three indices lead to obtaining of some contradictory results is due to the way of using these work tools: LSI index sets the tendency to precipitation of cal-cium carbonate in the natural waters, RSI index is used to characterize the corrosive properties of waters in the urban water systems, while PSI index is used to ap-preciate the degree of scale formation for domestic waters. The results show that the values of the LSI index are in a good correlation with the results obtained with the RSI index, but no correlation was obtained between LSI and PSI indices or RSI and PSI indices, respectively.
4. The data obtained in this paper are in a good agreement with the results obtained in the scientific literature: using this tool of calculation can lead to the conclusion that one and the same sample of water can present the tendency for equilibrium with calcium carbonate using an index, but at the same time it can present the tendency to corrosion, using another index. To appre-ciate the corrosion and scale tendency of water samples, the four indices considered in the paper, take into account only a part of the characteristic parameters (calcium hardness, alkalinity and pH of the sample), without taking into consideration other parameters, for example the tendency to deposit the calcium phosphate, calcium sulfate or chloride content.
Corrosion of drinking water in the distribution system of Iași 27
AUI–G, 62, 1–2, (2016) 19–27
References Al-Husseini, A.H.E., 2012. Study of potential cor-
rosion and scaling for treated water of two water treatment plants in Al-Hilla City. Journal of Babylon University, Engineering Sciences, 4, 20, 1180–1190.
Davil, M.F., Mahvi, A.H., Norouzi, M., Mazloomi, S., Amarluie, A., Tardast, A., Karamitabar, Y., 2009. Survey of corrosion and scaling potential produced water from Ilam water treatment plant. World Applied Sciences Journal, 7, 1–6.
DeBerry, D.W., Kidwell, J.R., Malish, D.A., 1982. Corrosion in portable water systems. Final Report, US EPA, Austin, Texas, 1.1-3.9.
Iancu, O.G., Buzgar, N., 2008. The Geochemical Atlas of heavy metals in the soils of the Municipality of Iasi and its surrounding areas. Editura Universității ”Alexandru Ioan Cuza” of Iași, 65p.
Kim, J.H., Behera, S.K., Oh, S.Y., Park, H.S., 2010. Reuse potential of municipal wastewater treat-ment facility effluents for sustainable water resource management in Ulsan, Korea. Water and Environment Journal, 24, 293–302.
Kumar, S.S., Suriyanarayanan, A., Panigrahi, B.S., 2012. Studies on performance of indices in cool-ing water system. Indian Journal of Chemical Technology, 19, 75–80.
Kutty, P.C.M., Nomani, A.A., Al-Sulami, S., 1992. Simple experimental method to determine CaCO3 precipitation tendency in desalinated water. Tech. Report no. SWCC (RDC)-19, First Gulf Water Conference, Dubai, 685–712.
Larson, T.E., 1975. Corrosion by domestic waters. Illinois State Water Survey, ISWS-75-Bul59, Urbana, U.S.A., 2–12.
Lin, W.M., Fan, K.C., Chang, K.C., Chung, K.M., 2013. Dissemination of solar water heaters in Taiwan: the case of remote Islands. Energies, 6, 5101–5113.
Mănescu, S., Cucu, M., Diaconescu, M.L., 1994. Environmental Health Chemistry. Editura Medicală, București, 355p. (In Romanian).
Prisyazhniuk, V.A., 2007. Prognosticating scale-for-ming properties of water. Applied Thermal Engineering, 27, 8-9, 1637–41.
Puckorius, P., 1983. Get a better reading on scaling tendency of cooling water. Power, 127, 9, 79‐81.
Rafferty, K., 2000. Scaling in geothermal heat pump system. GHC Bulletin, Oregon Institute of Technology, 1–9. http://geoheat.oit.edu/otl/ scaleghp.pdf; last accessed: Jan, 2015.
Ryznar, J.W., 1944. A new index for determining the amount of calcium carbonate formed by water. Journal of the American Water Works Association, 36.
Saifelnasr, A., Bakheit, M., Kamal, K., Lila, A., 2013. Calcium Carbonate scale formation, prediction and treatmant (case study Gumry Oilfield-PDOC). International Letters of Chemistry, Physics and Astronomy, 12, 47–58.
Shams, M., Mohamadi, A., Sajadi, S.A., 2012. Eval-uation of Corrosion and scaling potential in rural water supply distribution networks of Tabas, Iran. World Applied Sciences Journal, 17, 11, 1484–89.
Shankar, B.S., 2014. Determination of scaling and corrosion tendencies of water through the use of Langelier and Ryznar indices. Scholar Journal of Engineering and Technology, 2, 2A, 123–27.
Sheikholeslami, R., 2005. Scaling potential index (SPI) for CaCO3 based on Gibbs free energies. Thermodynamics, 51, 6, 1782–89.
Sivsankar, V., Ramachandramoorthy, T., Kumar, M.S., 2013. Deterioration of costal groundwater qual-ity in Rameswaram Island of Ramanathapuram District, Southern India. Journal of Water Chemistry and Technology, 35, 2, 91–98.
Wojtowicz, J.A., 2001. A revised and updated satu-ration index equation. Journal of Swimming Pool and Spa Industry, 3, 1, 28–34.
Zia, K.M., Bhatti, H.N., Bhatti, I.A., Nawaz, R., 2008. A pHs equation for Calcium carbonate scale prediction in cooling water systems. Journal of the Chemical Society of Pakistan, 30, 2, 182–85.