study of characteristics of plasma nitriding and oxidation
TRANSCRIPT

Louisiana State UniversityLSU Digital Commons
LSU Master's Theses Graduate School
2004
Study of characteristics of plasma nitriding andoxidation of superalloy IN738LCMary Shanti PampanaLouisiana State University and Agricultural and Mechanical College, [email protected]
Follow this and additional works at: https://digitalcommons.lsu.edu/gradschool_theses
Part of the Mechanical Engineering Commons
This Thesis is brought to you for free and open access by the Graduate School at LSU Digital Commons. It has been accepted for inclusion in LSUMaster's Theses by an authorized graduate school editor of LSU Digital Commons. For more information, please contact [email protected].
Recommended CitationPampana, Mary Shanti, "Study of characteristics of plasma nitriding and oxidation of superalloy IN738LC" (2004). LSU Master'sTheses. 2709.https://digitalcommons.lsu.edu/gradschool_theses/2709

STUDY OF CHARACTERISTICS OF PLASMA NITRIDING AND OXIDATION
OF SUPERALLOY IN738LC
A Thesis
Submitted to the Graduate Faculty of the Louisiana State University and
Agricultural and Mechanical College in partial fulfillment of the
requirement for the degree of
Master of Science in Mechanical Engineering
in
The Department of Mechanical Engineering
Mary Shanti Pampana Bachelor of Technology
Jawaharlal Nehru Technological University, Hyderabad, India 2001 August 2004

ii
Dedication
I praise God for His blessings to be what I am today. This thesis is dedicated to my
grandparents, Medisetti SathiRaju, Medisetti Payditalli, parents, Pampana Surya Bhaskar
Rao, Pampana Varalakshmi, my major professor, Dr. Aravamudhan Raman, my previous
employer Mr. SaiKumar Pampana who always encouraged me to believe in myself, to put
continuing effort till the goal is reached, and to other professors and teachers who gave me
a good foundation for my graduate studies.

iii
Acknowledgements
I express my sincere gratitude to Dr. Aravamudhan Raman, my major professor, for
his continued encouragement throughout the Masters Degree program. I appreciate the
penetrating scientific approach that he conveyed to me. I would like to acknowledge his
scholastic expertise. I am indebted to him for his invaluable guidance and patient support.
This research would not have been complete without the help of Dr. E.I.Meletis and
Dr. Samuel Ibekwe, who contributed immensely, allowing me to use the very essential
equipment available at LSU and Southern University. I am grateful to Dr. Wen Jin Meng
for teaching me Material Thermodynamics, Advanced techniques in Material
Characterization and TEM. I thank Dr. Xiaogang Xie, High Magnification Imaging and
Microanalysis Laboratory, Geology and Geophysics department, for training me to be
proficient in SEM image analysis. I am also gratefully indebted to the ME department and
to its chairman, Dr. Tryfon T. Charalampopoulos for the special support. I gratefully
acknowledge the guidance given by Varshni Singh throughout the nitriding
experimentation and analysis. I thank Dr. Jiechao Jiang at the Materials Characterization
Facility for providing assistance to carry out XPS study.
I would like to thank Praveen, Aparna, Amol, Rakesh and other friends who gave
me lot of moral support, encouragement and advice.

iv
Table of Contents
Dedication……….………………..……………………………………………...............ii
Acknowledgements………………………………...…………….…………..……...….iii
List of Tables………………….……………………...……………………….………….vi
List of Figures……………….………………………………………..…..……………vii
List of Nomenclature………..……………….………………..………..………........viii
Abstract.……………………………..………………...….…………………...….….…...ix
Chapter 1. Introduction ..……………………………………..……………..............1 1.1 High Temperature Materials.………….……………...……...……….…...….....1 1.2 Ni-based Superalloys…………..…………….………………...…………..........2
1.3 Strengthening of Superalloy...…….…..……..…………………….....................3 1.4 Phases in the Superalloy....………….…………….………….……….……..….3 1.5 Microstructure Development.………………….……………….…………….....4 1.6 Investment Casting………..…………………………………..………………....5 1.7 γ′ Precipitate Coarsening and Coalescence………………………..………….....6 1.8 Texture Development…………………………………………………………....8 1.9 Oxidation Kinetics of Superalloys………………………………………..............8 1.10 Intensified Plasma Assisted Nitriding (IPAN) of IN738LC…………………….…...11 1.11 Research Motivations and Objective.….………….....…...…………………..11
Chapter 2. Experimental Background and Procedures…..……...…...………14
2.1 Materials………………………..…………..….………………..…...…..............14 2.2 Sample Preparation for Oxidation……..……………………….…….......………..14 2.3 Experimental Procedure for Oxidation…………………………….……………..15 2.4 Sample Preparation for Microstructural Study……………….…………...…......15 2.5 Sample Preparation for X-Ray Diffraction Study………………………………..16 2.6 Sample Preparation for XPS Study………………………….………...……...…16 2.7 Sample Preparation for Microhardness Testing……..……….…..…………...…17 2.8 Sample Preparation for Nitriding………………….………….………..…………..17 2.9 Experimental Procedure for Nitriding………………..………….……...............18
2.9.1 Experimental Set-up………………………………….……................18 2.9.2 IPA Nitriding Procedure………………………….….….…….....…...18
2.10 Sample Preparation for Microstructural Study……….……..…….…….……....20 2.11 Sample Preparation for X-Ray Diffraction Study…………………..….……....20 2.12 Sample Preparation for XPS Study…………………...………....….……………..20 2.13 Sample Preparation for Microhardness Testing………………….…...............21 2.14 Sample Preparation for Wear Testing………………………………….…......21

v
Chapter 3. Results and Discussion - Oxidation of IN738LC…..….………22 3.1 Oxidation Kinetics….……….……..………..……..……..……….………….22 3.1.1 Oxidation at 1000 ºC……………………………………………….22 3.1.2 Oxidation at 1090 ºC……………………………………………….23 3.1.3 Oxidation at 1140 ºC……………………………………………….24 3.1.4 Oxidation at 1190 ºC……………………………………………….24
3.2 Morphological Study Using SEM………..……………..……………………..26 3.3 EDX Spectrum Analysis…………………..………..……..……..…………..28 3.4 XRD Analysis………………………..………..……..……..……..………....34 3.5 XPS Analysis………………………..………..……..……..……..……….....38 3.6 Microhardness Results…………..……………..………..……..……..….…..39
Chapter 4. Results and Discussion - IPAN of IN738LC………....………...43
4.1 XRD Analysis……………………………………………………….……….43 4.2 Morphological Study Using SEM……………………..……………………...45 4.3 XPS Analysis…………………………………………………………….......47 4.4 Wear Test Results……………………………………………………………49 4.5 Microhardness Results……………………………………………………….51
Chapter 5. Conclusions and Directions for Future Research Work …...52
5.1 Conclusion…………………………………….……………………................52 5.2 Future Research Direction…...……………………...……….………………....53
References………..……………….…………………………….……...…...……........54
Vita…………...……………………………...…………………..……...………..……..57

vi
List of Tables
Table 1. Chemical Composition of As-Received IN738LC……………………..….….…14 Table 2. Speed and Feed Parameters for Cutting Samples from IN738LC Rods…..….….15 . Table 3. IPAN Current Density and Corresponding Temperatures …………………..…..19 Table 4. Details of Wear Testing………...……………………………………………..…21 Table 5. Mass Gain and Loss Observed in IN738LC as a Function of Time at Various Temperatures………………………………………………………………………….…..25 Table 6. Analysis of Oxidation of IN738LC at Various Temperatures………...……..….25 Table 7. Result of XRD Analysis after Oxidation of IN738LC at Different Temperatures………………………………………………………………………….…..37

vii
List of Figures Fig. 1. Experimental set-up for IPAN process………………………..…….…………….18 Fig. 2. Oxidation kinetics of IN738LC at 1000°C & 1090°C…...……...…………….…..22 Fig. 3. Oxidation kinetics of IN738LC at 1140°C & 1190°C……………………….……23 Fig. 4. IN738LC oxidized at 1000ºC …….....…………………………………….…........26 Fig. 5. IN738LC oxidized at 1090ºC……………...………………………………..….….27 Fig. 6. (a-b). IN738LC oxidized at 1140ºC…………………………...…………….….….28 Fig. 6. (c-g). IN738LC oxidized at 1140ºC…………………………………………….….29 Fig. 7. IN738LC oxidized at 1190ºC……………………...…………………..…….…….30 Fig. 8. EDX Spectrum of as received IN738LC………...………………..………..….…..32 . Fig. 9. EDX Spectrum of oxidized samples…………………..………………...….……..33 Fig. 10. XRD patterns of oxidized samples ……...….........................................................35 Fig. 11. XPS spectra of IN738LC oxidized at Various Temperatures..…………...….......40 Fig. 12. Microhardness data of IN738LC for as-received sample and oxidized samples.. 42 Fig. 13. XRD patterns showing preferred orientation in IPAN samples…….…….….......43 Fig. 14. (a-d). Morphology of intensified plasma assisted nitrided sample 1………..........45 Fig. 15. (a-d). Morphology of intensified plasma assisted nitrided sample 2……..……...46 Fig. 16. (a-b). Morphology of intensified plasma assisted nitrided sample 3….……..…..47 Fig. 17. XPS of IPA nitrided samples and as-received IN738LC……….….….…………49 Fig. 18. XP spectra of as-received and nitrided samples ……………..……….………….50 Fig. 19. Wear profiles of as-received, nitrided 1, 2 and 3 samples of IN738LC….……....50 Fig. 20. Microhardness of IN738LC for the as-received and the three nitrided samples…...………………………………………………………………………………..51

viii
List of Nomenclature IN738LC A cast Ni-base superalloy strengthened by γ ′ precipitates, containing low
carbon; patented trademark of International Nickel Co., USA. See p.14 for its composition.
L12 FCC superlattice of the Cu3Au type γ Matrix phase in Ni-base superalloy γ ′ Ni3Al(Ti, Nb) precipitate phase in a Ni-base superalloy with L12 structure LSW Lifshitz – Slyozov and Wagner theory AC Air-cooled AAC Accelerated air or argon-cooled WQ Water quenched HIPing Hot isostatic pressing SEM Scanning electron microscope PO Preferred orientation (texture) IPA Intensified plasma assisted IPAP Intensified plasma assisted processing IPAN Intensified plasma assisted nitriding

ix
Abstract IN738LC is a nickel base superalloy, widely used in various applications in turbine
engines at high temperatures. Its oxidation and nitriding characteristics were focused in this
study.
Oxidation kinetics of IN738LC in dry air was studied at selected temperatures,
specially chosen depending on the chemical dynamics of the alloy at such high
temperatures during annealing. Isothermal oxidation in dry air was carried out at 1000°C,
1090°C, 1140°C and 1190°C. XRD results indicated an interesting onset of preferred
orientation in the γ’ depleted layer in all the samples. The XPS and XRD analyses revealed
the main oxide phases present in the oxide layers. Volatilization of Cr2O3 was found to be
the reason for the weight loss in the superalloy. Al2O3 formed a reliable and stable oxide
layer above 1100°C. Above 1140°C two different FCC solid solutions were formed and the
superalloy oxidized heavily and lost weight.
Intensified plasma-assisted nitriding (IPAN) is one of the most widely used surface
nitriding techniques. The surface of the as-received IN738LC was nitrided using this
technique. Preferred orientation was observed in the samples nitrided with 0.5, 1.0 and
1.5 mA of current density. The XPS analysis showed the formation of TiN and CrN along
with TiO2. Nano precipitates of TiN were observed on the γ' precipitates. IPAN improved
the microhardness value of the superalloy by about 70% and its wear resistance by about
10%.

1
Chapter 1. Introduction
1.1 High Temperature Materials
Material scientists and design engineers working with heat resistant materials
must know the high temperature characteristics, effects of processing and microstructure
on high temperature properties, high temperature oxidation and corrosion characterization
and application of coatings to prevent the various high temperature corrosion problems.
This information enables a property comparison and allows ranking of alloy performance,
helping in the selection of the materials and design guidelines for industrial applications.
Special topics like creep-rupture data assessment, thermal and thermo mechanical fatigue,
elevated-temperature crack growth, creep-fatigue interaction, design for high temperature
applications and prevention of excessive oxidation are of great importance in this aspect.
Superalloys were developed with a view to improve both reliability and performance in
service in gas turbine environments [1].
Superalloys find extensive application in aerospace industries, nuclear reactors,
chemical, petrochemical, power generation plants, environmental protection systems,
cryogenic applications and furnaces, where extreme temperatures, mechanical stresses
and corrosive environments are encountered [2]. They are classified as nickel based,
cobalt-based and iron based superalloys.
The turbine system that functions at high temperatures consists of many
expensive components, which must all work together without failure. Each of the
components must be monitored and controlled and taken care of to avoid serious
damages. The components in the path of the hot gas stream must have excellent
resistance to oxidation and hot corrosion in order to sustain the cyclic loading [3]. Blades
and vanes are the most important components in a combustion turbine [4]. Often people

2
try to increase the efficiency of the turbine by increasing the rotor inlet temperature. So,
effective cooling of the system must be ensured for safe operation over a long period of
time.
Apart from the required cooling of the system, the rotating blades must also have
better oxidation and corrosion resistance, high thermal fatigue resistance at both low and
high cycles, excellent microstructural stability [5] and high creep resistance.
1.2 Ni –Based Superalloys
Nickel-based alloys are the ones widely used for high temperature applications.
Over 50% of the advanced aircraft engines use superalloys. The physical metallurgy of
the superalloy is complex, subtle and sophisticated; yet the relationship of properties to
microstructures in these alloys is certainly the best known for all materials used in the
temperature range of 650-1050°C [9].
The superalloys consist of solid solution formers, precipitate formers and carbide
formers. The first class consists of elements that form the FCC austenitic γ matrix. These
are from groups V, VI and VII and include nickel, cobalt, iron, niobium, tantalum,
chromium, molybdenum and tungsten. The second class of elements form the γ' ( Ni3X )
precipitates. These elements are from groups III, IV and V and include Al, Ti, Nb, Ta and
Hf.
Boron and C make up a third class of elements that tend to segregate to grain
boundaries. These elements are from groups II, III, and IV and form compounds that
usually precipitate out of the matrix at high temperatures. Al is noted as a precipitation
strengthener and a potent solid solution strengthener. W, Mo and Cr also contribute
strongly as solid solution strengtheners, whereas Ti and Co are weak solid solution
strengtheners. The slow-diffusing elements Mo and W would be expected to be the most
3
potent hardeners. An additional beneficial effect on diffusion has been shown in a Ni-
22%Cr-2.8% Ti-3.1%Al alloy; the presence of Mo and W lowered the diffusivity of Ti
and Cr at 900°C [6]. Nickel-based superalloy basically consists of γ' precipitates in γ
solid solution matrix, the former ranging in amount from ~ 30 to 75% by volume in
different alloys.
1.3 Strengthening of Superalloy
Many Inconel alloys are cast alloys having good oxidation and creep resistance.
The strength of these superalloys arises from a combination of hardening mechanisms,
including contributions from solid solution elements, grain boundaries and precipitates.
In addition thermo mechanical processing is sometimes used to provide strengthening
through increased dislocation density and the development of a dislocation substructure.
That the modulus difference between the solute and solvent may give rise to
strengthening is based on the argument that extra work is needed to force dislocations
through hard regions in the matrix or precipitates. Borides and carbides only provide
little additional strengthening at low temperatures due to their small volume fractions,
although they may have significant effects on creep rate, rupture life, and rupture strain
through their influence on grain boundary properties.
1.4 Phases in the Superalloy
Superalloys are dynamic systems at high temperatures. The phases present are
reacting and interacting continuously. The very complex high temperature solid-state
reactions prevent defining chemical equations of state to categorize the systems.
• Gamma Phase ( γ ): The continuous matrix is an FCC nickel base austenitic phase
called gamma phase, that usually contains a high percentage of solid solution formers
such as Co, Cr, Mo and W.

4
• γ'-Ni3X Phase: Al and Ti are added in small amounts and mutual proportions to
precipitate high volume fraction of FCC γ', which invariably precipitates, remaining
coherent with the austenitic γ matrix. Ni3Al is a superlattice possessing the Cu3Au-L12
type structure [7] and it exhibits long-range order to near its melting point of 1385ºC. Ni
base alloys are vastly strengthened by γ' precipitate. For the stronger alloys, heat
treatments and service exposure generate a film of γ' along the grain boundaries which
improves rupture properties.
Carbide Phase: Carbon added at levels of about 0.055-0.2% combines with reactive and
refractory elements such as Ti, Ta and Hf to form MC carbides. During heat treatment
and service these begin to decompose into lower carbides such as M23C6 and M6C, which
segregate at the grain boundaries [8]. Carbides affect both the mechanical and fracture
properties. They are mostly found as MC carbides, segregated along the grain boundaries,
and act as stress-raisers and initiate cracks in the material. Misfit between matrix and
carbide leads to crack nucleation [9]. Under certain conditions, plate like phases such as
sigma, µ and Laves are formed which leads to lowered rupture strength and ductility.
1.5 Development of Microstructure
IN738LC was patented in August, 1969 by C.G.Vieber and J.J.Galka [10] of
International Nickel Company, Inc., NY. It is a polycrystalline Ni-based superalloy,
investment cast to desired design for industrial applications. LC represents that the alloy
is low in carbon, ~0.1 wt%. As stated before, it contains phases like γ' precipitated in the
γ solid solution matrix and carbide phases at the grain boundaries. The alloy contains
about 43 % γ' intermetallic precipitate phase. IN738LC has an FCC crystal structure
withγ’ precipitates having the L12 ordered superlattice.

5
1.6 Investment Casting
Investment casting produces near net shape configurations, allowing freedom of
design for wide range of alloys with precise details and dimensional accuracy. Wax
patterns are obtained by injection molding. An assembly is formed by attaching the
patterns and the sprue (central wax stick). The assembly is then immersed in a liquid
ceramic slurry and then into fine sand bed to form a shell. This is repeated several times
to form layers and then the wax is melted off, leaving a negative impression of the
assembly within the shell.
The molten alloy is cast in the mould; then the alloy is subjected to a hot isostatic
pressing process called HIPing, which helps to remove microporosity developed during
the casting process. In a neutral environment, HIPing is done for 2hrs at 1200ºC and then
the alloy is subjected to an aging treatment. Solutionizing and aging are the two steps
involved in the commercial aging treatment of IN738LC.
In the solution treatment process the alloy is placed at 1200ºC for about 2 hours
and then is cooled either by accelerated air cooling (AAC) or water quenching (WQ).
Then it is reheated to a temperature of 850ºC and held there for 24 hours and furnace
cooled to room temperature. Better heat treatments are developed to obtain a unimodal
precipitate microstructure and decrease the formation of spheroidal precipitates [11].
Thus a two step aging process is given. Solution treatment at 1130-1250ºC for 2-4 hours
is followed by an initial aging in a temperature range of 650-950ºC for a time period and
cooled to room temperature. Holding time of 12 to 200 hours and different cooling rates
during the aging has been reported in the literature [12]. Material scientists observed that
slow cooling during the final aging process and long periods of holding time (100-200
hours) at 1000ºC changes the spheroidal precipitates to unimodal cuboidal precipitates.

6
1.7 γ' Precipitate Coarsening and Coalescence
Many theoretical studies and experiments have been undertaken in the past to
understand the coarsening features and coalescence of γ' [19, 13-24]. The γ' precipitates
evolve in the process of minimization of the total free energy of the system. During this
process interfacial surface energy and elastic misfit strain energy play an important role
[25]. Interfacial energy leads the initial stages of the coarsening and later, when the
particles reach a critical size, the elastic strain energy takes over. Precipitate coarsening
along elastically soft <100> directions in Ni based alloys have been reported [9]. This
also is a tendency to minimize the free energy of the system.
Stabilized microstructure is good for high temperature industrial applications. So
control of size and growth of the precipitate helps to improve the mechanical properties
of the material at high temperatures [5]. Thermo-mechanical processes give refined grain
size yielding to a recrystallized microstructure through interactions between the
precipitate and the grain boundary. Dissolution or reformation of the precipitate and
thermal cycling gives rise to the final microstructure. Different mechanisms [26-27] have
been proposed for precipitate dissolution in the matrix.
Aaron and Kotler [28] considered that the concentration gradients and interactions
between the precipitate and the matrix at the interface contribute to the precipitate
dissolution. A three step model for the precipitate dissolution is proposed by Vermolen
and Zwaag [29] considering decomposition of precipitate, solute crossing the boundary
and finally, diffusion of solute to a long distance. Interface interactions are rate
controlling processes for precipitate dissolution.
During the process of balancing the free energy in the system the shape, size and
distribution of precipitates change. The size of γ' precipitate range from a few nm for

7
cooling precipitate to 100-1000 nm for fine, medium and coarse size precipitates. Coarse
precipitates dissolve again in the matrix in certain temperature range [9] or form rafts
[29-31]. In this the Zener’s approximation was used for explaining the diffusion mode,
and the growth rate is given by:
dtdr =
rCrCmD )( − 1
Here Cm is solute concentration in the matrix at equilibrium with precipitate of solute
concentration Cr and infinite radius, r. At increasing volume fraction this approximation
becomes poor when inter-particle distance decreases and diffusion field overlaps. A
modified version of LSW theory was proposed by Ardell [32] taking into account the
volume fraction in the diffusion equation. Multi particle diffusion is addressed by many
theories but particle coalescence was ignored [33-37].
Coalescence is the effect of volume fraction along with diffusion fields
overlapping and was studied by Davies, et al. [38-39], using Lifshitz and Slyozov theory
[40], and they came up with a modified Lifshitz-Slyozov Encounter Model (LSEM). At
high volume fraction coalescence is very high in both the solid phase and liquid phase
systems [41]. The mechanism of coalescence was interpreted in several ways. Davies, et
al. [38] proposed that overlapping of the diffusion fields when the particles are close
enough, not necessarily in physical contact in initial stages, causes the particles to
coalesce. After coalescence the precipitate was considered to move rapidly to equilibrium
shape through γ' / γ interface diffusion. Doherty [42] proposed that the process depends
on lattice mismatch where the precipitates move towards each other and coalesce, which
may be due to removal of elastically strained matrix between two adjacent particles.
Kang and Yoon [24] explained that when grains touch each other, migration of the grain

8
boundary between them towards the smaller grain takes place. Thus, here, coalescence
may be due to rapid diffusion at the γ' / γ interface immediately after the formation of a
neck between the two grains. In this process the activation energy for coarsening
remained constant with change in volume fraction indicating that the dominant
coarsening mechanism is still volume diffusion through the matrix even when the
particles are touching each other.
1.8 Texture Development
Texture formation during thermal or mechanical processing is an interesting
phenomenon [9]. Variation in Properties was observed due to onset of preferred
orientation (PO). Various studies only included two types of textures called annealing
textures and cold work textures. Grains recrystallize after processing to align themselves
in particular slip direction [43]. PO in FCC material can be related to interface mobility
of the growing grain [44].
Selective growth of recrystallized grains due to higher mobility of certain planes
and oriented nucleation and subsequent growth can be responsible for the formation of
textures in annealed materials [45]. A texture develops and proceeds at the expense of
some other possible texture with increase in temperature [46]. Texture formation would
affect modulus of elasticity and the thermal expansion coefficient along specific
directions in a given component made out of the oriented material. Interfacial mobility
and solute segregation mainly contribute to PO. In some cases textures are also developed
due to decrease in grain boundary energy, grain rotations, growth of twins, etc.[47].
1.9 Oxidation Kinetics of Superalloys
Oxidation is one of the important phenomena which plays an important role at
high temperatures. Better understanding of the oxidation kinetics of the material helps us

9
to understand the process of degradation and the chemical reactivity of the material at
high temperatures, thereby helping us to provide protective measures to keep the
component working for longer period of time and minimize the maintenance costs [48].
Oxidation kinetics of superalloys follows the parabolic law [2, 18] and is
diffusion controlled. The kinetic curves rose quickly at the beginning and then leveled off
showing no weight gain after some time. Factors that may cause the high initial oxidation
rate include micro-cracks and rough surfaces on the coatings. The stability is attained
when the dense and protective oxide layers form on the oxide scale and restrict the
diffusion of oxygen through the oxide layer to the alloy surface. However, oxidation can
still continue if the protective oxide scale is spalled away or get cracked.
It is remarkable that some of these alloys can be utilized at 0.9Tm. The basic
reason for this endurance must be attributable to the following:
• The high tolerance of Ni for alloying without phase instability owing to its nearly
filled 3d- electron shell.
• The tendency of Cr additions to form Cr2O3-rich protective scales having low
cation vacancy content, thereby restricting the diffusion rate of metallic elements
outwards and oxygen, nitrogen, sulphur, and other aggressive atmospheric
elements inward in the oxide scale layer.
• The additional tendency at high temperatures to form Al2O3-rich scales with
exceptional resistance to oxidation.
The oxidation kinetics of superalloys near their melting temperatures affects the
properties of the material. Thus, for safe operation of the components, it is necessary to
study the oxidation kinetics at such high temperatures. Oxidation kinetics, microstructural

10
changes, phases present, and oxide scale morphology in the superalloy IN738LC at lower
temperatures have been studied earlier [3].
According to the steady state scale morphology, the Ni-Cr-Al-Ti alloys were divided into
3 types [49]:
1. Alloy low in Cr and Al form no scale with Cr2O3 and Al2O3 subscale.
2. Alloys high in Cr (>15%) and low in Al (<3%) form Cr2O3 scale and Al2O3
subscale.
3. High Cr (>15%) and high Al (>3%) alloys form exclusively Al2O3 scale.
IN738LC belongs to types 2 and 3 depending on the oxidation conditions. Growth
mechanism of the oxide scales is difficult to understand. Oxidation of primary carbides in
IN738LC can lead to surface crack initiation and oxide intrusions along grain boundaries
[12]. Morphological changes of MC carbides play a very important role. The quantity and
size of primary carbides often determine the growth rate of creep or fatigue cracks in
components and affect ductility and toughness of the alloy in general.
IN738LC has relatively large blocky MC carbides of the type (Ta, Nb, Ti, W)C
which oxidize more rapidly than the other phases in the alloy system. There is a large
volume increase during oxidation. Due to the formation of oxide layer on these phases
and at carbide-oxide interface, shift of corrosion product from inside to outside takes
place. High shear stresses are present between the Cr2O3 scale and the carbide oxidation
products. These lead to scale cracking, favoring internal corrosion.
The metal matrix forms Cr2O3 protective layer while the carbides undergo
selective oxidation and form a non-protective scale at oxide-carbide interface. At the
beginning of the oxidation process the selective MC oxidation is limited to particles on
the metal surface. The same applies to the carbide particles, which are affected by the

11
oxidation front. So local cracking continues during oxidation as long as the front moves
deep into the metal matrix.
When MC particle is completely oxidized, Cr2O3 rich scale is formed beneath it
and thus rapid oxidation stops in that area. So the corresponding products or oxides are
incorporated in the scale. Internal oxidation [50] leads to the formation of Al2O3 in the
subsurface layer and this is accompanied by the internal nitridation (TiN) beneath the
Al2O3 subscale. N could not be identified unequivocally as the N-Kα line overlaps with
the first order Ti-Lγ and 2nd order Co-Lα Line. Cr2O3 is formed beneath this layer, which
has dissolved Ti in it. Beneath the scale an internal corrosion zone is formed that
contained Al2O3 + TiN further into the substrate [49].
1.10 Intensified Plasma Assisted Nitriding (IPAN) of IN738LC
Many surface modification methods are available in recent years to enhance
properties like wear, fatigue and corrosion resistance [52-60]. IPAN is a low temperature
nitriding process patented by E.I.Meletis [61] and is used for surface modification of Ti
and Ti alloys. This process enhanced the surface properties in Steels.
Liquid lubrication becomes ineffective at high temperatures and so solid
lubrication is used in the form of thin films coatings. This prevents metal-to-metal contact
and thus avoids severe wear [55]. Plasma vapor deposition and plasma assisted chemical
vapor deposition are also widely used in industrial applications [57].
1.11 Research Motivation and Objectives
Power generation companies are meeting the need of new generation capacity by
selecting natural gas-fired advanced gas turbine combined-cycle systems. These high
efficiency turbines have high inlet temperatures, requiring the use of advanced materials
and coatings which have desired properties.

12
Around the world the energy industry has to meet the demand of the increasing
competition in energy markets along with the environmental protective regulations being
imposed. To increase the efficiency at low costs with low emissions is a challenge to
power industry. Methods like raising the firing temperature and using spray-cooling
process with compressed air are being used. The latest models of gas turbines have
improved materials with coatings and advanced cooling designs to allow rotor inlet
temperatures of 1300˚C -1400˚C.
Power generation industries used Inconel alloys extensively for their excellent
mechanical properties at high temperatures. Having good strength at elevated
temperatures, creep properties and weldability proved to be good for High Temperature
Gas Cooled Reactors (HTGR) [62]. Previous studies emphasized mainly the reaction
kinetics of the process and identification of morphology of oxide scale at lower
temperature where phenomenon of oxide volatilization has been largely ignored.
Weight loss is observed during the oxidation process at temperatures starting
around 1100˚C. This can be attributed to volatile oxides formed on the metal surface at
such high temperatures. Certain oxides like Cr2O3 and oxides of Nb, Mo, W volatilize at
higher temperatures. The scales formed on the superalloy IN738LC at 1000˚C, 1090˚C,
1140˚C and 1190˚C in dry air have been investigated in the current study by scanning
electron microscopy, X-ray diffraction, EDXS and XPS.
With a view to improve reliability and performance in service and in environmental
conditions, nitriding characteristics of IN738LC were also studied in the present study.
Intensified plasma assisted nitriding process was used to modify the surface of IN738LC.
Investigation of variation of hardness, diffusion of nitrogen in the alloy, structural changes and
friction coefficient variation were carried out using different experiments.

13
The nitriding characteristics were studied using SEM, XRD, XPS, wear testing
and microhardness testing. From the XRD analysis it was determined that the nitrided
samples have preferred orientation. The wear test of the nitrided samples showed that the
friction coefficient is approximately 1.15. The microhardness tests on the 3 nitrided
samples showed that as the current density was increased the hardness value of the
surface layer increased, indicating the improvement in surface mechanical properties.

14
Chapter 2. Experimental Background and Procedures
2.1 Materials
The material used in this study was IN738LC which is a polycrystalline Ni based
superalloy with low carbon content. The material was obtained from Howmet
Corporation, Whitehall, MI in the form of rods of length 110 mm and 15 mm in diameter.
In a neutral environment, the investment cast superalloy was subjected to HIPing at
1185ºC for 2 hours to remove any micro-porosity in the alloy due to investment casting
and then cooled to room temperature by argon-backfill cooling, whose cooling rate was
the same as that of air cooling. HIPing, solution treatment and aging were carried out by
the company that supplied the material. The chemical composition of the as-received
material is given in Table 1.
Table 1 Chemical Composition of As-Received IN738LC ( wt% )
Element Ni Cr Co Mo W Ta Nb Al Ti B Zr C
Min Bal 15.7 8.00 1.5 2.4 1.5 0.6 3.2 3.2 0.007 0.03 0.09 Max Bal 16.3 9.00 2.0 2.8 2.0 1.1 3.7 3.7 0.012 0.08 0.13
2.2 Sample Preparation for Oxidation
Investment cast rods of polycrystalline, low carbon, Ni-based superalloy of
IN738LC was provided by Howmet Corporation, Whitehall, MI. The rods were 110 mm
long and 15-16 mm in diameter. They were cut into 2-3 mm thick samples using
STRUERS–ACCUTOM-5 cutter and an aluminum oxide cut-off wheel, STRUERS 456
CA. The speed and feed parameters used are given in Table 2.
A hole was drilled into the sample somewhat near the edge to suspend the sample
from an electric digital balance to the middle of a furnace. Two samples were oxidized at
each chosen temperature. For the study of microstructure, the oxidized samples were first
15
ground from 240 to 600 ASTM grit size, then were polished up to 1000 ASTM grit size
and further down to 0.05 µm. Selected mirror polished samples were etched with a
solution made up of 33% HNO3 + 33% acetic acid + 33% H2O + 1% HF, and studied in
an SEM.
Table 2 Speed and Feed Parameters for Cutting Samples
Operational Speed 3000 rpm Feed 0.01 mm/sec Force Low / Medium
Coolant STRUERS coolant
2.3 Experimental Procedure for Oxidation
With the help of a Pt wire of required length, the sample was suspended into a
box furnace from an electronic scale kept suitably above the furnace. The weight of the
sample along with that of the Pt-wire was continuously noted to study the mass change of
IN738LC due to oxidation at a specific temperature. This was repeated several times at
different elevated temperatures. After certain period of time when there was no mass
gain, i.e. when the mass of sample remained nearly constant, the sample was removed
from furnace and air cooled. This procedure was followed for the two samples each at
1000ºC, 1090ºC, 1140ºC and 1190ºC, respectively.
2.4 Sample Preparation for Microstructural Study
The cut out edges along the circumference of the thin cylindrical specimen of
samples subjected to high temperature oxidation were ground from 240 to 600 ASTM
grit size, then were polished up to 1000 ASTM grit size, and further down to 0.05 µm
using aluminum oxide suspension in water. The morphology of the oxide, metal and
metal-oxide interface was observed along the edge at the flat region of the polished
circumference of the oxidized samples, using an SEM. EDAX spectrum analysis of the

16
oxide layer was carried out to have an idea of elements present in the phases observed.
For this purpose an SEM with EDAX capability was used. The surface morphology of
the oxide on the radial plane was also examined in the same manner.
2.5 Sample Preparation for X-Ray diffraction study
The specimens oxidized at 1000ºC, 1090ºC, 1140ºC and 1190ºC were subjected to
XRD studies to identify the phases from their respective diffraction patterns. A Rigaku
X-Ray diffractometer was used for X-ray diffraction analysis .The incident CuKα X-rays
have a wavelength λ = 1.5418 Ǻ. Diffraction pattern was detected over the 2θ range
from 30° to 105°, at a scanning rate of 1°/min, for all the samples. This study helped to
identify the major oxide phases in the oxide scale, formed on the surface of the
superalloy. It was interesting to observe preferred orientation in the metal under the oxide
scale.
2.6 Sample Preparation for XPS Study
The high resolution XPS determinations were carried out on an AXIS 165
instrument which is capable of performing X-Ray photoelectron spectroscopy (XPS),
also known ESCA, XPS imaging, XPS sputter depth profile, angle-resolved XPS, Auger
electron spectroscopy (AES), scanning Auger microscopy (SAM), and AES sputter depth
profile.
XPS spectrum analysis was done on the samples oxidized at 1000ºC, 1090ºC,
1140ºC and 1190ºC. In this study the oxide layer was sputtered off for one minute at a
time. The sophisticated XPS machine was capable of picking up signals in the form of
kinetic energy corresponding to the absorption of elements in pure form or in combined
form with other elements. From the latter the prevalent compound can be identified in the

17
oxide scale. This process could identify oxide phases that were present in the samples,
but not identified in XRD analysis.
2.7 Sample Preparation for Microhardness Testing
Microhardness testing was done on the samples oxidized at 1000ºC, 1090ºC,
1140ºC and 1190ºC and air-cooled. This study helps us to see how the hardness of the
material was affected by oxidation at various high temperatures. For this purpose the
specimens were ground to 1000 grit size and polished using aluminum oxide powder up
to 1 micron size. A Knoop indenter was used to measure the microhardness with loads of
25, 50 and 100 gm.
2.8 Sample Preparation for Nitriding
The rods of IN738LC, 15-17 mm diameter, were cut into 5-6 mm thick slices
using STRUERS–ACCUTOM-5. An aluminum oxide cut-off wheel, STRUERS 456 CA
was used for this purpose. The speed and feed parameters are given in Table 2.
The cylindrical specimen was drilled half way through along the axis of the rod
and threads were machined on the hole surface to give good grip while fixing it safely to
the vacuum chamber lid. The six samples forming two sets to be nitrided were ground
from 240 to 600 ASTM grit size, polished up to 1000 ASTM grit size on grinding papers
and then were further polished down to 0.05 µm using regular polishing wheels with felt
cloth. The samples were subjected to ultrasonic cleaning in acetone to remove any grease
from the specimen surface prior to nitriding. They were kept in air to dry and then fixed
in the vacuum chamber.
18
2.9 Experimental Procedure for Nitriding
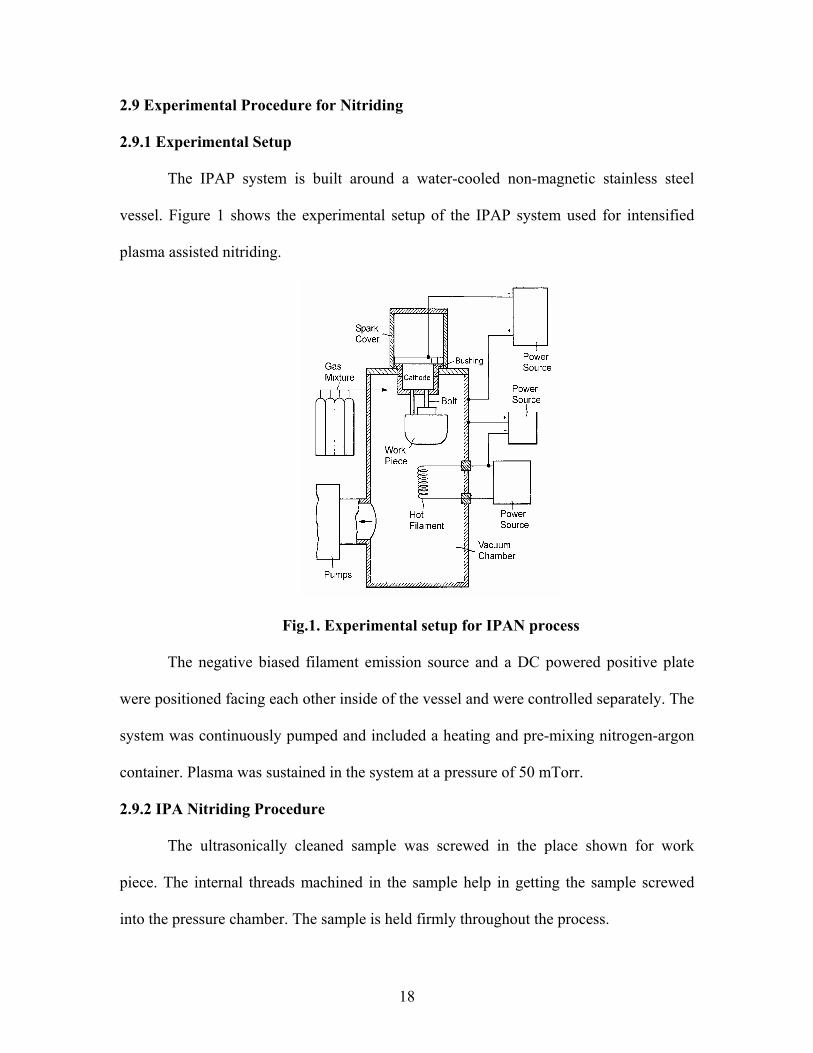
2.9.1 Experimental Setup
The IPAP system is built around a water-cooled non-magnetic stainless steel
vessel. Figure 1 shows the experimental setup of the IPAP system used for intensified
plasma assisted nitriding.
Fig.1. Experimental setup for IPAN process
The negative biased filament emission source and a DC powered positive plate
were positioned facing each other inside of the vessel and were controlled separately. The
system was continuously pumped and included a heating and pre-mixing nitrogen-argon
container. Plasma was sustained in the system at a pressure of 50 mTorr.
2.9.2 IPA Nitriding Procedure
The ultrasonically cleaned sample was screwed in the place shown for work
piece. The internal threads machined in the sample help in getting the sample screwed
into the pressure chamber. The sample is held firmly throughout the process.
19
The chamber was closed tightly and pumping was started to evacuate the
chamber. Mixture of N2 and Ar in the ratio of 4 : 1 was pumped into the vacuum chamber
when the required low pressure was reached. The sample served as cathode and was
heated with the help of the hot filament. Setting up the various parameters, the nitrogen
gas introduced was ionized and the sample was bombarded with nitrogen ions. A triode
glow discharge system was used to control the thermionic emission. This intensifies the
plasma for added effect on the work piece at a low pressure.
The IPAN was done for 3 hours after which the power supply was cut off, the
pressure was brought back to normal by introducing argon into the chamber and the
sample was allowed to cool in the chamber itself. Later, the sample was unscrewed and
removed carefully from the chamber.
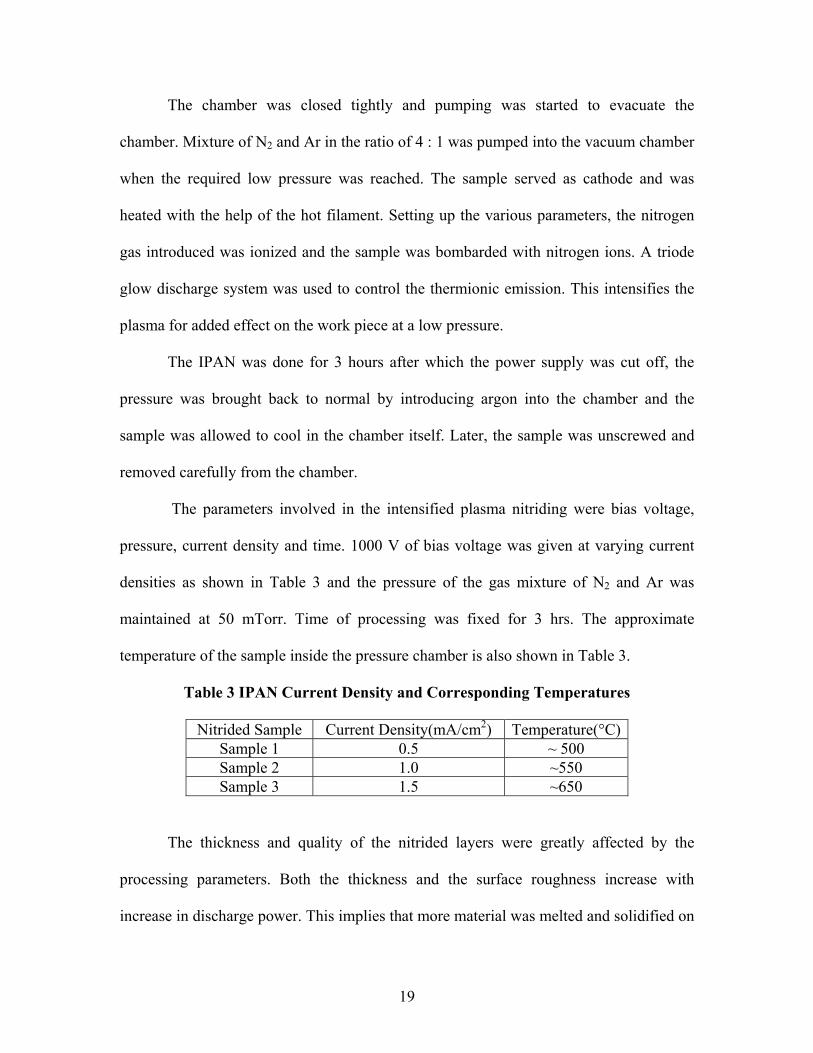
The parameters involved in the intensified plasma nitriding were bias voltage,
pressure, current density and time. 1000 V of bias voltage was given at varying current
densities as shown in Table 3 and the pressure of the gas mixture of N2 and Ar was
maintained at 50 mTorr. Time of processing was fixed for 3 hrs. The approximate
temperature of the sample inside the pressure chamber is also shown in Table 3.
Table 3 IPAN Current Density and Corresponding Temperatures
Nitrided Sample Current Density(mA/cm2) Temperature(°C) Sample 1 0.5 ~ 500 Sample 2 1.0 ~550 Sample 3 1.5 ~650
The thickness and quality of the nitrided layers were greatly affected by the
processing parameters. Both the thickness and the surface roughness increase with
increase in discharge power. This implies that more material was melted and solidified on

20
the surface. The amount of N deposited in every discharge was small and led to in a more
compact and uniform nitrided layer.
2.10 Sample Preparation for Microstructural Study
Morphological study of the nitrided samples was done using the JEOL 840A
Scanning Electron Microscope. The spectrum study of the amount of different elements
present in the samples was done by the EDS system attached to the SEM. The digital
output was collected into a Mac computer connected to the SEM for data acquisition and
analysis.
2.11 Sample Preparation for X-Ray Diffraction Study
The specimens nitrided at current densities of 0.75, 1.0 and 1.5 mA/cm2
respectively, were subjected to XRD studies to identify their respective diffraction
patterns. The Rigaku X-Ray diffractometer was used for X-ray diffraction analysis. The
incident CuKα X-rays with a wavelength λ = 1.5418Ả were used. Diffraction pattern was
recorded over the 2θ range from 30° to 105°, at a scanning rate of 1°/min, for all the six
nitrided samples.
2.12 Sample Preparation for XPS Study
AXIS 165 machine which is capable of performing X-Ray photoelectron
spectroscopy (XPS), also known as electron spectroscopy for chemical analysis (ESCA),
XPS imaging, XPS sputter depth profile, angle-resolved XPS and Auger electron
spectroscopy (AES) was used.
XPS spectrum study was done on the as-received sample and on the samples
nitrided at various current densities. The XPS machine was capable of picking up signals
in the form of kinetic energy corresponding to absorption of elements in pure form or in
21
combined form with other elements. From the latter prevalent compounds can be
identified in the nitrided samples.
2.13 Sample Preparation for Microhardness Testing
Microhardness testing also was done on the intensified plasma assisted nitrided
samples. This study helps us to see how the microhardness of the material was affected
upon nitriding with different current densities. A Knoop indenter was used to measure the
microhardness using loads of 25, 50 and 100 gm.
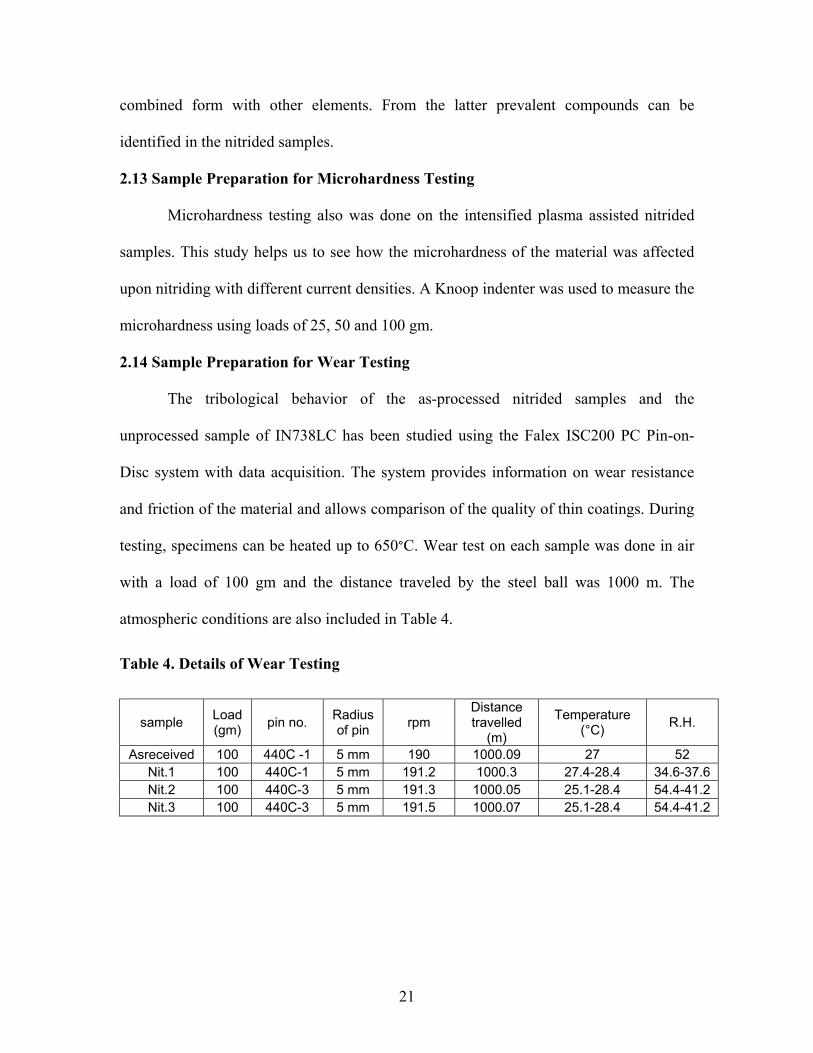
2.14 Sample Preparation for Wear Testing
The tribological behavior of the as-processed nitrided samples and the
unprocessed sample of IN738LC has been studied using the Falex ISC200 PC Pin-on-
Disc system with data acquisition. The system provides information on wear resistance
and friction of the material and allows comparison of the quality of thin coatings. During
testing, specimens can be heated up to 650°C. Wear test on each sample was done in air
with a load of 100 gm and the distance traveled by the steel ball was 1000 m. The
atmospheric conditions are also included in Table 4.
Table 4. Details of Wear Testing
sample Load (gm) pin no. Radius
of pin rpm Distance travelled
(m)
Temperature (°C) R.H.
Asreceived 100 440C -1 5 mm 190 1000.09 27 52 Nit.1 100 440C-1 5 mm 191.2 1000.3 27.4-28.4 34.6-37.6 Nit.2 100 440C-3 5 mm 191.3 1000.05 25.1-28.4 54.4-41.2 Nit.3 100 440C-3 5 mm 191.5 1000.07 25.1-28.4 54.4-41.2

22
Chapter 3. Results and Discussion - Oxidation of IN738LC 3.1 Oxidation Kinetics 3.1.1 Oxidation at 1000°C
The sample was loaded in the furnace at 1000°C and the weight gain as a function
of time was observed. The sample at 1000°C showed sharp increase in weight and then it
became stable. There was a weight gain of 11 mg/cm2. The process was again repeated
with a second sample and similar results were found. The sample heated for 285 hours
approximately showed that there was no weight gain after certain period of time.
Therefore the second sample was just tested until the sample stabilized, i.e. for 225 hours
of isothermal oxidation. The slope of the oxidation curve in Fig. 2 for IN738LC at
1000°C indicated high oxygen diffusion into the alloy. Table 5 gives the data for the plot
of the oxidation curve.
0.0
5.0
10.0
15.0
0 50 100 150 200 250 300
Fig.2. Oxidation kinetics of IN738LC at 1000°C & 1090°C
Time ( hr )
Mas
s gai
n (m
g/cm
2 )
1000ºC
1090ºC
23
-2
-1
0
1
2
3
0 2 4 6 8 10 12 14 16 18 20 22 24 26 28 30
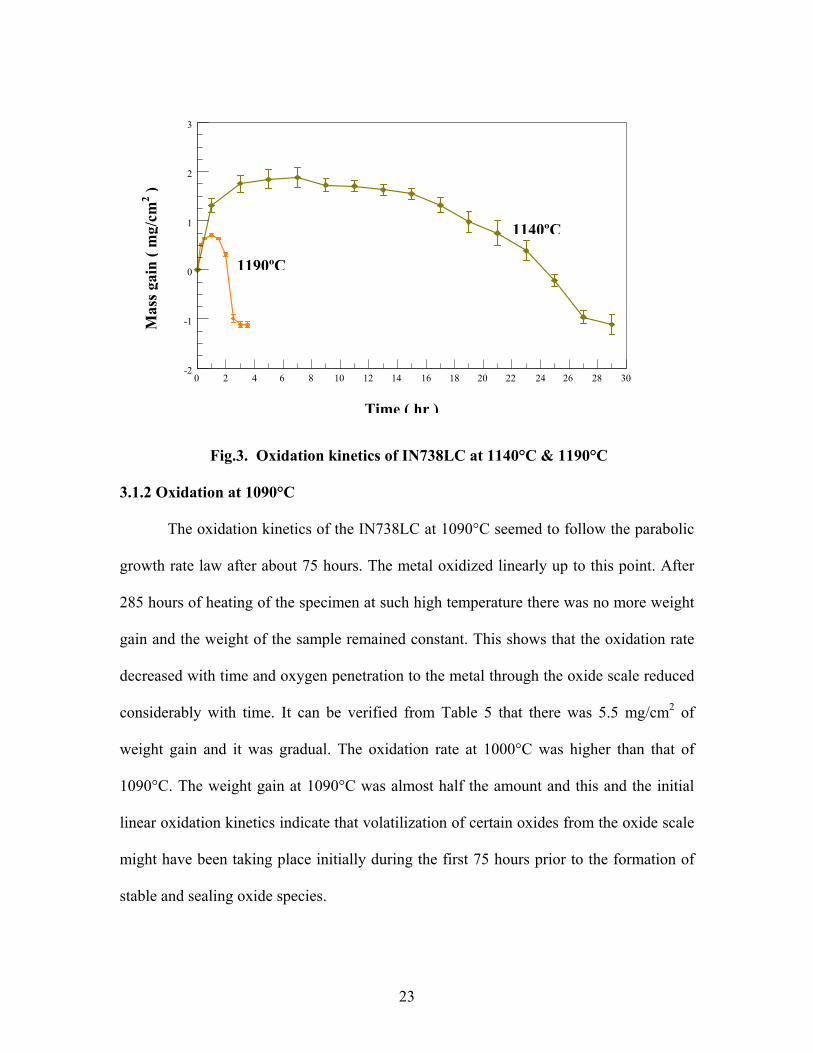
Fig.3. Oxidation kinetics of IN738LC at 1140°C & 1190°C
3.1.2 Oxidation at 1090°C
The oxidation kinetics of the IN738LC at 1090°C seemed to follow the parabolic
growth rate law after about 75 hours. The metal oxidized linearly up to this point. After
285 hours of heating of the specimen at such high temperature there was no more weight
gain and the weight of the sample remained constant. This shows that the oxidation rate
decreased with time and oxygen penetration to the metal through the oxide scale reduced
considerably with time. It can be verified from Table 5 that there was 5.5 mg/cm2 of
weight gain and it was gradual. The oxidation rate at 1000°C was higher than that of
1090°C. The weight gain at 1090°C was almost half the amount and this and the initial
linear oxidation kinetics indicate that volatilization of certain oxides from the oxide scale
might have been taking place initially during the first 75 hours prior to the formation of
stable and sealing oxide species.
Mas
s gai
n ( m
g/cm
2 )
Time ( hr )
1140ºC
1190ºC

24
3.1.3 Oxidation at 1140°C
The oxidation of IN738LC at 1140°C seems to follow the parabolic growth rate
mechanism initially till about 6 hours, beyond which weight loss was observed after
gaining a maximum weight of about 2 mg/cm2. Oxidation at 1140°C was much faster and
so the maximum weight gain took place within 5 hours and at 24 hours the weight gain
dropped to zero. The weight loss in the oxidation process continued until 29 hours after
which it seemed to stabilize. At this stage the metal was perhaps losing as much oxide by
evaporation as it formed. It is suggested that Cr2O3 formed in the scale changes to CrO2
and then to CrO3. In CrO3, Cr is in hexavalent state which leads to high vapor pressure
and the oxide phase evaporates leading to weight loss. The oxides of W, Ta and Mo may
be evaporating too, if formed. On the contrary, oxides of Ni, Co and Al are not volatile at
high temperatures. Volatilization destroys or modifies the protective nature of the oxide
scales. It increases with temperature and gas rate flow. Thus its detrimental effects
become more important in advanced high temperature, high flow and air breathing
propulsion systems. Tables 5 and 6 give more insight into the kinetics.
3.1.4 Oxidation at 1190°C
IN738LC oxidized at 1190°C in dry air was at a much faster rate than at 1140°C
following the parabolic growth law initially during the first hour. Thereafter it lost weight
at an equally fast rate in the next 1.5 hours. All the changes during oxidation were
observed during the first three hours. There was a weight gain of 0.6 mg/cm2 in the first
hour and then there was a drop in the weight to about 1 mg/cm2 as shown in Tables 5 and
6. Slightly after 2.5 hours of oxidation the sample reached its initial weight and after 3.5
hours of oxidation the sample had lost weight by about 1 mg/cm2 and the weight of

25
sample stayed constant indicating stabilization of the oxidation and volatilization process.
The Cr2O3 might have changed to CrO3 at a faster rate at this high temperature of 1190°C.
Volatilization of other oxides of Ta, Nb, W and Mo might have taken place along with
Cr2O3. Volatilization removes the protective layer of Cr2O3, thus allowing more oxygen
to diffuse to the metal through the oxide layer. The oxidation may have been restricted by
the thick protective oxide layer of Al2O3 (as found from SEM analysis) which does not
volatilize at high temperatures from the oxide scales. Tables 5 and 6 give more details of
the weight gain/loss at 1190°C.
Table 5 Mass Gain and Loss Observed as a Function of Time at Various Temperatures
1000ºC 1090ºC 1140ºC 1190ºC
Time (hr)
Mass gain
(mg/cm2)
Time (hr)
Mass gain
(mg/cm2)
Time(hr)
Mass gain or loss
(mg/cm2)
Time(hr)
Mass gain or loss
(mg/cm2) 0 0 0 0 0 0 0 0
25 8.70 20 1.04 1 1.31 0.25 0.51 50 9.14 50 2.38 3 1.75 0.5 0.63 75 9.97 75 4.91 5 1.84 1 0.70 100 10.19 100 4.97 7 1.88 1.5 0.63 125 10.54 125 5.18 9 1.72 2 0.32 150 10.79 150 5.66 11 1.70 2.5 -0.99 175 10.74 175 5.81 13 1.62 3 -1.12 200 11.57 200 5.96 15 1.54 3.5 -1.12 225 11.65 225 6.40 17 1.31 - -
- - 250 6.40 19 0.97 - - - - 275 6.40 21 0.74 - - - - - 23 0.39 - - - - - - 25 -0.22 - - - - - - 27 -0.96 - - - - - - 29 -1.10 - -
Table 6 Analysis of Oxidation of IN738LC at Various Temperatures
Temperature Time for stabilization of the
process (hr) Mass gain / mass lost
(mg/cm2) 1000ºC 225 11.7 1090ºC 275 6.4 1140ºC 29 -1.11 1190ºC 3.5 -1.12
26
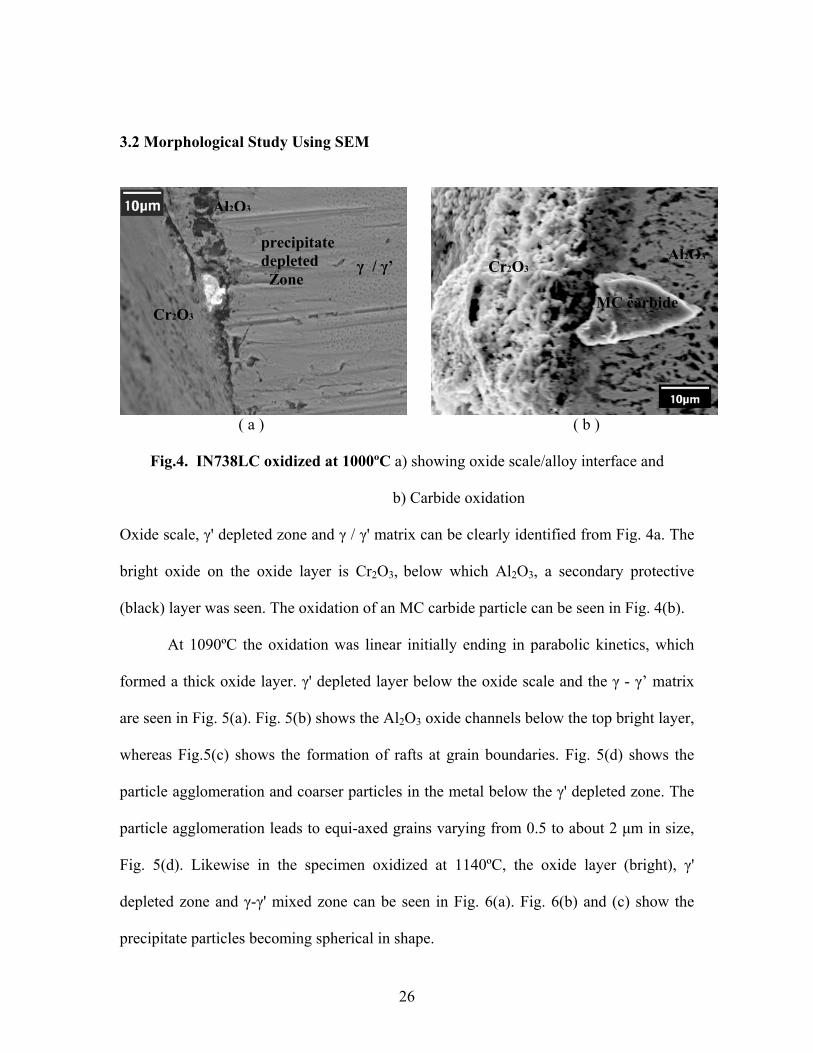
3.2 Morphological Study Using SEM
( a )
( b )
Fig.4. IN738LC oxidized at 1000ºC a) showing oxide scale/alloy interface and
b) Carbide oxidation
Oxide scale, γ' depleted zone and γ / γ' matrix can be clearly identified from Fig. 4a. The
bright oxide on the oxide layer is Cr2O3, below which Al2O3, a secondary protective
(black) layer was seen. The oxidation of an MC carbide particle can be seen in Fig. 4(b).
At 1090ºC the oxidation was linear initially ending in parabolic kinetics, which
formed a thick oxide layer. γ' depleted layer below the oxide scale and the γ - γ’ matrix
are seen in Fig. 5(a). Fig. 5(b) shows the Al2O3 oxide channels below the top bright layer,
whereas Fig.5(c) shows the formation of rafts at grain boundaries. Fig. 5(d) shows the
particle agglomeration and coarser particles in the metal below the γ' depleted zone. The
particle agglomeration leads to equi-axed grains varying from 0.5 to about 2 µm in size,
Fig. 5(d). Likewise in the specimen oxidized at 1140ºC, the oxide layer (bright), γ'
depleted zone and γ-γ' mixed zone can be seen in Fig. 6(a). Fig. 6(b) and (c) show the
precipitate particles becoming spherical in shape.
Cr2O3
Al2O3
precipitate depleted Zone
γ / γ’ Al2O3
Cr2O3
MC carbide

27
( a )
( c )
( b )
( d )
Fig.5. IN738LC oxidized at 1090ºC:
a) Metal-oxide interface b) Al2O3 oxide layer c) Growth of γ' d) coalescence of γ'
The remaining figures show the dissolution of the precipitates. Figures 6 d and e indicate
the formation of oxide channels in what appear to be sub grain boundaries. Preferential
internal oxidation seems to be occurring along the normal grain boundaries in the γ
matrix, Fig. 6(f-h).
Cr2O3
Al2O3
γ ‘ / γ γ‘ depleted zone
Al2O3
Particle coalescence
Rafts
Al2O3 Channel
28
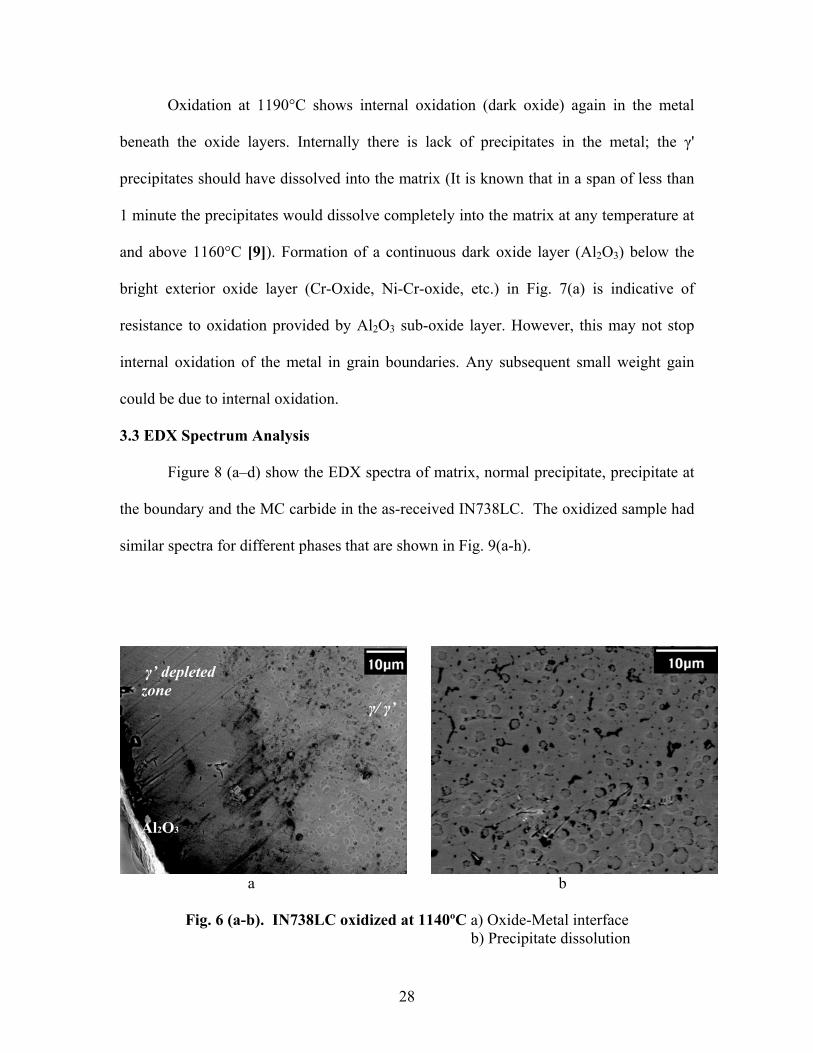
Oxidation at 1190°C shows internal oxidation (dark oxide) again in the metal
beneath the oxide layers. Internally there is lack of precipitates in the metal; the γ'
precipitates should have dissolved into the matrix (It is known that in a span of less than
1 minute the precipitates would dissolve completely into the matrix at any temperature at
and above 1160°C [9]). Formation of a continuous dark oxide layer (Al2O3) below the
bright exterior oxide layer (Cr-Oxide, Ni-Cr-oxide, etc.) in Fig. 7(a) is indicative of
resistance to oxidation provided by Al2O3 sub-oxide layer. However, this may not stop
internal oxidation of the metal in grain boundaries. Any subsequent small weight gain
could be due to internal oxidation.
3.3 EDX Spectrum Analysis
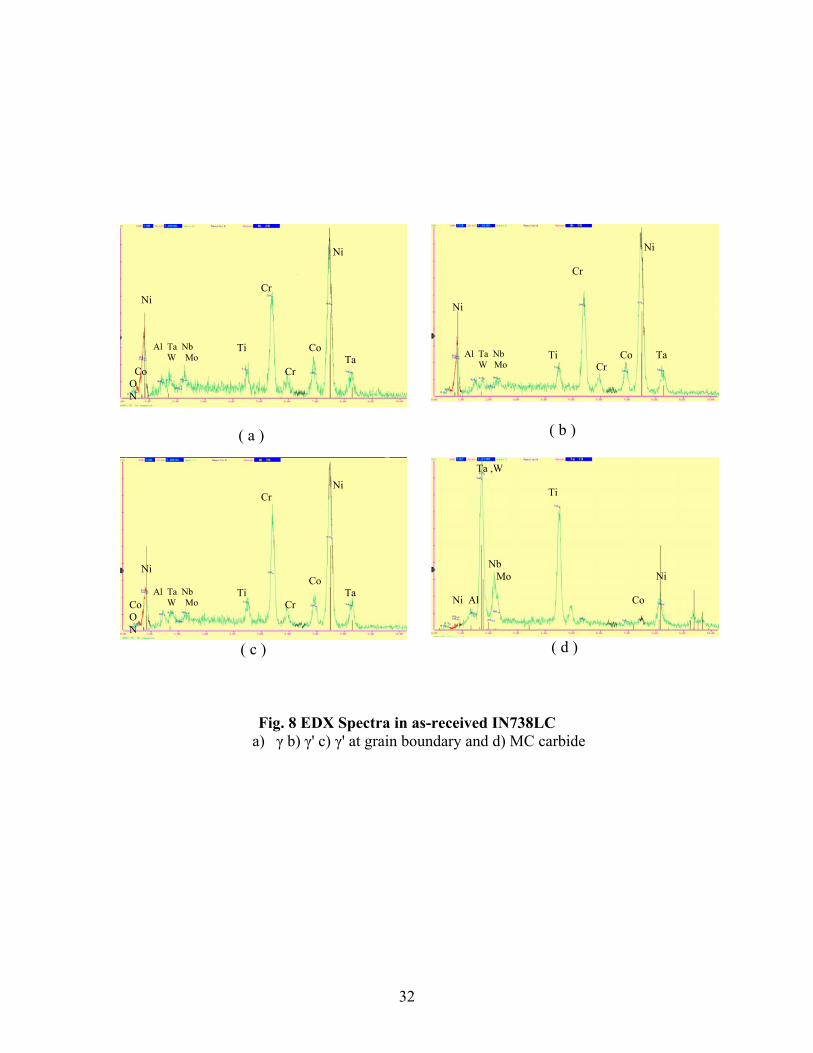
Figure 8 (a–d) show the EDX spectra of matrix, normal precipitate, precipitate at
the boundary and the MC carbide in the as-received IN738LC. The oxidized sample had
similar spectra for different phases that are shown in Fig. 9(a-h).
a b
Fig. 6 (a-b). IN738LC oxidized at 1140ºC a) Oxide-Metal interface b) Precipitate dissolution
Al2O3
γ/ γ’
γ’ depleted zone

29
c
e
g
d
f
h
Fig. 6 (c-g) IN738LC oxidized at 1140ºC c) spheroidal γ' particles d) solute migrating to channels, possibly (sub) grain boundaries e) interconnected oxide channels f ) dissolution of γ' after solute is removed g, h) oxidation along grain boundaries

30
( a )
( c )
( b )
( d )
Fig.7. IN738LC oxidized at 1190ºC a) Metal-oxide interface b) Matrix without γ' c) Matrix with internal oxides d) Solute segregation at parent matrix grain boundary leading to oxidation
The outermost layer indicates the presence of Al, Cr, Ni, Ti, and traces of Nb,
Mo, W are present. Traces of Co are also present. Cr was more here than the inside layer,
Fig.9 (g) indicating Cr2O3 phase. Just below the outermost level the Cr content slightly
decreased.
31
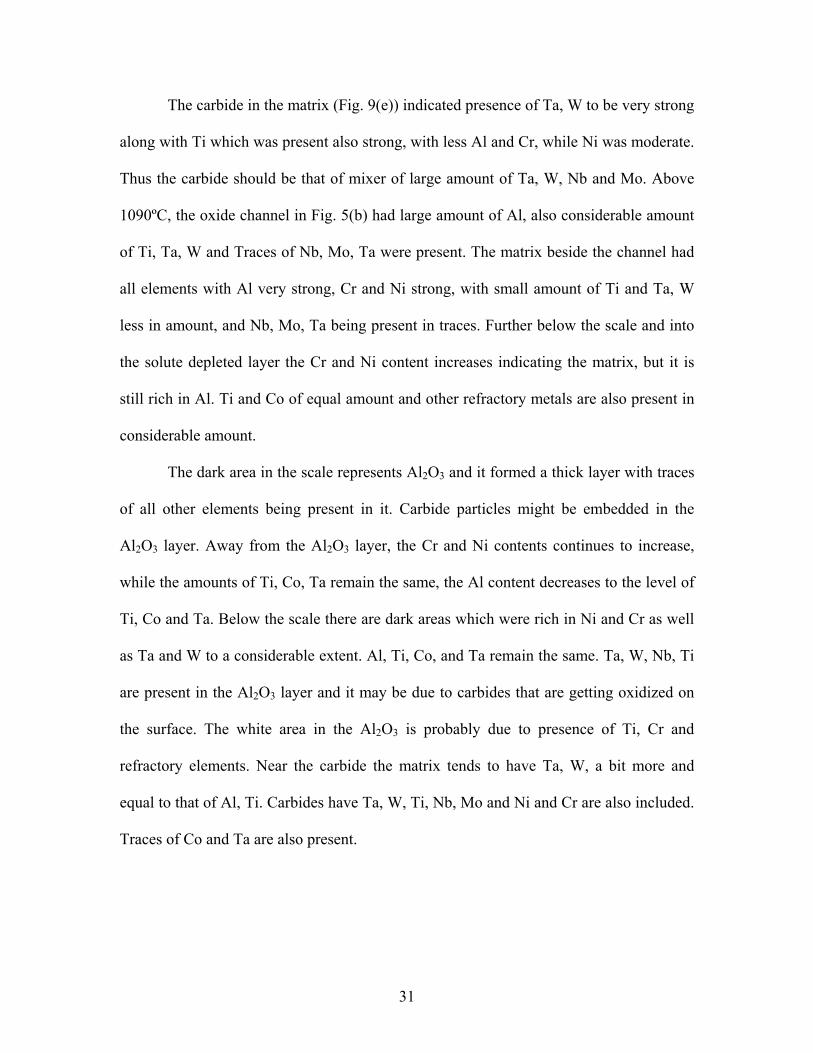
The carbide in the matrix (Fig. 9(e)) indicated presence of Ta, W to be very strong
along with Ti which was present also strong, with less Al and Cr, while Ni was moderate.
Thus the carbide should be that of mixer of large amount of Ta, W, Nb and Mo. Above
1090ºC, the oxide channel in Fig. 5(b) had large amount of Al, also considerable amount
of Ti, Ta, W and Traces of Nb, Mo, Ta were present. The matrix beside the channel had
all elements with Al very strong, Cr and Ni strong, with small amount of Ti and Ta, W
less in amount, and Nb, Mo, Ta being present in traces. Further below the scale and into
the solute depleted layer the Cr and Ni content increases indicating the matrix, but it is
still rich in Al. Ti and Co of equal amount and other refractory metals are also present in
considerable amount.
The dark area in the scale represents Al2O3 and it formed a thick layer with traces
of all other elements being present in it. Carbide particles might be embedded in the
Al2O3 layer. Away from the Al2O3 layer, the Cr and Ni contents continues to increase,
while the amounts of Ti, Co, Ta remain the same, the Al content decreases to the level of
Ti, Co and Ta. Below the scale there are dark areas which were rich in Ni and Cr as well
as Ta and W to a considerable extent. Al, Ti, Co, and Ta remain the same. Ta, W, Nb, Ti
are present in the Al2O3 layer and it may be due to carbides that are getting oxidized on
the surface. The white area in the Al2O3 is probably due to presence of Ti, Cr and
refractory elements. Near the carbide the matrix tends to have Ta, W, a bit more and
equal to that of Al, Ti. Carbides have Ta, W, Ti, Nb, Mo and Ni and Cr are also included.
Traces of Co and Ta are also present.
32
( a )
( b )
( c )
( d )
Fig. 8 EDX Spectra in as-received IN738LC a) γ b) γ' c) γ' at grain boundary and d) MC carbide
Ni
Co O N
Ni
Cr
Co Ta
Ti Al Ta Nb W Mo
Cr
Ni
Ti
Ni
Co Cr
Cr
Ta Al Ta Nb W Mo
Cr Ni
Co
Cr Al Ta Nb W Mo
Ni
Co O N
Ti Ta Co
Ni
Ti
Ta ,W
Nb Mo
Ni Al

33
( a )
( c )
( e )
( g )
( b )
( d )
( f )
( h )
Fig. 9 EDX Spectra of oxidized samples a) γ b) γ' precipitates c) γ beside carbide particle d) oxide layer of Al2O3 e) MCx carbide f) Dark area beneath Al2O3 g) outermost oxide layer h) under the outermost oxide layer
Ni
Co O N
Ni
Cr
Co Ta
Ti Al Ta Nb W Mo
Cr
Al Ta Nb W Mo
Ni
Co O N
Cr
Cr
Ni
Ti
Ni
Co Cr
Ta Ni Ti
Al
O Ta Nb W Mo
Ni
Ni
Cr
Cr
Co
Ti
Al Ta
Ta Nb W Mo
O
Ni
Ni
Nb Mo
Ti Ta
Co
Cr
Cr Al
Ta W
O
Ni Ni
Ti
Cr
Al
Nb Mo
Ta W O Ni
Ni Ti Cr
Al
O Ta Nb W Mo
Al Ta Nb W Mo
Ni
Ni
Co O N
Ti Co
Cr
Ta
Cr
34
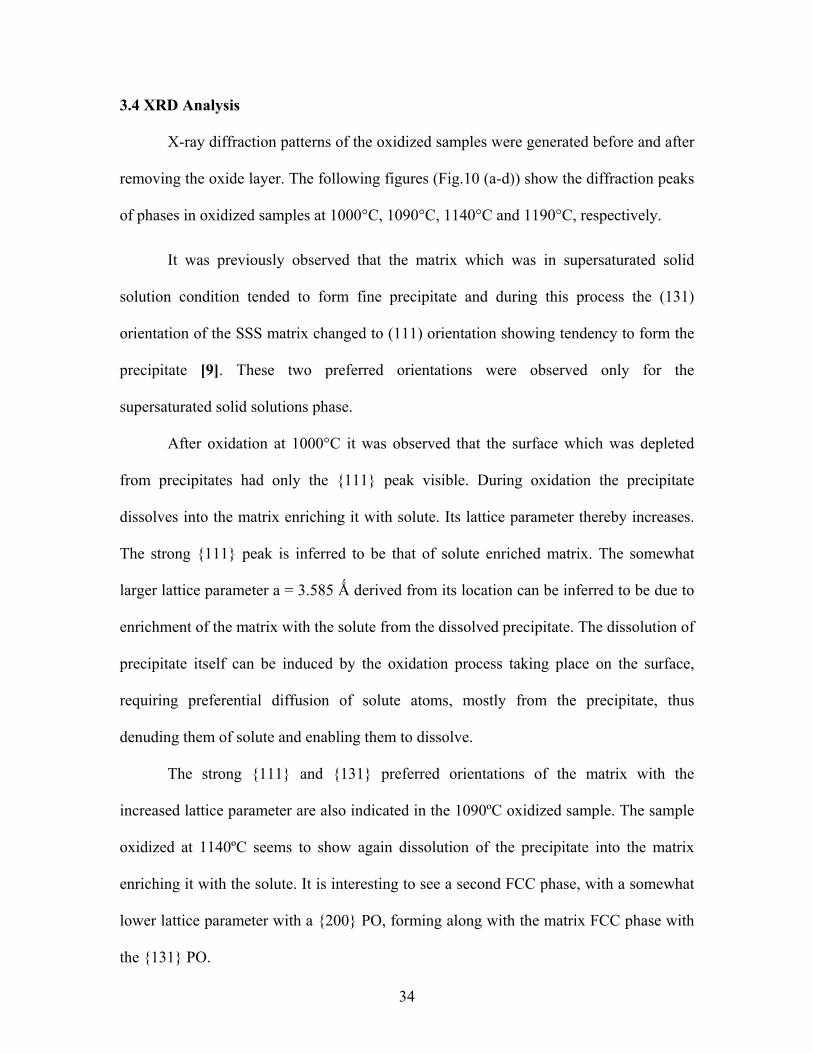
3.4 XRD Analysis
X-ray diffraction patterns of the oxidized samples were generated before and after
removing the oxide layer. The following figures (Fig.10 (a-d)) show the diffraction peaks
of phases in oxidized samples at 1000°C, 1090°C, 1140°C and 1190°C, respectively.
It was previously observed that the matrix which was in supersaturated solid
solution condition tended to form fine precipitate and during this process the (131)
orientation of the SSS matrix changed to (111) orientation showing tendency to form the
precipitate [9]. These two preferred orientations were observed only for the
supersaturated solid solutions phase.
After oxidation at 1000°C it was observed that the surface which was depleted
from precipitates had only the {111} peak visible. During oxidation the precipitate
dissolves into the matrix enriching it with solute. Its lattice parameter thereby increases.
The strong {111} peak is inferred to be that of solute enriched matrix. The somewhat
larger lattice parameter a = 3.585 Ǻ derived from its location can be inferred to be due to
enrichment of the matrix with the solute from the dissolved precipitate. The dissolution of
precipitate itself can be induced by the oxidation process taking place on the surface,
requiring preferential diffusion of solute atoms, mostly from the precipitate, thus
denuding them of solute and enabling them to dissolve.
The strong {111} and {131} preferred orientations of the matrix with the
increased lattice parameter are also indicated in the 1090ºC oxidized sample. The sample
oxidized at 1140ºC seems to show again dissolution of the precipitate into the matrix
enriching it with the solute. It is interesting to see a second FCC phase, with a somewhat
lower lattice parameter with a {200} PO, forming along with the matrix FCC phase with
the {131} PO.

35
1000'C
-20
180
380
580
780
980
1180
1380
1580
1780
1980
30 35 40 45 50 55 60 65 70 75 80 85 90 95 100 105
2Theta
Inte
nsity
(cps
)
{131}
NiC
r2O4
NiC
r2O4 / C
r2O3
TiO2
{111}
Cr2O
3TiO
2 / N
iCr2O
4C
r2O3
{222}
Al2O
3
Al2O
3
( a )
1090'C
0
500
1000
1500
2000
2500
30 35 40 45 50 55 60 65 70 75 80 85 90 95 100 105
Inte
nsity
(cps
)
{131}
Co3O
4 / CoA
l2O4 / C
o2NiO
4
Co2N
iO4
Al2O
3
{111}M1C
o3O4 / C
oAl2O
4 / Co2N
iO4
Co3O
4/CoA
l2O4
Al2O
3
{222}{111}M2
{220}
2Ө ( ° ) ( b )
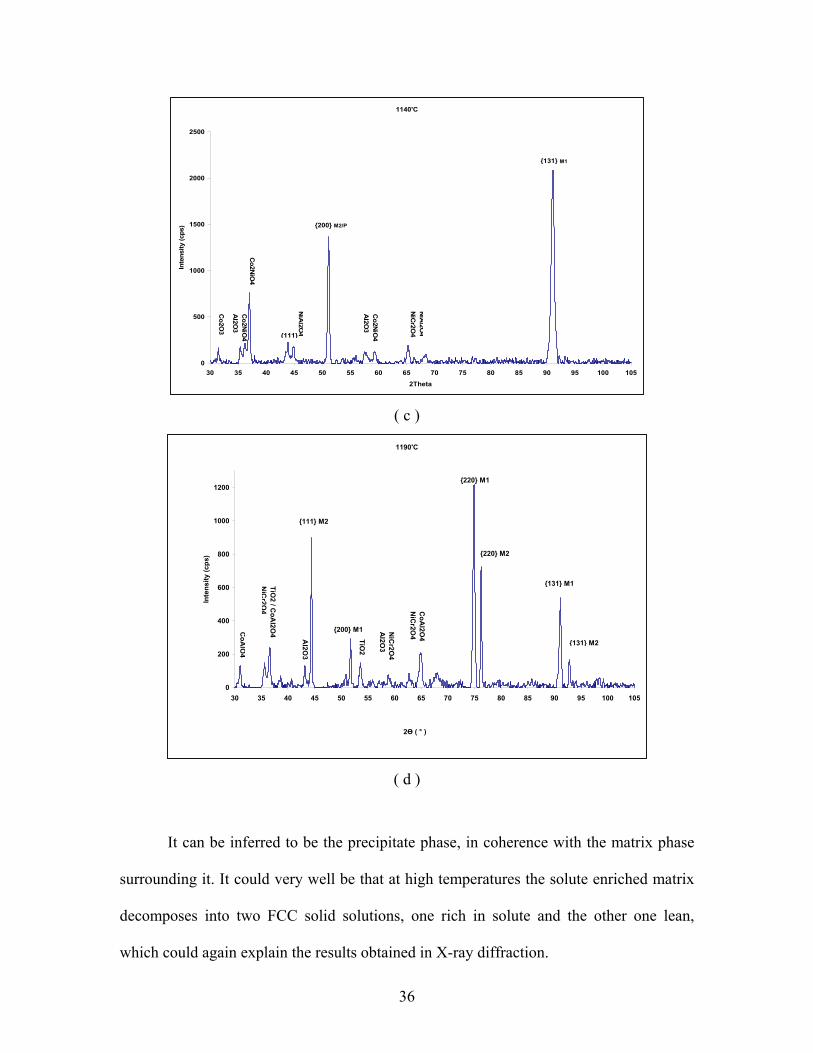
Fig. 10 XRD patterns of oxidized samples
a) 1000°C b ) 1090°C c ) 1140°C and d) 1190°C
(Fig. Cont.)
36
1140'C
0
500
1000
1500
2000
2500
30 35 40 45 50 55 60 65 70 75 80 85 90 95 100 105
2Theta
Inte
nsity
(cps
)
{131} M1
{200} M2/P
{111}
Co2N
iO4
NiA
l2O4
Co2N
iO4
Al2O
3
Co2O
3
NiA
l2O4
NiC
r2O4
Co2N
iO4
Al2O
3
( c )
1190'C
0
200
400
600
800
1000
1200
30 35 40 45 50 55 60 65 70 75 80 85 90 95 100 105
Inte
nsity
(cps
)
CoA
l2O4
NiC
r2O4
{220} M1
{200} M1 NiC
r2O4
Al2O
3
{131} M1
{220} M2
{111} M2
Al2O
3
TiO2 / C
oAl2O
4N
iCr2O
4
CoA
lO4
TiO2
{131} M2
2Ө ( ° )
( d )
It can be inferred to be the precipitate phase, in coherence with the matrix phase
surrounding it. It could very well be that at high temperatures the solute enriched matrix
decomposes into two FCC solid solutions, one rich in solute and the other one lean,
which could again explain the results obtained in X-ray diffraction.

37
On the contrary, XRD data from the sample oxidized at 1190ºC seems to show an
FCC phase with a larger lattice parameter having a {220} and {131} strong preferred
orientation along with another FCC phase of reduced lattice parameter with strong {111}
and {220} preferred orientation. These can be inferred to be the two solid solution phases
formed, again by the splitting of the matrix as at 1140ºC.
Table 7 Results of XRD analysis after oxidation of IN738LC at different temperatures
Oxidation Temperature ºC Phases Identified Remarks
1000°C FCC (a = 3.585Ǻ) {111} very strong + NiCr2O4,TiO2 ,Cr2O3
Very strong {111} preferred orientation
1090°C FCC(a = 3.585Ǻ) {111}m very strong and {131}m strong + Co2NiO4 ,CoAl2O4, Co3O4 and Al2O3
Indicates very strong preferred orientation of matrix
1140°C
FCCI(a=3.580Ǻ) {131}m1 very strong along with FCCII (a=3.565Ǻ) {200}m2 strong + strong NiCo2O4, NiAl2O4, NiCr2O4, Co2O3 (trace) , Al2O3
Indicates {131} preferred orientation of matrix and {200} preferred orientation of another solid solution phase.
1190°C
FCC (a = 3.58Ǻ) {220}m1 very strong and {131}m1 strong + FCCII (a=3.53Ǻ) strong {111}m2 and {220}m2 orientations + TiO2 (moderation), NiCr2O4 , CoAl2O4 and Al2O3.
FCCI indicates strong preferred orientation of the matrix with {220} orientation FCC II: (seems to show preferred orientation {111} of the matrix along with {220} preferred orientation weak {200} and {131} are still present.
Prior X-Ray work on vacuum annealed samples of IN738LC had established the
preference of {131} and {111} preferred orientations by the matrix and the {220} and
{200} preferred orientations by γ’ precipitate, the former by fine ones and latter by the
coarse ones. The formation of {200} preferred orientation at 1140ºC cannot be reconciled
as due to the formation of coarse precipitate, since no precipitate was observed in the
metal below the outer oxide scale. Similarly two FCC phases are observed at 1190ºC.

38
Thus a miscibility gap type decomposition of the matrix phase into two solid solution
phases is inferred from the XRD results.
The results also indicate formation of Cr2O3 and NiCr2O4 at 1000ºC, whereas
Co3O4, Co2NiO4, CoAl2O4 were formed at 1090ºC. The latter ones along with NiAl2O4
seem to form also at 1140ºC, whereas TiO2 was found abundantly at 1190ºC, with traces
of CoAl2O4 and Al2O3. Lack of strong presence of Cr2O3 and NiCr2O4 in samples
oxidized at higher temperatures 1090ºC - 1190ºC can be correlated to the loss of Cr2O3
from the oxide layer through evaporation.
3.5 XPS Analysis • Spectrum of oxide layer formed at 1000ºC (Fig.11(a))
At 1000ºC the oxides present in the scale are shown in Fig.11(a). Ni was observed
in both elemental state and in the form of NiO, Ni2O3, Ni(NO3)2 and NiAl2O4. Since Ni
was about 56% by atomic fraction, it formed all of the above basic oxides easily. Co
oxides like Co3O4, Co2O3, CoCr2O3, CoAl2O4 were also observed in the scale. Cr2O3,
clearly indicted in the XRD patterns, was also the oxide of Cr observed in the scale. Ti in
the alloy got oxidized and was found as TiO2 (rutile), which was also indicted in XRD.
Certain nitrides and carbides like WN, BN, TiC, WC were found. Ta forms Ta2O5 oxide.
Mo forms traces of different oxides like MoO2, MoO3 and CoMoO4. Traces of Al2O3
were observed.
• Spectrum of oxide layer formed at 1090ºC (Fig.11(b))
Co was present in the form of oxides like Co3O4/CoAl2O4, which were observed
in the XRD pattern also. Here the amounts of Cr2O3 and Al2O3 were about as much as at
1000ºC, and Ni oxides, especially NiAl2O4, were the basic oxides present. TiC and WC
appeared to have increased when the oxidation temperature was increased. No nitrides

39
were deducted. Mo formed its oxides as well as the possible combined oxides with CoO
and Al2O3.
• Spectrum of oxide layer formed at 1140ºC (Fig.11(c))
Most of the Ni, Co, Al and Cr oxides were found. Al2O3 was also present.
Detection of CrO2 along with Cr2O3 indicates that Cr2O3 was converted to CrO2, en-route
to volatile CrO3. Cr2O3 oxide present in the oxide layer was more compared to that at
1000ºC and 1090ºC, indicating formation of more Cr-oxide at this temperature.
• Spectrum of oxide layer formed at 1190ºC (Fig.11(d))
Presence of CrO2 was observed and most of the Cr2O3 seemed to have converted
to higher oxide through this intermediate phase. The smaller amounts of Cr-oxides
detected indicates that much of them have evaporated. Al2O3 generally forms the basic
protective layer, though its combined oxides with NiO, MoO4 and WO4 found at this
temperature as well as at 1140ºC. The nitrides of Ti and Cr seemed to have formed. Nb
and Ta continued to form oxides as temperature increased. CoAl2O4 and NiCr2O4 were
found to be the main constituents of the oxide scale along with Al2O3 and TiO2.
3.6 Microhardness Results
Effect of oxidation of IN738LC at temperatures 1000°C, 1090°C, 1140°C and
1190°C on hardness of the precipitate depleted alloy was studied using the knoop
indenter. Knoop microhardness testing was done at different loads of 25, 50 and 100 gm
on the oxidized samples which were polished to 0.5 micron finish after oxidation. The
results are shown in Figure 12.

40
Fig. 11 XPS spectra of IN738LC oxidized at various temperatures a ) 1000ºC and b ) 1090ºC c )1140ºC and d )1190ºC
spectra from the top surface of oxidized specimen after sputtering time of 1) 1min. and 2) 4 min. respectively.
(Fig. Cond.)
Kinetic Energy ( eV ) ( a )
Kinetic Energy ( eV ) ( b )
21
2 1

41
Kinetic Energy ( eV ) ( c )
Kinetic Energy ( eV ) ( d )
2 1
2 1

42
It was observed that even after oxidation at such high temperatures the hardness
of the superalloy was mostly undisturbed and was even slightly better than in the as-
received condition. This may be due to the possible formation of some nitrides.
0
100
200
300
400
500
600
700
Unprocess 1000'C 1090'C 1140'C 1190'C
25gm 50gm 100gm
Har
dnes
s(kn
oop)
Fig. 12. Microhardness data of IN738LC for the as-received and oxidized samples

43
Chapter 4. Results and Discussion - IPAN of IN738LC 4.1 XRD Analysis
XRD patterns of the three nitrided samples are reproduced in Fig. 13(a, b, c). FCC
phases with strong preferred orientations are detected in the nitrided samples produced
with different, increasing current densities as given in Table 3. The nitrided sample 1
shows that fine precipitates having a = 3.5924 Ǻ and preferred orientations of {220} were
probably formed in solute-rich matrix having a = 3.919 Ǻ and {131} preferred orientation
(in line with the results of Dr.Balikci [9, 51]). The nitrided sample 2 shows only the fine
precipitate and both the matrix and the γ' precipitate have {220} orientation. The nitrided
sample 3 showed the {200} PO which probably implies that the precipitates grew and
became coarser due the higher current density.
Nitrided Sample 1
0
100
200
300
30 35 40 45 50 55 60 65 70 75 80 85 90 95 100 105
Inte
nsity
(cps
)
{220}P {131}M
2Ө ( ° )
(a) Fig. 13. XRD patterns (a, b, c) showing Preferred Orientation in IPAN samples
(Fig. Cond.)

44
Nitrided Sample 2
0
500
1000
1500
2000
2500
3000
30 35 40 45 50 55 60 65 70 75 80 85 90 95 100 105
Inte
nsity
(cps
)
{220}P/M
2Ө ( ° )
( b )
( c )
Nitrided Sample 3
0
100
200
300
400
500
600
700
30 35 40 45 50 55 60 65 70 75 80 85 90 95 100 105
Inte
nsity
(cps
)
{200}P/M
{111}M
2Ө ( ° )

45
4.2 Morphological Study Using SEM
The N ions hit the sample on the alloy surface wherein the precipitates were at a
temperature of at least 500ºC during the nitriding process. When hit by high velocity
nitrogen ions, the precipitates seem to dissolve partially, Fig. 15(b), in the matrix forming
fine cooling precipitates, Fig. 14(d).
( a )
( c )
( b )
( d )
Fig. 14. (a-d) Morphology of intensified plasma assisted nitrided sample 1 a) Nitrided surface with γ' b) smoothening of γ' c) breaking of cuboidal γ' d) fine cooling
γ' formed along with breaking of cuboidal γ'
46
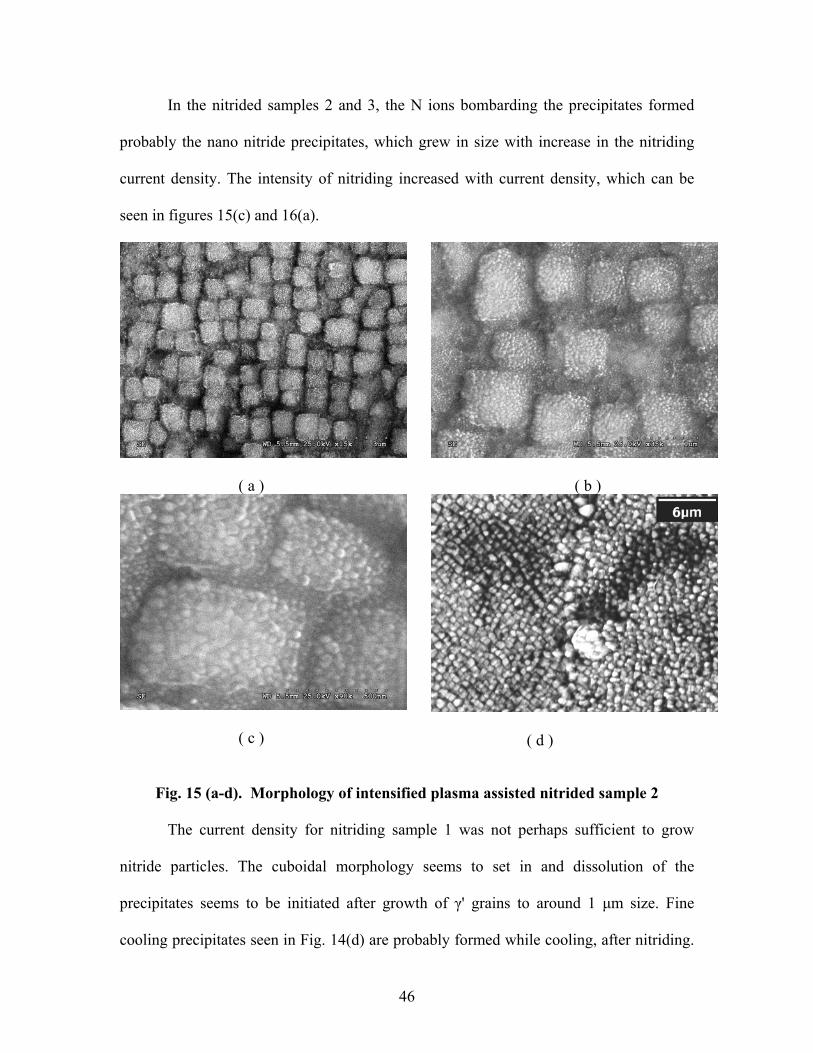
In the nitrided samples 2 and 3, the N ions bombarding the precipitates formed
probably the nano nitride precipitates, which grew in size with increase in the nitriding
current density. The intensity of nitriding increased with current density, which can be
seen in figures 15(c) and 16(a).
( a )
( c )
( b )
( d )
Fig. 15 (a-d). Morphology of intensified plasma assisted nitrided sample 2
The current density for nitriding sample 1 was not perhaps sufficient to grow
nitride particles. The cuboidal morphology seems to set in and dissolution of the
precipitates seems to be initiated after growth of γ' grains to around 1 µm size. Fine
cooling precipitates seen in Fig. 14(d) are probably formed while cooling, after nitriding.

47
The nitrided sample 2 shows fine nano precipitates formed on the precipitates, Fig. 15(b,
c). These nano precipitates formed on the precipitates of γ' are postulated to be the
nucleated nitride particles.
The nitride precipitates apparently grow in size to occupy the entire volume of the
original γ' precipitate, Fig. 17 (a, b). Thus, a thick nitrided layer with lots of nitride
precipitates resulted. Eventually the surface became rough and TiN and TiO2 were found
on the surface.
( a )
( b )
Fig. 16 (a-b). Morphology of intensified plasma assisted nitrided sample 3
4. 3 XPS Analysis
XPS spectra of the as-received and the three nitrided samples 1, 2 and 3 are given
in Fig. 18. In the intensified plasma-assisted nitrided sample the following compounds
were identified from found with the XPS analysis. TiN, CrN and TiO2 were found in
trace quantities in the nitrided samples. Cr was mostly detected in elemental form and it
corresponds to a peak with a binding energy of 574.1 eV. Co was detected in CoB.

48
The Ti and W carbides were present in the as-received sample, but were not
detected in the nitrided samples at higher nitriding current densities. This may be due to
the Ti and W forming their nitrides upon bombardment with high energy nitrogen ions.
Chromium does not seem to form nitrides and prefers to stay in elemental state. WN and
BN at 397.3 and 397.9 eV, respectively, were present in nitrided samples 2 and 3 but
were not present in the as-received and nitrided sample 1. This indicates that the current
density of 0.5 mA is not sufficient to form the nitrides. Al was generally present in
elemental state.
Detection of Ni at locations of 870 and 852.5 eV indicates its preference to
remain only in the elemental form. Nb was present in the as-received sample and in
nitrided sample 1, while Nb oxides were found in the as-received sample, and nitrided
samples 2 and 3 in the form of NbO and NbO2. Ta with absorption energies of 23.5 and
21.7 eV was found to be in the elemental state in the as-received sample. As the nitriding
current density increased, Ta was slightly converted to Ta2O5, as observed only in
samples 2 and 3.
This shows that the sample 1 nitriding conditions were not adequate to oxidize Ta.
MoB2 and MoO3 may be present in trace quantities in the nitrided samples. MoO3 seems
to have readily combined with Al2O3 and CoO. WN having an absorption energy of 33.3
eV was present and WO2 with an absorption energy of 32.5 eV was found in traces in the
samples.
Ti was detected in the form of TiN and TiO2, with absorption edges at 455.5 eV
and 459 eV, respectively, Fig.18 (a, b). This indicates that the Ti got nitrided and was
mostly in the form of TiN.

49
0
20000
40000
60000
80000
100000
120000
140000
160000
0100200300400500600700800900Binding Energy(eV)
Inte
nsity
(cps
)
TiN / TiO
2
Cr
Co
Al / A
l2(MoO
4)3
Ni
Ni
NiO
WN
/ BN
MoO
2 / MoO
3/CoM
oO4
TiC / W
CNiO
CoB
Ta2O5 / W
N / W
O2
1-unpro2-nit. 13-nit. 34-nit. 2
1
2
34
Ni(2p)
Nb(3p)
Fig. 17 XPS of IPA nitrided samples and as-received IN738LC
The amount of TiN is found to increase with increasing nitriding current density
which is as expected. A small amount of TiB2 could also be detected in the as-received
and in nitrided sample 3. Cr, on the contrary, is detected mostly in elemental form as
shown in Fig.18 (c, d).
4.4 Wear Test Analysis
The tribological behavior of the nitrided and the unprocessed as-received
IN738LC was studied using the Falex ISC200 PC Pin on Disc system. The response of
friction coefficient and wear rate is shown in the Figure 19. It was observed that the as-
received IN738LC has a coefficient of friction of 0.8-0.9. The wear friction coefficient
increased slightly to about 1.0 with increase in current density in the IPAN setup.

50
6200
7200
8200
9200
10200
452 453 454 455 456 457 458 459 460 461Binding Energy(eV)
Inte
nsity
(cps
)
TiC / TiB2 / TiO
TiN
TiN
TiO2
Ti
TiO2
Ti TiC / TiB2 / TiO
Ti
Ti
TiO2
TiO2
Ti
TiN
TiC / TiB2 / TiO
( a )
5000
10000
15000
20000
25000
570 572 574 576 578 580 582 584 586 588 590Binding Energy(eV)
Inte
nsity
(cps
)
unpro nit1 nit2 nit3
Cr
Cr
CrNCr
( c )
6700
7200
7700
8200
8700
9200
9700
453 454 455 456 457 458 459 460 461Binding Energy(eV)
Inte
nsity
(cps
)
unpro nit1 nit2 nit3
TiTiO2
TiO2TiN
Ti
Ti
Ti
Ti
Ti
TiOTiN
TiN
TiN
TiC
TiN
TiO2
TiO
Ti
TiO2
Ti
( b )
7000
12000
17000
22000
27000
570 572 574 576 578 580 582 584 586 588 590Binding Energy(eV)
Inte
nsity
(cps
)unpro nit1 nit2 nit3
Cr
Cr
CrNCr
( d )
Fig. 18. XP Spectra of as-received and nitrided samples
variation of Ti (a, b) and Cr (c, d) content after sputtering for 0 sec.(a, c), 180 sec. (b, d), respectively
Wear Test Results
0.5
0.6
0.7
0.8
0.9
1
1.1
1.2
0 100 200 300 400 500 600 700 800 900Distance (m)
Fric
tion
Coe
ffici
ent
Unprocessed
Nit. 1
Nit. 3
Nit. 2
Fig. 19. Wear Profiles of as-received and nitrided 1, 2 and 3 samples of IN738LC

51
Coefficient of friction can thus be said to have increased by about 10% by the intensified
plasma assisted nitriding process. This does not appear to be proportional to the vastly
increased microhardness found, as discussed below.
4.5 Microhardness Test Results Microhardness testing was done on the unprocessed and on the nitrided samples
using different loads of 25, 50 and 100 gm. The knoop hardness results obtained for all of
the samples were plotted, as shown in Figure 20. It was observed that the microhardness
of the unprocessed sample was around 480 and there was about a 70% increase in
hardness values for the nitrided samples to about 830 (measured with 25 gm load).
With an increase in the nitriding current density the hardness of IN738LC
increased. The improvement in microhardness values can be attributed to the formation
of nano nitride precipitates on the γ' precipitates at higher current densities.
0
200
400
600
800
1000
First Data Set
Nitrided-3Nitrided-2Nitrided-1
Har
dnes
s (K
noop
)
Unprocessed
25 g 50 g 100 g
Fig. 20 Microhardness of the as-received and the three nitrided IN738LC samples
52
Chapter 5. Conclusions and Directions for Future Research Work 5.1 Conclusion
Oxidation of the as-received, duplex size precipitated superalloy IN738LC at high
temperatures like 1000°C, 1090°C, 1140°C and 1190°C showed that parabolic oxidation
kinetics prevails only at lower temperatures. Except at 1000°C, the diffusion mechanism
cannot be related to the oxide layer growth, because at the higher temperatures some
oxides phases evaporated and affected the oxide layer growth and the metal’s resistance
to oxidation. At 1000°C and 1090°C, the oxidation process stabilized after gaining
certain amount of mass, though with less overall weight gain at 1090°C. Overall weight
gain at 1090°C was less than that at 1000°C. At 1140°C and 1190°C heavy volatilization
of selected oxide phases seems to have occurred, leading to a net overall weight loss.
The loss of mass can be attributed to the volatile CrO3 formed from the Cr2O3
protective layer. Al2O3, on the contrary, forms a stable protective layer, though it still
enables the diffusion of O2 into the alloy much faster at higher temperatures, thus
enabling internal oxidation.
At 1140°C, partial precipitate dissolution and solute segregation and mobility can
take place at the initial stages. However, in due course of time all of γ’ in the metal near
the metal-oxide interface should dissolve, as at 1000°C, leading to a precipitate depleted
zone. At 1190°C two FCC solid solutions were found for the matrix phase, resulting from
a miscibility gap. The formation of the two solid solutions by the miscibility gap type
transformation needs to be studied more thoroughly in the future. Al2O3, NiCr2O4,
CoAl2O4, CoNi2O4, Co3O4 and TiO2 were the main oxide phases present at high
temperatures. Mo seems to form mixed oxides with Al2O3 and CoO. The evolution of

53
these oxides should be studied also more thoroughly. The microhardness of IN738LC
was quiet stable at such high temperatures even after oxidation. It can be inferred that the
superalloy can still retain its strength at such high temperatures after the formation of the
oxide layer, a key point in the application of this alloy at temperatures close to 1100°C.
IPA nitriding of IN738LC showed onset of different preferred orientations. The
hardness was increased by 50-70% and the wear resistance by about 10%. The
improvement in the surface properties is attributable to TiN formation in the form of nano
precipitates on the γ' precipitates. It is TiN that mainly provides for increased hardness
and wear resistance after nitriding the superalloy IN738LC.
5.2 Future Research Direction
• Study of high temperature oxidation can further be extended to nitrided samples
to observe the oxidation kinetics of dissolved nitrogen and nitride containing
surface layers.
• Oxidation studies can be extended to still higher temperatures, say to 1250°C.
• Oxidation can be studied on samples under stressed conditions, to study the effect
of surface and internal oxidation and volatilization of oxides on the creep
behavior of the alloy.
• The exact environment in practice can be imitated in these tests and analogous
research can be undertaken.
• The IPAN pressure can be increased to 100 mTorr and above and the nitriding
characteristics can be studied.

54
References
1. I. Calliari, M. Dabala and A. Zambon, Materials Engineering and Performance, 10(3), 2001, 258-262.
2. S. Seal, S.C. Kuiry and Leyda A. Bracho, Oxidation of Metals, 56(5/6), 2001,
583-630.
3. D.S.Kim, and G.M.Kim, Korean Inst. Met. & Mater. , 38(9), 2000, 1258-1263.
4. D. Bettge, W. Osterle and J. Ziebs, Z. Metallkunde, 86(3), 1995, 190.
5. F.A. Khalid and S.E. Benjamin, Electron Microscopy, 2, 1998,183.
6. Chester T. Sims, N.S. Stoloff and W.S. Hagel, Superalloys II, John Wiley and Sons, New York, 1987, 97-133.
7. J.Li, and R.P.Wahi, Acta Metall. Mater. , 43(2), 1995, 507-517.
8. B.L.Zehn, A.Banerji, W.Reif and Z.Y.Zhong, Metall., 48(5), 1994, 178-182.
9. E. Balikci, Ph.D. dissertation, LSU, Baton Rouge, LA, May 1998.
10. C.G. Bieber, Suffern and J.J. Galka, United States Patent 3459545, 1969.
11. P.K. Footner and B.P. Richards, J. Mater. Sci., 17, 1982, 2141.
12. E. Balikci, A. Raman, and R.A. Mirshams, Metall. and Mat. Trans., 28A, 1997.
13. A.J. Ardell and D. Chellman, Acta Metall., 22, 1974, 577.
14. S.H. Razavi, S.H. Mirdamadi, J. Szpunar and H. Arabi, J. Mater. Sci., 37, 2002,
1461.
15. C.S. Jayanath and Philip Nash, J. Mater. Sci., 24, 1989, 3041.
16. A.D. Brailsford and P. Wynblatt, Acta Metall., 27, 1979, 489.
17. P.W. Voorhees and M.E. Glicksmann, Acta Metall., 32, 1984, 2001.
18. Diane M. England and Anil V. Virkar, J. of Electrochemical Society, 148(4), 2001, A330-A338.
19. J.A. Marqusee and J. Ross, J. Chem. Phys., 80, 1980, 536.

55
20. M. Tokuyama and M. Kawasaki, Physica. , 123A, 1984, 386.
21. C.K.L. Davies, P. Nash and R.N. Stevens, Acta Metall., 28, 1980, 179.
22. C.K.L. Davies, P. Nash and R.N. Stevens, J. Mater. Sci., 15, 1980, 1521.
23. S.S. Kang and D.N. Yoon, Met. Trans., 13A, 1982, 1405.
24. S.S. Kang and D.N. Yoon, Met. Trans., 12A, 1981, 65.
25. A. Baldan, J. Mater. Sci., 37, 2000, 2379-2405.
26. T.L. Wolfsdorf, W.H. Bender and P.W. Voorhees, Acta Metall., 45(6), 1997, 2279.
27. R.A. Ricks, A.J. Porter and R.C. Ecob, Acta. Metall., 31, 1983, 43.
28. H.B. Aaron and G.R. Kotler, Metall. Trans., 2, 1971, 393.
29. F.J. Vermolen and S. Swaag, Mater. Sci. and Eng., A220, 1996, 140-146.
30. I. Lifshitz and V. Slyozov, Journal of Phys. Chem. Solids., 11, 1961, 35.
31. C. Wagner, Z. Elect., 65, 1961, 581.
32. A.J. Ardell, Acta. Metall., 20, 1972, 61.
33. A.D. Brailsford and P. Wynblatt, Acta Metall., 27, 1979, 489.
34. P.W. Voorhees and M.E. Glicksmann, Acta Metall., 32, 1984, 2001.
35. P.W. Voorhees and M.E. Glicksmann, Acta Metall., 32, 1984, 2013.
36. J.A. Marqusee and J. Ross, J. Chem. Phys., 80, 1980, 536.
37. M. Tokuyama and M. Kawasaki, Physica., 123A,1984, 386.
38. C.K.L. Davies, P. Nash and R.N. Stevens, Acta Metall., 28, 1980, 179.
39. C.K.L. Davies, P. Nash and R.N. Stevens, J. Mater. Sci., 15, 1980, 1521.
40. I. Lifshitz and V. Slyozov, Journal of Phys. Chem. Solids. , 11, 1961, 35.
41. Indranil Roy, Masters Thesis, LSU, Baton Rouge, LA, Dec. 2003.
42. R.D. Doherty, Metal. Sci., 16, 1982, 1.

56
43. J.J. Becker, Transactions AIME, J. of Meter., 191, 1951, 115.
44. P.A. Beck, Acta Metall., 1, 1953, 230-234.
45. V. Novikov; “Grain Growth and Control of Microstructure and Texture in Polycrystalline Materials”, CRC Press, Boca Raton, Fl, 1997, 136-139.
46. T.J. Koppenaal, M.N. Parthasarathi and P.A. Beck, Transactions of the
Metallurgical Society of AIME, 218, 1960, 98-102.
47. C.A. Gater and J.W. Martin, Mater. Science and Technol., 12, 1996, 613-214.
48. Md Shawkat Ali and Ping Xiao, Mater. at High Temp., 17(1), 2001, 7-12.
49. J. Litz, A. Rahmel and M. Schorr, Oxid. of Mater., 30(1/2), 1988, 95-105.
50. S. Guruswamy, S.M. Park, J.P. Hirth and R.A. Rapp, Oxid. of Mater., 26 , 1986,
77.
51. Ercan Balikci, A. Ramanand R. Mirshams, Metall. and Mater. Trans., 30A, 1999, 2803-2808.
52. R. Grun and H.J. Gunther, Mater. Sci. and Eng. , A140, 1991, 435.
53. A.M. Staines and S. Hart, Surface Eng. , 1(12), 1985, 739.
54. E.I. Meletis, V. Singh and J.C. Jiang, J. Mater. Sci., 21, 2002, 1171-1174. 55. J.C. Jiang and E.I. Meletis, Microscopy & Microanalysis, 6 (2), 2000, 450.
56. J. Lauer and S.R. Dwyer, Tribology Transaction, 33(4), 1990, 529-534.
57. B. Gud Mundsson and B.E. Jacobson, Mater. Sci. Eng., 100, 1988, 207-217.
58. E.S. Metin and O.T. Inal, Mater. Sci. Eng., A140, 1991, 65.
59. A. Rauch, G. Kimmel, U. Carmi and A. Inspecktor, Surf. Coat. Technol., 36, 1988,190.
60. A. Rauch, P.L. Hansen, R. Avni and A. Grill, Surf. Coat. Technol., 38, 1989, 339.
61. E.I. Meletis, US Patents 5,334,264 & 5,443,663, LSU, 1994.
62. Shang, Shiang, Nuclear Science and Technology, 30(4), 1993, 302-313.

57
Vita
Mary Shanti Pampana was born on July 21, 1979, in Kakinada, Andhra Pradesh, India.
She got her degree of Bachelor of Technology in Mechanical Engineering in 2001 from
the Jawaharlal Nehru Technological University, Hyderabad, India. While studying, she
worked as a supervisor in Murali Krishna & Brothers firm (1997-2001). Seeking
advanced studies, she came to the United States of America to pursue her Master of
Science degree program in Spring 2002. She has been pursuing her graduate education in
the Department of Mechanical Engineering, Louisiana State University, Baton Rouge,
Louisiana. She is currently a candidate for the degree of Master of Science in Mechanical
Engineering to be awarded during the commencement in August 2004. After completing
her master’s degree, she plans to pursue her doctoral program.