study and modelling of saltwater intrusion into aquifers. proceedings ... · study and modelling of...
TRANSCRIPT

Study and Modelling of Saltwater Intrusion into Aquifers. Proceedings 12th Saltwater Intrusion Meeting, Barcelona, Nov. 1992. CIHS. © CIMNE. Barcelona, 1993: 207-228.
FRESH AND SALT WATER IN THE LLOBREGAT DELTA AQUITARD: APPLICATION OF THE ION CHROMATOGRAPHY THEORY TO THE FIELD DATA
Marisol Manzano, Emilio Custodio and Jesus Carrera
Department of Ground Engineering. Civil Engineering School. Polytechnic University of Catalonia, Barcelona. Spain. Foundation International Centre for Groundwater Hydrology, Barcelona. Spain.
ABSTRACT
The cation content of the Llobregat delta aquitard porewater shows the typical pattern of a saline-water equilibrated soil being flushed by fresh water. A reactive transport model which simulates cation exchange has been applied to this aquitard to simulate the mixing between local sea water (which is considered to be the original connate porewater of the unit) and fresh water from the underlying aquifer. The simulation covers a long period of sustained upward flushing followed by a few decades of downward flow induced by recent groundwater pumping.
Actual experimental values for cation exchange capacity and exchange selectivity have been used. Although data show the expected selectivity sequence for freshening cases (Ca2+ > Mg2+), the simulation revealed the inverse sequence {Mg2+ > Ca2+) to be more adequate to reproduce the first part of Ca2+ and Mg2+ breakthrough curves, where reactive processes are dominated by cation exchange.
The use of cation exchange selectivity coefficients, K, even an order of magnitude different, if the ratios between them are conserved produces comparable good quality simulations. The observed Na+ and K+ excess in the solution phase are not balanced by the Ca2+ and Mg2+ deficit. Introducing NHt in the exchange process does not explain the Na+ and K+ excess. Hence, it is probable that some other reactive process, like CaC03 dissolution, capable of contributing Ca2+ to the exchange reactions, has ocurred. In summary, although observed cation exchange parameters can simulate quite well observed concentrations, they may be "apparent" values resulting from a combination of cation exchange - as the main process -
with some other reactions involving CaC03. Some late work, not presented here, has been performed in this field and the results confirm the foregoing idea.

208 CHEMICAL ASPECTS
1.- INTRODUCTION
Fresh and salt water movement in the ground is usually affected by cation exchange processes with sediments. It is well known that these reactions change groundwater composition and can be used to interpret water flow and chemical reactions occuring along flow lines. They are especially interesting to study salinization of coastal aquifers (Custodio and Llamas, 1976, Sec. 10; Custodio and Bruggeman, 1987; Falkland and Custodio, 1991). Quantitative description of these reactions may be obtained applying the ion chromatography theory. This establishes that sequential exchange acts as a separation mechanism (Helferich, 1962) which develops characteristic concentrations, mainly of N a+, K+ and Mg2+, both during saltwater intrusion and during freshening (Van der Molen, 1958; Appelo and Willemsen, 1987; 1990). Besides cation exchange, Ca2+ concentration may be affected by carbonate dissolution.
These reactions and others commonly accompanying them, viz. CaC03 dissolution and precipitation, organic matter oxidation, sulphate reduction, etc., can be simulated using flow and reactive transport models whose practical application requires evaluation of several chemical parameters, in addition to the basic hydrodynamic parameters required to model conservative transport. This paper deals with the use of laboratory-determined chemical parameters in simulating transport of ion-exchangeable solutes governed by instantaneous local chemical equilibrium. The transport model has been applied to a silt aquitard of marine origin between two aquifers in the Llobregat delta (Barcelona, Spain) (Fig. 1). The significance of these aquifers from the local water supply and emergency storage point of view and the important role played by the aquitard in protecting the intensively exploited deep aquifer from contamination by leakage from the upper one, fostered the development of a large number of hydrogeological studies (see Manzano, 1990, for a review of them). Two of them are included in this book (Iribar and Custodio, 1992; Iribar et al., 1992). Studies carried out during the seventies and eighties (Custodio et al., 1971; Custodio 1981; Pelaez, 1983; Manzano et al., 1990) showed that pore water in the silty layer was connate marine water, partially diluted in the lower half of the column by upward-moving fresh water coming from the underlying confined aquifer. Basic hydrogeologic parameters such as porosity, hydraulic conductivity and dispersion coefficient were determined from the study of core samples and the Cl- breakthrough curves, assuming some logical values for travel time and driving head difference, by applying the Ogata and Banks (1961) solution to the dispersion equation (Pelaez, 1983).
New pore water samples have been studied recently. Cl- and isotopic data (180 and 2H) agree with the model of simple mixing of deep aquifer fresh water and connate marine water as the origin of the aquitard interstitial water ion composition, but cation composition suggest secondary processes such as cation exchange. The inverse problem based code TRANSIN (Medina et al., 1989) has been used to estimate the value of the dispersion coefficient from the measured Cl- breakthrough curves. To simulate the breakthrough of major exchangeable ions in the aquitard pore water column, considering only cation exchange as the reactive process, the reactive transport code INTERCAMBIO (Carrera et al., 1992) has been used.
To present the results of this new study, first a review of major theoretical principes used throughout the paper is presented (Section 2); after that, a description of the hydrogeological features of the study area and of the methodology for data adquisition is given (Section 3)

M. Manzano et al. 209
and a description of the conceptual model derived from this information is developed (Section 4). Afterwards, the simulation results are presented and commented (Section 5) and, finally, the main conclusions of the work are introduced (Section 6).
2.- THEORETICAL ASPECTS OF THE TRANSPORT OF ION-EXCHANGING SOLUTES AND ION CHROMATOGRAPHY
Ion chromatography
Chromatographic effects induced by cation exchange reflect the fact that chemical components are separated upon groundwater flow due to differences in adsorption behaviour (differences in selectivity), magnitude of Cation Exchange Capacity (CEC), contrast in chemical composition between flushing fluid and original pore water and dispersion characteristics of the medium. Modelling ion-exchanging transport requires the knowledge of C EC and selectivity values. C EC is defined as the total exchangeable amount of cations adsorbed on exchanger phases per unit mass ( C EC in meq/100 g) of a complex system like natural sediments. It can be obtained from both column elution experiments and batch equilibration techniques and is described by:
n
CEC = 2: Cex,i (1)
were C EC is the total (for all cations) cation exchange capaciy, Cex,i is the concentration of ion species i in the sorbed phase, and n the total number of sorbed cation species.
Cation exchange between two cations, i and j, can be represented by the reaction:
(2)
were Vi is the electrical charge of cation i and X is the anionic part of the exchanger with charge -1. The reaction assumes equilibrium exchange, so it is possible to write a "selectivity" coefficient K which express the relative bonding strength of an exchanger for two cations. There are several conventions in the literature to describe the form of K (see Beekman, 1991, for a wide revision); the one used here follows the convention of Bruggenbert and Kamphorst (1979) in the form expressed by Valocchi et al., (1981):
N[Ce.,,j]v; [Ci]vi Ki,j = [C ·] 11i N[C ·] 11i J ex,t
(3)
where N[Cex,i] express the equivalent ("normal") fraction of cation i in the exchanger and [Ci) express the solution phase concentration of cation i (in meq/1). Solution phase activity corrections have been ignored. By using this convention, a 1X- exchanger site for the case of monovalent-monovalent exchange and a 2X- site for the case of monovalent-divalent exchange are considered.
For homovalent cations, Vi=Vj and Ki,j is non-dimensional, but for a divalent-monovalent cations pair Ki,j dimensions are meq/1.

210 CHEMICAL ASPECTS
Transport of reacting solutes
The relevant transport processes are advection and dispersion. Hence, the movement of any solute is controlled by the well-known transport equation:
8C· m-' = V(DVC·)-qVC·+W+R-
8t ' ' ' ' (4)
where m is porosity, D is dispersion coefficient, q is Darcy's velocity, Ci is the concentration of the i-th solute, Wi is a sink/source term controlling its input or output from the system and Ri is another sink/source term, which defines changes in the amount of the i-th solute caused by chemical reactions. In general, Ri is the sun of the rates of all reactions, such as (2), generating the i-th solute. In the particular case in which one is solely interested in cation exchange, Ri would be the rate at which cation i is desorbed. Wi and Ri are expressed in mass per unit volume and unit time.
Equation ( 4) represents the mass balance of moving species. The mass balance of non-mobile species (i.e., sorbed or solid phases) is given by:
ac~ __ J = Pb R~ 8t J
(5)
where CJ is the concentration of the j-th non-mobile species, Rj is it rate of accumulation and Pb is bulk-density relative to water density. In the particular case of ion exchange, and according to the terms defined above, C~ would be Cere J.. Also, if the only process is
J ' exchange, Rerc,j = -Rji that is, the increase of the amount in solution of j is balanced by a decrease in its sorbed concentration, and viceversa. In general, the relationship between R's is more complex. For example, if one is also considering dissolution/precipitation of calcite then Rca= Rerc,Ca- RcaCOai that is, Ca2+ in solution may disappearbecause of sorption and/or because of calcite precipitation.
Equations ( 4) and (5) can be solved by means of standard numerical methods, provided that the R's are known. Actually, these only become known after computing the concentration of all species, both mobile and immobile. There are several alternatives for overcoming this stalemate. For the sake of simplicity in data requirements, instantaneous equilibrium assumption have been used. Therefore, in addition to ( 4) to (5), computed concentrations must satisfy equilibrium equations such as mass action law, formally equivalent to (3), and constraints such as (1). It is clear that the resulting system would become overspecified (more equations than unknowns), which allows one to drop some of the equations, normally through "smart" combinations of ( 4) and (5) leading to elimination of some R's (see Rubin, 1983, for a lucid discussion of this and related approaches).
This approach has been implemented in the INTERCAMBIO code, which solves the solute transport equation by means of the finite element method (Carrera et al., 1992). The code requires specifying which species are going to be solved from the transport equations and which are going to be computed from equilibrium reactions. The two sets of equations are solved iteratively by the Newton-Raphson method, which allows to easily compute not only the reaction rates (R's), but also how they change in response to changes in concentrations.

M. Manzano et a!. 211
Ion chromatography patterns of freshening processes
The main water quality changes occuring in a saltwater aquifer suffering fresh water intrusion are summarized by Appelo and Willemsen (1990) and Beekman (1991). As deduced from column experiments, the main exchange process seems to be Ca2+ -N a+, followed by Mg2+Na+ and K+ -Na+ exchange in decreasing selectivity order. The mixing of salt and fresh water in a freshening process and the decrease of Ca2+ in solution by cation exchange usually drives calcite dissolution (if it is available). The last process involves alkalinity changes, but it has not been considered in the present study. The resulting chromatographic pattern consists of an initial decrease of some cations in solution, to even below their concentrations in the displacing freshwater, as a combined result of dilution and equilibration of freshwater with the saltwater exchange complex. As flushing goes on, the exhaustion of adsorbed Na+ can even allow the displacement of Mg2+ and K+ from the adsorbed complex by Oa2+ and NHt, as can be seen through the results of fluid displacement in laboratory columns (Appelo and Willemsen, 1990; Beekman, 1991).
The main features of this pattern, so clearly observed in column experiments, can sometimes be observed in field situations as occurs in the case studied here. We have assumed that the excess or deficit of each cation in solution, compared to conservative mixing, is only caused by cation exchange processes.
3.- DESCRIPTION OF THE STUDY AREA
Hydrogeology
Geologic and hydrogeologic characteristics of the Llobregat delta are summarized in other paper in this book (Iribar and Custodio, 1992) and its flow pattern characteristics in Custodio et al. (1992) and Custodio (1992). The aquitard is a wedge-shaped holocene silty formation of prodeltaic origin with a maximum thickness of 40 min the central part of the delta coastline (Fig. 1). The study of cores drilled through the whole thickness of the unit shows great homogeneity of the hydrodynamic parameter values and of the vertical porewater chemistry patterns (Custodio et al., 1971; Custodio, 1981; Pelaez, 1983). Much of the tritiumless connate marine water remains in the aquitard sediments (Fig. 2) despite of an upward freshwater gradient under the conditions that have pre.vailed during a maximum of 8000-10000 years, with the exception of the last 40 years of intensive groundwater abstraction, during which the vertical water head gradients along the aquitard have changed from upward to downward.
Assuming an experimental mean porosity of 0.4, a historic head diference around 5 m and a flushing period between 6000 and 10000 years, the Ogata and Banks (1961) analytical solution to the 1-D dispersion equation was applied to the Cl- and Na+ breakthrough curves (including a retardation coefficient for Na+). The values obtained were very homogenous (Pelaez, 1983):
Vertical permeability, k1: 1 . 10-5 to 5 . 10-5 m/day

212
Corne II a I
B • • • • •,' '• · .•. •··,. •
··~· ~ :•':_o•, oooo".•,•o•....!~o~• '•"
Section I
~gravels
~sand, sand and gravels ~ conglomerate 1721 imperv1 ous silt 15;3 clay
CHEMICAL ASPECTS
Prat de Llobregat I
Mediterranean Sea I
-50
-150 '-------'----'---'------'----'
3 5 k•
Fig. 1.- Geological cross-section of the Llobregat delta. The situation of the studied boring is indicated.
0 2000 m ~
g;t cr 10 20
0
Fig. 2.- Chloride profiles in the aquitard including the boring studied in this work (Cal Malet). Modified from Custodio et al., (1981).

M. Manzano et al.
Dispersion coefficient for cl-: 3 . 1o-6 to 18 . 10-6 m2 I day
Dispersion coefficient for N a+: 2 · 10-6 to 8 · 10-6 m2/ day
Retardation factor for N a+, R: 1.5 to 2
213
The values of k1 fit the results of a 2-layer numerical flow model (Custodio, 1981) and the
ones of the transport model of the delta aquifer presented in this book (Iribar et al., 1992).
New studies have been carried out in boreholes drilled after the study of Pelaez (1983) in
order to confirm the previous conclusions and to evaluate the role of chemical processes like
cation exchange in the shape of the observed cation breakthrough curves. The results of one
of the boreholes (Cal Malet, CM) are presented here.
Data adquisition
The borehole was drilled two kilometers inland from the coast-line (Fig. 2), in an area in which
the deep aquifer is nowadays severely affected by exploitation-induced sea water intrusion.
Undisturbed core samples of 1 m length were obtained from the whole aquitard sediment thickness. Samples were carried immediately to the laboratory, where they were stored at
4°0 till its opening. Samples were longitudinally cut; one half was used for sedimentary and
mineralogical analyses while the other half was used to obtain pore water. Before disrupting
the samples some X-radiographs of core segments were carried out for sedimentological
purposes. In each case, between 500 and 700 ml of sediment (20-30 weight % water) was put inside a pressurized-air chamber and squeezed, without the air contacting the sediment
or the pore water. A maximum pressure of 6 atm was applied during the time needed (always
less than 3 hours) to obtain 30-40 ml of water, enough to carry out major cation and anion
analysis and 18 0 and 2H determinations. The ion balance error of chemical analyses is less
than 5%. The squeezing method used proved to be less chemical equilibrium-altering that
the dilution method used in former studies (Manzano and Custodio, 1987).
The mineralogy was studied using X-ray diffraction for clay-size fraction and bulk sediment.
Scanning electron microscope (SEM) with energy dispersive analysis (EDAX) where also
carried out for the clay-size fraction. Volumetric analysis of C02 gas was used for
the total carbonate content and X-ray diffraction for carbonate species identification and semiquantitative analysis.
Cation exchange capacity of the bulk sediment and individual cations in the sorbed phase
were determined in some selected soil samples along the aquitard thickness. The ammonium
acetate equilibration method was used, which needed corrections for the measured Ca2+
and Mg2+ sorbed concentrations because of some carbonate dissolution. Since the water
alkalinity was not measured before and after the equilibration, the correction was made with
the following assumptions:
o total CEO, Na + and K+ sorbed concentrations are rightly determined;

214 CHEMICAL ASPECTS
o sorbed Ca2+ and Mg2+ determinations correspond to "actual" sorbed concentrations plus the contribution of dissolved carbonates;
o total CEO minus sorbed Na++K+ gives the "actual" sorbed Ca2++Mg2+;
o Ca/Mg molar ratio of dissolved cations is given by the (calcite + dolomite) / (dolomite) molar ratios in the sample calculated from X-ray diffraction diagrams (assuming the percentage ratio to be equivalent to weight ratio).
The resulting actual Ca2+ and Mg2+ sorbed concentrations are showed in Table 1, columns g and h. The same correction was made considering only calcite dissolution, but in this case analytical Na+, K+ and Mg2+ values are "actual" concentrations and sorbed Ca2+ (Table 1, column i) is determined by sustracting the sum of Na+ +K+ +Mg+ from total CEO. Selectivity coefficients were calculated using sorbed Ca2+ and Mg2+ values resulting from both corrections (Table 2), and they are not very different. Since simulation results appear as little sensitive to K values, those from the first correction have been used, even considering that dolomite dissolution is possibly only minor.
Data description
Chemical data agree with what is known from older boreholes in the sourroundings of the study area. Only S04 does not follow these trends and is found to be more depleted in the aquitard pore water. The higher content found in older boreholes is thought to be an effect of sulphide oxidation during the dilution with distilled water in the open, stirred flask used to extract the pore water.
The 01-, 180 and 2H content agree pretty well with a simple mixing model (Manzano et al., 1990). Nevertheless, compadng cation data with conservative mixing calculations taking as end members the local sea water composition and the original deep aquifer fresh water (before current marine intrusion), there is a clear excess of N a+ and K+ and a deficit of Ca2+ and Mg2+ in the solution phase (Fig. 3b) for samples located between 24 and 52 m depth. Samples above 24 m have not been included in the mass balance because they are considered to be diluted by downward flushing from the upper aquifer after the last 40 years of vertical head gradient inversion. These features are characteristic of a freshening process. Considering the vertical evolution of porewater ion content (Fig. 3a) as if it were the case of a laboratory soil column filled with marine water (which is close to the 24 m sample composition) and then flushed by a freshwater solution similar to the old aquifer water entering the column through it lower end, the following features can be seen:
o in the eight first meters, Ca2+ decreases in solution even below its concentration in the flushing water in a typical exchanging breakthrough curve shape, before starting to increase due to the higher percentage of Ca2+ from the original porewater in the mixed solution;
• the Mg2+ does not decrease initially but stabilizes just in the same eight first meters of the column;

z -~ --p ->-< ---0 -::..:: ... 0 -_-_ A_-_-_ ~ --
~ ---=-= s (j' -~ --
M. Manzano et a!.
/ ~ ~
~ ~ ~ ..............
I.': ') ~ ... ':/<> '"'-....__. ~ w -'-"
~ -~ ~-------------\<1
!""" ~ ~
'' > --------------~
-\ft ~ -~ 'I Comp. of the C~t bore h. porewalcr
~i)-------QNa/10 +--+-----+-• Cl/ I 0
W\1 •-•-•.-------. Ca ~~lg )1------JI----fl-----~tK
t-------+-+---+ S04 --------- NIH
0. 10. 20. JO. 40. 50. 60.
(meq/1)
215
---
70.
Fig. 3a.- Chemical composition of the aquitard porewater at Cal Malet site.
~r--+-+--+-+--+--T
"' ,, ~+--+-+--+-+--+-+
o~~~J~on~ic~co~nte-ntLsi~n~lhe~C~M~bn~re~ho~Je~~ XXXX Seawater co DieD 1 GGGOMeau&ured nlun eeoeDeep aquifer content ._..OValue in the theoretical mi:liD _ _t
'! H-+--t---t---1-+--t 0
LX :;; t--t--t--t-h1v; cfi, -t
Vi 'f t--t---l"--1/h"H' -+--t
'\ lL I> ~ 1--
' p v ' , I
II r f 1/ ~
~' b
"! t-i-+--t--H-t---t ~
~ 1--l-1--f----l----1-
~
r 0
p I .., [/ ,"/
'i / ' 1/ {
~IV - - r- - -
~
0. tOO. 200. 300. 400, SOO. 600. 0. 1. 4. 6. 8. 10. 12. 1~. 0. 5. t(l, IS. 20. 2S. JO. 0. 10. 40. 60. 80. 100. 120. Na (meq/1) K (meq/1) Ca (tucq/1} Mg (mc4/l)
Fig. 3b.- Conservative ( o-o) versus theoretical mixing ( e-e) of the Cal Malet porewater showing cation excess and deficit in solution. See text for explanation.

216 CHEMICAL ASPECTS
Table 1.- Experimental CEO and sorbed cations concentrations Used to calculate the selectivity coefficients.
Depth(m) a I b I c I d I e f 9 I h ~
(*) CECT I Naero I Kero I Mgero l Cne:n MCa/MMg Mgero (l) I C•ero (1) Cne:n
meq/100 g meq/100 g 1 14.16 6.68 1.11 4.28 41.14 8.93 1.25 5.12 2.09 4 15.0 7.28 0.86 3.18 40.73 12.13 0.34 6.52 3.68
21 15.0 6.75 1.16 3.60 44.97 10.19 0.01 7.03 3.44 33 17.0 0.97 0.55 5.52 35.01 8.56 2.9 12.58 9.96
- a, b, c, d and e are measured values (only corrected for the salt porewater content).
- j is the molar ratio of (calcite+ dolomite)/dolomite in soil from X-ray diagrams, l\.1:Ca is the moles of Cain
calcite and dolomite and MMg is the moles of Mg in dolomite, in 100 g of soil sample j is assumed equal to
MCa/MMg = MCad/MMgd, the moles of actnally dissolved Ca and Mg;
- 9 and hare "actual" sorbed concentrations calculated considering: a- (b +C) = 9 + h; d=9+MMgd;
e=h+MCad;
- i is the "actual" sorbed concentration calculated assuming a, b, c and d are "actual" values, so i = a- (b + c +d). * from the top of the aquitard.
e any of the other cation breakthrough curves show other behaviours;
e The 804 behaviour is not commented in this work.
The only possible source of Na+ excess in solution is cation exchange, while the excess of K+ is difficult to explain only by this process, provided its low concentration and selectivity preference. However, Ca2+ -K+ exchange has been tested in the simulations carried out;
NHt is not present in measurable concentration neither in sea water nor in the old deep aquifer fresh water, so it can only come from the degradation of organic matter in the sediments. As the NHt breakthrough curve looks like a dilution curve this cation has been considered already present in the column porewater before starting the flushing process, for simulations not included in this paper. However, in the simulations presented here, the exchanging effects of some NHt concentration entering the column with the fresh solution are considered; this NHt is assumed to be the result of other reactions in the lower part of the column.
Given the small composition difference of dominant ions between old deep aquifer fresh water and the sample from the aquitard bottom, in the present study the last value have been used to characterize the entering solution, thus avoiding the description of the chemical reactions ocurred just in the contact zone between the aquifer and the aquitard.
The mineralogical analyses of cores show a remarkable homogeneity. The clay fraction is dominantly illitic (65-80 weight %of total clay assemblage), with minor presence of chlorite plus kaolinite (15-25%), small quantities of smectite ( < 5%) and clay-size quartz, feldspar and carbonates (mainly complete shells and broken fragments of molluscs and foraminifera).

M. Manzano et a!. 217
It was not possible to find carbonate cementation by microscope observation. Small rounded opaque grains were visually recognized and identified under the microscope as typical iron mono- and disulphides associated to decaying buried plant matter and pyritization of shells. Methane bubles were not found, although this gas flows out from several monitoring boreholes screened near the top of the deep aquifer and the sediment usually shows the characteristic "mousse" texture due to organic matter decay and gas generation (Manzano, 1986).
Table 2.- Experimental K values calculated following the convention given in the text.
Depth Na I K I Mg I Ca Kca,Na 1 KMg,Na I Kca,K
(m) meq/1 in solution meq/1 (1)
1 460.0 9.3 11.4 61.0 30167 4447
3 510.0 10.6 10.8 62.0 44492 2248
21 190.0 6,6 4.2 11.0 19893 11
33 66.0 2.6 1.6 6.0 445494 27386
(3)
average (""...,~ 40000 ~ 10000
( 1) values calculated with g and h from Table 1.
{2) values calculated with d and i from Table 1.
446
1343
664
2762
rv 1000
Kca,Na I KMg,Na I Kca,K
meq/1 (2)
12310 4768 182
24091 3776 819
9734 3889 276
362712 62128 2186
rv 100000 16000 900
{3) averaged values used as initial ones for the simulations presented in this paper.
CEO
meq/100 g
14.2
16.0
16.0
17.0
16.0
The experimental total C EC values are coherent with a illite-dominated clay assemblage (Table 2) and, besides questions concerning data corrections, it seems that selectivity coefficients are consistent: a high preference for Ca2+ against Mg2+ in the exchange with Na+ is observed. K+ values tend to be high in the lowermost part of the aquitard, where flushing has been more important and more Ca2+ and Mg2+ is in equilibrium with the sorbed complex. The original work intended to prove that field data lead to good simulations. However, taking into account suggestions made by researchers working in this subject (Beekman, 1991) about using constant values K along the whole column, the simulations were carried out using mean K values (Table 2).
4.- DESCRIPTION OF THE CONCEPTUAL MODEL
Since the 52 m deep pore water sample chemical composition (Fig. 3b) was chosen as representative of the water flushing the aquitard column and its top in the study borehole is placed at 20 m depth, the physical model results in a 32 m length column with one-dimensional flow from bottom to top (Fig. 4). The column was divided in 32 elements, 1 m long each, since a smaller size barely improved the results while calculation time increased. As initial conditions, the whole column was equilibrated with local marine water (Table 3). Porosity was fixed to 0.4 in the whole column according to experimental data. The flow and transport parameters were estimated from the experimental curve with the code TRANSIN (Medina et al., 1989). The initial values used were calculated considering the following information: from historical data it is known that the head difference between both deep and upper aquifers during the upward flushing period, ~h, was closely around 5 m; from some experimental data the aquitard vertical permeability, k1
, is about 5 · 10-5 m/ day; the aquitard thickness in the study area was set to 35 m.

218
Cal Malet boring lithological profil
CHEMICAL ASPECTS
Modeled column
j unidimensional flow Cup
Initial and boundary conditions for the upward flushing simulations:
for O<x<L
for all t C(x,O) =Co
C(L,t) =Cup C(O,t) = 0
Upward flushing conditions: q = 6.8·10-6 m/day ~h = 4.35 m t = 3562 years m = 0.4m a=2m
0 0 =initial pore solution (see Table 3) Cup= upward flushing solution
(see Table 4) m =porosity a = intrinsic dispersivity
Fig. 4.- Conceptual model considered for the upward flushing simulations. The column was splitz in 32 elements with ~x = lm.
After some runs with these data, the upward flow rate was set to 6.8 x 10⁻⁶ m/day, which
corresponds to Llh=4.35 m if the k1 value is 5·10-5 m/day (see the final discussion for
comments). The chemical composition of the inflow water is considered the same as pore
water near the column lower end. Diffusive transport proved insufficient to simulate the
experimental curves, so advective dispersive transport was considered. The best dispersivity
value estimated for the assumed flow conditions was 2 m. These values are coherent with
existing historical and experimental information but this is not the only value set capable of
justifying the observed curves, as it is shown in the discussion. The flow parameters used in
all the following simulations are summarized in Table 5.
For the chemical model, Ca2+-Na+, Mg2+-Na+, Ca2+-K+, NHt-Na+ and NHt-K+
exchange were considered. Values for the cation exchange constant, K, were calculated from
experimental data (Table 2) but for the NHJ case, whose sorbed phase data is not available
(see comments below). K and CEO were assumed constant along the aquitard thickness and
equal to their mean experimental values.

M. Manzano et a!. 219
Table 3.- Chemical characteristics of the solution filling initially the column pores and the freshwater solution flushing the column in the upward flow period (local seawater from a sample obtained in front of the Barcelona harbour at 50 m depth and sample frorn the aquitard bottom, respectively). See the text for explanation.
Cl Na+ K+ Ca2+ Mg2+ NHt so4 (meq/1)
Local 68.27 seawater 613.17 513.02 12.82 26.78 116.6 0.00
Bottom aquitard o.oo porewater 34.05 51.67 2.74 3.61 6.01 1.99
5.- SIMULATION RESULTS
Simulations dealing with the selectivity sequence
Several simulations were made changing both the selectivity sequence and the order of magnitude of the K values. After a number of runs trying to improve the "exchange" shape of the lowermost part of the Ca2+, Mg2+, Na+ and K+ curves using the typical selectivity sequence (Ca2+ > Mg2+) in the exchange with Na+, it was found that an inversion of the selectivity order (Mg2+ > Ca2+) highly improved the quality of the fitting in this part of the Ca2+ curve (Fig. 5). Breakthrough curves corresponding to 6.t=200,000 days are drawn and the adecuacy of the t=1,300,000 days (about 3,562 years of dispersive transport) curve for Ca2+ and Mg2+ experimental data fit is shown by means of a thicker line. K values used can be seen in Fig. 5; initial solution composition and flow parameters are given in Tables 3 and 6, respectively.
Looking at Fig. 5, it is clear that the "normal" selectivity sequence makes too much Ca~+ to be immediately fixed in the sorbed phase substituting N a+, while K+ find too little Ca + available to exchange with. However, the "inverse" selectivity sequence increases Mg 2 + -Na+ exchange, which allows Ca2+ to stay in solution and to be more available to exchange with K+. Since KcaNa=40 and KcaK=1 in a "normal sequence", Na+ compete with K+ for
Ca2+ in a ratio ~f 40, while in th~ "inverse" sequence this ratio is only 10.
N a+ and K+ have consistently showed a tendency to fit curves corresponding to times between 800;000 and 1,000,000 days (2,466 to 2,740 years) of dispersive transport instead of the 1,300,000 days (3562 years) curve observed for Ca2+ and Mg2+. This seems to point out the existence of Na+ and K+ release from the sorbed phase by processes other than the e:x:change with Ca2+ here considered; for Na+ there is only the possibility of exchange with so:x:ne other cation besides Ca2+, while for K+ both exchange with some other cation and upt a.ke from interlaminar sites in the illitic structure during the water extraction is possible. This last process has not been investigated in this study.
Refering to the K values used in the inverse sequence case, good results were obtained by using the experimental Ca2+ /Na+ value for the Mg2+ /Na+ selectivity coefficient and vice-versa, but

K values eq/1
Kca,Na KMg,Na
Kca,K
?
""
> ?
.0 g. "'-~ ~ Q. •
~ ""~ " ? ~ 3
~ ~
~I
~ f---,-
4eq !Seq
4ili10 10 40 1 1
Ca meq/1 Mg meq/1 Na meq/1 K meq/1 10. 15.
;:;;
to~ ~? 0 3
"' ~ -? ~
~ :::..:l,.o.l 3 ?
t;;'
20. 25. 30.
4eq :±
Ca meq/1 5. 10. 15.
RUN Seq
20. 40. 60. &0. 100. 120.
1 _x/r ~ ~r!/f); r / /t/J~'l /1 / 1 / ,' / I I .
!.l I X/ l./l/1
;, v/i /r I
f/fl/ tl I I li!'~(/ /1 I
lilt-' ~r 1/ ~I I
I, I
Mg meq/1 20. 40.
~ /; v/ to ~ v;c; /
! ? If; I I
I I
$ ~ /1 · · 11, Q. I $! I
"' I
~9 I
~ ~
100. 200. 300. 400. 500. 600. 4. 6. &. 10. 12.
1 !IJI 1 1 /1/j/1 I li /I I I ,, I! I I
/ / lj 1 1o I / f>l/ f
// li: /1 I / 1/J/ I; / /1 <p j / / i// I•
1 i 1/v~ / r7 / //V / I'/ I~·' • / I I I v /",- /0 I
I '// / I , // V/ / / I , 1 !. ' I II / " I I //J / ~~ I// / / I I /_/ / /
''/_1// /'!..' '/ ;::.; > / :7~:.1 '/ / .. ,v: I t/:"v 1
~: , ;0 / {!j__j_ ~/'
~/
Na meq/1
'!/ / 1/
K meq/1 100. 200. 300.
~ ~ ~ 4. 6.
" /
3
t;; I J
to~ g ? r->'-41e'----AL e 0
3
"' ~ ~ Q.
§. 3!5
t;;r--.--+~+-..--J
{symbol: ----- --- ----- --- --- ----- ---
legend days: 800000 1000000 1200000 1300000 1400000 1600000 1800000
14.
Fig. 5.- Effect of the selectivity sequence on the lower part of the breakthrough curves. See text for explanation and tables 4 and 5 for flow and transport parameter values.
N N 0
() ::c: ti:I :s::
~ t"'
> Cll
ril ()
r;l

M. Manzano et a!. 221
simulations varying by one order of magnitude these values, but conserving the ratios, shoW equally good fittings. Changes in the relative values of K has an effect, but not for all cations. Both the K values and selectivity sequence looking as "the best" are actually "apparent" since they may integrate the effect of some other processes not considered here, like participation in the exchange process of Ca2+ coming from CaC03 dissolution.
Simulations dealing with the number of cations involved in the ion exchange
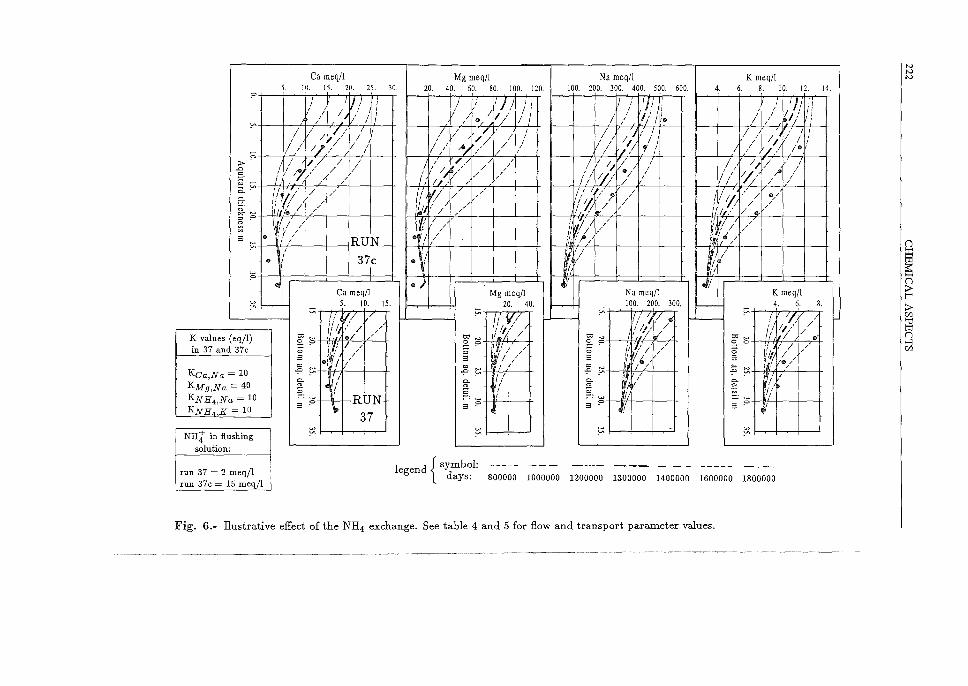
In order to improve the Na+ and K+ fit, some simulations were made considering the existence of NHt -K+ and NHt -N a+ exchange, "artificially" introducing NHt into the aquitard column with the flushing solution. Selectivity coefficient values for both exchanges have been set similar to the Ca2+ -N a+ exchange value after looking in the literature for some information about their relative values (Fig. 6). Flow and transport parameters values are in tables 4 and 5. No simulations has been made varying these values. Results show that using the "inverse" selectivity sequence as a starting point, a small quantity of NHt (2 meq/1) entering the aquitard barely improve the shape ofNa+ and K+ curves, while Ca2+ and Mg2+ maintain acceptable shapes (Fig. 6). Using a higher concentration (15 meq/1), the improvement of the Na+ and K+ fit is considerable but not enough, while the Oa2+ and Mg2+ fittings deteriorate dramatically. This is due to the fact that while NHt, N a+ and K+ are homovalent and their ratio between the sorbed and the liquid phase is linear, Oa2+ or Mg2+ and Na+ or K+ pairs are heterovalent and their relation is quadratic. Then, NHt exchange is favoured as fresh water enter the aquitard column and Oa2+ and Mg2+ exchange only starts to occur ahead in the column, when the NHt has been exhausted.
So, it seems that if NHt exchange has ocurred in the aquitard column during its equilibration with saline pore water, it should not have been in a considerable extent and consequently it was not the cause of the strong observed desorption of N a+ and K+. This fact points again to the possible existence of an "extra" quantity of Ca2+ - OaC03 dissolution is a possible source - exchanging with both cations.
Simulation of the complete flow sequence
The last group of simulations considered here deal with the best fit of the experimental cation breakthrough curves considering the incipient dilution observed in the upper pa.rt of the aquitard (1 m deep sample in the aquitard column) due to the downward hydraulic gradient acting in the last 40 years.
The aquitard column was split in two different parameter zones:
Z1: 0 to 7 m of the column thickness (diluted zone); Z2: 7 to 33 m, from the saltier sample to the aquitard bottom.
Dispersive upward flow was simulated during 1,300,000 days ( ~ 3562 years). Afterwards, the resulting pore water was subjected to downward flushing by a diluted solution entering the
Ca rneq/l Mg meq/1 Na meq/1 K meq/1 5. 10. 15. 20. 25. 30. 20. 40. 60. 80. 100. 120. 100. 200. 300. 400. 500. 600. 4. 6. 8. 10. 12.
I I I I
"'
"' > .0 c
'"-~ ~ Q. •
§: " X" ~
E :='
3
! : J 'IT I : ljf : - - - ; I!JII ' ' I I I ' /1 I I I /I
/1. : I I I I : I I I It : I / • v / I I / 'I I .. / 'j I
---f-1 ,' /' I I I' l I ' I '/'/1 1 ;'11 1;/11 1
/ I I 1 / J 1
I / / I/ ~/ / I;/ / / '//' ,' / / '// !• I
I/ ~/ / ,/ I I ;,/ / I I ~~ / /
/1 //~' / / i I /// 0// / / / //' ;0 /
I I I/, ' / / / "/ / / I ~/ / I
I I lfj / I I ' / I ' I ff/ / 1 I / jP / ! I !f, ' / 0/
,f" / / ' I// / t ' / t ,,.,. / ,/ ,' // / iii/: / ., /
\tl·> /!ill/ / if (I/ / ~
I I I 1
• ·~\'/ / ~;I:~/ ~~I 4''
• I I I w I I
0 ) J.~l u • • f1111 ell Ca meq/1 I Mg meq/1 Na meq/1 K meq/1 5. 10. - 20. 40. ~ - 100. 200. 300. 4. 6. 8. f > 1 I 7 1 I ~ 11 [/ 1 "' 1 1,r 1 "' 1 ; / 1
~~
K values (eqjl) in 37 and 37c
Kca,Na = 10 KMg,Na = 40 KNH4 ,Na = 10 KNH4 ,K = 10
NH4 in flushing solution:
run 37 = 2 meq/1 run 37c = 15 meqjl
~w 3 "'
~ f-,---t-..,........,,_,...--'
:; ,: '----- I II! "" '----- ,'I ·'·' /
I' I It: ,' If/ I , 1 j'/ It'/·· 1 =~ 1o, / =~ I~ =~ I e ~ "' Ill/,' v / ~ "' 111'1,• I / ~ "' If : / / 0 !,'/ / 0 (, ~,j' I 0 h / 1
3 Ill I / a s/ I ' I 3 1.~~ • / ~ tv :/ $ ~ I :/I ~ t;: tJf_ 1
~ :--" I/ ~ . ~i!, // ~ . '5; I
~ ! ~ ;. ~ G!' ::::; w I ::::;;:: fl :::;;:: w. a ? a . l! a . I •'
~ 1--~+-~-' ~ 1-~+-~+-...,..-':.J ~ r-~+-~+-~-'
legend { symbol: days: 800000 1000000 1200000 1300000 1400000 1600000 1800000
Fig. 6.- llustrative effect of the NH4 exchange. See table 4 and 5 for flow and transport parameter values.
14.
N N N
(")
~
~ (=j ;J> t-< ;J> Cll
ril (")
~

M. Manzano et a!. 223
top column during a period of 20,000 days ( ~ 55 years). Although the last period seems too long to fit real historic conditions, it has been the arbitrary value used for the preliminary simulations performed and presented in this work. It is obvious that q · t controls the position of the resulting curves, as is shown in the discussion.
Flow and transport parameter values for Z2 during the upward flushing period were the same used for the best of the foregoing simulations (tables 4 and 5). For Z1 and the downward flushing period, porosity and dispersivity were the same than in Z2, while the inflow q was estimated as 3.4 · 10-6 m/day to fit these values and the mean penetration of fresh water into the aquitard (around 1 m as deduced from the experimental Cl- breakthrough curves) during a period of 40 years.
Total CEC, the order of magnitude of selectivity coefficients for Z1 and the flushing solution concentrations were changed to improve the fit of this part of the curves. Results were discouraging because of the low sensibility of solution concentrations to these parameters. The flushing solution concentration is the most influencing one. The values used for the best simulations are shown in tables 4 and 5. Fig. 7 illustrates the improvement of the Ca2+, Mg2+ and K+ fit achieved by using the upper aquifer freshwater composition (run 20) instead of the 14 m deep sample composition in Fig. 3 (run 8) for the flushing solution. As Fig. 7 shows, the Na+ fit needs a higher concentration input than that existing in the upper aquifer (around 10 meq/1) and a non-realistic increase to 100 meq/1 was not enough to achieve a good fit.
Table 4.- Composition of initial and flushing solutions and chemical parameters used in all runs considered in this paper.
Ongmal Upward Downward aquitard flushing flushing
Ion pore water solution solution meq/1
R8 R20
Na+ 513.02 51.67 380.0 100.0
K+ 12.82 2.74 7.6 3.0
Ca2+ 26.78 3.61 7.1 3.0
Mg2+ 116.60 6.01 54.0 7.0
Bulk density is 1.75 g/1. The selectivity coefficients for runs R8 and R20 are: Kca Na=5 eq/1; KMg Na=40
eq/1; Kca,K= 1 eq/1. The cation exchange capacity is 0.25 eq/100 g for Z1 (1 to 7 m from the aquit~rd top)
and 0.15 eq/100 g for Z2 (7 to 33m from the aquitard top).
Additional simulations have been carried out using standard selectivity coefficient values taken from the literature, considering other reactive processes like CaC03 reactions. They will be presented in a future paper.

Ca meq/1 10. 15. 20.
? I <I I
_g ~I T I J I "'. >f'
~ ,, I ~?I »_ i3
V\ I , I I
?
~
>? ..0
=· ~ ~ p. .
:;. ;:;· ,.,. ~ "' 0 ~-
i3
w ~
.I ~
\.
Ca meq/1 5. 10. 15. 20.
' \ .I
• / j
I 0
RUN-
R20 I
Mg meq/1 40. 60. 80.
? I I I< I RUN
..., I 'I .g ...., I 1t "'. >f'
o. I $2.- I /1 ==~
RS
i3 R20 ~I 'I I -1
Mg meq/1 20. 40. 60. 80.
?
~
0
>
~--~ ~ p. .
:;. ;:;· ,.,. ~ E ?
i3 ~ ~
w ~
Downward flushing solution (meq/l)
Na K Ca Mg
380.0 7.6 7.1 54.0
100.0 2.0 3.0 7.0 ----
?
-l 0
"'~ "'. >f' p.
~? i3
Na meq/1
Na meq/1 300. 400. 500. 600.
~ . I·
J v.
100. 200. 300. 400. 500. 600. ?
~
>0
e. ~;:; 0- •
"" ;:;· ,.,. ~ "' 0 ~ .
i3
w =
w ~
-........
J V·
J
/. I .,
I'\ 0
I· v. > ..0
?
~
0
~- -~ ~ p. .
~ ,.,. ~ "' 0 ~ .
i3
w 0
w ~
?
-l 0
"'~ "'. >f' p.
" g;; i3
K meq/1 8. 10. 12.
•
K meq/1 4. 6. 8. 10. 12.
........... I'\~
/ .. II'
/ •
I If ..
• If
I .. I
I d
Fig. 7.- Results of the complete flow sequence simulation: 3562 years of upward flow followed by 55 years of downward flow. See tables 4 and 5 for flow and transport parameters values.
~ -!:>
(j ::r::
~ ~ t""
> [/)
cil (j
~

M. Manzano et a!. 225
Table 5.- Flow parameters use·d in all runs considered in this paper.
Vertical flow, q (m/day) Thne, t (years) Head difference Vertical permeability
Ah (m) k 1 (m/day) RUN up down up down up down
R8
and 6.8·10-6 3.4·10-5 3562 55 4.35 21.76 5·10-5
R20
Dispersivity is 2m and porosity is 0.4. "Up" and "down" means upward flushing and downward flushing period,
respectively.
6.- FINAL DISCUSSION AND CONCLUSIONS
An almost perfect typical freshening chromatographic situation has been identifyed in the porewater chemistry of the Llobregat delta aquitard.
Using experimental CEO, selectivity coefficients and chemical concentrations data for cation transport and historical information for the vertical flow through the aquitard, it has been possible to simulate with reasonable accuracy the dispersive upward flow in the aquitard column, considering cation-exchange as the only reactive process affecting the cation transport. So this process seems to be the main reaction controlling the actual cation distribution.
However, the "best" selectivity coefficient (K) sequence found for the exchange processes is different from what is considered the "typical" one in freshening cases. Actual values of selectivity coefficients have a small effect on the quality of the simulations provided that their ratios are conserved. These K values and the sequence are "apparent", although they are able to reproduce the experimental breakthrough curves with reasonable accuracy. This "apparent" character result from the joint effect of cation-exchange processes and other reactive processes not considered in this work, like CaC03 dissolution/precipitation.
Molecular diffusion is not important and the transport is dominated by vertical hydrodynamic dispersion, with a probable value of a=2 m, which integrates macroscopic features of the sediments. Since dispersivity is flow velocity dependent and not time dependent, the shape of the breackthrough curves does not allow to determinate the duration of the displacement process. Given the values of m, k1 and b1 (porosity, vertical permeability and thickness of the aquitard) and, for a head difference Ah, the advective displacement e during time t is:
e = k1 Ah q. t --t =-mb1 m
q = displacing fluid flow (neglecting density differences).
The same displacement can be justified by a constant value of k1 Ahjt since m and b1 are known. If Ah is fixed to historically known values the control is k1 jt, or q · t. Since k1
(or q) are not well known, t is arbitrary to some extent. Furthermore Ah or q have not been necessarily constant, neither during the upward flow period (changing sea level, variable

226 CHEMICAL ASPECTS
control head at the delta apex, variable water density in the aquitard column) nor during the drawdown from the 40's to the 70's and later fluctuations. The q values have changed accordingly, and then t values for a assumed q or k1 are only fitting results, approaching the reality only in relative terms.
To solve the problem a time-dependent value is needed, such as 140 age distribution in the lower part of the colum, if chemical and isotopic equilibrium corrections can be done and are meaningfull, or tritium distribution in the upper part of the column, if a reasonable value in the inflow water can be obtained.
7.- ACKNOWLEDGMENTS
The experimental phase of this study was carried out as part of project CCA 8309/007 of the Spanish-American Joint Committee for Science and Research, involving the U.S. Geological Survey (Reston, VA), the Complutense University (Madrid) and the Polytechnic University of Catalonia in colaboration with the Ourso Internacional de Hidrolog1a Subterranea (Barcelona). The last research steps have been carried out within projects PB-87-8042 and AMB-92-636 of the CICYT (Interministerial Commission for Science and Tecnology) as a support to similar studies in Doiiana area, Southern Spain. The study has received the support of the Water Authority of Catalonia (now Junta d'Aigiies) and the Water Supply Company (Sociedad General de Aguas) of Barcelona. The Civil Engineering School of the Polytechnic University of Catalonia has provided free access to its computer facilities.
8.- REFERENCES
Appelo, C.A.J. and A. Willemsen (1987). Geochemical calculations and observations on salt water intrusions. I: a combined geqchemical/mixing cell model. Journal of Hydrology, 94: 313-330.
Appelo, C.A.J.; A. Willemsen and J. Griffioen (1990). Geochemical calculations and observations on salt water intrusions. II: validation of a geochemical model with laboratory experiments. Journal of Hydrology, 120: 225-250.
Beekman, H.E. (1991). Ion chromatography offresh and seawater intrusion. Multicomponent Dispersive and Diffusive Transport in Groundwater. Thesis. Vrije Universiteit Amsterdam.
Bruggenwert, M.G. and A. Kamphorst (1979). Survey of experimental information on cation exchange in soil systems. In "Soil Chemistry, B: Physico-Chemical Models", edited by G.H. Bolt, Elsevier: 141-203.
Carrera, J.; Galarza, G. and Medina, A. (1992). User's guide for the INTERCAMBIO programme. Civil Engineering School, Polytechnic University of Catalonia. Barcelona (internal).

M. Manzano et al. 227
Custodio, E. (1981 ). Sea water encroachement in the Llobregat and Besos areas, near Barcelona (Catalonia, Spain). Sea Water Intrusion Meeting, Uppsala. Intruded and Fosil Groundwater of Marine Origin. Sveriges Geologiska Undersokning, Rapporter och Meddelanden 27: 949-976.
Custodio, E. (1992). Progresiva degradacion de la cantidad y calidad de los recursos de agua en el sistema acuifero del Bajo Llobregat. Anais 7° Congreso Brasileiro de Aguas Subterraneas. Belo Horizonte. Associacao de Aguas Subterraneas: 18-48.
Custodio, E.; A. Bayo and M.D. Pelaez (1971). Geoqulmica y datacion de aguas para el estudio del movimiento de las aguas subterraneas en el delta del Llobregat. Primer Congreso Hispano-Luso-Americano de Geologia Economica. Madrid-Lisboa. Seccion 6: 51-80.
Custodio, E. and Llamas, M.R. (1976). Hidrologia Subterranea. Ediciones Omega. Barcelona. 2 Vols, 1-2450.
Custodio, E. and Bruggeman, G. (1987). Groundwater problems in coastal areas. Studies and Reports in Hydrology, 45, UNESCO. Press: 1-596.
Custodio, E.; V. Iribar; M. Manzano and E. Skupien (1992). Utilizacion de istotopos ambientales en el Valle Bajo y Delta del rio Llobregat (Barcelona, Espana) para resolver problemas de flujo y de transporte de masa en los acuiferos, Isotope Techniques in Water Resources Development, 1991. Intern. Atomic Energy Agency, Vienna, IAEA-SM-319/26: 385-414.
Falkland, A.; Custodio, E. (1991). Hydrology and water resources of small islands: a practical guide. Studies and Reports in Hydrology, 49. UNESCO Press: 1-435.
Helfferich, F. (1962). Ion exchange. McGraw-Hill, New York.
lribar, V. and E. Custodio (1992). Advancement of seawater intrusion in the Llobregat delta aquifer. This book.
lribar, V.; E. Custodio and J. Carrera (1992). Modelling seawater intrusion in the Llobregat delta deep aquifer. This book.
Manzano, M. (1986). Estudio sedimentologico del prodelta holoceno del Llobregat. M.S. Thesis. University of Barcelona.
Manzano, M. (1981). Sintesis historica y estado actual de los trabajos sobre la hidrogeologia del Delta y Valle Bajo del rio Llobregat (Barcelona). Hidrogeologla. Estado Actual y Prospectiva. CIMNE-UPC. Barcelona: 203-228.
Manzano, M. and E. Custodio (1987). Muestreo de agua intersticial en acuitardos: aplicacion al delta del Llobregat. Hidrogeologla y Recursos Hidraulicos. Madrid. XII: 883-887.

228 CHEMICAL ASPECTS
Manzano, M.; E. Custodio and B.F. Jones (1990). Progress in the understanting of groundwater flow through the aquitard of the Llobregat delta (Barcelona, Spain). Prof. Homariz Homage Book, Facultad de Ciencias. Lisboa: 115-126.
Medina, A.; G. Galarza and J. Carrera (1989). Manual del porgrama TRANSIN-II. Simulaci6n y Estimaci6n de parametres en Flujo y Transporte en Medios Poroses. Civil Engineering School. Polytechnic University of Catalonia. Barcelona, 154 pp.
Ogata, A. and R.B. Banks (1961). A solution of the differential equation of longitudinal dispersion in porous media. U.S. Geol. Surv. Prof. Pap. 411-A: A1-A9.
Pelaez, M.D. (1983). Hidrodinamica en formaciones semipermeables a partir de la com posicion qulmica y radioisot6pica del agua intersticial: aplicaci6n a los limos intermedios del delta del Llobregat. Doctoral Disertation. College of Physics. University of Barcelona.
Rubin, J. (1983). Transport of reacting solutes in porous media: relation between mathematical nature of problem fromulation and chemical nature of reactions. Water Resources Research, 19(5): 1231-1252.
Van der Molen, W.H. (1958). The exchangable cations in soils flooded with seawater. Ph.D. Thesis Univ. Wageningen, Staatsalrukk. 'S-Gravenhabe: 1-167.
Valocchi, A.J.; R.L. Street and P.V. Roberts (1981). Transport of ion-exchanging solutes in groundwater: Chromatographic theory and field simulation. Water Resources Reseach, 17(5): 1517-1527.