studies on the development of lng industry in asia
TRANSCRIPT
Studies on the Development of LNG Industry in Asia-
Pacific Region in Recent Two Decades (1998 – 2017)
Presenters:
Peiguang WANG, Guojun YANG, Luyao SHENG, Jia CHEN, Binyi LIU
October 2018
1

PRESENTER* COMPANY/INSTITUTION
Guojun YANG Sinopec Group
Luyao SHENG Sinopec Group
Jia CHENFujian Province Development
and Reform Commission
Peiguang WANG Beijing Gas Group Ltd.
Binyi LIU CNOOC-Fujian LNG Co., Ltd.
(*From left to right)
2
China
Japan
South Korea
Indonesia
Australia
Outline
3
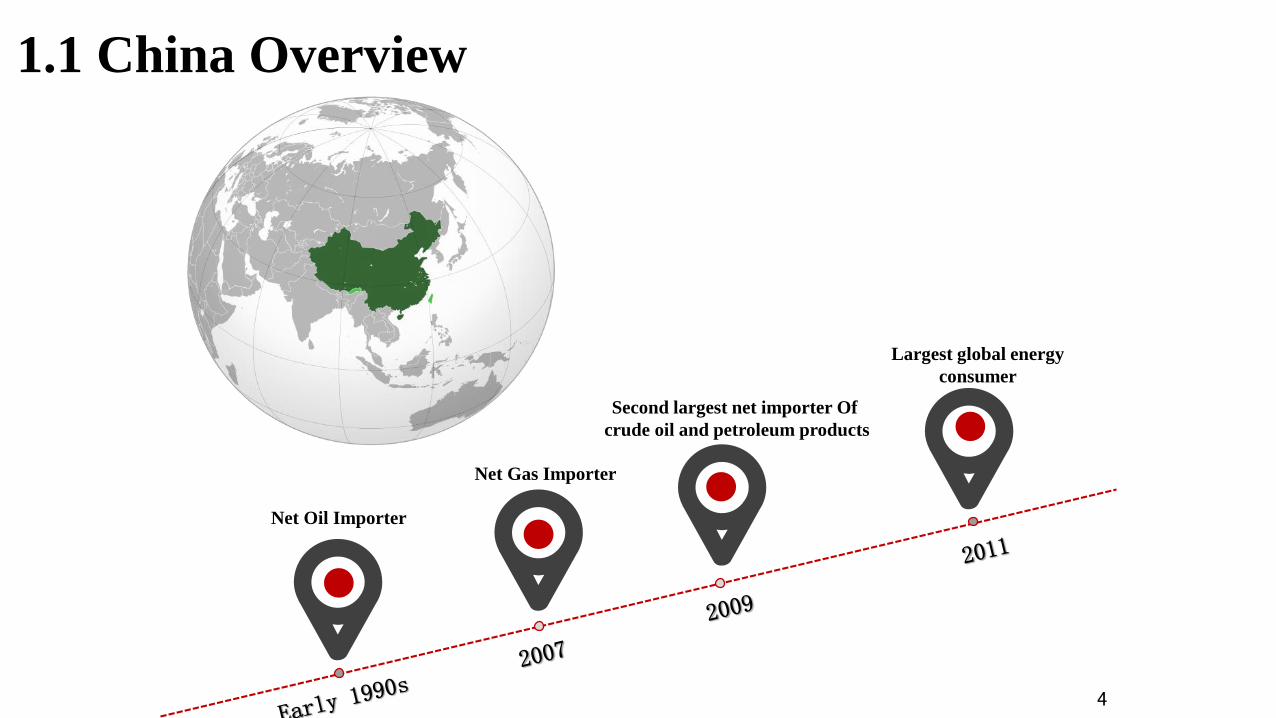
1.1 China Overview
4
Net Oil Importer
Second largest net importer Of
crude oil and petroleum products
Net Gas Importer
Largest global energy
consumer
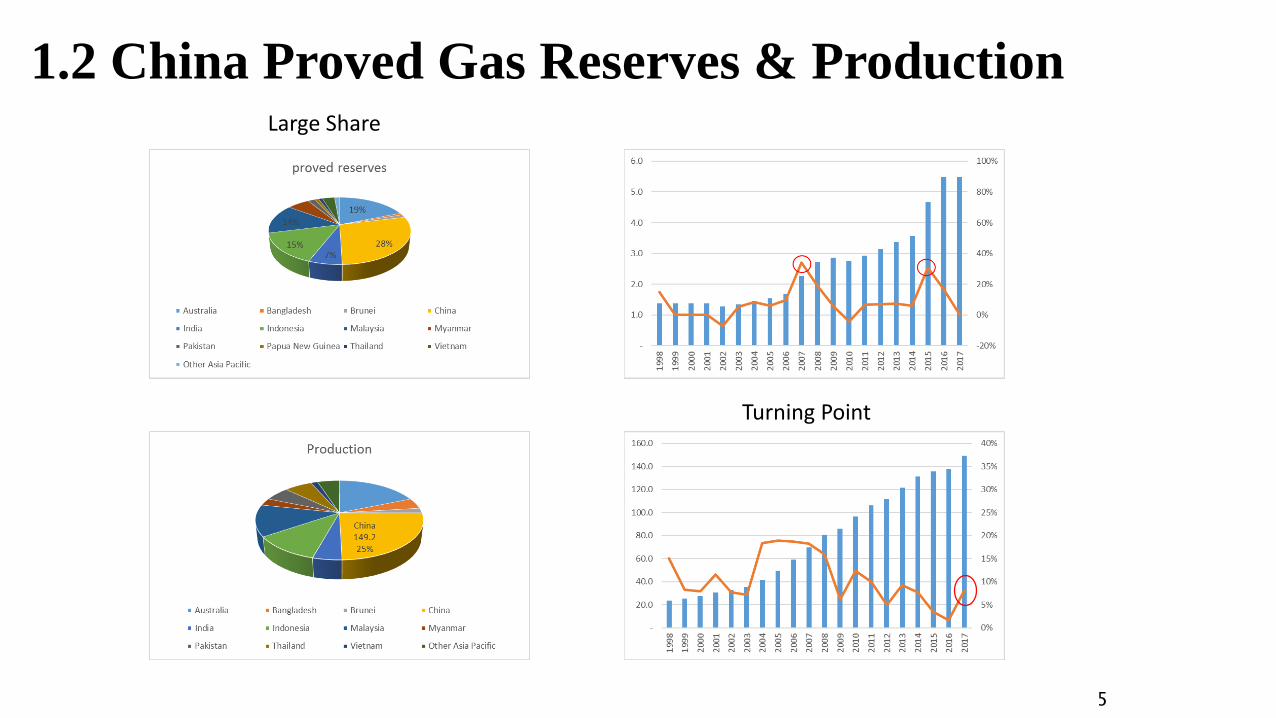
1.2 China Proved Gas Reserves & Production
5
Turning Point
Large Share

1.3 China Gas Consumption & Pricing
6
Highly competitive Domestic market
Oil linked Import LNG Market
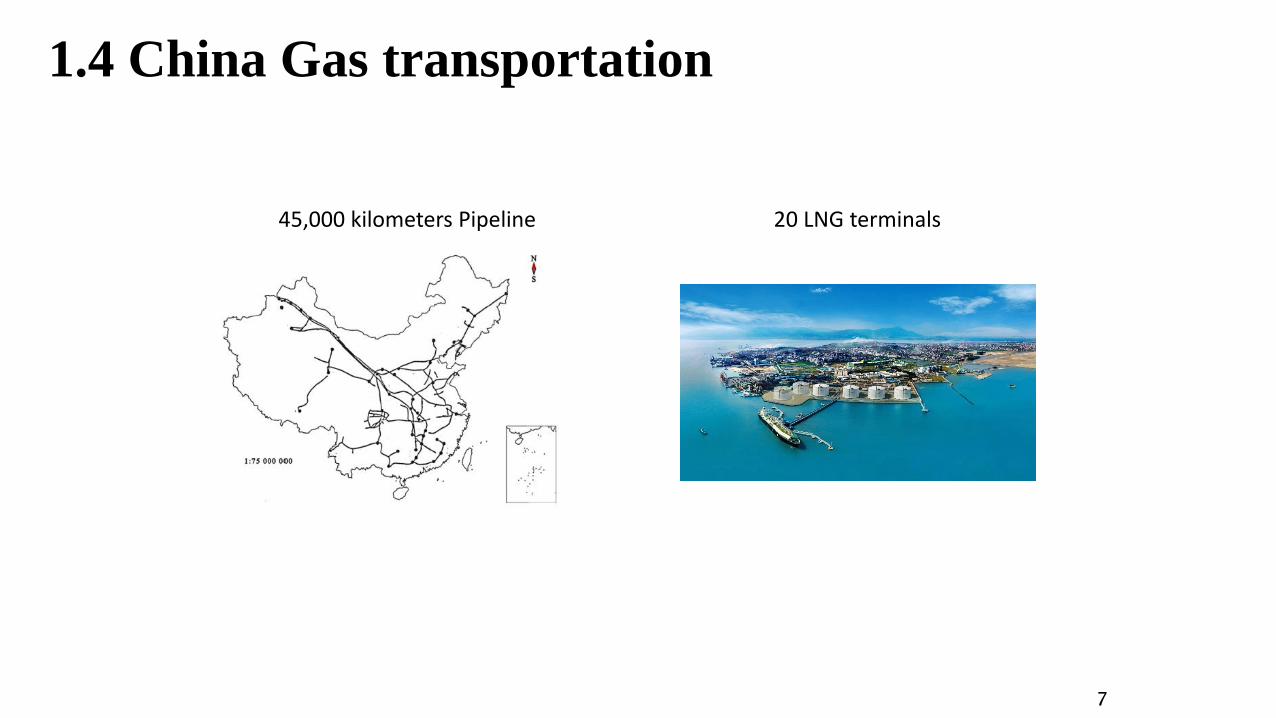
1.4 China Gas transportation
7
45,000 kilometers Pipeline 20 LNG terminals

2.1 JAPAN• An island country located in the Pacific Ocean
• The population of 127 million is the world's tenth largest.
• The third largest national economy in the world. A large industrial capacity.
• First began importing LNG, with imports from Alaska in 1969. a pioneer in the global LNG trade.
• The world's largest liquefied natural gas importer, accounted for 32% of the global market share of LNG demand in 2016.
Composition of Primary Energy Supply
8

2.2 THE SUPPLY SIDE
PROVED RESERVES: • limited domestic energy resources that have met less than 10% of the
country’s total primary energy use each year since 2012.
• According to the OGJ, Japan had 738 billion cubic feet (Bcf) of proved natural gas reserves as of January 2017.
PRODUCTION: • has been limited for more than a decade as a result of declining reserves.
• In 2015, production was about 100 Bcf, down from a high of about 140 Bcf in 2007, according to the International Energy Agency.
• Japanese oil companies have sought participation in exploration and production projects around the world.
9
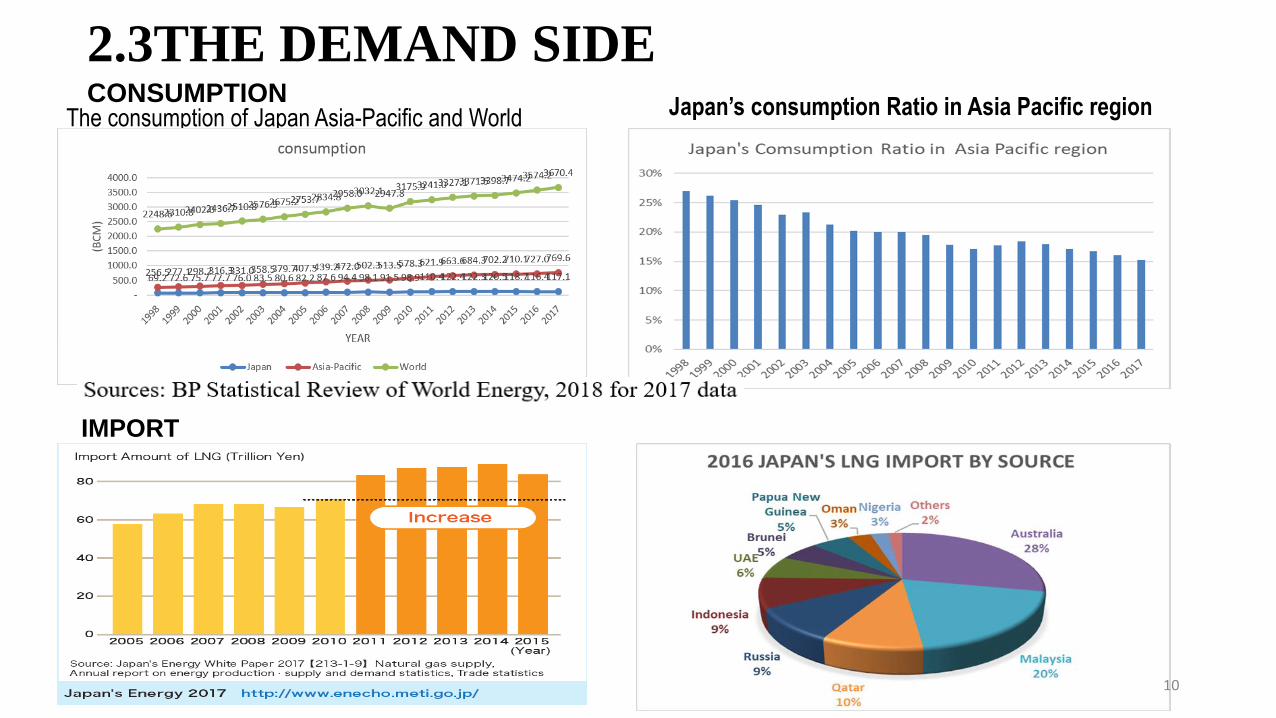
2.3THE DEMAND SIDE CONSUMPTION
The consumption of Japan Asia-Pacific and World Japan’s consumption Ratio in Asia Pacific region
IMPORT
10

2.3 THE DEMAND SIDE
IMPORTER
• Sector organization: Inpex and other companies created from the former Japan National Oil Company. Mitsubishi, Mitsui, and various other Japanese companies. Osaka Gas, Tokyo Gas, Toho Gas
TRANSPORT
• More than 30 LNG import terminals, a total natural gas send-out capacity of 9.7 Tcf/y as of 2016.
• The largest LNG storage tank capacity in the world, holding 590 MMcf.
• Most of the LNG terminals are located in the main population centers and near major urban.
• Lacks extensive gas pipeline infrastructure, relies on LNG imports in many coastal demand centers, uses LPG in other areas.
11

2.4 PRICING• In the Asia-Pacific, except for the LNG price of some Indonesian exports linked to the
Indonesian oil production price index, other LNGs are mostly linked to the Japanese integrated crude oil price (JCC).
• LNG price (in US$/MMBtu)=slope X JCC + alpha
e.g. = 0.1485 X $50 + 0.10
=US$7.525/mmBtu
Other prices:
• some LNG contracts are based on U.S. natural gas market prices.
12

3.1 South Korea Overview
13
• South Korea is an energy-intensive nation,
relying on imports to meet about 98% of its
fossil fuel consumption .
• South Korea was the world’s eighth largest
energy consumer in 2017, ranking No.3 in
the list of LNG import countries.

3.2 South Korea Proved Reserves and Production
14
• Proved reserve: up to 50,000 million cubic
meters in 2008, and has declined to 7,079
million cubic meters in 2013
• Production from the the Ulleung Basin began in
2004, reaching a peak of 651,000,000 cubic
meters in 2009 and declining since then.

3.3 South Korea Consumption and Pricing
15
• South Korea consumed 1.7 tcf of dry natural gas
in 2017.
• Power generation accounted for about half of the
consumption.
0.00
2.00
4.00
6.00
8.00
10.00
12.00
14.00
16.00
18.00
19
86年
19
89年
19
91年
19
93年
19
95年
19
96年
19
98年
20
00年
20
01年
20
02年
20
03年
20
04年
20
05年
20
06年
20
07年
20
08年
20
09年
20
10年
20
11年
20
12年
20
13年
20
14年
20
15年
20
16年
• Prices are mainly driven by supply and demand,
which are also linked to the price of crude oil and
relevant petroleum products.
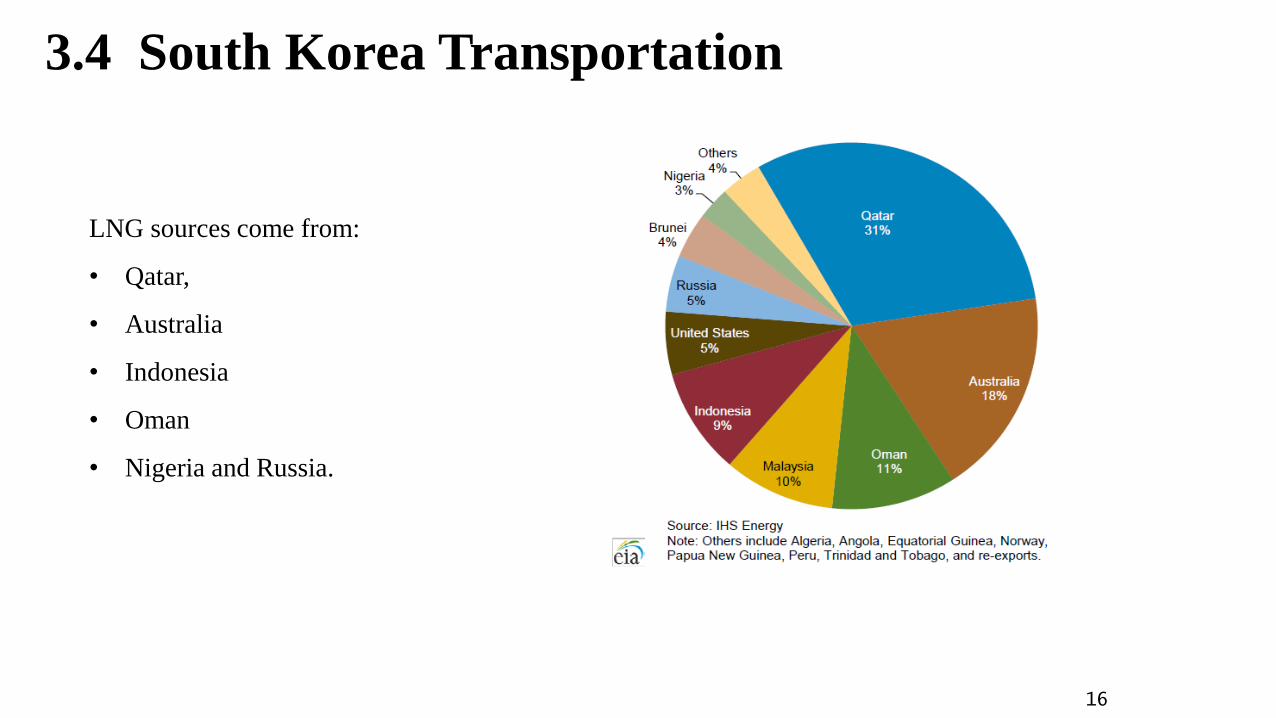
3.4 South Korea Transportation
16
LNG sources come from:
• Qatar,
• Australia
• Indonesia
• Oman
• Nigeria and Russia.

4.1 Indonesia Overview
◆ Indonesia is a Southeast Asian country and the largest
archipelagic country in the world.
◆ Indonesia's development of LNG has always been at
the leading level in the world.
• 1977: started exporting
• 1984~2005: the largest exporter of LNG in the
world.
• 2017: Indonesia’s export of LNG ranked fifth in
the world.
Islands: 17508
Land: 1.904 million square kilometers
Ocean: 3.166 million square kilometers
17

4.2 Indonesia Proved Gas Reserves
◆ Indonesia is relatively rich in natural gas resources.
• The proven reserves of natural gas ranked the third in
the Asia-Pacific region. which accounted for about 15%
of the total in the Asia-Pacific region in 2017.
◆ Natural gas exploration efforts were relatively
inadequate in recent years.
• The proportion of natural gas proven reserves in the
Asia-Pacific region has declined gradually from 25% to
15%.
2.2
2.7 2.7
2.6 2.6 2.6
2.8
2.5
2.7
3
3.2
3.1
3 3 3
2.9 2.9
2.8
2.9 2.9
25.00%
15.00%
0.00%
5.00%
10.00%
15.00%
20.00%
25.00%
30.00%
2
2.2
2.4
2.6
2.8
3
3.2
3.4
19
98
19
99
20
00
20
01
20
02
20
03
20
04
20
05
20
06
20
07
20
08
20
09
20
10
20
11
20
12
20
13
20
14
20
15
20
16
20
17
Indonesia Natural Gas Proved Reserves(Trillion cubic metres)
Proved Reserves Share in Asia Pacific
18

4.3 Indonesia Gas Production and Consumption
65.671.170.768.6
75.679.2
75.776.375.472.674.8
78
8782.7
78.377.676.476.270.7
68
26.70%
11.20%
5.00%
10.00%
15.00%
20.00%
25.00%
30.00%
35.00%
40
50
60
70
80
90
Indonesia Natural Gas production(Billion cubic metres)
Natural Gas production Share in Asia Pacific
29.825.4
21.97 19.9
10
20
30
40
1999 2004 2011 2016
1999-2017 Indonesia's production of LNG
29.9
32.5 3334.1
37.1
39.6
36.236.437.1
34.6
39.7
42.144
42.742.941.441.5 41
38.339.2
11.7%
5.1%
2.0%
6.0%
10.0%
14.0%
18.0%
15
20
25
30
35
40
45
50
1998-2017 Indonesia Natural Gas consumption(Billion cubic metres)
consumption Share in Asia Pacific
◆ Production: The share of Indonesia's natural gas and LNG in the world has gradually declined.
◆ Consumption: Although the total consumption of natural gas has increased slightly, the proportion of
consumption in the Asia Pacific region has gradually decreased. According to Reuters, Indonesia will become a net
importer of LNG in the future. 19

4.4 Indonesia Gas transportation
70%
Japan
15%
Korea
15%
chinese
Taiwan
19.3%
chinese
Mainland
13.3%
chinese…
40.8%
Japan
22.4%
Korea
2.8% others
LNG export situation in 2008 LNG export situation in 2017
The export direction of Indonesia's LNG has changed. ◆More than 80% of LNG in the country were used for export.
◆ Exporting countries had become more diversified.
◆ Share and direction of transactions have been constantly
changing.
◆ It is expect to change from LNG net exporter to net
importer in the future.
26.85 26
31.3629.2
2522.4 21.7 21.9 21.2 21.7
11.9%10.7%10.5%
8.8%7.6% 6.9% 6.5% 6.5% 6.1% 5.5%
2.0%
6.0%
10.0%
14.0%
18.0%
0
5
10
15
20
25
30
35
40
2008 2009 2010 2011 2012 2013 2014 2015 2016 2017
2008-2017 Indonesia LNG exports(Billion cubic metres)
export volume share of global export
Indonesia's LNG is export oriented◆ 1984- 2006, Indonesia's LNG exports rank first in the
world.
◆ Over the past 8 years, Indonesia's exports of LNG and
its share of global exports have declined.
◆ In 2017, Indonesia's LNG exports were 21.7 Bcm,
accounted for 5.5% of global LNG exports.
20

Source: https://en.wikipedia.org/wiki/Australia
5.1 PROVED RESERVES
Source: Australia Energy Resources Assessment 2018
7,617,930 km2 (6th)
25 million
13th economy
2nd LNG exporter (2017)
Gas Reserves Distribution
21

5.2 PRODUCTION
Source: BP Statistical Review of World Energy 2018
Source: Department of Industry, Innovation and Science 2017
Source: Resources and Energy Quarterly June 2018
LNG Projects Distribution
Natural Gas Production & Consumption Trends
In Recent Decades (1998 – 2017)
22
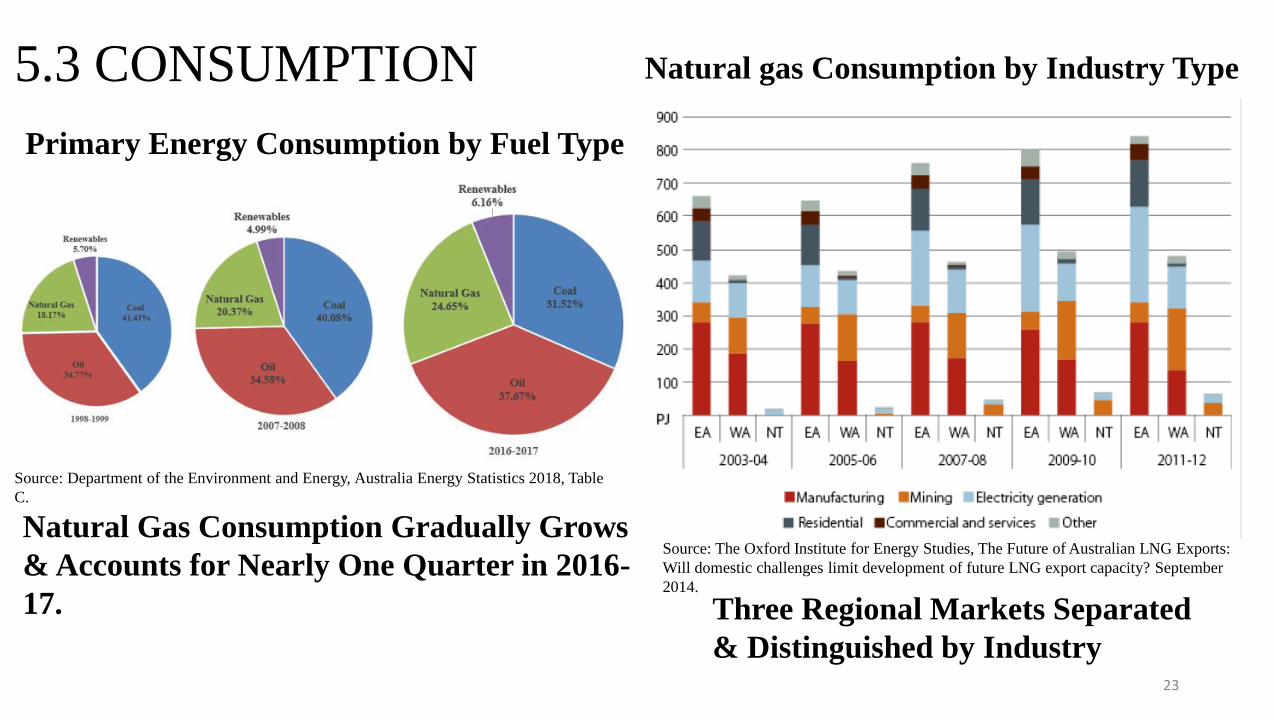
5.3 CONSUMPTION
Source: Department of the Environment and Energy, Australia Energy Statistics 2018, Table
C.
Source: The Oxford Institute for Energy Studies, The Future of Australian LNG Exports:
Will domestic challenges limit development of future LNG export capacity? September
2014.
Natural Gas Consumption Gradually Grows
& Accounts for Nearly One Quarter in 2016-
17. Three Regional Markets Separated
& Distinguished by Industry
Primary Energy Consumption by Fuel Type
Natural gas Consumption by Industry Type
23
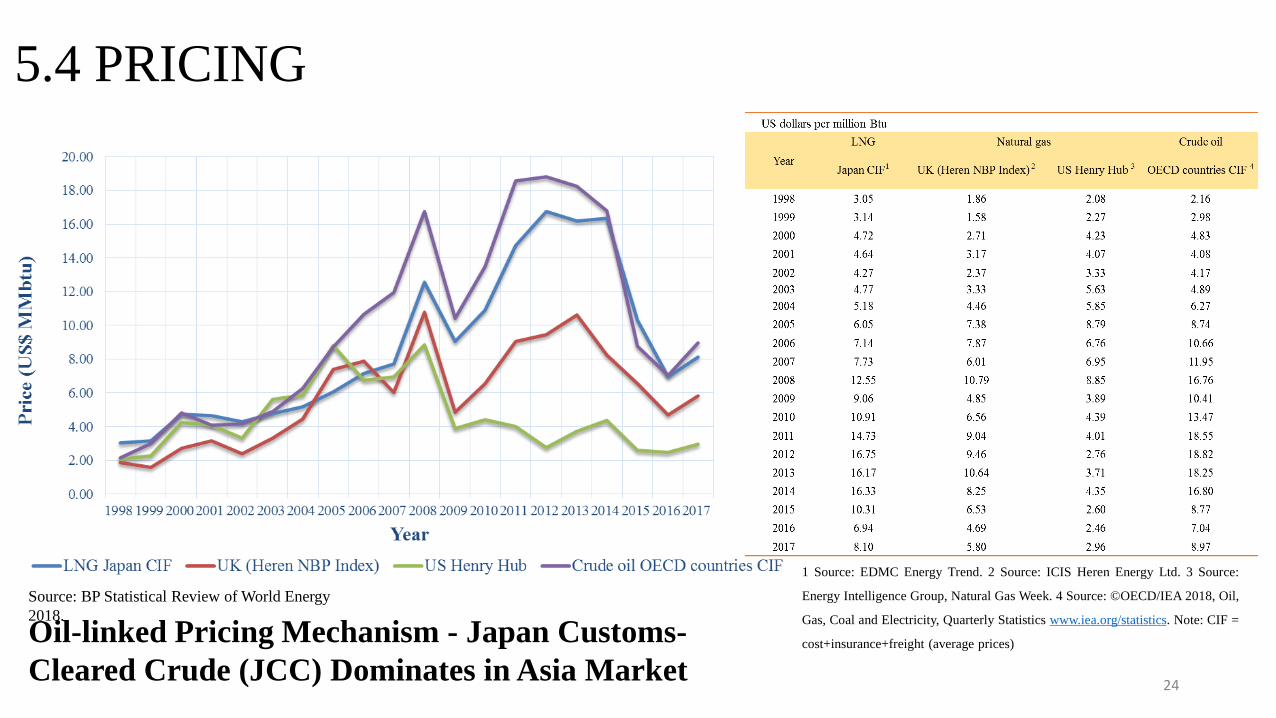
5.4 PRICING
Source: BP Statistical Review of World Energy
2018.
Oil-linked Pricing Mechanism - Japan Customs-
Cleared Crude (JCC) Dominates in Asia Market
1 Source: EDMC Energy Trend. 2 Source: ICIS Heren Energy Ltd. 3 Source:
Energy Intelligence Group, Natural Gas Week. 4 Source: ©OECD/IEA 2018, Oil,
Gas, Coal and Electricity, Quarterly Statistics www.iea.org/statistics. Note: CIF =
cost+insurance+freight (average prices)
24
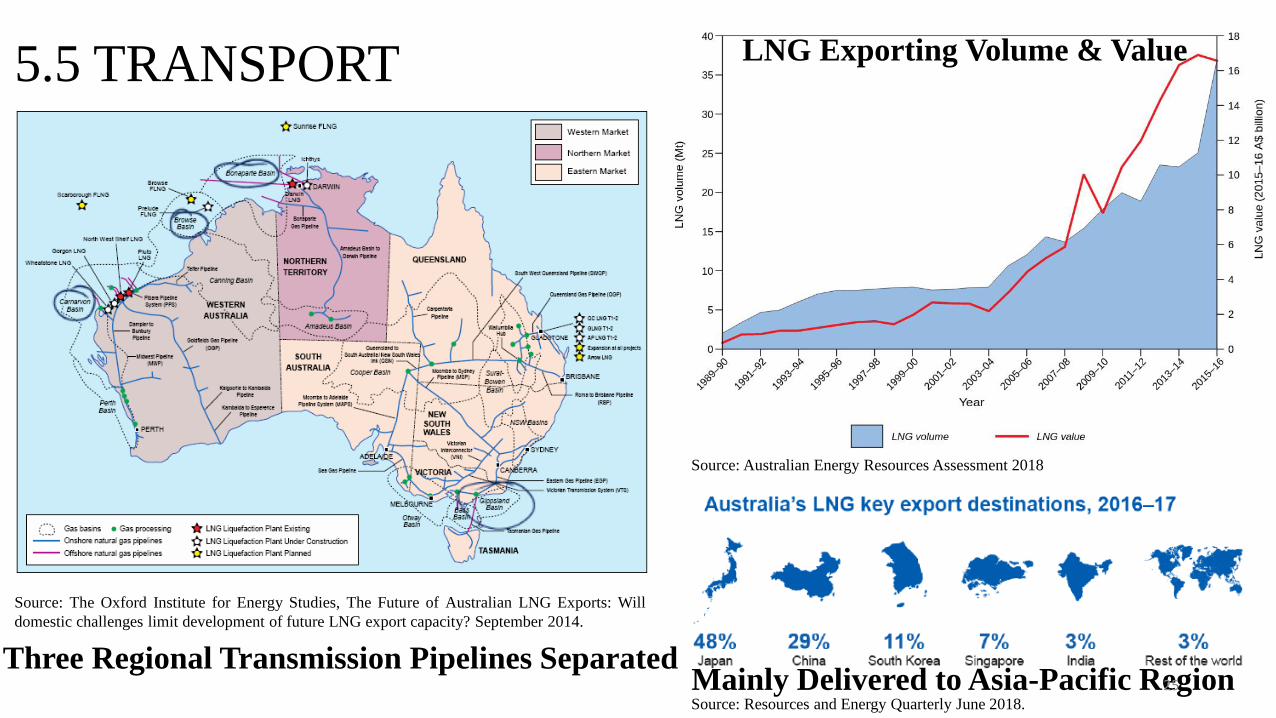
5.5 TRANSPORT
Source: The Oxford Institute for Energy Studies, The Future of Australian LNG Exports: Will
domestic challenges limit development of future LNG export capacity? September 2014.
Source: Resources and Energy Quarterly June 2018.
Source: Australian Energy Resources Assessment 2018
Three Regional Transmission Pipelines Separated
LNG Exporting Volume & Value
Mainly Delivered to Asia-Pacific Region 25
6 SUMMARY(1) China will actively implement the Paris climate agreement to reduce carbon dioxide emissions in the
coming years by increasing the proportion of natural gas in primary energy consumption. And the natural gas
industry will enter a golden period of development.
(2) Japan is the world’s largest LNG importer. Many Japanese oil companies have sought participation in
exploration and production projects around the world. Japan’s energy demand and strategy have a considerable
impact on the Asia-Pacific region and the world.
(3) South Korea is lack of domestic energy resources, relying on imports to meet domestic energy
consumption. LNG imports are mainly from Qatar, Oman, Nigeria, Russia, and Australia.
(4) Indonesia is an important LNG producer and exporter, which has relatively abundant resources. In
terms of natural gas demand growing fast, it is expected to become a net LNG importer in the future.
(5) Based on abundant reserves being progressively developed for domestic use and exporting in LNG projects,
Australia’s LNG exports mainly delivered to Asia-Pacific region overtaking Qatar as the world NO.1 is
becoming realistic and closer.
26

27
QUESTIONS