regional case studies: asia and pacific region - … case studies: asia and pacific region ......
TRANSCRIPT
p. 1
Regional Case Studies: Asia and Pacific Region
Jürgen ScheffranInstitute of Geography, CliSAP/CEN, Universität Hamburg
Climate and SocietyLecture 8, January 7, 2016

p. 2
07.01. Regional case studies: Asia and Pacific region
Question: Will risks to human security in the Asia-Pacific region lead to more conflict? What is the difference to Africa?
Recommended readings:
Sections 7.5, 7.6 & 7.7 of: WBGU 2007. World in Transition – Climate Change as aSecurity Risk, German Advisory Council on Global Change, Berlin: Springer.
Background material (optional):S. Aneel, U.T. Haroon, I. Niazi (eds.) (2014) Sustainable Development in South Asia: Shaping the Future, Sustainable Development Policy Institute, Islamabad and Sang-e-Meel Publishers. https://sdpi.org/publications/files/SDCAnthology2012--Shapingthe-Future.pdf.
R. Lal, M.V.K. Sivakumar, S.M.A. Faiz, A.H.M. Mustafizur Rahman, K.R. Islam (eds.) (2011) Climate Change and Food Security in South Asia, Springer.
ADB (2009) Building climate resilience in the agriculture sector in Asia and the Pacific, Asian Development Bank and International Food Policy Research Institute.EACH-FOR (2008) Environmental Change and Forced Migration Scenarios, General Overview Study NIS and Central Asia.
J. Hay, N. Mimura (2006) Supporting climate change vulnerability and adaptation assessments in the Asia-Pacific region: an example of sustainability science, Sustainability Science (1):23–35.
C. Jasparro, J. Taylor (2008) Climate Change and Regional Vulnerability to Transnational Security Threats in Southeast Asia, Geopolitics, 13:232–256.

p. 3
Conflict constellations in climate hotspots
Source: WBGU 2007
p. 4
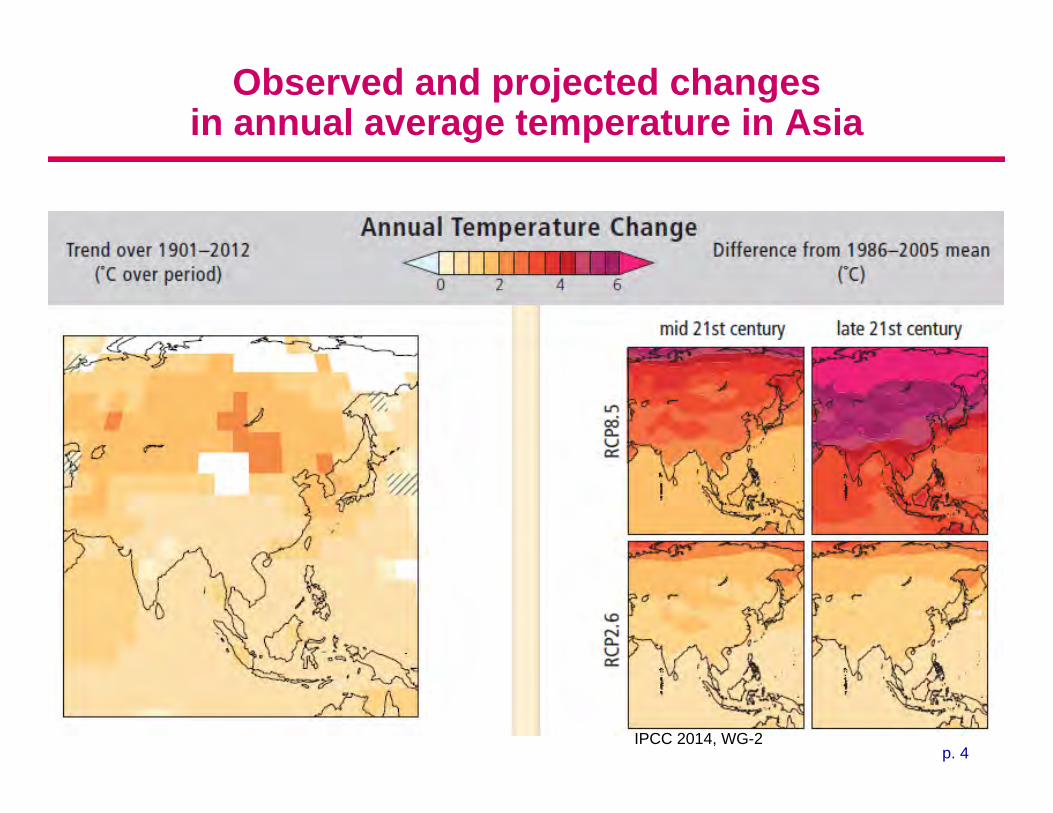
Observed and projected changes in annual average temperature in Asia
IPCC 2014, WG-2

p. 5
Observed and projected changes in annual precipitation in Asia
IPCC 2014, WG-2
p. 6
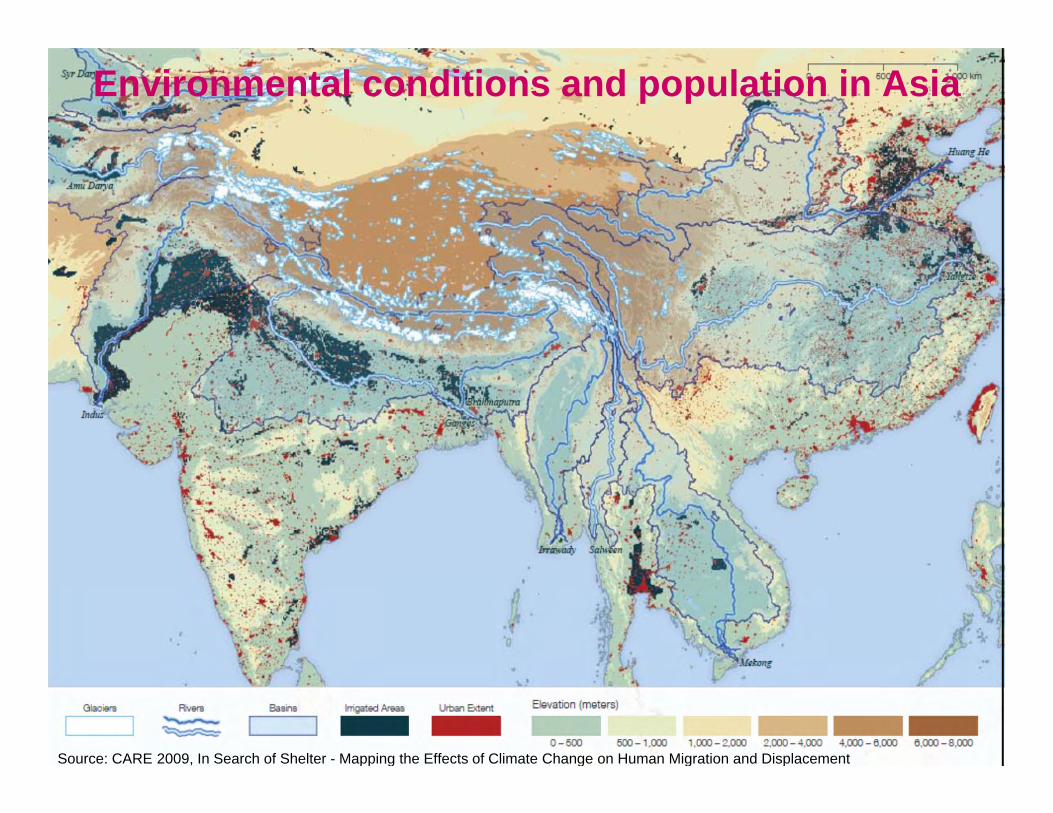
Environmental conditions and population in Asia
Source: CARE 2009, In Search of Shelter - Mapping the Effects of Climate Change on Human Migration and Displacement
p. 7
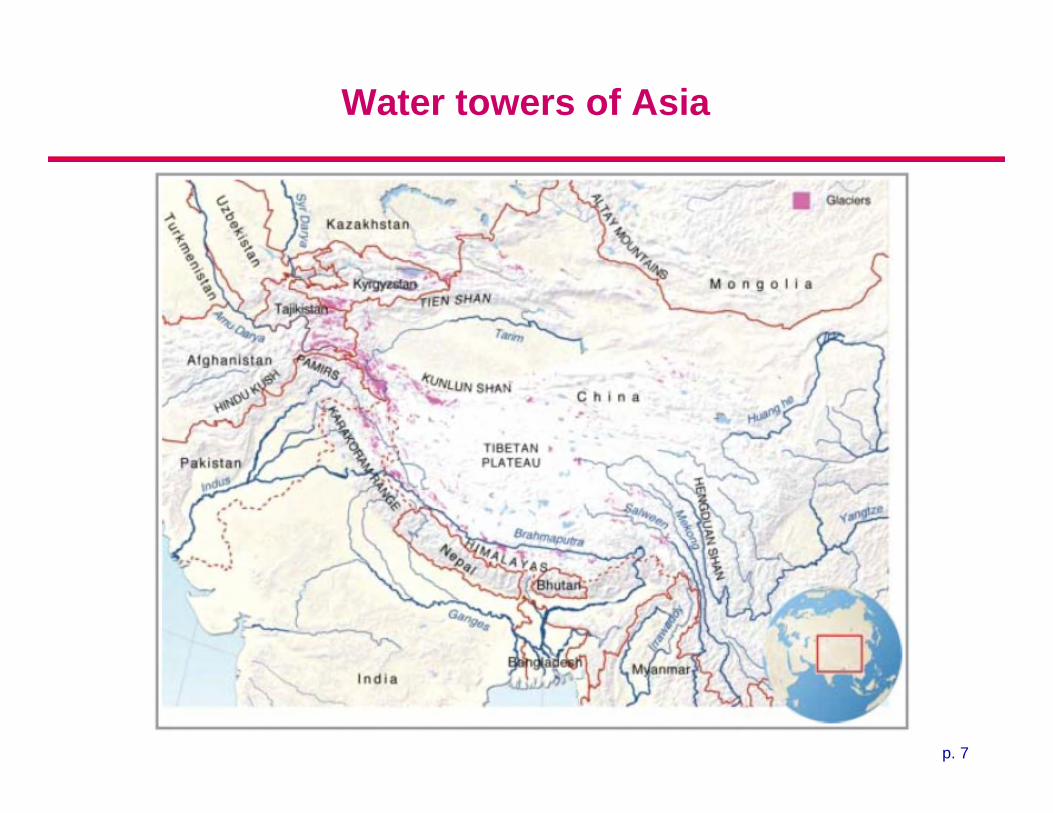
Water towers of Asia

p. 8
Glaciers and water supply in the Himalaya region
• Glaciers store water during winter months and feed rivers during summer months, regulating water flow downstream.
• Globally, glaciers are retreating in parts of the region. As storage capacity is lost, flooding risks increase, which can affect rural agriculture and urban areas in river deltas.
• Disappearing glaciers no longer release water during summer months, decrease water supply and untimely flows, coming in the wrong (non-cropping) season.
Himalayas-Hindukush-Karakoram are Water Towers of Asia: Glacier-fed rivers from mountains are largest river run-off from a single location in the world.
• Some of the world's major rivers originate in the Himalayas, and their combined drainage basin is home to almost half of the world's population.
• Retreat of Himalayan glaciers makes downstream populations particularly vulnerable.
• Indus River valley supports one of the largest irrigation works in the world (16.2m ha).
• Approximately 90 percent of Pakistan’s crop production is grown under irrigation, and all of the water comes from barrages along the Indus.
• The Ganges, Yangtze, and Yellow Rivers also have large areas under irrigation —17.9m ha, 5.4m ha, and 2.0m ha. Source: CARE 2009
p. 9
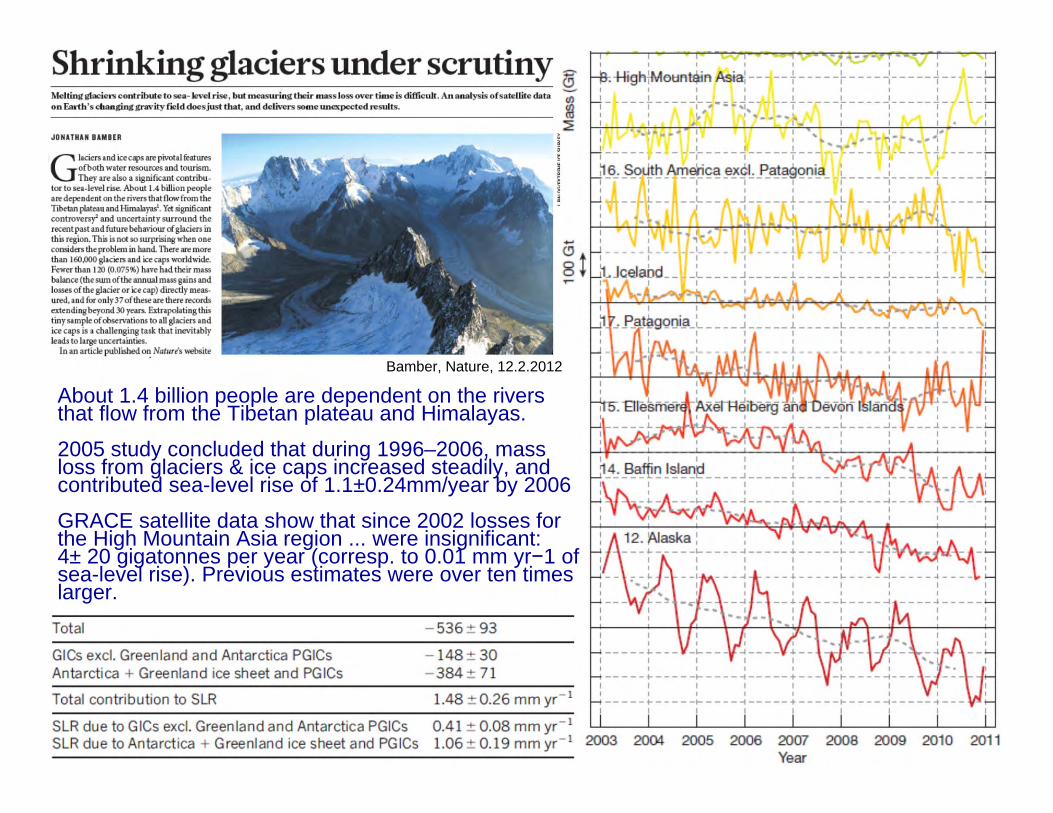
About 1.4 billion people are dependent on the rivers that flow from the Tibetan plateau and Himalayas.
2005 study concluded that during 1996–2006, mass loss from glaciers & ice caps increased steadily, and contributed sea-level rise of 1.1±0.24mm/year by 2006
GRACE satellite data show that since 2002 losses for the High Mountain Asia region ... were insignificant: 4± 20 gigatonnes per year (corresp. to 0.01 mm yr−1 of sea-level rise). Previous estimates were over ten times larger.
Bamber, Nature, 12.2.2012
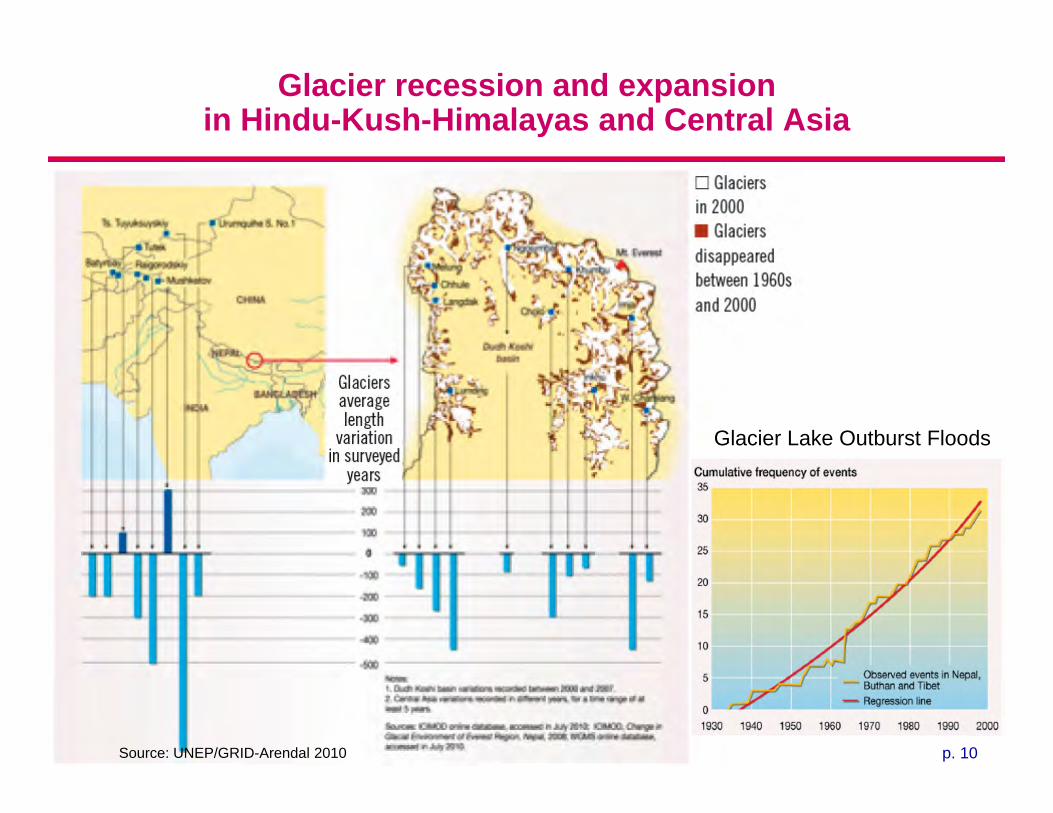
p. 10Source: UNEP/GRID-Arendal 2010
Glacier recession and expansion in Hindu-Kush-Himalayas and Central Asia
Glacier Lake Outburst Floods
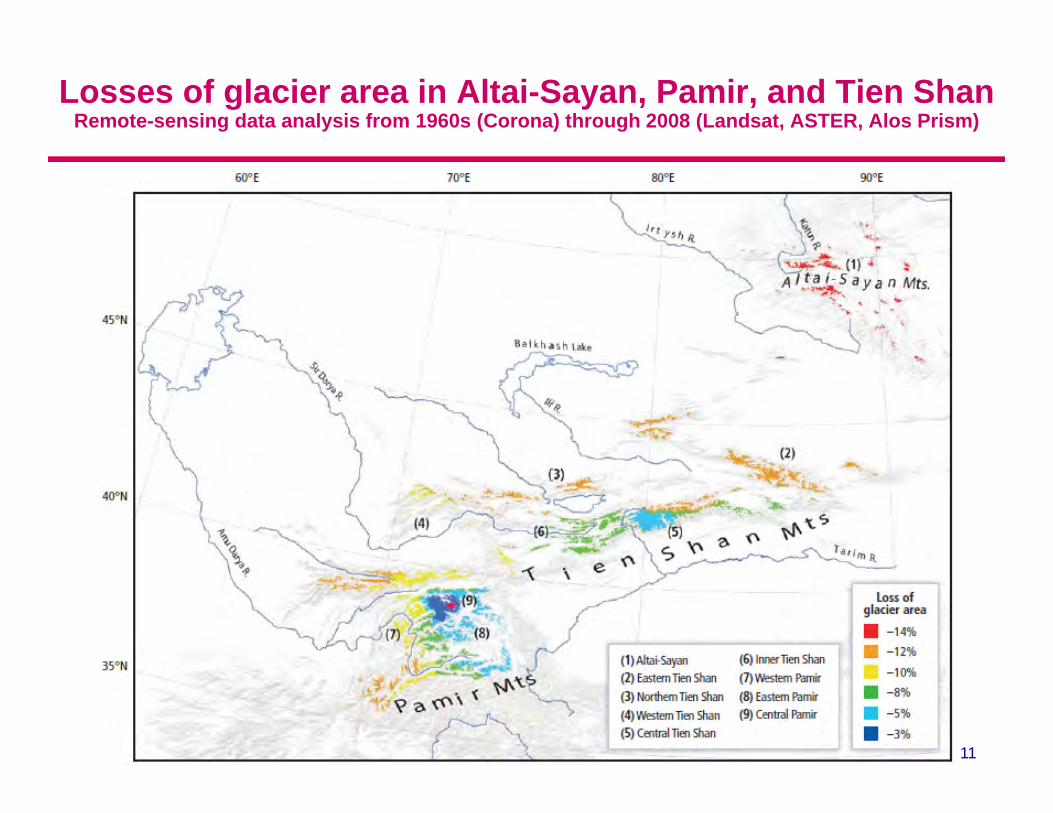
p. 11
Losses of glacier area in Altai-Sayan, Pamir, and Tien ShanRemote-sensing data analysis from 1960s (Corona) through 2008 (Landsat, ASTER, Alos Prism)
p. 12
Hydropower water storage
Only alternative for seasonal water storage are dams: Hydropower installations along the Mekong and Yangtze are significant suppliers of electricity to urban markets.
The Three Gorges Dam on the Yangtze, the world’s largest hydroelectric installation, will have a power generation capacity of 22,500 MW once all generators are installed, more than 20 times the capacity of an average coal-fired or nuclear power plant. The project has displaced 1–2 million people.
Plans are underway to add significant hydropower generating capacity to the Mekong over the coming decades. Under scenarios of rapid glacier melt, hundreds more water retention dams may be constructed, with significant impacts on downstream flow regimes and deltas, which are already starved of flood waters and replenishing sediment.
Costly to construct and can have significant environmental and social impacts, resulting in displacement of thousands or even millions of people.
Population displacement and resettlement will become larger issues in these areas at significant scales.
p. 13
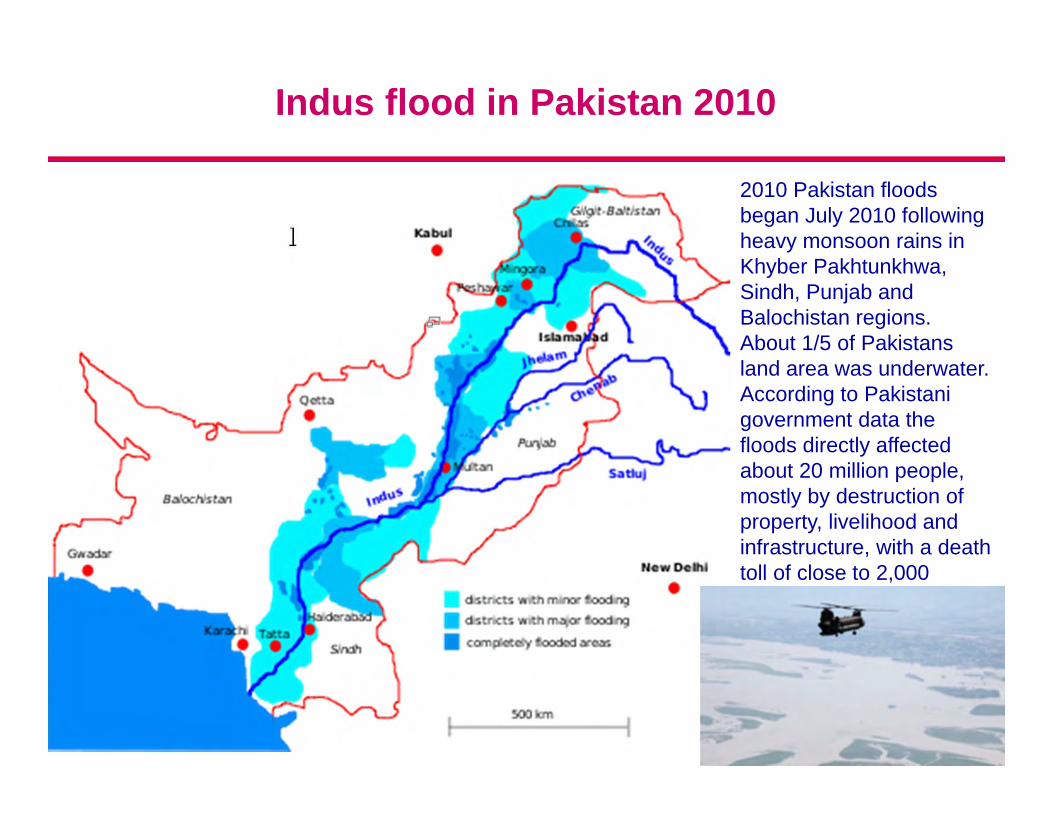
Indus flood in Pakistan 2010
]
2010 Pakistan floods began July 2010 following heavy monsoon rains in Khyber Pakhtunkhwa, Sindh, Punjab and Balochistan regions. About 1/5 of Pakistans land area was underwater.According to Pakistani government data the floods directly affected about 20 million people, mostly by destruction of property, livelihood and infrastructure, with a death toll of close to 2,000
p. 14
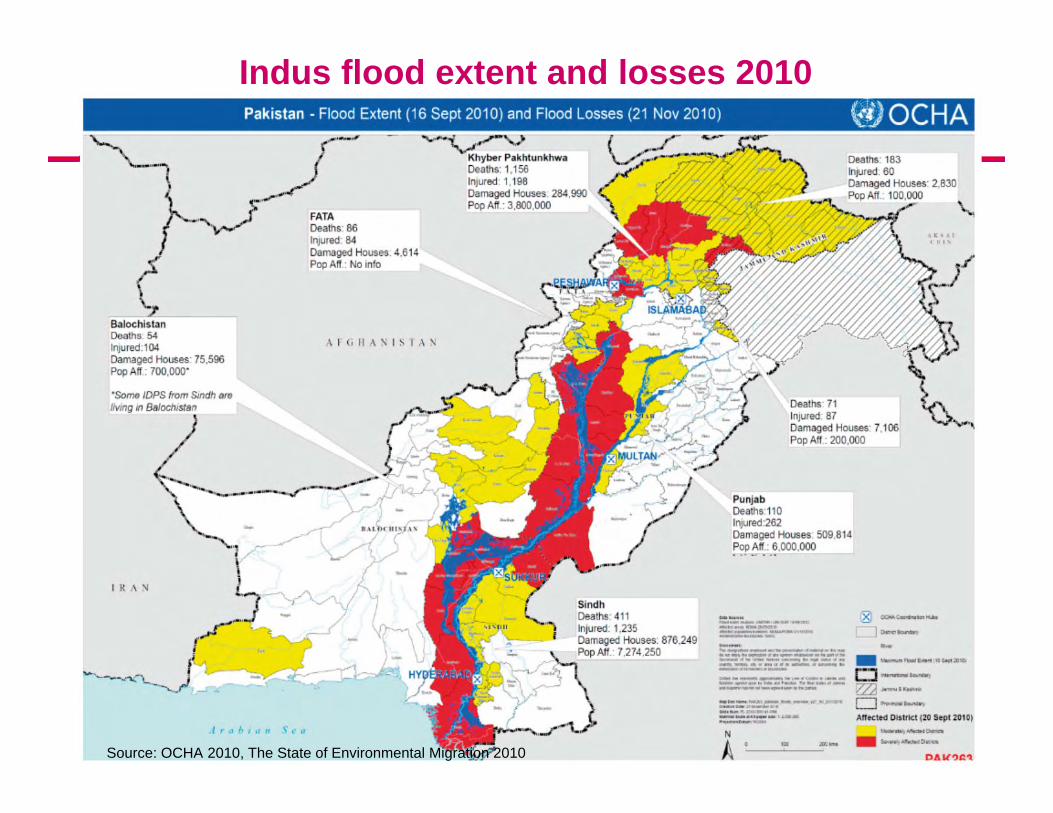
Indus flood extent and losses 2010
Source: OCHA 2010, The State of Environmental Migration 2010
p. 15
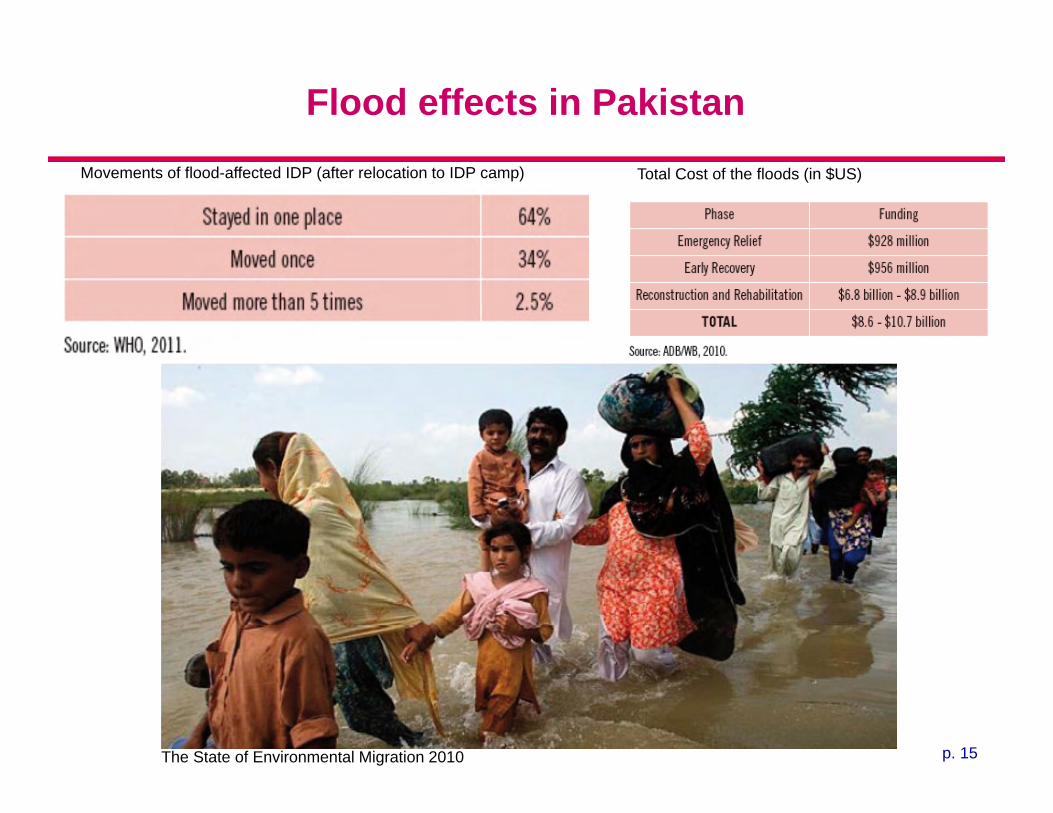
Flood effects in PakistanMovements of flood-affected IDP (after relocation to IDP camp) Total Cost of the floods (in $US)
The State of Environmental Migration 2010
p. 16
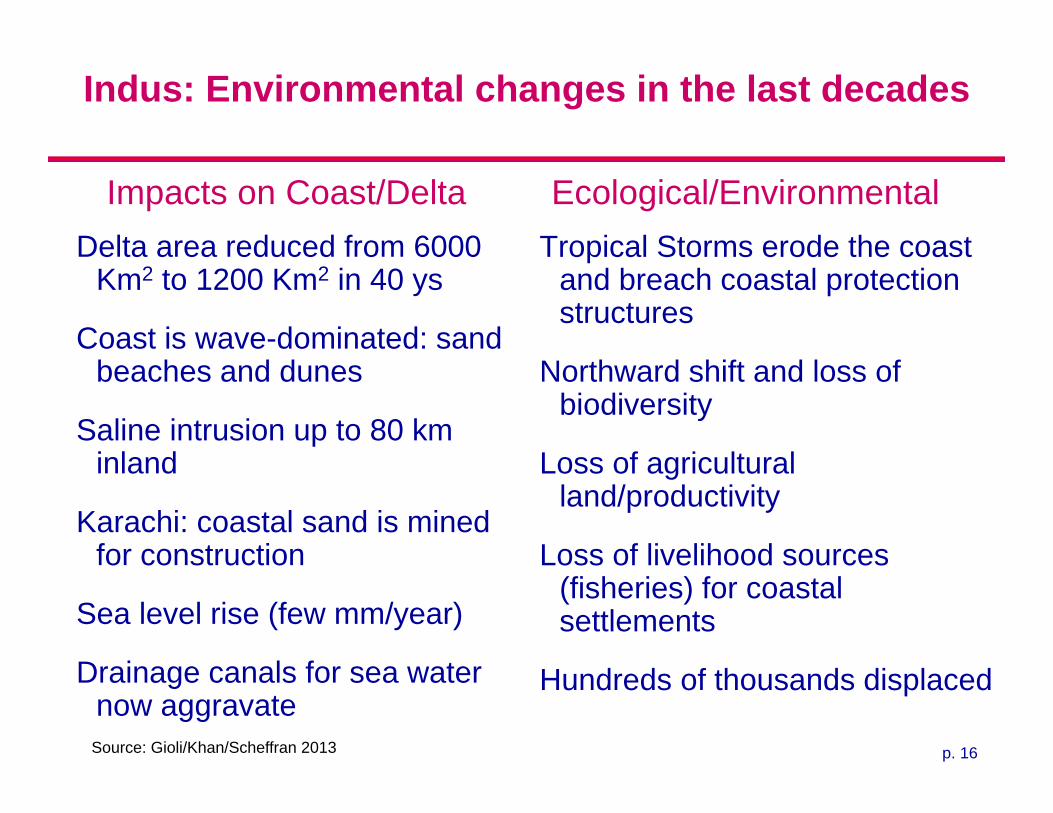
Indus: Environmental changes in the last decades
Delta area reduced from 6000 Km2 to 1200 Km2 in 40 ys
Coast is wave-dominated: sand beaches and dunes
Saline intrusion up to 80 km inland
Karachi: coastal sand is mined for construction
Sea level rise (few mm/year)
Drainage canals for sea water now aggravate
Tropical Storms erode the coast and breach coastal protection structures
Northward shift and loss of biodiversity
Loss of agricultural land/productivity
Loss of livelihood sources (fisheries) for coastal settlements
Hundreds of thousands displaced
Impacts on Coast/Delta Ecological/Environmental
Source: Gioli/Khan/Scheffran 2013
p. 17
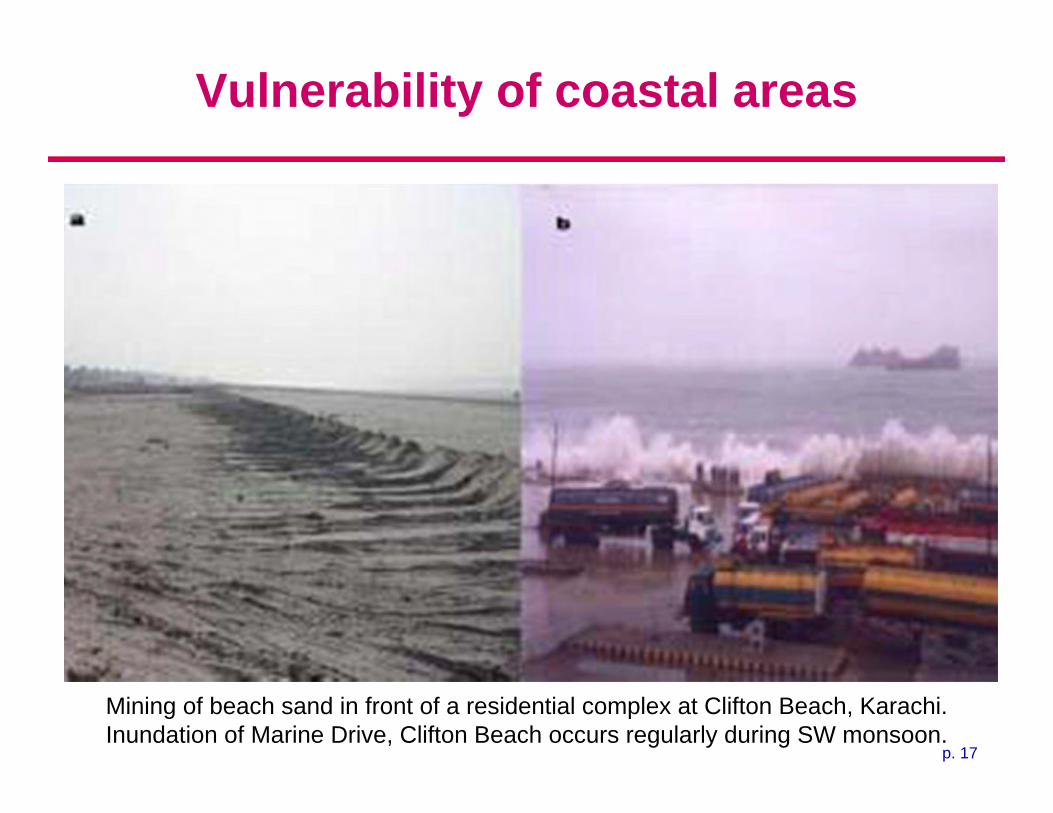
Vulnerability of coastal areas
Mining of beach sand in front of a residential complex at Clifton Beach, Karachi. Inundation of Marine Drive, Clifton Beach occurs regularly during SW monsoon.
p. 18
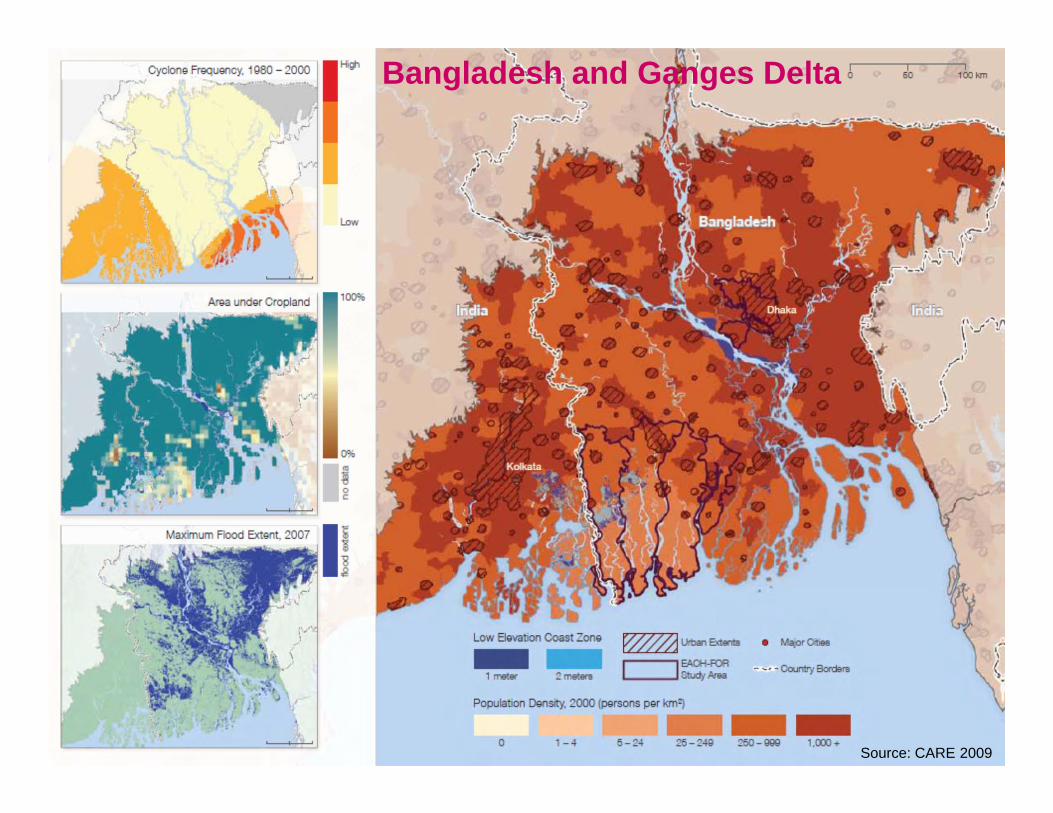
Bangladesh and Ganges Delta
Source: CARE 2009
p. 19
Bangladesh and the Ganges Delta
Bangladesh contains seven major and over two hundred minor rivers which define the delta geography of Bangladesh and the way of life of its people.
Bangladesh is one of the most densely populated countries in the world, and a large part of its people depends on natural resources for their livelihoods.
Although flooding is part of the livelihood structure and culture, climate change will accelerate change in this already dynamic environment and leave millions of Bangladeshis exposed to increased flooding, severe cyclones, and sea level rise.
More than 5 million Bangladeshis live in areas highly vulnerable to cyclones and storm surges, and over half the population lives within 100 km of the coast, most of which is less than 12 meters above sea level.
The Ganges delta supported a population of 144 million in 2000, out of which 9.4 million lived in areas that would be inundated by a 2 meter sea level rise.
The delta has 8.5 million ha of agricultural lands, of which 486 thousand ha would be inundated by a 2 meter sea level rise.
p. 20
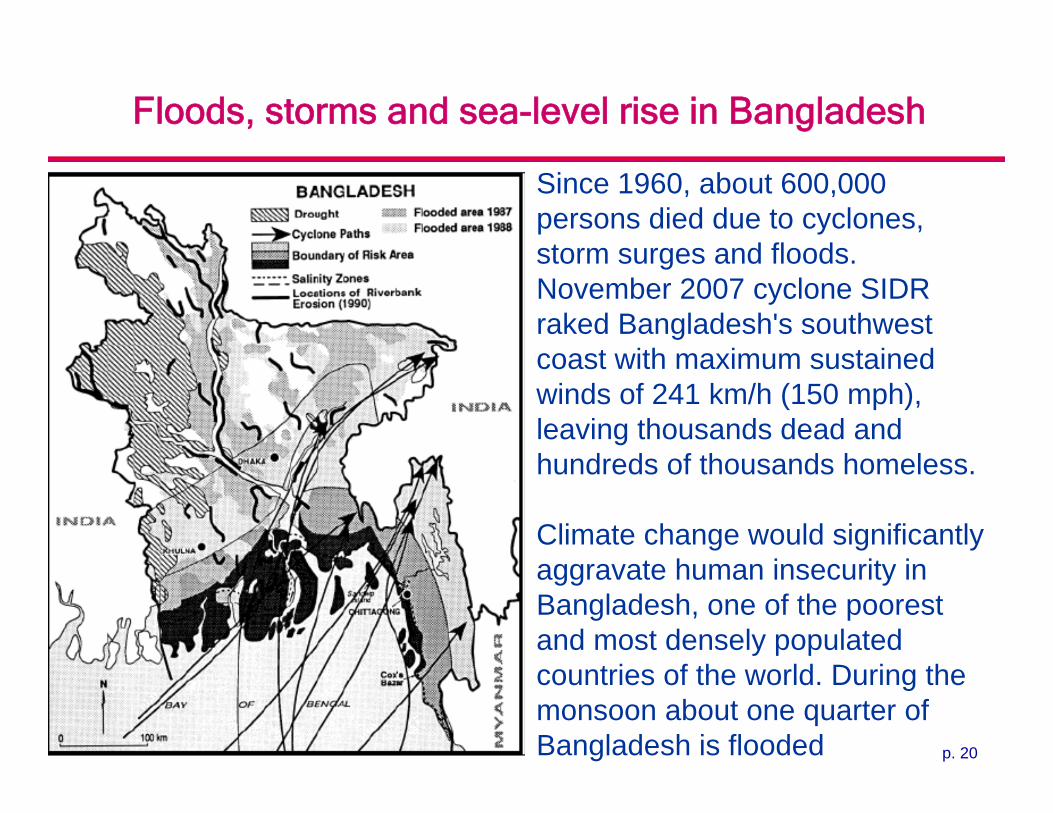
Floods, storms and sea-level rise in Bangladesh
•Source: Broadus 1993: 267
Since 1960, about 600,000 persons died due to cyclones, storm surges and floods.November 2007 cyclone SIDR raked Bangladesh's southwest coast with maximum sustained winds of 241 km/h (150 mph), leaving thousands dead and hundreds of thousands homeless.
Climate change would significantly aggravate human insecurity in Bangladesh, one of the poorest and most densely populated countries of the world. During the monsoon about one quarter of Bangladesh is flooded

p. 21
Bangladesh’s population, floods and migration
Bangladesh’s floods and impacts (1984-2007)
Bangladesh migrants present in various States
The State of Environmental Migration 2011

p. 22
Migration in Bangladesh
Brauch 2006
On several occasions, the migration of impover-ished people has contri-buted to violent clashes within Bangladesh and between emigrating Bangladeshi and tribal people in Northern India (especially in Assam) where several thousand people died.
p. 23
Flooding and migration
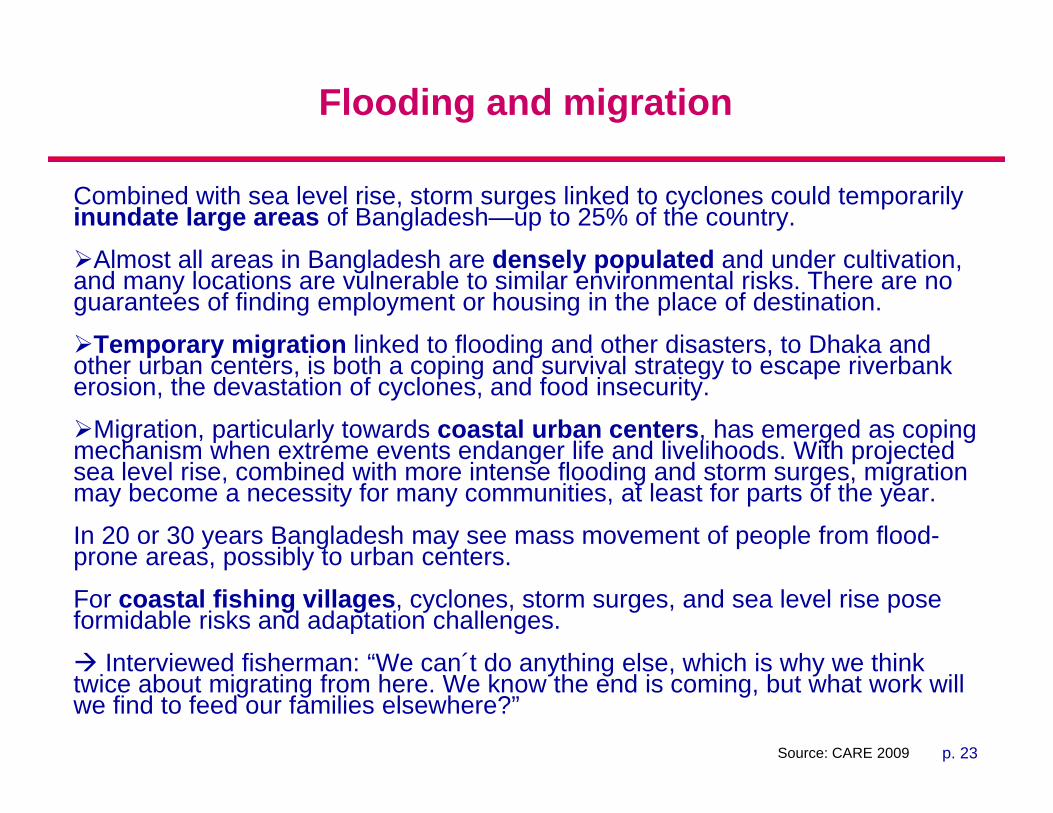
Combined with sea level rise, storm surges linked to cyclones could temporarily inundate large areas of Bangladesh—up to 25% of the country.
Almost all areas in Bangladesh are densely populated and under cultivation, and many locations are vulnerable to similar environmental risks. There are no guarantees of finding employment or housing in the place of destination.
Temporary migration linked to flooding and other disasters, to Dhaka and other urban centers, is both a coping and survival strategy to escape riverbank erosion, the devastation of cyclones, and food insecurity.
Migration, particularly towards coastal urban centers, has emerged as coping mechanism when extreme events endanger life and livelihoods. With projected sea level rise, combined with more intense flooding and storm surges, migration may become a necessity for many communities, at least for parts of the year.
In 20 or 30 years Bangladesh may see mass movement of people from flood-prone areas, possibly to urban centers.
For coastal fishing villages, cyclones, storm surges, and sea level rise pose formidable risks and adaptation challenges.
Interviewed fisherman: “We can´t do anything else, which is why we think twice about migrating from here. We know the end is coming, but what work will we find to feed our families elsewhere?”
Source: CARE 2009

p. 24
Livelihood and migration
Many millions indirectly depend on food and energy generated by the rivers.
Rivers provide direct livelihoods to those employed in irrigated agriculture, small-scale fishing, and aquaculture, and are at the heart of cultural traditions.
In absence of diversification and adaptation/mitigation, agriculture livelihoods will become unsustainable, and people may be forced to leave in response to flow reductions.
Migration will depend on adaptation responses such as dam constructionand more efficient irrigation technologies.
Measures to store water and counter a water crisis could result in further displacement and resettlement.
Most displaced people would move to small to medium sized cities inland, and a smaller number would move to large megacities along coasts or river systems (e.g. Delhi).
Movement from interior to coastal areas will result in larger populations vulnerable to sea level rise, and possibly to extreme floods from upstream regions as the regulating effect of glaciers diminish.
Many South Asia cities lack capacity to absorb significant migration streams.

p. 25
Environmental migration as a conflict issue?
Source: Bhattacharyya/Werz 2012
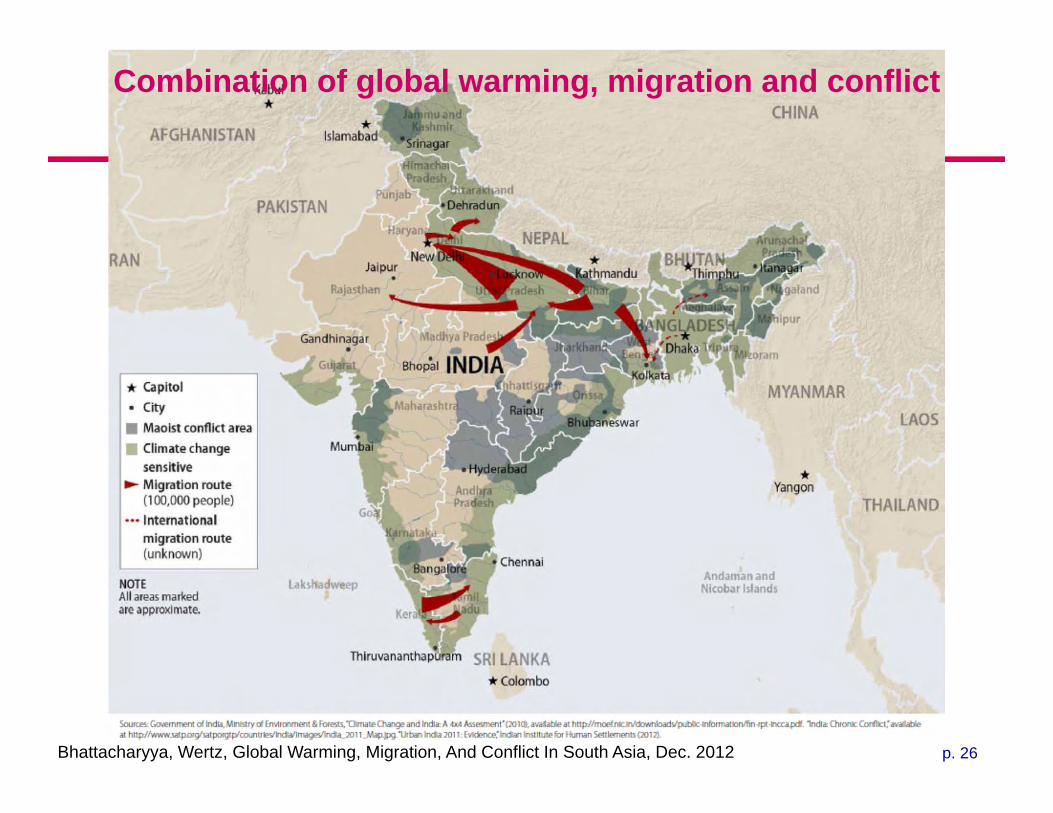
p. 26Bhattacharyya, Wertz, Global Warming, Migration, And Conflict In South Asia, Dec. 2012
Combination of global warming, migration and conflict
p. 27
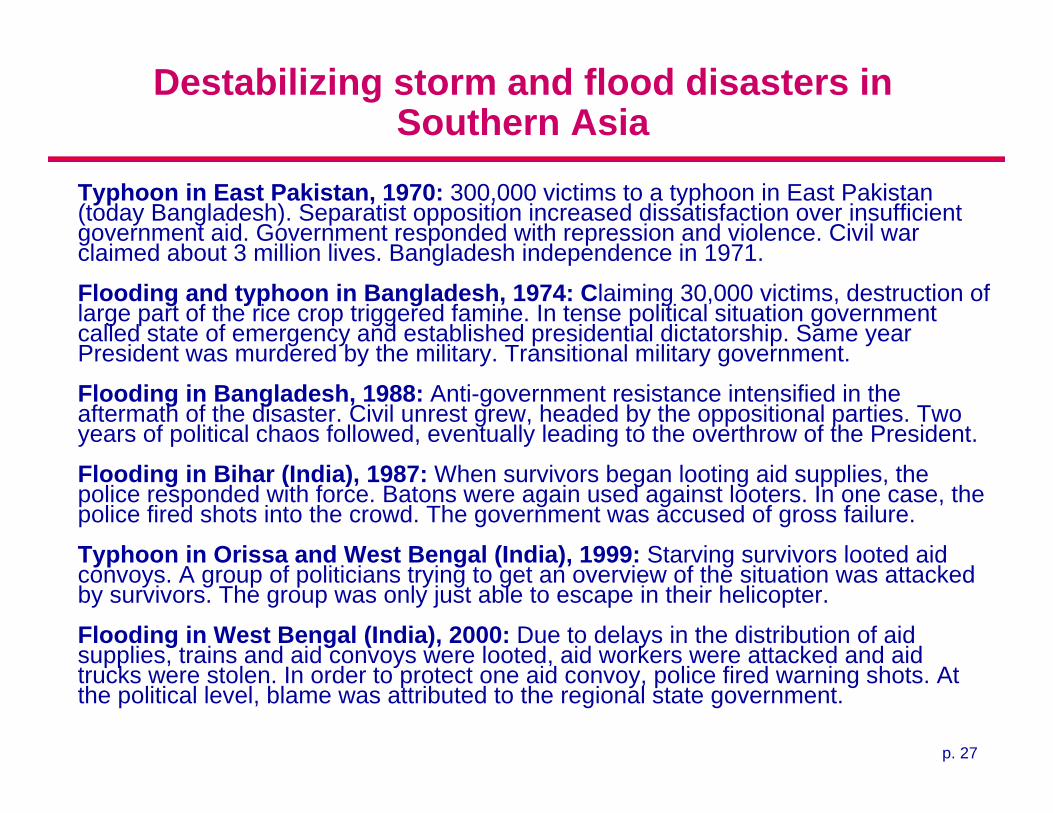
Destabilizing storm and flood disasters in Southern Asia
Typhoon in East Pakistan, 1970: 300,000 victims to a typhoon in East Pakistan (today Bangladesh). Separatist opposition increased dissatisfaction over insufficient government aid. Government responded with repression and violence. Civil war claimed about 3 million lives. Bangladesh independence in 1971.
Flooding and typhoon in Bangladesh, 1974: Claiming 30,000 victims, destruction of large part of the rice crop triggered famine. In tense political situation government called state of emergency and established presidential dictatorship. Same year President was murdered by the military. Transitional military government.
Flooding in Bangladesh, 1988: Anti-government resistance intensified in the aftermath of the disaster. Civil unrest grew, headed by the oppositional parties. Two years of political chaos followed, eventually leading to the overthrow of the President.
Flooding in Bihar (India), 1987: When survivors began looting aid supplies, the police responded with force. Batons were again used against looters. In one case, the police fired shots into the crowd. The government was accused of gross failure.
Typhoon in Orissa and West Bengal (India), 1999: Starving survivors looted aid convoys. A group of politicians trying to get an overview of the situation was attacked by survivors. The group was only just able to escape in their helicopter.
Flooding in West Bengal (India), 2000: Due to delays in the distribution of aid supplies, trains and aid convoys were looted, aid workers were attacked and aid trucks were stolen. In order to protect one aid convoy, police fired warning shots. At the political level, blame was attributed to the regional state government.
p. 28
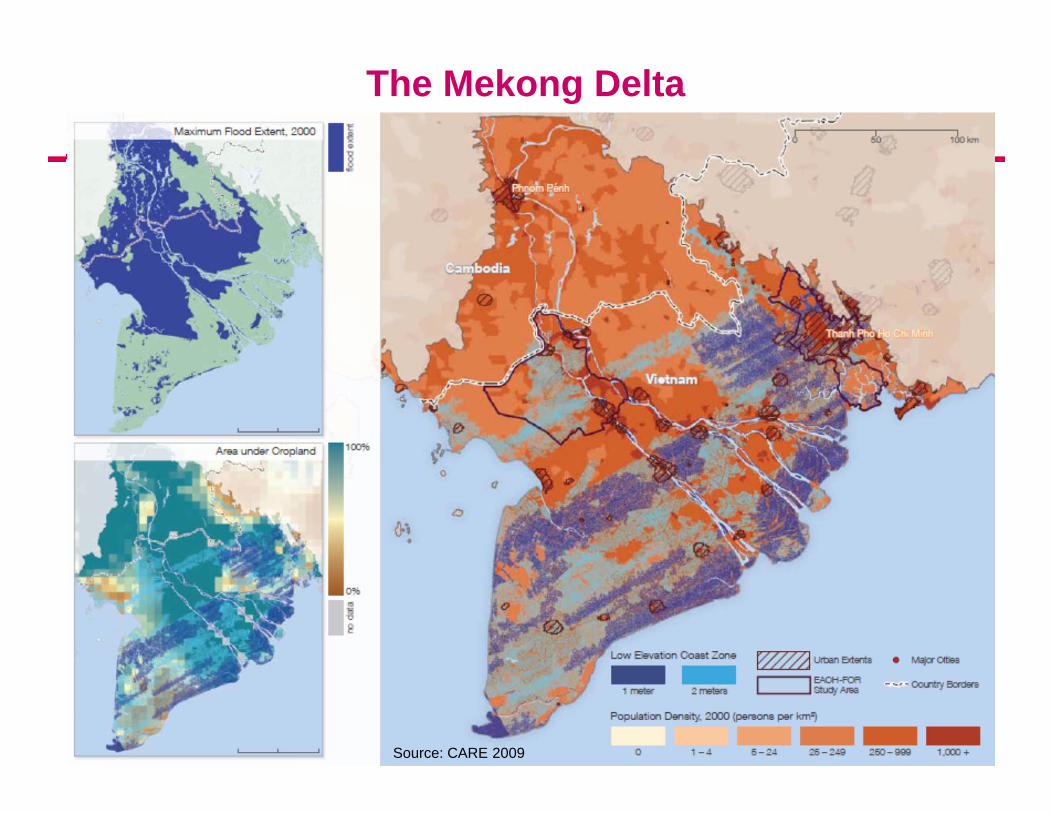
The Mekong Delta
Source: CARE 2009
p. 29
The Mekong Delta: Living with floods and resettlement
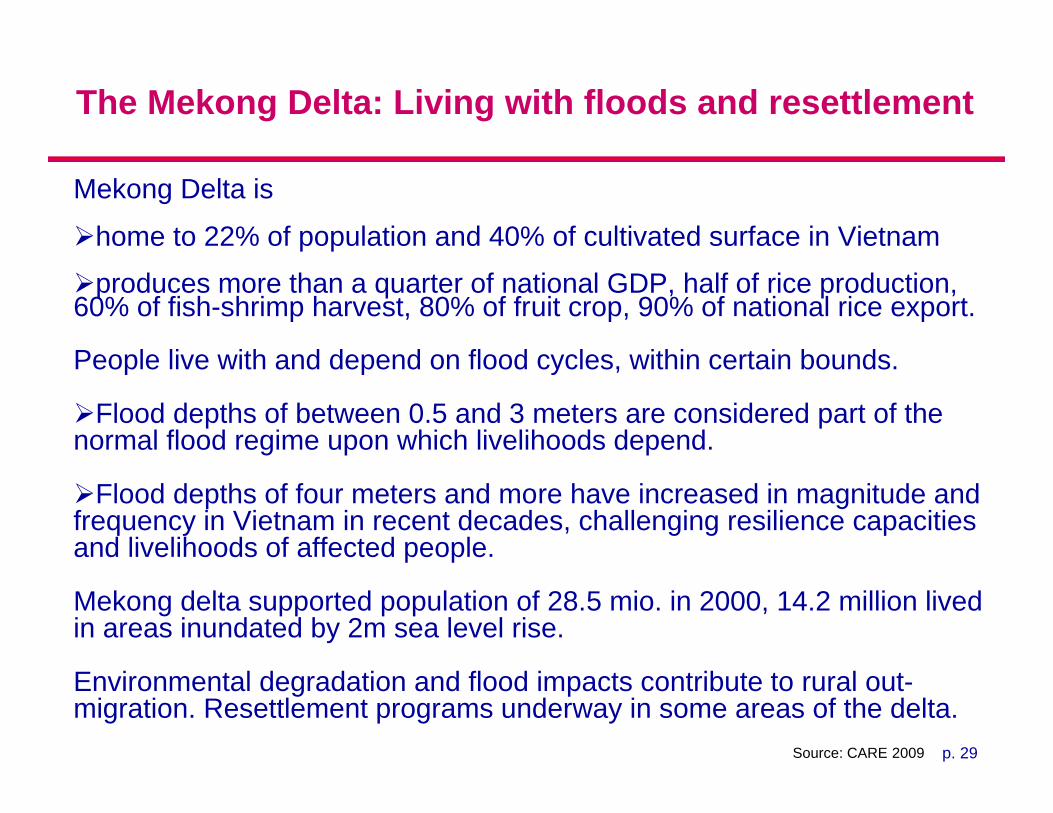
Mekong Delta is
home to 22% of population and 40% of cultivated surface in Vietnam
produces more than a quarter of national GDP, half of rice production, 60% of fish-shrimp harvest, 80% of fruit crop, 90% of national rice export.
People live with and depend on flood cycles, within certain bounds.
Flood depths of between 0.5 and 3 meters are considered part of the normal flood regime upon which livelihoods depend.
Flood depths of four meters and more have increased in magnitude and frequency in Vietnam in recent decades, challenging resilience capacities and livelihoods of affected people.
Mekong delta supported population of 28.5 mio. in 2000, 14.2 million lived in areas inundated by 2m sea level rise.
Environmental degradation and flood impacts contribute to rural out-migration. Resettlement programs underway in some areas of the delta.
Source: CARE 2009
p. 30
Adaptation to climate change
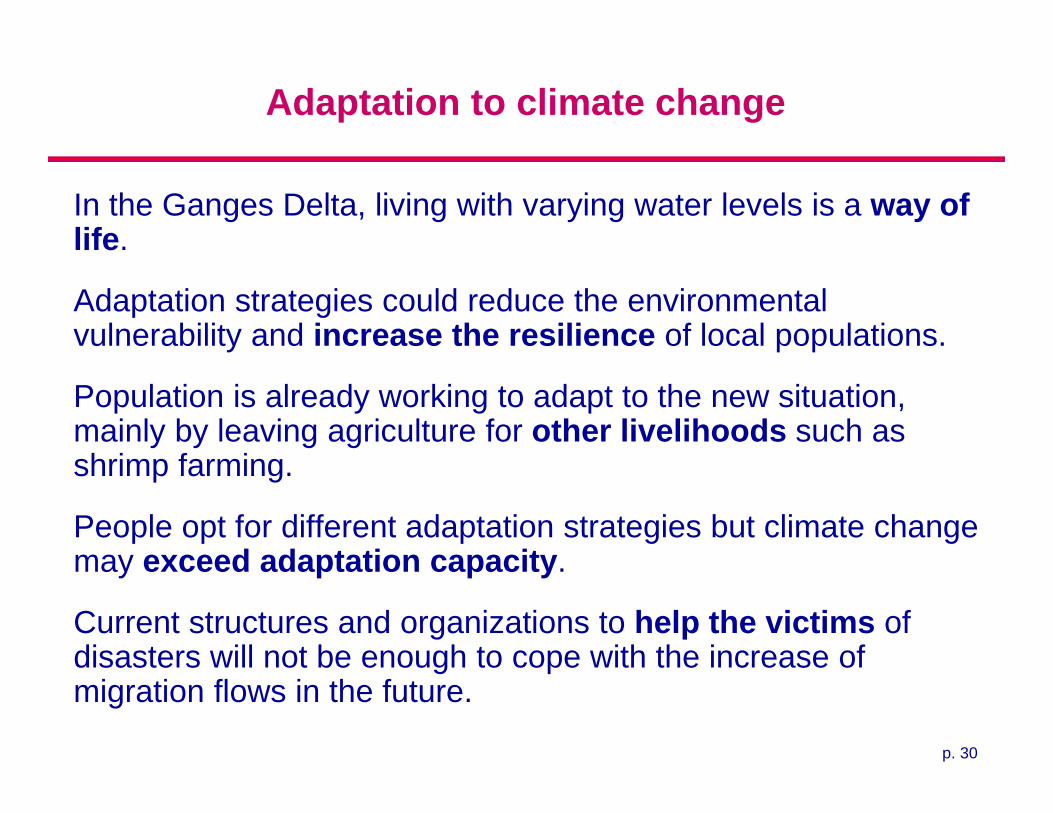
In the Ganges Delta, living with varying water levels is a way of life.
Adaptation strategies could reduce the environmental vulnerability and increase the resilience of local populations.
Population is already working to adapt to the new situation, mainly by leaving agriculture for other livelihoods such as shrimp farming.
People opt for different adaptation strategies but climate change may exceed adaptation capacity.
Current structures and organizations to help the victims of disasters will not be enough to cope with the increase of migration flows in the future.
p. 31
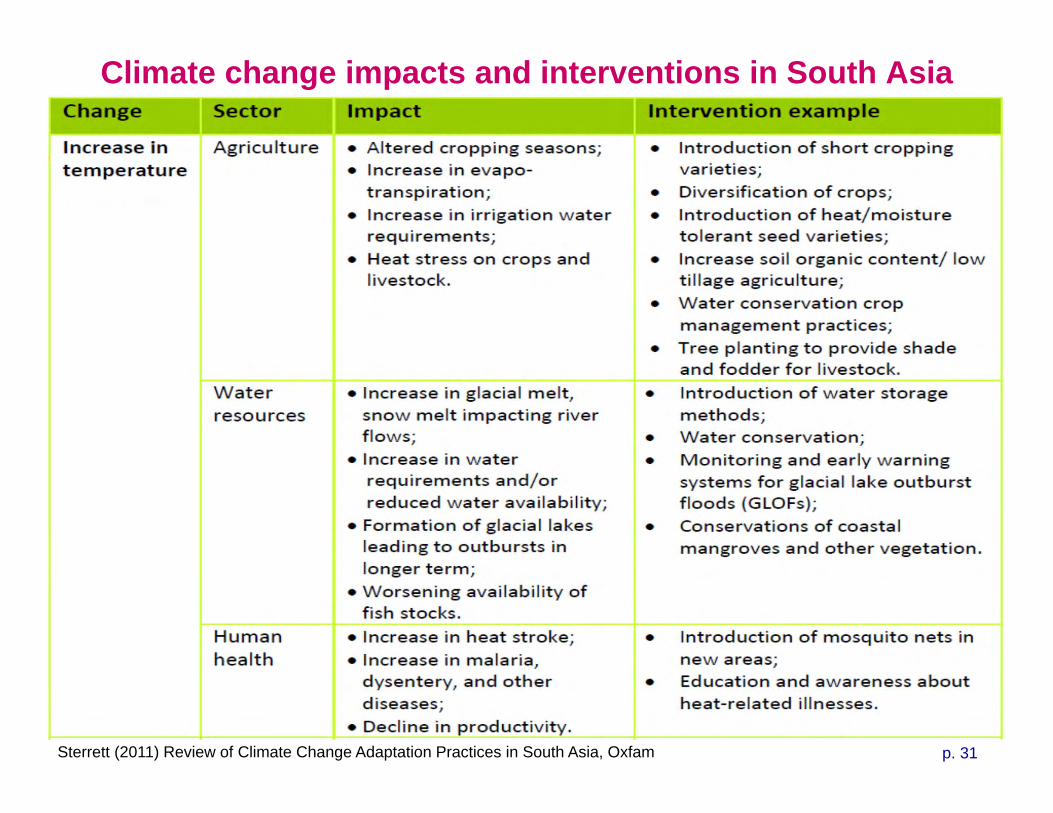
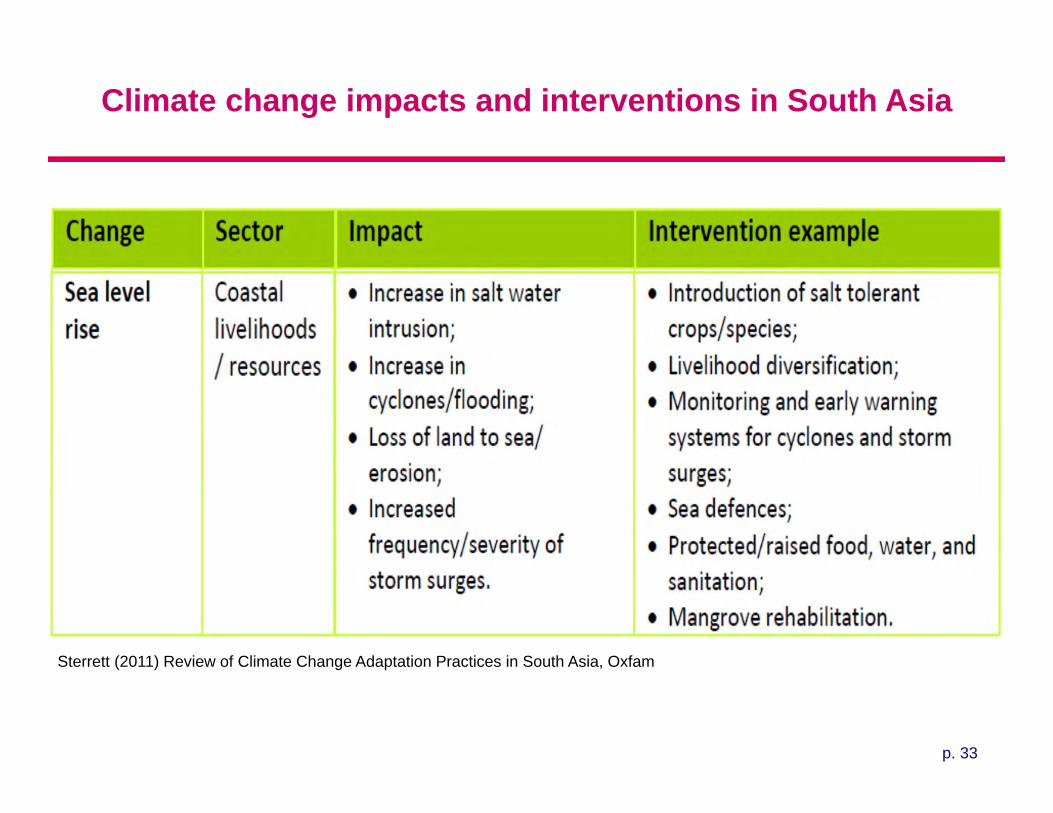
Climate change impacts and interventions in South Asia
Sterrett (2011) Review of Climate Change Adaptation Practices in South Asia, Oxfam
p. 32
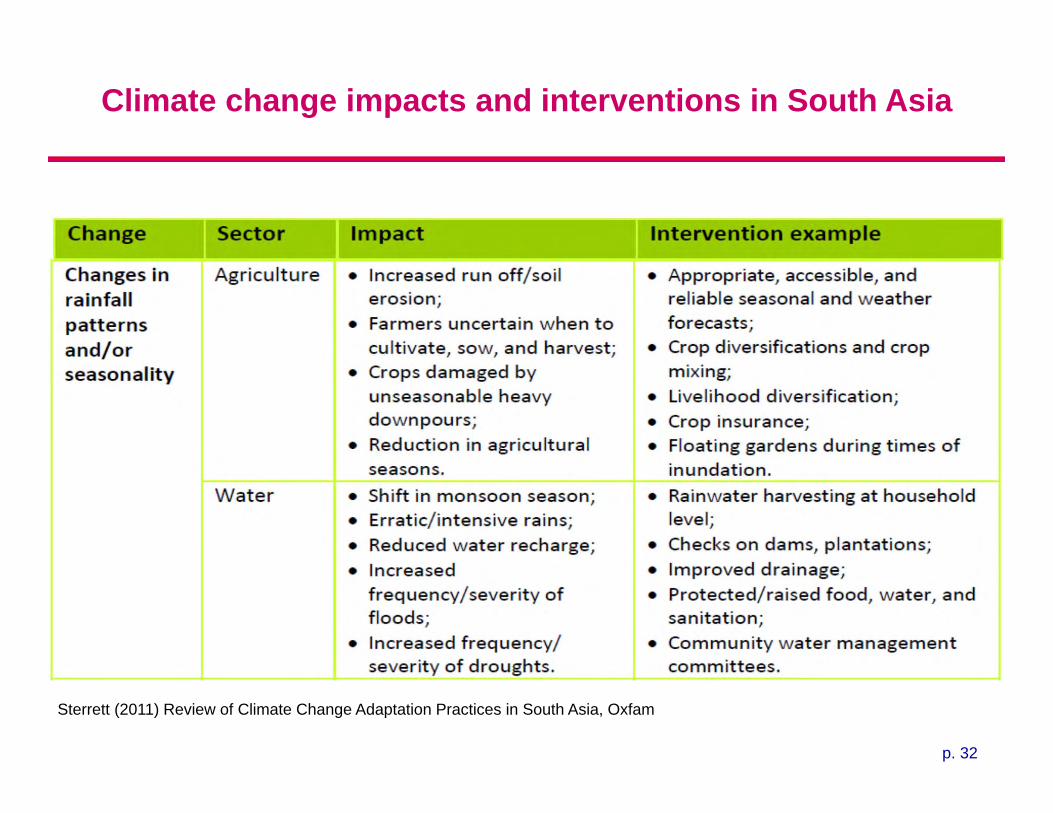
Climate change impacts and interventions in South Asia
Sterrett (2011) Review of Climate Change Adaptation Practices in South Asia, Oxfam
p. 33
Climate change impacts and interventions in South Asia
Sterrett (2011) Review of Climate Change Adaptation Practices in South Asia, Oxfam
p. 34
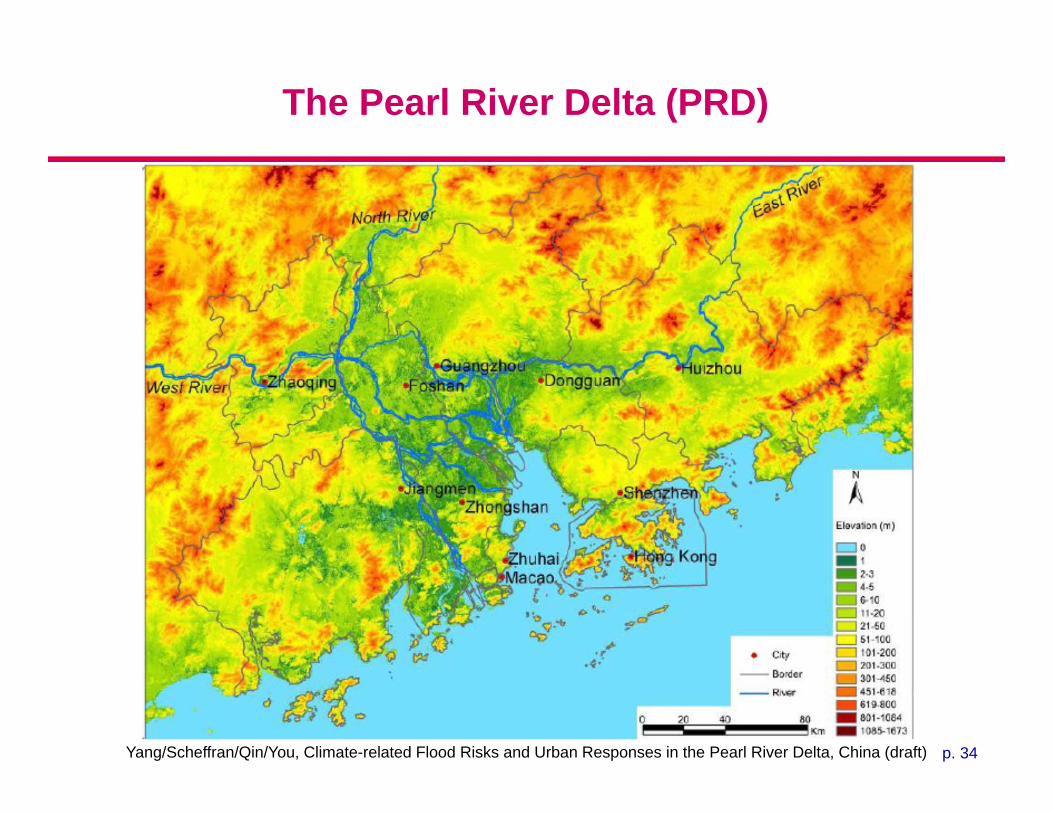
The Pearl River Delta (PRD)
Yang/Scheffran/Qin/You, Climate-related Flood Risks and Urban Responses in the Pearl River Delta, China (draft)
p. 35
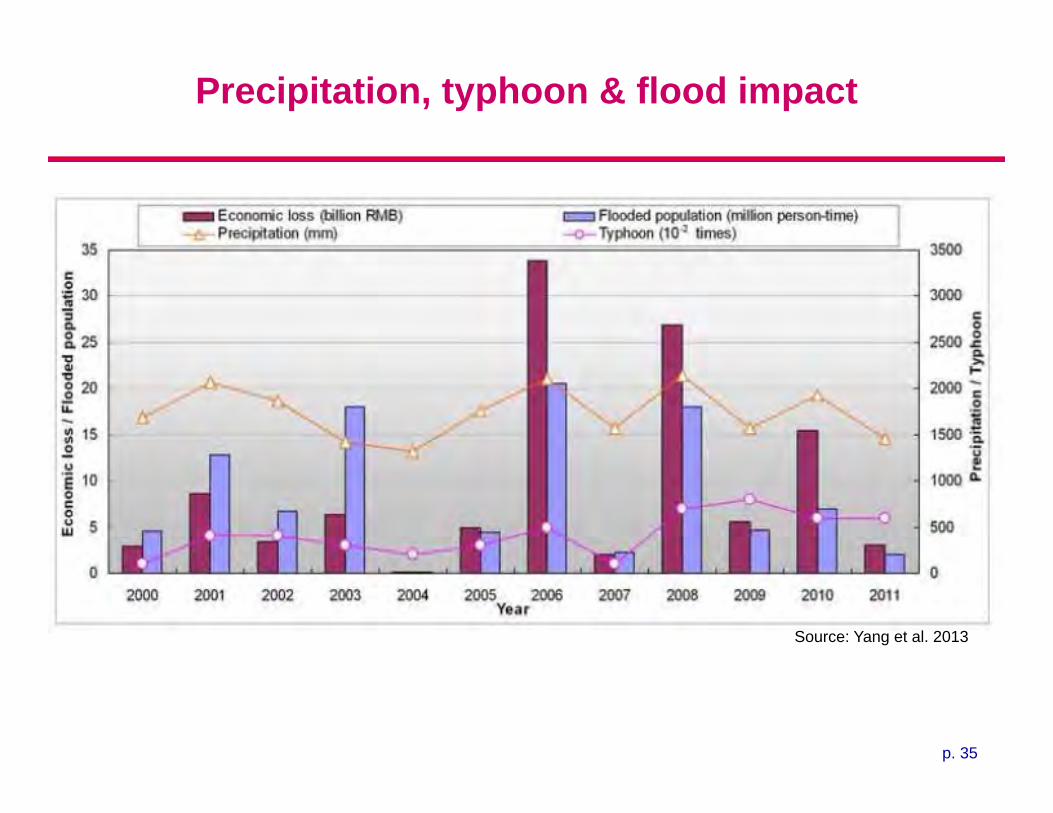
Precipitation, typhoon & flood impact
Source: Yang et al. 2013
p. 36
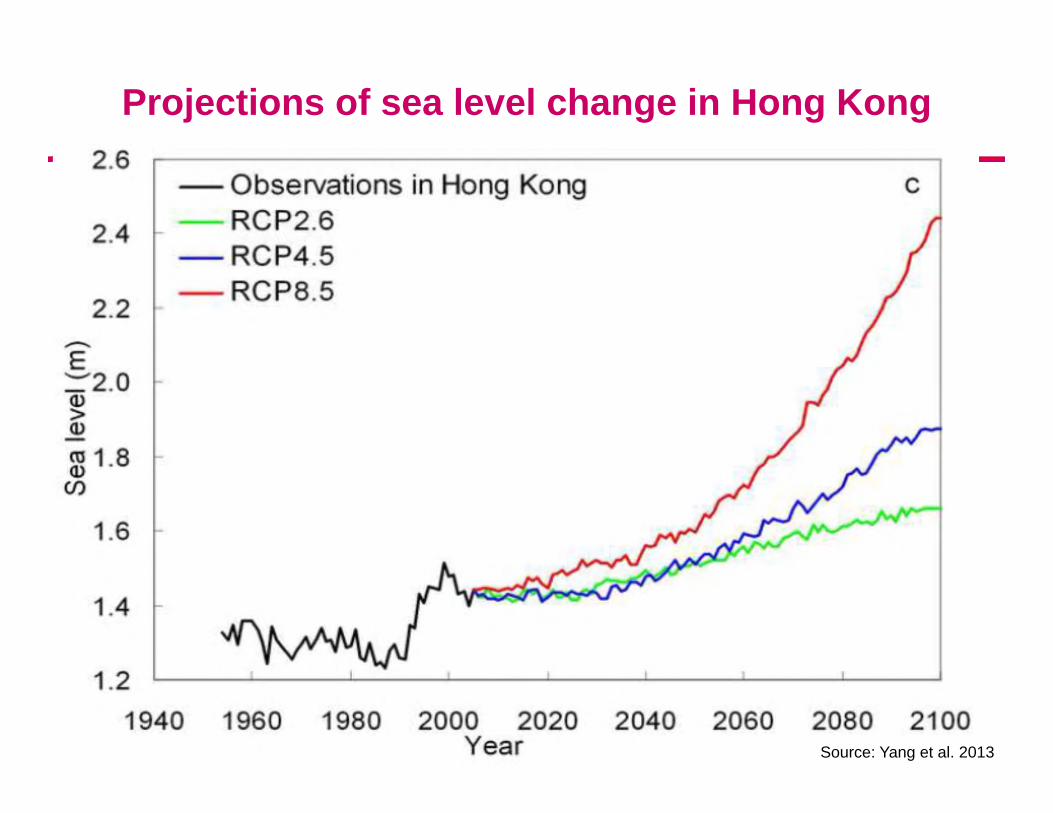
Projections of sea level change in Hong Kong
Source: Yang et al. 2013
p. 37
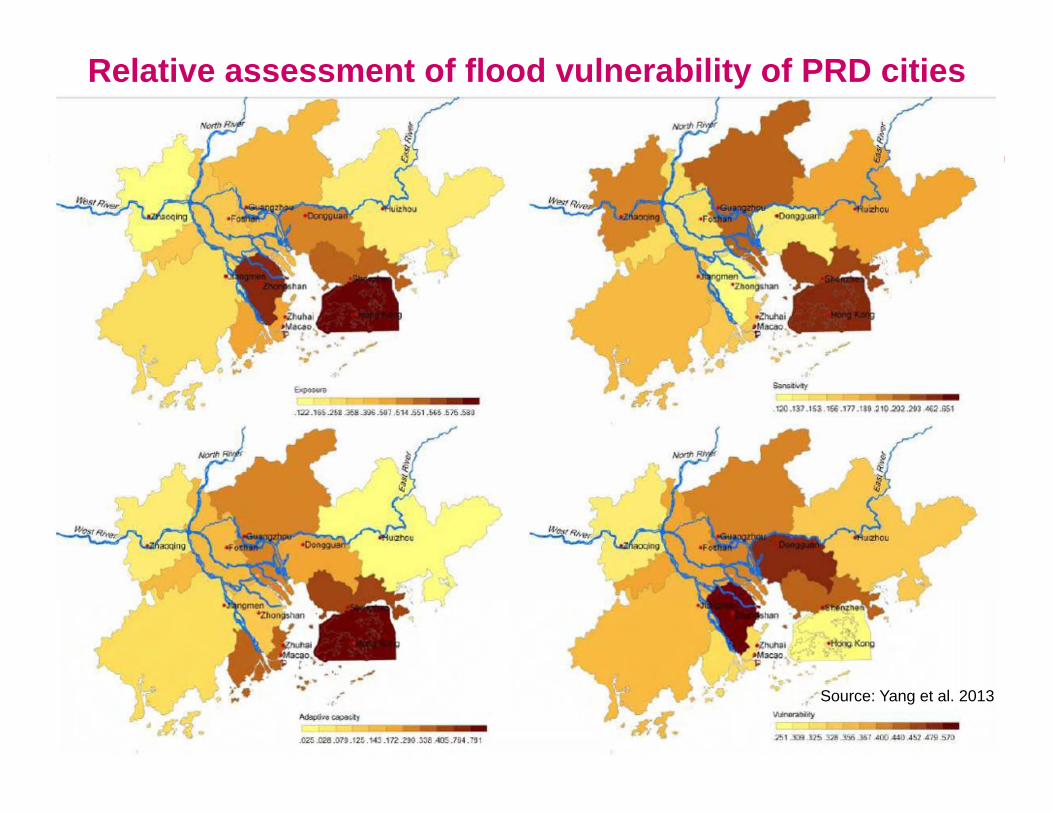
Relative assessment of flood vulnerability of PRD cities
Source: Yang et al. 2013
p. 38
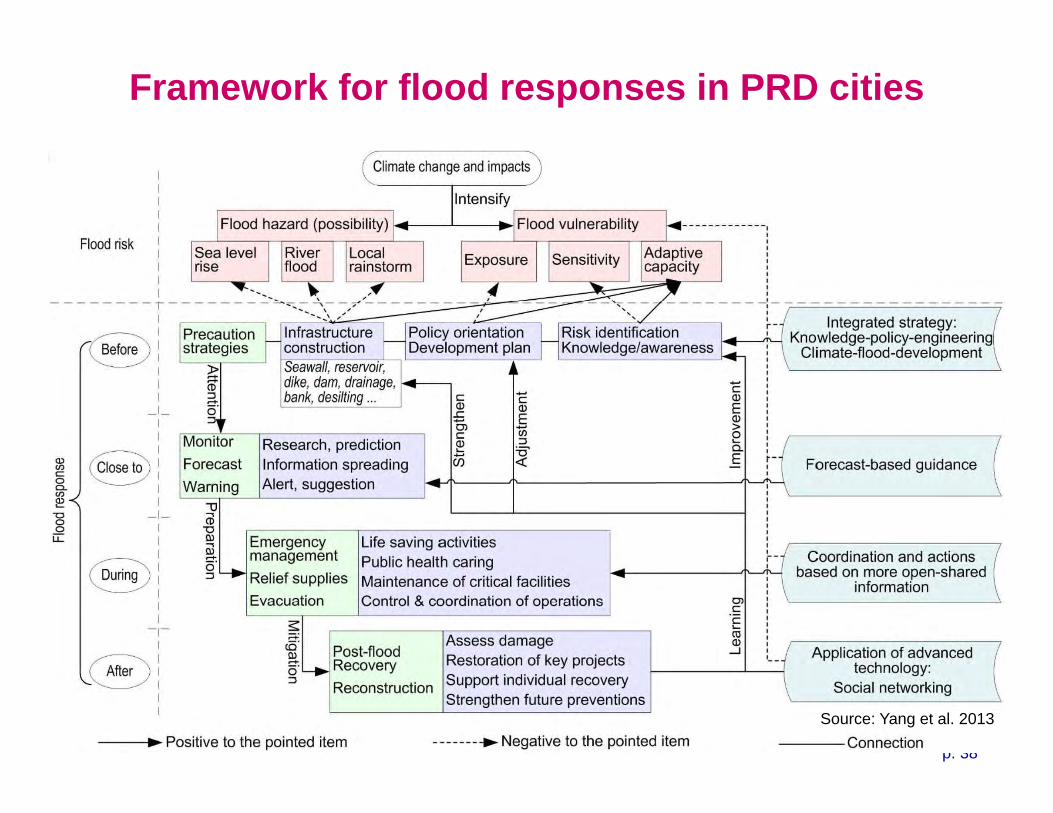
Framework for flood responses in PRD cities
Source: Yang et al. 2013
p. 39
Environmental conflict in Central Asia
Glacial melt water from mountain ranges:Irrigation of more than 3/4 of farmland in Kyrgyzstan, Tajikistan, Turkmenistan, and Uzbekistan uses up to 90% of water.
Hydroelectric power supplies most of the region’s electricity.
IPCC projects sharp temperature rise: By 2050 about 20% of some glaciers may disappear, putting hydroelectric power infrastructure and agriculture at risk
Weak states unable to cope with changes:Largely closed economic marketsExtreme social disparitiesWeak state structuresCorruptionPast struggles over land and waterEthnic disputesSeparatist movementsReligious-fundamentalist groups
p. 40
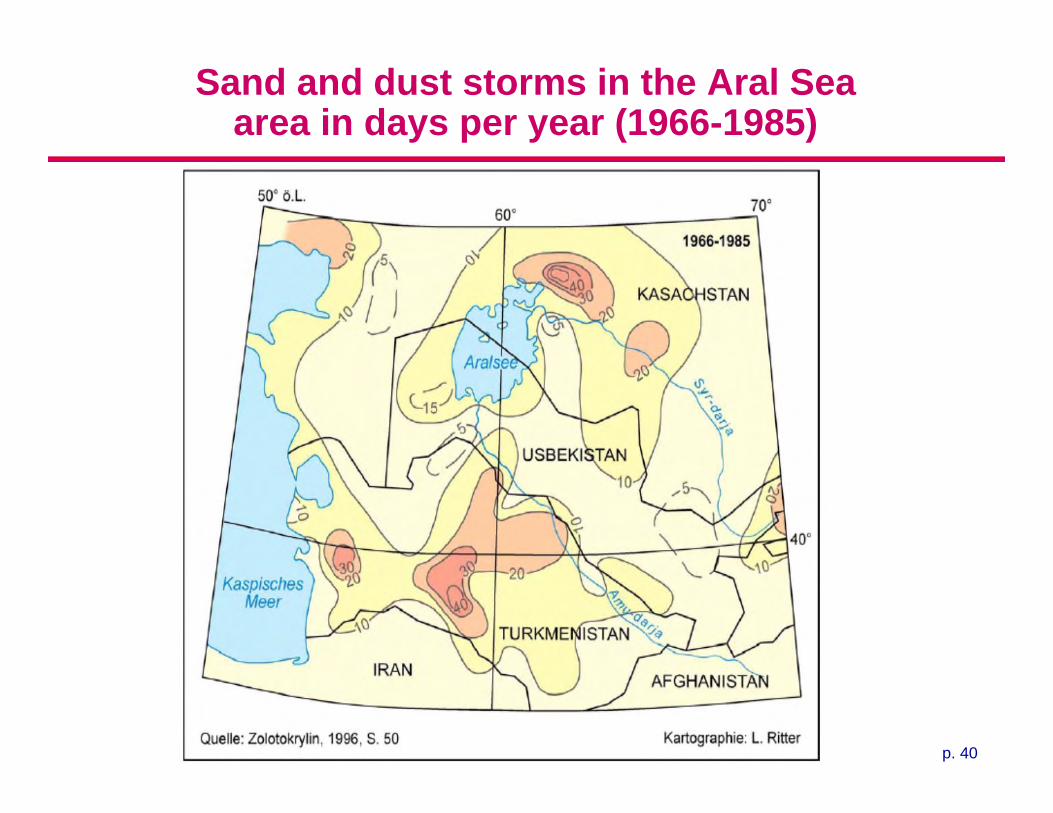
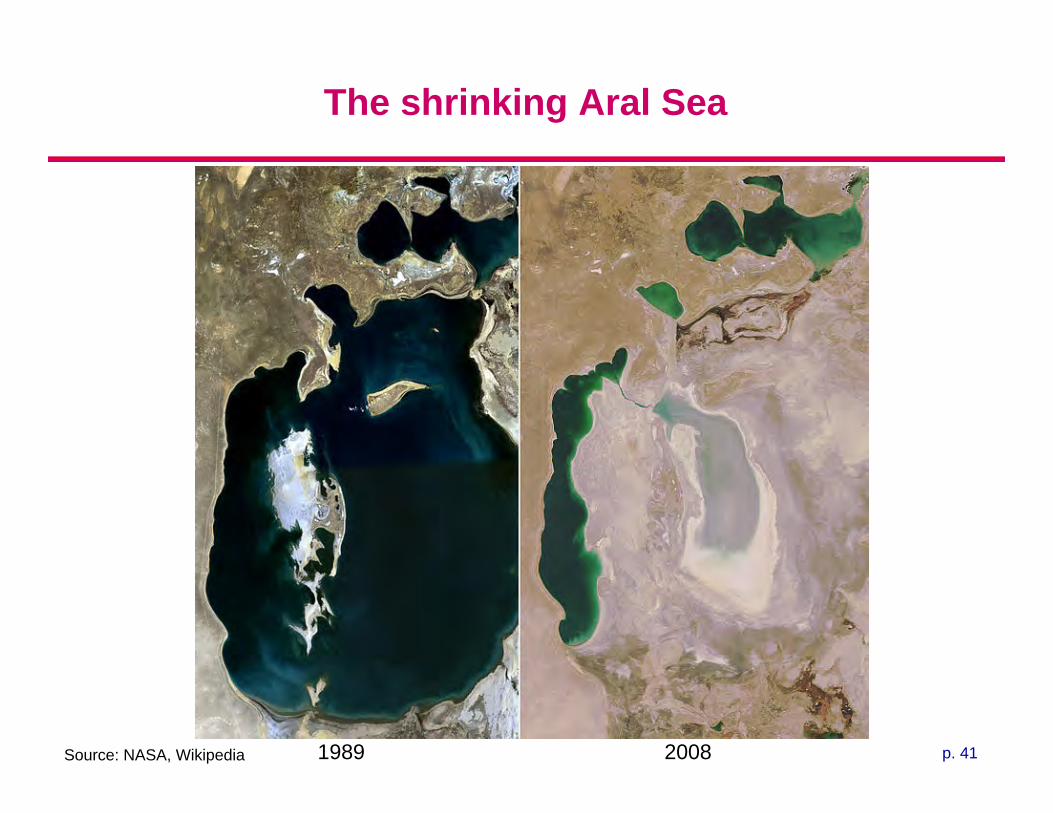
Sand and dust storms in the Aral Sea area in days per year (1966-1985)
p. 41
The shrinking Aral Sea
Source: NASA, Wikipedia 1989 2008
p. 42
Sea level rise and small island states
Small island states particularly vulnerable to sea level rise (IPCC):
“Sea-level rise is expected to exacerbate inundation, storm surges, erosion and other coastal hazards, thus threatening vital infrastructure, settlements and facilities that support the livelihood of island communities. (…)
There is strong evidence that under most climate change scenarios, water resources in small islands are likely to be seriously compromised. (…)
Climate change is likely to heavily impact coral reefs, fisheries and other marine-based resources. (…)
It is very likely that subsistence and commercial agriculture on small islands will be adversely affected by climate change.”
p. 43
Sea level rise and small island states
“Small” Islands (limited space) and isolation (no retreat areas)
Low lying islands face multiple challenges of development, storm surges and cyclones, coastal erosion, and sea level rise.
Territorial integrity and sovereignty is at stake
For some 40 small island developing states, sea level rise could submerge entire parts of sovereign nations.
Resettlement may in the long run be a central adaptation measure.
If entire sovereign states are submerged by rising seas, resettlement poses significant geopolitical questions and highlights the need for effective international cooperation.
p. 44
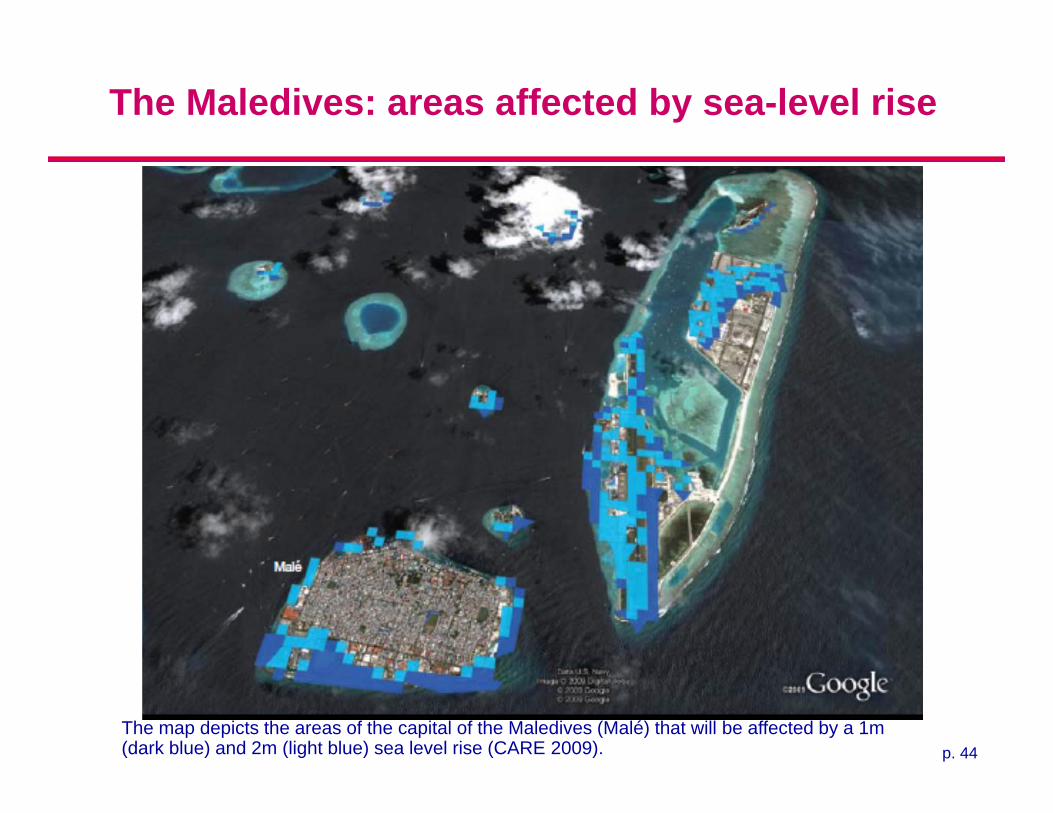
The Maledives: areas affected by sea-level rise
The map depicts the areas of the capital of the Maledives (Malé) that will be affected by a 1m (dark blue) and 2m (light blue) sea level rise (CARE 2009).
p. 45
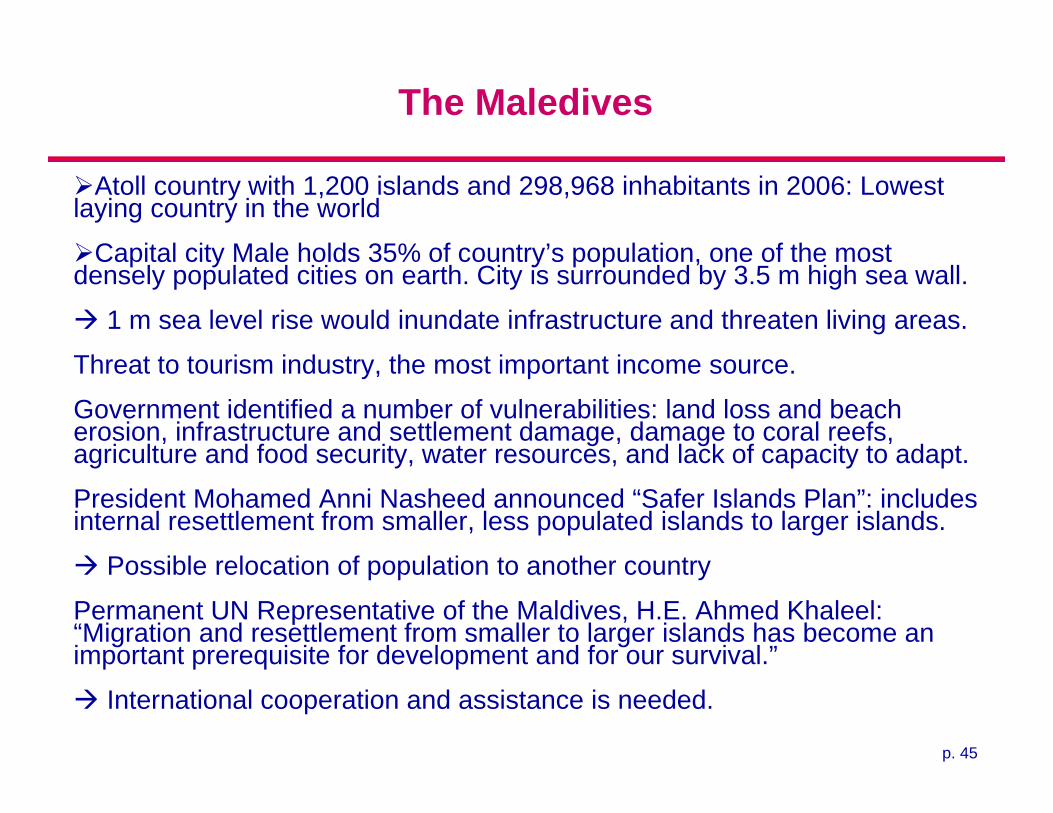
The Maledives
Atoll country with 1,200 islands and 298,968 inhabitants in 2006: Lowest laying country in the world
Capital city Male holds 35% of country’s population, one of the most densely populated cities on earth. City is surrounded by 3.5 m high sea wall.
1 m sea level rise would inundate infrastructure and threaten living areas.
Threat to tourism industry, the most important income source.
Government identified a number of vulnerabilities: land loss and beach erosion, infrastructure and settlement damage, damage to coral reefs, agriculture and food security, water resources, and lack of capacity to adapt.
President Mohamed Anni Nasheed announced “Safer Islands Plan”: includes internal resettlement from smaller, less populated islands to larger islands.
Possible relocation of population to another country
Permanent UN Representative of the Maldives, H.E. Ahmed Khaleel: “Migration and resettlement from smaller to larger islands has become an important prerequisite for development and for our survival.”
International cooperation and assistance is needed.
p. 46
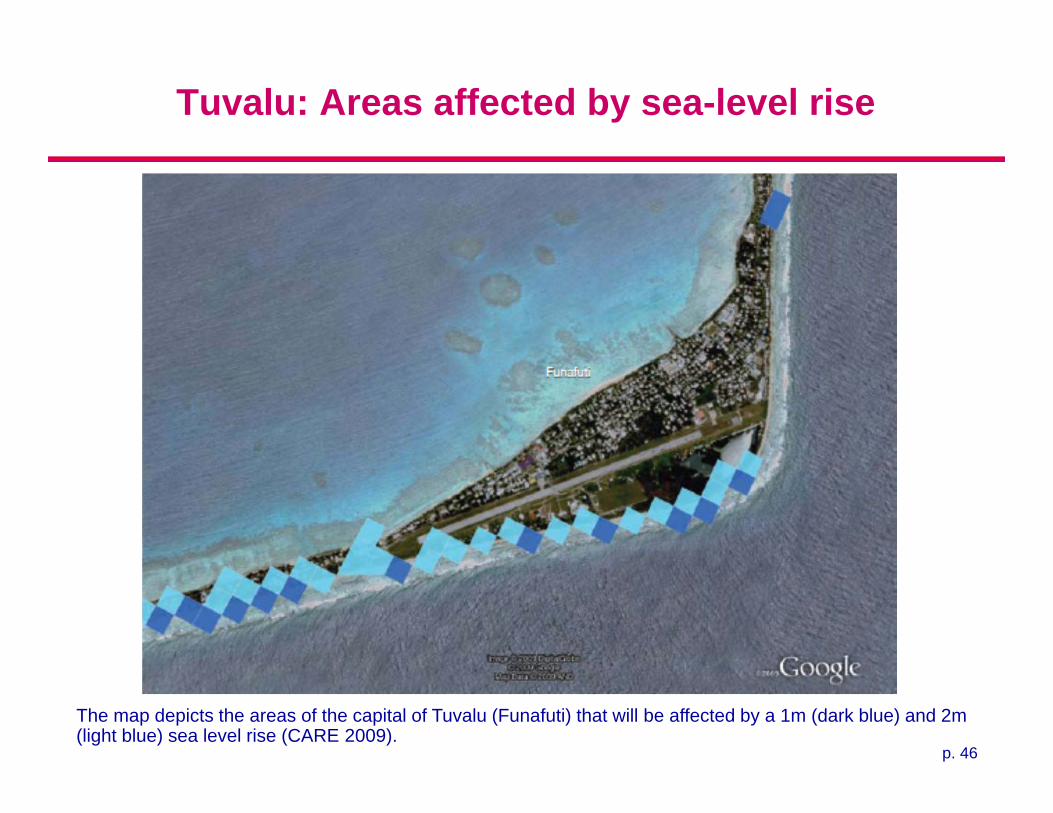
Tuvalu: Areas affected by sea-level rise
The map depicts the areas of the capital of Tuvalu (Funafuti) that will be affected by a 1m (dark blue) and 2m (light blue) sea level rise (CARE 2009).
p. 47
Tuvalu
Among smallest and remote low-lying atoll countries, existence threatened:
Only 26 km2 is dry land with no point more than 5 meters above high tide.
Low elevation makes Tuvalu highly vulnerable to sea-level rise, storm surges, “king tides”, other climatic events which affect the entire population of the country.
Environmental problems are further compounded by water shortage, waste disposal and demographic pressures.
Local knowledge of global warming is variable, but increasingly frequent saltwater flooding, accelerated coastal erosion and worsening agriculture provide day-to-day evidence of a changing environment.
Adaptive capacity is already exceeded with storm surges and king tides.
How long can people live with one meter sea level rise?
Migration patterns: from outer islands to Funafuti, Tuvalu to Fiji and New Zealand. About 3,000 Tuvaluans have migrated to Auckland, New Zealand.
Although media reports have suggested a nation-wide resettlement agreement between New Zealand and Tuvalu, including labor migration agreements, but not explicit policies to accept displaced Pacific Islanders.
Source: CARE 2009
p. 4806.01.2010AUSTRALIA 48
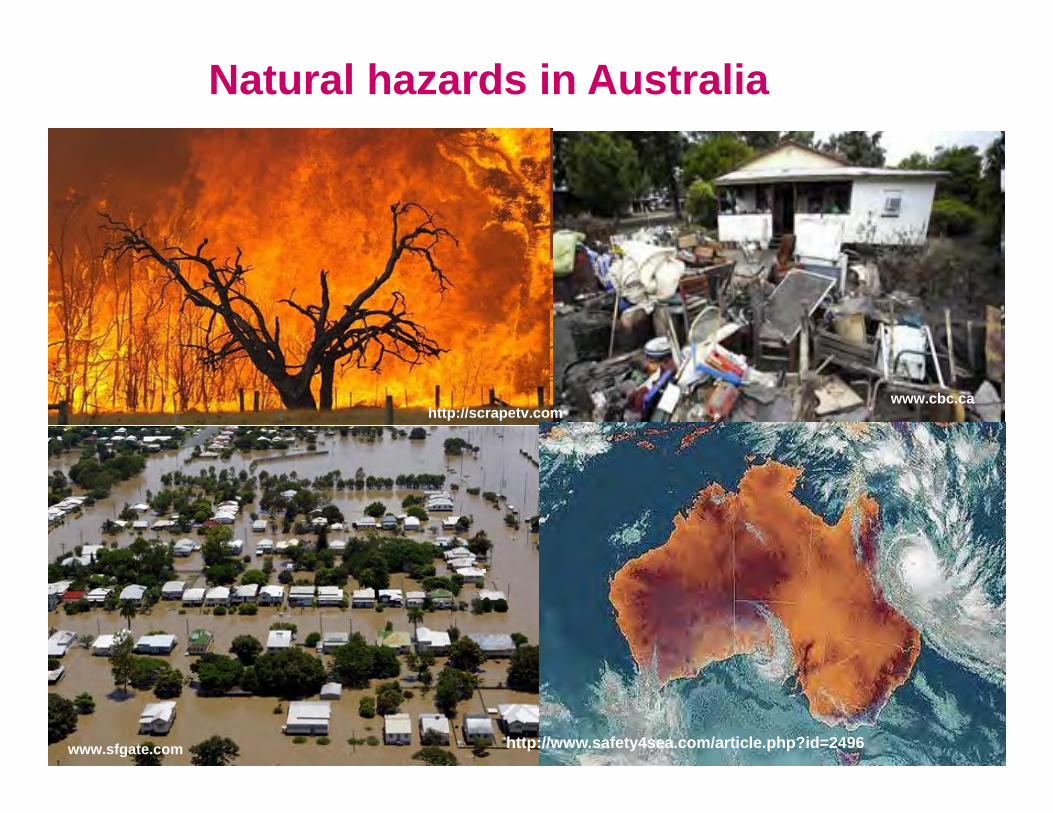
Natural hazards in Australia
www.guardian.co.uk
www.sfgate.com
www.nocere.cowww.ga.gov.com.au
http://scrapetv.com
www.nocere.com
blog.mywonderfulworld.org
www.cbc.ca
http://www.safety4sea.com/article.php?id=2496
p. 49
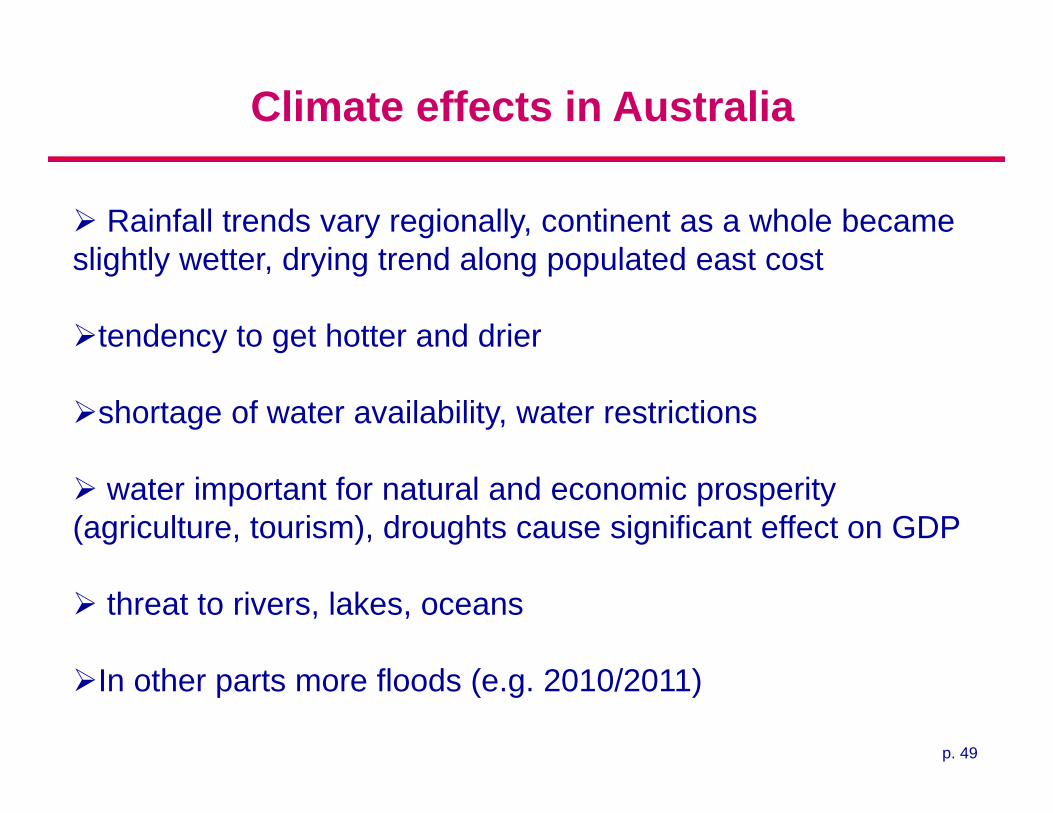
Climate effects in Australia
Rainfall trends vary regionally, continent as a whole became slightly wetter, drying trend along populated east cost
tendency to get hotter and drier
shortage of water availability, water restrictions
water important for natural and economic prosperity (agriculture, tourism), droughts cause significant effect on GDP
threat to rivers, lakes, oceans
In other parts more floods (e.g. 2010/2011)
p. 50
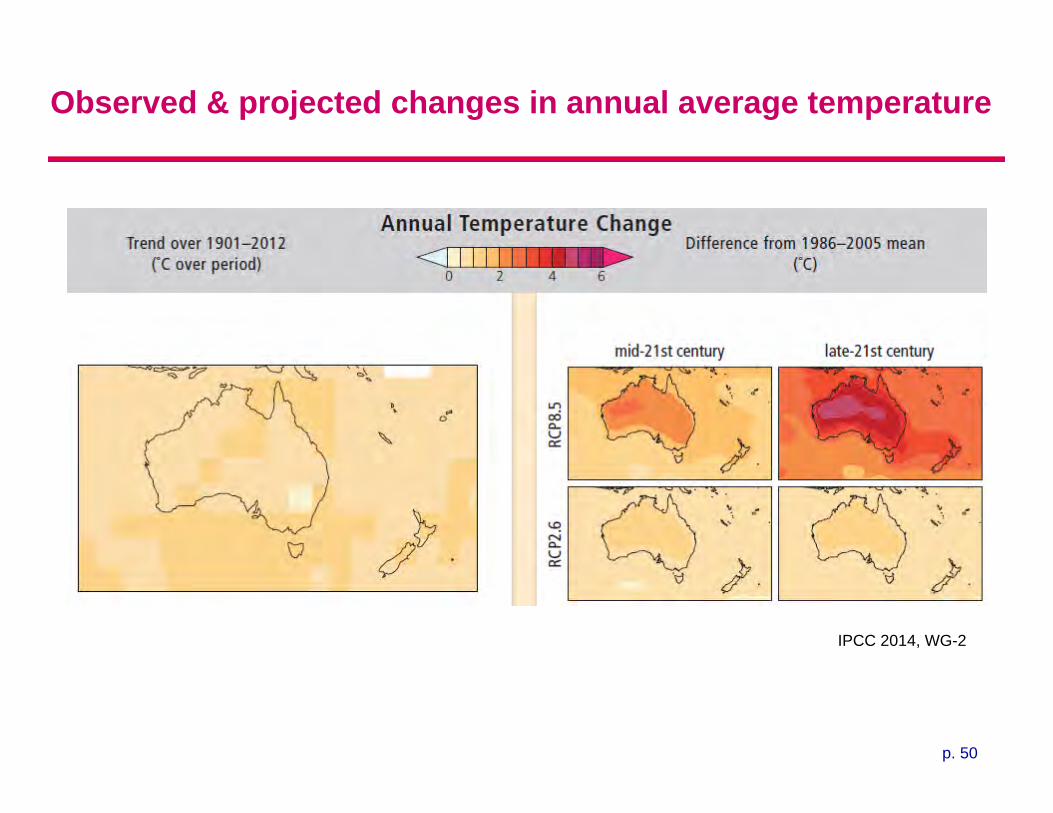
Observed & projected changes in annual average temperature
IPCC 2014, WG-2

p. 51
Observed & projected changes in annual average precipitation
IPCC 2014, WG-2
p. 5206.01.2010
52
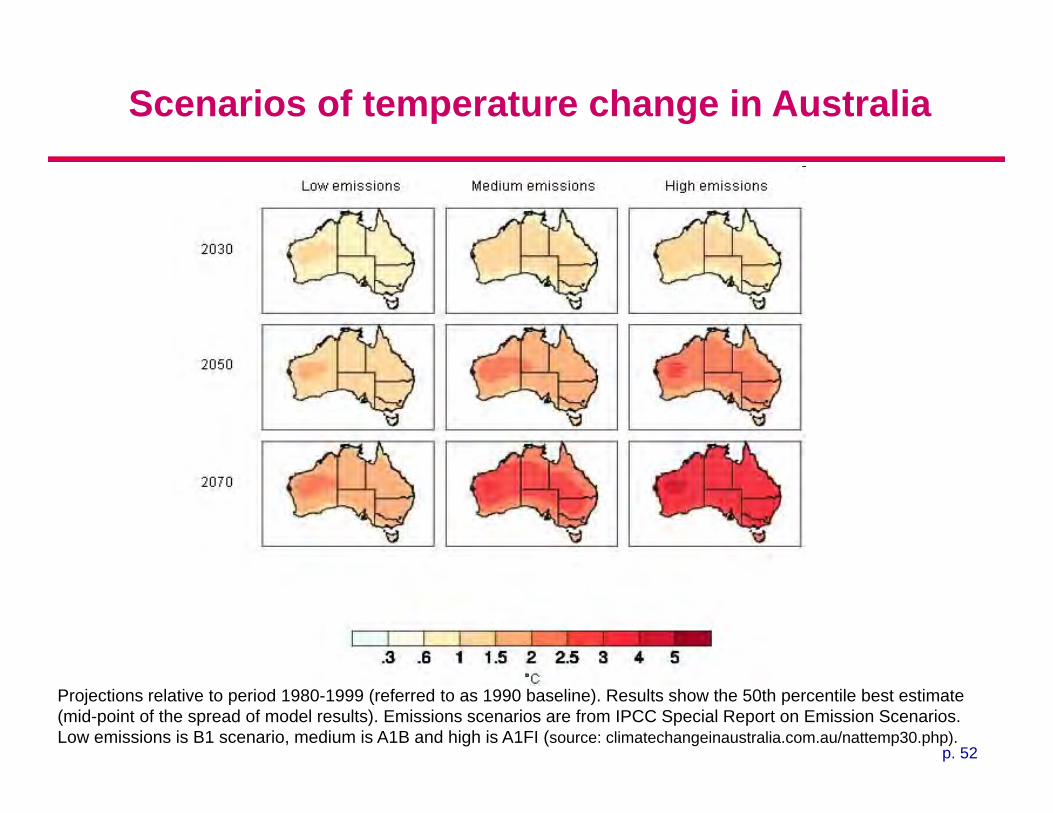
Scenarios of temperature change in Australia
Projections relative to period 1980-1999 (referred to as 1990 baseline). Results show the 50th percentile best estimate (mid-point of the spread of model results). Emissions scenarios are from IPCC Special Report on Emission Scenarios. Low emissions is B1 scenario, medium is A1B and high is A1FI (source: climatechangeinaustralia.com.au/nattemp30.php).
p. 53
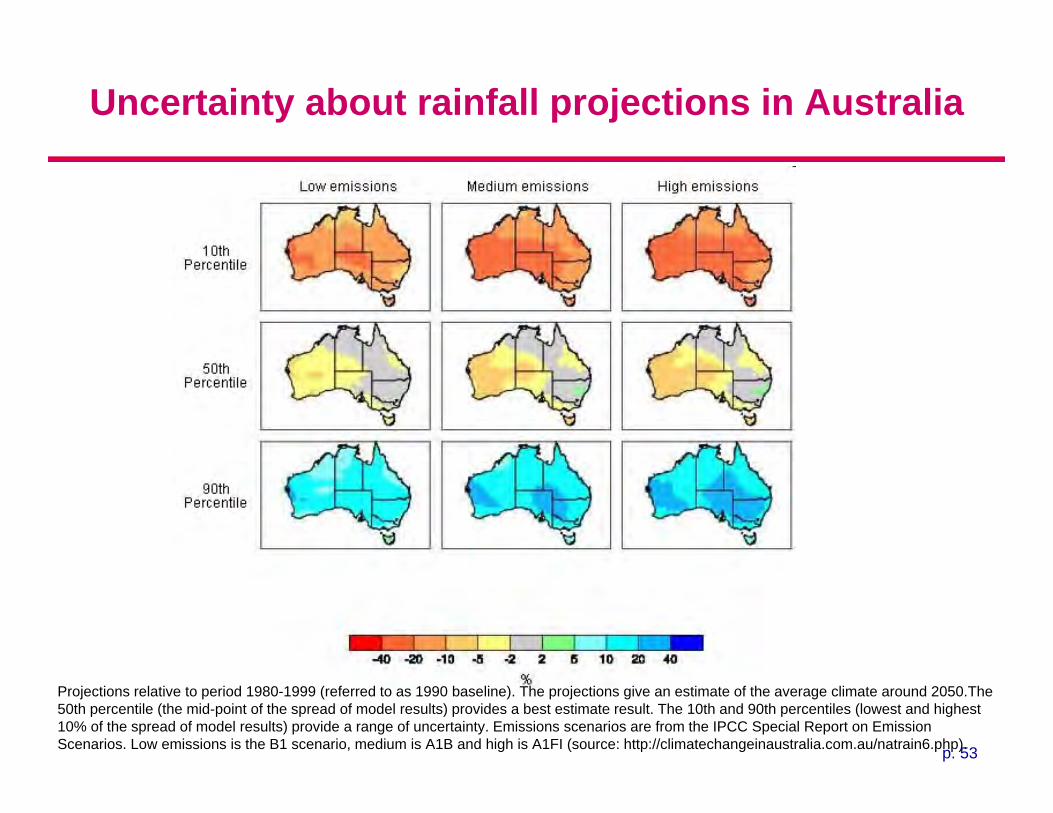
Uncertainty about rainfall projections in Australia
Projections relative to period 1980-1999 (referred to as 1990 baseline). The projections give an estimate of the average climate around 2050.The 50th percentile (the mid-point of the spread of model results) provides a best estimate result. The 10th and 90th percentiles (lowest and highest 10% of the spread of model results) provide a range of uncertainty. Emissions scenarios are from the IPCC Special Report on Emission Scenarios. Low emissions is the B1 scenario, medium is A1B and high is A1FI (source: http://climatechangeinaustralia.com.au/natrain6.php).